Embed Size (px)
Citation preview
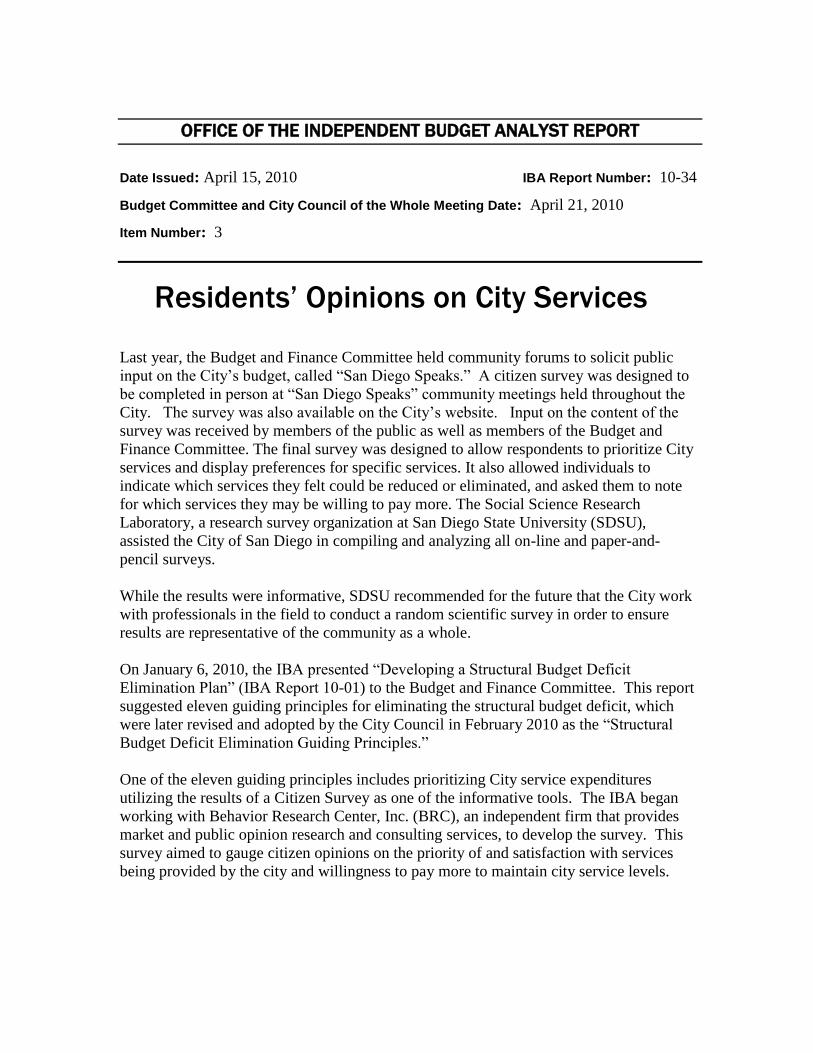
OFFICE OF THE INDEPENDENT BUDGET ANALYST REPORT
Date Issued: April 15, 2010 IBA Report Number: 10-34
Budget Committee and City Council of the Whole Meeting Date: April 21, 2010
Item Number: 3
Residents’ Opinions on City Services Last year, the Budget and Finance Committee held community forums to solicit public
input on the City’s budget, called “San Diego Speaks.” A citizen survey was designed to
be completed in person at “San Diego Speaks” community meetings held throughout the
City. The survey was also available on the City’s website. Input on the content of the
survey was received by members of the public as well as members of the Budget and
Finance Committee. The final survey was designed to allow respondents to prioritize City
services and display preferences for specific services. It also allowed individuals to
indicate which services they felt could be reduced or eliminated, and asked them to note
for which services they may be willing to pay more. The Social Science Research
Laboratory, a research survey organization at San Diego State University (SDSU),
assisted the City of San Diego in compiling and analyzing all on-line and paper-and-
pencil surveys.
While the results were informative, SDSU recommended for the future that the City work
with professionals in the field to conduct a random scientific survey in order to ensure
results are representative of the community as a whole.
On January 6, 2010, the IBA presented “Developing a Structural Budget Deficit
Elimination Plan” (IBA Report 10-01) to the Budget and Finance Committee. This report
suggested eleven guiding principles for eliminating the structural budget deficit, which
were later revised and adopted by the City Council in February 2010 as the “Structural
Budget Deficit Elimination Guiding Principles.”
One of the eleven guiding principles includes prioritizing City service expenditures
utilizing the results of a Citizen Survey as one of the informative tools. The IBA began
working with Behavior Research Center, Inc. (BRC), an independent firm that provides
market and public opinion research and consulting services, to develop the survey. This
survey aimed to gauge citizen opinions on the priority of and satisfaction with services
being provided by the city and willingness to pay more to maintain city service levels.
2
To carry out this survey, the IBA was able to utilize $24,000 in funding previously
budgeted in the Mayor’s Business Office budget since 2008 specifically for this purpose.
During the month of January 2010, the IBA solicited feedback on a draft survey
instrument from the Budget and Finance Committee and the Citizen’s Revenue Review
and Economic Competitiveness Commission (CRRECC). CRRECC was created by the
City Council in October 2009 to research strategies and provide the City Council
recommendations to help address the city’s fiscal situation. One of its four Council
charges is to “receive findings from a city-wide survey on optimum city service levels
desired by the public, and make recommendations to the Mayor and Council for their
review and consideration.” After compiling the comments from both meetings the IBA
consulted with Behavior Research Center, Inc. (BRC) regarding suggested revisions.
After the survey was finalized, BRC began the data collection phase on February 24,
2010. This phase included contacting a scientifically random sample of 600 residents by
telephone. Data collection was completed in six weeks.
Attached to this report are the survey results prepared by BRC. The IBA will present a
PowerPoint prepared by BRC of various charts to illustrate the results. This report and
PowerPoint will be presented to the Budget Committee and City Council of the Whole on
April 21, 2010 as well as the CRRECC on April 22, 2010.
Input from our residents on service priorities and service levels can be valuable in
assisting City leaders in framing policy choices and making difficult decisions. For
example, when reviewing results of the question asking whether citizens approve or
disapprove of various strategies to deal with the current budget deficit, respondents
strongly approved of using more private contractors and implementing managed
competition, while they strongly disapproved of eliminating or further reducing City
services. Such feedback can be informative when making important policy decisions and
when trying to develop strategies to solve the budget deficit. Furthermore, the survey and
its results can serve as a baseline for the future. Comparing results over time can provide
valuable information on changes in service priorities as well as satisfaction levels among
various City services.
[SIGNED] [SIGNED]
______________________ ________________________
Elaine DuVal APPROVED: Andrea Tevlin
Fiscal and Policy Analyst Independent Budget Analyst
__[SIGNED]___________
Brittany Coppage
Research Analyst
Attachment: City of San Diego Residents’ Opinions on City Services Report

CITY OF SAN DIEGO
RESIDENTS’ OPINIONS ON CITY SERVICES
April 2010
Prepared for City of San Diego
Prepared by Behavior Research Center, Inc.
45 East Monterey Way Phoenix, Arizona 85012
(602) 258-4554
Attachment

2010003\RPT San Diego Community Attitude.doc
TABLE OF CONTENTS
Page
INTRODUCTION 1 OVERVIEW OF THE FINDINGS 2 DETAIL OF THE FINDINGS 15 EVALUATION OF CITY IN SELECTED AREAS 15 ATTITUDE ABOUT HOW ESSENTIAL SELECTED CITY SERVICES ARE 17 SATISFACTION WITH CITY SERVICES 18 CITY SPENDING PRIORITIES 20 REACTION TO SELECT STRATEGIES TO DEAL WITH BUDGET DEFICIT 23 SAN DIEGO AS A PLACE TO LIVE 26 QUALITY OF LIFE IN SAN DIEGO 27 LIKELIHOOD OF RECOMMENDING SAN DIEGO/REMAINING IN SAN DIEGO 28 MOST SERIOUS ISSUE FACING RESIDENTS 29 ATTITUDES ABOUT SAFETY IN SAN DIEGO 30 SOURCES OF INFORMATION 31 APPENDIX 32 METHODOLOGY 32 SURVEY QUESTIONNAIRE 35

2010003\RPT San Diego Community Attitude.doc
LIST OF TABLES
TABLE 1: EVALUATION OF CITY IN SELECTED AREAS 16 TABLE 2: ATTITUDE ABOUT HOW ESSENTIAL SELECTED CITY SERVICES ARE 17 TABLE 3: SATISFACTION WITH CITY SERVICES 19 TABLE 4: WILLINGNESS TO PAY MORE TO MAINTAIN CITY SERVICES 20 TABLE 5: PRIORITY SPENDING INDEX 22 TABLE 6: REACTION TO SELECT STRATEGIES TO DEAL WITH BUDGET DEFICIT 23 TABLE 7: REACTION TO SELECTED STRATEGIES TO DEAL WITH BUDGET DEFICIT – DETAIL 24 TABLE 8: OTHER SUGGESTIONS TO REDUCE DEFICIT 25 TABLE 9: SAN DIEGO AS A PLACE TO LIVE 26 TABLE 10: QUALITY OF LIFE IN SAN DIEGO 27 TABLE 11: LIKELIHOOD OF TAKING SELECTED STEPS 28 TABLE 12: MOST SERIOUS ISSUE FACING RESIDENTS 29 TABLE 13: ATTITUDES ABOUT SAFETY IN SAN DIEGO 30 TABLE 14: SOURCES OF INFORMATION 31

1 2010003\RPT San Diego Community Attitude.doc
INTRODUCTION
This study was commissioned by the City of San Diego, California. The primary purpose of this effort was to measure how residents prioritize City services and solutions to the City’s budget challenges. More specifically, this study addressed the following issues:
• Evaluation of City in selected areas
• Attitude about how essential selected City services are
• Satisfaction with City services
• City spending priority
• Reaction to select strategies to deal with budget deficit
• San Diego as a place to live
• Quality of life in San Diego
• Likelihood of recommending San Diego/remaining in San Diego
• Most serious issue facing residents
• Attitudes about safety in San Diego
• Sources of information
The information contained in this report is based on a scientific random sample of 600 San Diego heads of household. All of the interviewing on this project was conducted via telephone by professional interviewers of the Behavior Research Center during March 2010. For a detailed explanation of the procedures followed during this project, please refer to the Methodology section of this report. The information generated from this study is presented in three sections in this report. The first section, OVERVIEW, presents the primary findings of the survey in a brief summary format. The second section, SUMMARY OF THE FINDINGS, reviews each study question in detail. The final section, APPENDIX, details the study methodology and contains a copy of the survey questionnaire. The Behavior Research Center has presented the data germane to the basic research objectives of this project. However, if City elected officials or management staff requires additional data retrieval or interpretation, we stand ready to provide such input. BEHAVIOR RESEARCH CENTER, INC.

2 2010003\RPT San Diego Community Attitude.doc
OVERVIEW OF THE FINDINGS
• EVALUATION OF CITY IN SELECTED AREAS (TABLE 1) San Diego residents were asked to evaluate the City in four specific areas: – Job City Does Delivering to Residents. A slight majority of residents (51%) offer a positive
evaluation on the job the City does delivering services with six percent offering an excellent rating and 45 percent a good rating. Thirty-six percent offer a fair rating and ten percent a poor rating. These figures are relatively consistent across population subgroups.
– Value of Services You Receive for Taxes You Pay. Less than a majority of residents (47%)
give the City a positive reading for the value of the services they receive for the taxes they pay (6% excellent, 41% good), while 34 percent offer a fair rating. The positive readings tend to increase with age and are higher among whites (53%) than minorities (37%).
– Overall Direction City is Taking. Nearly equal volumes of residents offer positive (32%) and
negative (27%) ratings regarding the overall direction the City is taking. An additional third of residents (35%) offer only a fair rating.
– Job City Does Listening to Citizens. Only 28 percent of residents offer a positive rating on
the job the City does listening to residents, while 25 percent offer a negative rating and 40 percent a fair rating. These readings are consistent across population subgroups.
51%
36%
10%
47%
34%
18%
32% 35%
27% 28%
40%
25%
Job City Does Value of Services Overall Direction Job City Does
0%
20%
40%
60%
80%
100%
Excellent/Good Fair Poor
EVALUATION OF CITY IN SELECTED AREAS
City is Taking
2010.003 C-1
You Receive forTaxes You Pay
Listening toCitizens
Delivering Servicesto Residents

3 2010003\RPT San Diego Community Attitude.doc
• ATTITUDE ABOUT HOW ESSENTIAL SELECTED CITY SERVICES ARE (TABLE 2)
When San Diego residents are asked to indicate how essential they feel each of 17 City services are on a scale of one (not essential) to four (absolutely essential), five of the services receive “absolutely essential” readings from a majority of residents with mean readings of 3.3 or more: 1) fire services (83%, 3.8); 2) police services (78%, 3.7); 3) emergency medial services (76%, 3.7); 4) residential trash collection services (62%, 3.5); 5) fire prevention programs (52%, 3.3).
Those services which receive the lowest readings are: 1) neighborhood code enforcement (23%, 2.7); 2) art and cultural programs (23%, 2.8) and; 3) graffiti removal (24%, 2.8).
2.7
2.8
2.8
2.8
3.0
3.1
3.2
3.2
3.2
3.3
3.3
3.3
3.3
3.5
3.7
3.7
3.8
Neighborhood code enforcement
Art and cultural programs
Graffiti removal
Existing main library downtown
Homeless services
Parks and recreation programs
Branch libraries
Street and sidewalk maintenance
Maintenance of beaches and parks
Residential recycling services
Lifeguard service at the beaches
Pollution prevention in oceans and bays
Fire prevention programs
Residential trash collection services
Emergency medical services
Police services
Fire services
1.0 1.5 2.0 2.5 3.0 3.5 4.0
SELECTED CITY SERVICES AREATTITUDE ABOUT HOW ESSENTIAL
201.003 C-2
(Mean 1-4 Scale: 1 = Not Essential, 4 = Absolutely Essential)

4 2010003\RPT San Diego Community Attitude.doc
• SATISFACTION WITH CITY SERVICES (TABLE 3) San Diego residents were asked to reveal their level of satisfaction with each of 25 services provided by the City using a four-point scale (very dissatisfied -- very satisfied). Receiving the highest satisfaction readings from residents are seven categories with ratings of 3.00 or higher: – Trash collection services (3.25) – Fire response to calls for service (3.18) – Recycling collection services (3.15) – Beach lifeguard service (3.09) – Parking availability in your neighborhood (3.03) – Programs at branch libraries (3.01) – Maintenance of parks and its facilities (3.00)
3.00
3.01
3.03
3.09
3.15
3.18
3.25
Maintenance of parks and its facilities
Programs at branch libraries
Parking availability in your neighborhood
Beach lifeguard service
Recycling collection services
Fire response to calls for service
Trash collection services
1.00 2.00 3.00 4.00
TOP RATEDSATISFACTION WITH CITY SERVICES --
201.003 C-3
(Mean 1-4 Scale: 1 = Very Dissatisfied, 4 = Very Satisfied)

5 2010003\RPT San Diego Community Attitude.doc
Also receiving positive ratings between 2.81 and 2.99 are 15 additional City services: – Police response to calls for service (2.99) – Programs at recreational centers (2.97) – Programs at existing main library downtown (2.96) – Cleanliness of beaches (2.96) – Arts and cultural programs (2.95) – Service hours at existing main library downtown (2.94) – Tree maintenance on public property (2.93) – Recreation center service hours (2.92) – Frequency of street sweeping (2.92) – Efforts to eliminate graffiti (2.92) – Branch library service hours (2.86) – Flood control efforts (2.86) – Parking enforcement efforts (2.86) – Street lighting (2.83) – Conditions of neighborhood sidewalks (2.81)
The final three City services studied receive low ratings under 2.50: – Efforts to address homelessness (2.45) – Condition of City streets (2.28) – Downtown parking availability (2.18)
2.18
2.28
2.45
2.81
2.83
2.86
2.86
2.86
2.92
2.92
2.92
2.93
2.94
2.95
2.96
2.96
2.97
2.99
Downtown parking availability
Condition of city streets
Efforts to address homelessness
Condition of neighborhood sidewalks
Street lighting
Parking enforcement efforts
Flood control efforts
Branch library service hours
Efforts to eliminate graffiti
Frequency of street sweeping
Recreation center service hours
Tree maintenance on public property
Service hours at existing main library downtown
Arts and cultural programs
Cleanliness of beaches
Programs at existing main library downtown
Programs at recreational centers
Police response to calls for service
1.00 2.00 3.00 4.00
OTHER SERVICESSATISFACTION WITH CITY SERVICES --
201.003 C-3a
(Mean 1-4 Scale: 1 = Very Dissatisfied, 4 = Very Satisfied)

6 2010003\RPT San Diego Community Attitude.doc
• CITY SPENDING PRIORITIES (TABLES 4-5)
After residents had evaluated each of the 25 service areas under consideration, they were asked to indicate whether they would or would not be willing to pay more for them through taxes or fees in order to maintain them or avoid further cuts. This information was then correlated with the service satisfaction ratings to create a Priority Spending Index which affords higher spending priority to those services that receive lower satisfaction ratings. This line of inquiry reveals nine service areas which receive Priority Spending Index readings of 150.0 or more:
– Condition of City streets (263.2) – Cleanliness of beaches (165.5) – Police response to calls for service (227.4) – Street lighting (159.0) – Fire response to calls for service (220.1) – Beach lifeguard service (158.6)
– Efforts to address homelessness (200.0) – Recycling collection services (152.4) – Maintenance of parks and its facilities (183.3)
Note: Index calculated by dividing willingness to pay more for a service by mean rating of service
152.4
158.6
159.0
165.5
183.3
200.0
220.1
227.4
263.2
Recycling collection services
Beach lifeguard service
Street lighting
Cleanliness of beaches
Maintenance of parks and its facilities
Efforts to address homelessness
Fire response to calls for service
Police response to calls for service
Condition of city streets
0.0 50.0 100.0 150.0 200.0 250.0 300.0
TOP PRIORITIESPRIORITY SPENDING INDEX --
201.003 C-4

7 2010003\RPT San Diego Community Attitude.doc
Each of the remaining services receives an Index reading below 150.0 with five services receiving readings under 100.0:
– Service hours at existing main library downtown (85.0) – Programs at existing main library downtown (84.4) – Frequency of street sweeping (78.8) – Parking enforcement efforts (73.4) – Parking availability in your neighborhood (69.3)
69.3
73.4
78.8
84.4
85.0
105.8
119.9
119.9
126.2
128.4
128.8
129.4
139.9
141.5
148.1
149.5
Parking availability in your neighborhood
Parking enforcement efforts
Frequency of street sweeping
Programs at existing main library downtown
Service hours at existing main library downtown
Tree maintenance on public property
Efforts to eliminate graffiti
Recreation center service hours
Programs at branch libraries
Downtown parking availability
Arts and cultural programs
Branch library service hours
Flood control efforts
Trash collection services
Programs at recreational centers
Condition of neighborhood sidewalks
0.0 50.0 100.0 150.0 200.0 250.0 300.0
OTHER PRIORITIESPRIORITY SPENDING INDEX --
201.003 C-4a

8 2010003\RPT San Diego Community Attitude.doc
• REACTION TO SELECT STRATEGIES TO DEAL WITH BUDGET DEFICIT (TABLES 6-7) When residents are asked if they approve or disapprove of each of six strategies to deal
with the City’s budget deficit, one strategy, “use more private contractors, implement managed competition,” receives approval from 74 percent of residents (20% strongly approve/54% approve) with disapproval of only 20 percent. Two additional strategies also receive approval from a majority of residents, but generate significant disapproval readings: 1) generate new revenue through increased fees to help avoid service reductions (59% approve [5% strongly approve/54% approve]/36% disapprove); 2) combination of new revenues and service cuts (52% approve [6% strongly approve/46% approve]/40% disapprove). Each of the three remaining strategies receive disapproval readings which are nearly equal to or exceed their approval readings:
– Further reductions to City employee salaries and benefits (48% approve/47%
disapprove) – Generate new revenue through increased taxes to help avoid service reductions
(46% approve/50% disapprove)
– Eliminate or further reduce City services (26% approve/70% disapprove)
70%
26%
50%
46%
47%
48%
40%
52%
36%
59%
20%
74%
Eliminate or further reduce City services
Generate new revenue through increased
Further reductions to City employee salaries
Combination of new revenues and service cuts
Generate new revenue through increased
Use more private contractors, implement
0% 20% 40% 60% 80% 100%
Approve Disapprove
TO DEAL WITH BUDGET DEFICITREACTION TO SELECT STRATEGIES
201.003 C-5
fees to help avoid service reductions
and benefits
taxes to help avoid service reductions
managed competition

9 2010003\RPT San Diego Community Attitude.doc
• SAN DIEGO AS A PLACE TO LIVE (TABLE 9) Better than nine out of ten San Diego residents (97%) either strongly agree (47%) or agree
(50%) that “overall San Diego is a good place to live.”
PLACE TO LIVE
SAN DIEGO IS A GOOD
2010.003 C-6
Disagree (3%)
Agree (97%)
Not Sure (*%)
*Indicates % less than .5
10 2010003\RPT San Diego Community Attitude.doc
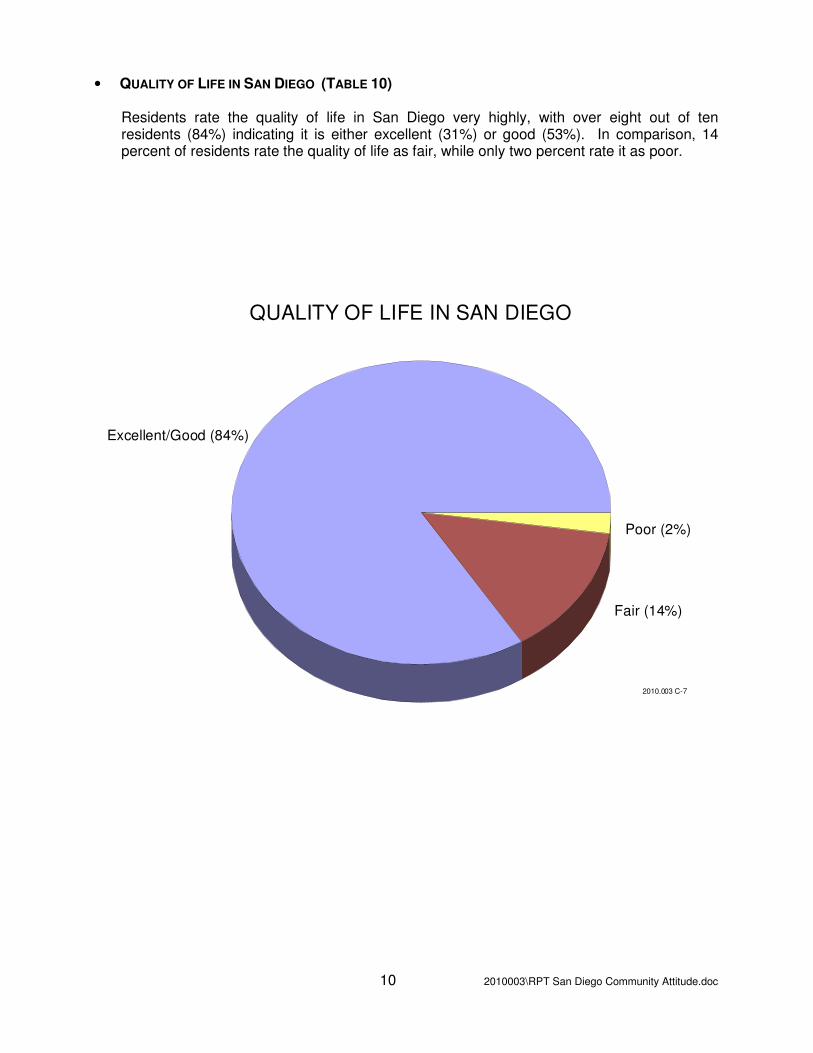
• QUALITY OF LIFE IN SAN DIEGO (TABLE 10) Residents rate the quality of life in San Diego very highly, with over eight out of ten
residents (84%) indicating it is either excellent (31%) or good (53%). In comparison, 14 percent of residents rate the quality of life as fair, while only two percent rate it as poor.
QUALITY OF LIFE IN SAN DIEGO
2010.003 C-7
Fair (14%)
Excellent/Good (84%)
Poor (2%)
11 2010003\RPT San Diego Community Attitude.doc
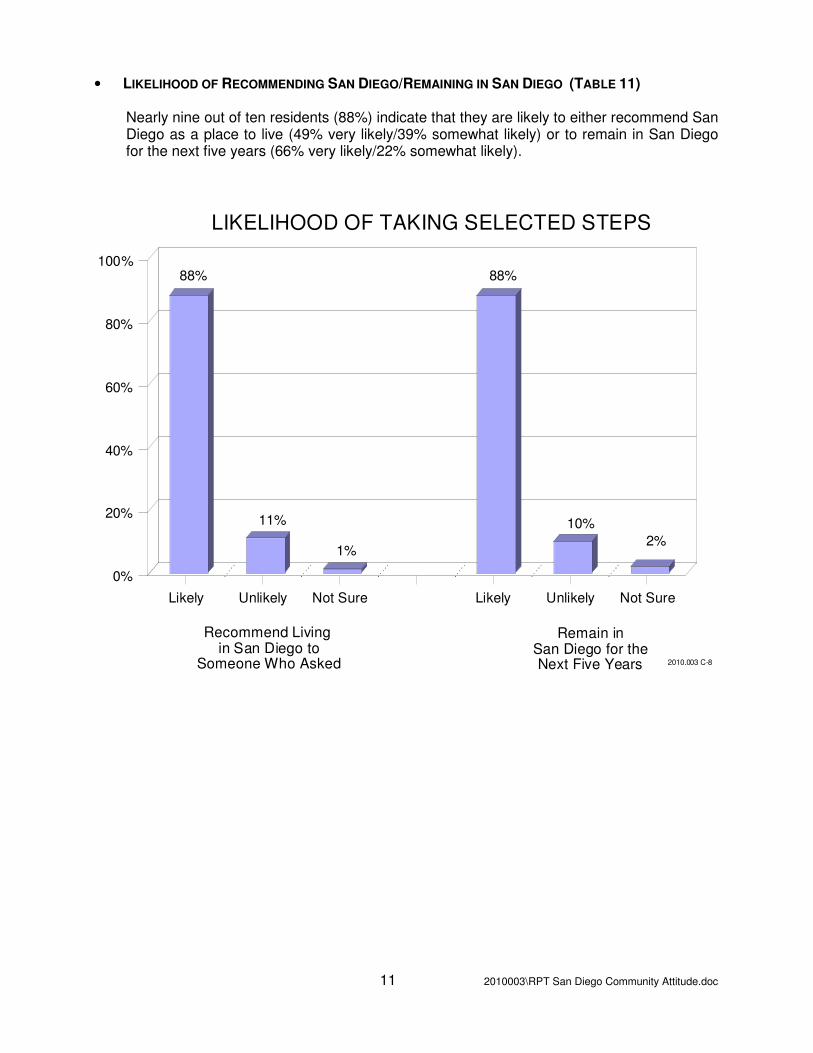
• LIKELIHOOD OF RECOMMENDING SAN DIEGO/REMAINING IN SAN DIEGO (TABLE 11) Nearly nine out of ten residents (88%) indicate that they are likely to either recommend San
Diego as a place to live (49% very likely/39% somewhat likely) or to remain in San Diego for the next five years (66% very likely/22% somewhat likely).
88%
11%
1%
88%
10%
2%
Likely Unlikely Not Sure Likely Unlikely Not Sure
0%
20%
40%
60%
80%
100%
LIKELIHOOD OF TAKING SELECTED STEPS
Remain inSan Diego for theNext Five Years
Recommend Living in San Diego to
Someone Who Asked 2010.003 C-8

12 2010003\RPT San Diego Community Attitude.doc
• MOST SERIOUS ISSUE FACING RESIDENTS (TABLE 12)
When San Diego residents are asked to indicate the most serious issue facing residents with respect to services provided by the City, improved city services, street repairs, education and fixing the budget lead the list.
1%
2%
2%
2%
3%
4%
4%
5%
5%
5%
6%
6%
10%
13%
14%
15%
Growth
Economy
Developing alternative water sources
Stop spending - wasteful
Poor city leadership
Water conservation
City Pension fund - fix
Employment/Jobs
Lack of Social Services
Public transportation - expanded/improve
Cost of living
Crime
City budget - balance/fix
Education
Streets - repair/fix
Improved City Services
0% 10% 20% 30% 40% 50%
RESIDENTS WITH RESPECT TO CITY-PROVIDED SERVICESMOST SERIOUS ISSUES FACING RESIDENTS
201.003 C-9
(OPEN-ENDED QUESTION)

13 2010003\RPT San Diego Community Attitude.doc
• ATTITUDES ABOUT SAFETY IN SAN DIEGO (TABLE 13) Ninety percent of residents rate the safety in their neighborhood in positive terms (39% very
safe/51% somewhat safe), while 85 percent rate the safety in the City as a whole in positive terms (12% very safe/73% somewhat safe). These readings are slightly improved from a similar resident survey conducted for the City of San Diego in 2004 (86% positive neighborhood, 77% positive City as a whole).
90%
10%
85%
13%
2%
Safe Unsafe Not Sure Safe Unsafe Not Sure
0%
20%
40%
60%
80%
100%
SAFETY IN SAN DIEGO
City as a WholeMy Neighborhod
*
2010.003 C-10
*Indicates % less than .5

14 2010003\RPT San Diego Community Attitude.doc
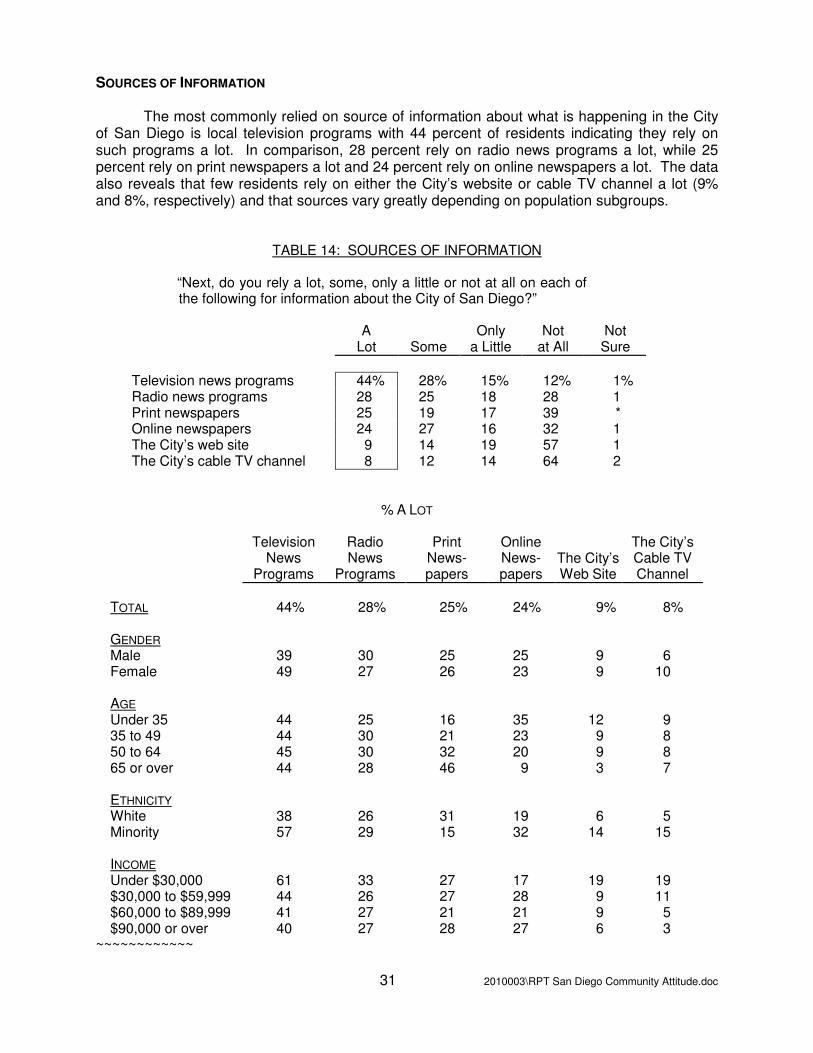
• SOURCES OF INFORMATION (TABLE 14) The most commonly relied on source of information about what is happening in the City of
San Diego is local television programs with 44 percent of residents indicating they rely on such programs a lot. In comparison, 28 percent rely on radio news programs a lot, while 25 percent rely on print newspapers a lot and 24 percent rely on online newspapers a lot. The data also reveals that few residents rely on either the City’s website or cable TV channel a lot (9% and 8%, respectively).
8%
9%
24%
25%
28%
44%
The City's cable TV channel
The City's web site
Online newspapers
Print newspapers
Radio news programs
Television news programs
0% 20% 40% 60% 80% 100%
ABOUT THE CITYSOURCES OF INFORMATION
201.003 C-11
(% Rely on a Lot)

15 2010003\RPT San Diego Community Attitude.doc
DETAIL OF THE FINDINGS
EVALUATION OF CITY IN SELECTED AREAS San Diego residents were asked to evaluate the City in four specific areas: Job City Does Delivering to Residents
A slight majority of residents (51%) offer a positive evaluation on the job the City does delivering services with six percent offering an excellent rating and 45 percent a good rating. Thirty-six percent offer a fair rating and ten percent a poor rating. These figures are relatively consistent across population subgroups. Value of Services You Receive for Taxes You Pay Less than a majority of residents (47%) give the City a positive reading for the value of the services they receive for the taxes they pay (6% excellent, 41% good), while 34 percent offer a fair rating. The positive readings tend to increase with age and are higher among whites (53%) than minorities (37%). Overall Direction City is Taking Nearly equal volumes of residents offer positive (32%) and negative (27%) ratings regarding the overall direction the City is taking. An additional third of residents (35%) offer only a fair rating. Job City Does Listening to Citizens Only 28 percent of residents offer a positive rating on the job the City does listening to residents, while 25 percent offer a negative rating and 40 percent a fair rating. These readings are consistent across population subgroups.

16 2010003\RPT San Diego Community Attitude.doc
TABLE 1: EVALUATION OF CITY
IN SELECTED AREAS
“Next, would you rate each of the following as excellent, good, fair or poor?”
Job City Does Delivering
Services to Residents
Value of Services You Receive for
Taxes You Pay
Overall Direction
City is Taking
Job City Does Listening
to Citizens Excellent 6% 6% 4% 2% Good 45 41 28 26 Fair 36 34 35 40 Poor 10 18 27 25 Not sure 3 1 6 7 100% 100% 100% 100% TOTAL EXCELLENT/GOOD
Job City Does Delivering
Services to Residents
Value of Services You Receive for
Taxes You Pay
Overall Direction
City is Taking
Job City Does Listening
to Citizens TOTAL 51% 47% 32% 28% GENDER Male 49 49 33 28 Female 53 45 31 27 AGE Under 35 49 44 38 30 35 to 49 54 43 28 28 50 to 64 46 49 25 25 65 or over 58 61 42 30 ETHNICITY White 55 53 31 29 Minority 45 37 33 27 INCOME Under $30,000 54 46 35 28 $30,000 to $59,999 47 37 32 26 $60,000 to $89,999 49 51 30 33 $90,000 or over 52 47 29 25
~~~~~~~~~~~~

17 2010003\RPT San Diego Community Attitude.doc
ATTITUDE ABOUT HOW ESSENTIAL SELECTED CITY SERVICES ARE San Diego residents were asked to indicate how essential they felt each of 17 City services are on a scale of one (not essential) to four (absolutely essential). As may be seen on the following table, five of the services receive “absolutely essential” reading from a majority of residents with mean readings of 3.3 or more:
– Fire services (83%, 3.8) – Police services (78%, 3.7) – Emergency medical services (76%, 3.7) – Residential trash collection services (62%, 3.5) – Fire prevention programs (52%, 3.3)
Those services which receive the lowest readings are: 1) neighborhood code enforcement (23%, 2.7); 2) art and cultural programs (23%, 2.8) and; 3) graffiti removal (24%, 2.8).
TABLE 2: ATTITUDE ABOUT HOW ESSENTIAL
SELECTED CITY SERVICES ARE “As you know, the City of San Diego provides various services to the
community. On a scale of 1 to 4 where 1 means you think a service is not essential and 4 means you think a service is absolutely essential, how essential do you feel each of the following City services are?”
Not Essential
1 2 3
Absolutely Essential
4 Not
Sure MEAN
RATING1
Fire services 1% 3% 12% 83% 1% 3.8 Police services 2 3 16 78 1 3.7 Emergency medical services 2 4 17 76 1 3.7 Residential trash collection services 3 6 28 62 1 3.5 Fire prevention programs 3 14 28 52 3 3.3 Pollution prevention in oceans
and bays 4 12 34 48 2 3.3 Lifeguard service at the beaches 2 14 34 47 3 3.3 Residential recycling services 4 14 33 48 1 3.3 Maintenance of beaches and parks 1 15 42 41 1 3.2 Street and sidewalk maintenance 4 13 41 42 * 3.2 Branch libraries 4 16 38 41 1 3.2 Parks and recreation programs 2 19 42 36 1 3.1 Homeless services 6 22 37 32 3 3.0 Existing main library downtown 12 22 31 29 6 2.8 Graffiti removal 7 32 35 24 2 2.8 Art and cultural programs 10 26 40 23 1 2.8 Neighborhood code enforcement 12 25 35 23 5 2.7
1 The higher the mean, the more essential the service * Indicates % less than .5
~~~~~~~~~~~~

18 2010003\RPT San Diego Community Attitude.doc
SATISFACTION WITH CITY SERVICES San Diego residents were next asked to reveal their level of satisfaction with each of 25 services provided by the City using a four-point scale (very dissatisfied -- very satisfied). Receiving the highest satisfaction readings from residents are seven categories with ratings of 3.00 or higher:
– Trash collection services (3.25) – Fire response to calls for service (3.18) – Recycling collection services (3.15) – Beach lifeguard service (3.09) – Parking availability in your neighborhood (3.03) – Programs at branch libraries (3.01) – Maintenance of parks and its facilities (3.00)
Also receiving positive ratings between 2.81 and 2.99 are 15 additional City services:
– Police response to calls for service (2.99) – Programs at recreational centers (2.97) – Programs at existing main library downtown (2.96) – Cleanliness of beaches (2.96) – Arts and cultural programs (2.95) – Service hours at existing main library downtown (2.94) – Tree maintenance on public property (2.93) – Recreation center service hours (2.92) – Frequency of street sweeping (2.92) – Efforts to eliminate graffiti (2.92) – Branch library service hours (2.86) – Flood control efforts (2.86) – Parking enforcement efforts (2.86) – Street lighting (2.83) – Conditions of neighborhood sidewalks (2.81)
The final three City services studied receive low ratings under 2.50:
– Efforts to address homelessness (2.45) – Condition of City streets (2.28) – Downtown parking availability (2.18)

19 2010003\RPT San Diego Community Attitude.doc
TABLE 3: SATISFACTION WITH CITY SERVICES
“Next, would you say you are very satisfied, satisfied, dissatisfied or very
dissatisfied with each of the following in San Diego?”
Very Satisfied
(4) Satisfied
(3)
Dis- satisfied
(2)
Very Dis- satisfied
(1) Not Sure
MEAN RATING
1
Trash collection services 29% 66% 3% 1% 1% 3.25 Fire response to calls for service 21 53 4 2 20 3.18 Recycling collection services 24 65 7 1 3 3.15 Beach lifeguard service 16 66 6 1 11 3.09 Parking availability in your neighborhood 26 55 13 5 1 3.03 Programs at branch libraries 10 57 8 1 24 3.01 Maintenance of parks and its facilities 14 71 11 1 3 3.00 Police response to calls for service 16 54 10 4 16 2.99 Programs at recreational centers 8 59 8 1 24 2.97 Programs at existing main library downtown 5 46 5 1 43 2.96 Cleanliness of beaches 14 64 14 2 6 2.96 Arts and cultural programs 8 68 11 1 12 2.95 Service hours at existing main library downtown 6 46 7 1 40 2.94 Tree maintenance on public property 10 66 13 2 9 2.93 Recreation center service hours 5 59 8 2 26 2.92 Frequency of street sweeping 11 68 12 3 6 2.92 Efforts to eliminate graffiti 9 66 13 2 10 2.92 Branch library service hours 9 57 16 3 15 2.86 Flood control efforts 8 56 13 3 20 2.86 Parking enforcement efforts 9 64 13 5 9 2.86 Street lighting 11 63 21 3 2 2.83 Condition of neighborhood sidewalks 11 63 20 4 2 2.81 Efforts to address home- lessness 3 41 36 7 13 2.45 Condition of city streets 4 37 41 17 1 2.28 Downtown parking availability 3 31 38 20 8 2.18 The higher the mean, the greater the satisfaction (among those with opinion)
~~~~~~~~~~~~

20 2010003\RPT San Diego Community Attitude.doc
CITY SPENDING PRIORITIES After residents had evaluated each of the 25 service areas under consideration, they were asked to indicate whether they would or would not be willing to pay more for them through taxes or fees in order to maintain them or avoid further cuts. Four services are mentioned by at least a majority of residents as areas where they would be willing to pay more:
– Fire response to calls for service (70%) – Police response to calls for service (68%) – Condition of City streets (60%) – Maintenance of parks and its facilities (55%)
Of particular interest among the four service spending priorities noted above, is the fact
that they include two of the three public safety categories tested. This pattern clearly reveals the high priority which residents give these service areas. On the other end of the spectrum, the following services receive the lowest spending priority readings with at least 70 percent or more of residents indicating they would not be willing to pay more for each.
– Downtown parking availability (70%) – Programs at existing main library downtown (70%) – Frequency of street sweeping (75%) – Parking enforcement efforts (77%) – Parking availability in your neighborhood (78%)
TABLE 4: WILLINGNESS TO PAY MORE TO MAINTAIN CITY SERVICES
“Now I’d like to quickly read the list again, but this time please tell
me if each is one you would or would not be willing to pay more for through increased taxes or fees in order to maintain or avoid further cuts.”
Would Would
Not Not Sure
Fire response to calls for service 70% 28% 2% Police response to calls for service 68 29 3 Condition of City streets 60 38 2 Maintenance of parks and its facilities 55 44 1 Beach lifeguard service 49 49 2 Cleanliness of beaches 49 49 2 Efforts to address homelessness 49 47 4 Recycling collection services 48 50 4 Trash collection services 46 52 2 Street lighting 45 53 2 Programs at recreational centers 44 54 2
(CONTINUED)
21 2010003\RPT San Diego Community Attitude.doc
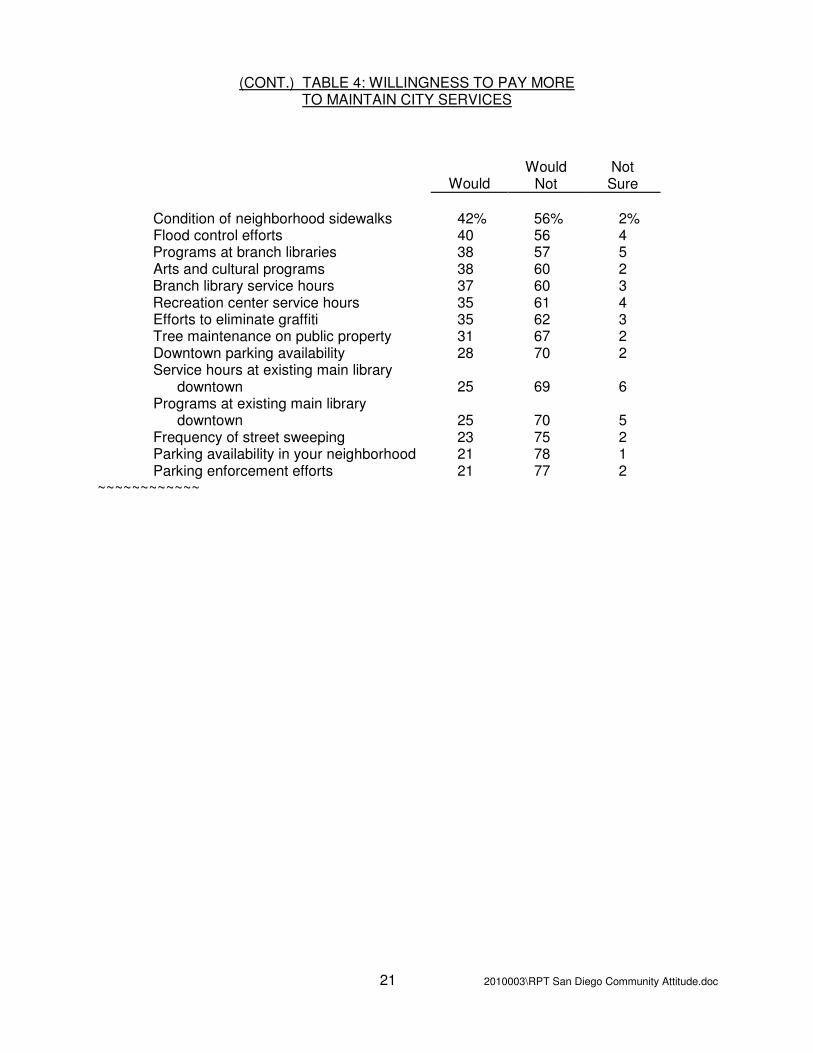
(CONT.) TABLE 4: WILLINGNESS TO PAY MORE TO MAINTAIN CITY SERVICES
Would Would
Not Not Sure
Condition of neighborhood sidewalks 42% 56% 2% Flood control efforts 40 56 4 Programs at branch libraries 38 57 5 Arts and cultural programs 38 60 2 Branch library service hours 37 60 3 Recreation center service hours 35 61 4 Efforts to eliminate graffiti 35 62 3 Tree maintenance on public property 31 67 2 Downtown parking availability 28 70 2 Service hours at existing main library downtown 25 69 6 Programs at existing main library downtown 25 70 5 Frequency of street sweeping 23 75 2 Parking availability in your neighborhood 21 78 1 Parking enforcement efforts 21 77 2
~~~~~~~~~~~~
22 2010003\RPT San Diego Community Attitude.doc
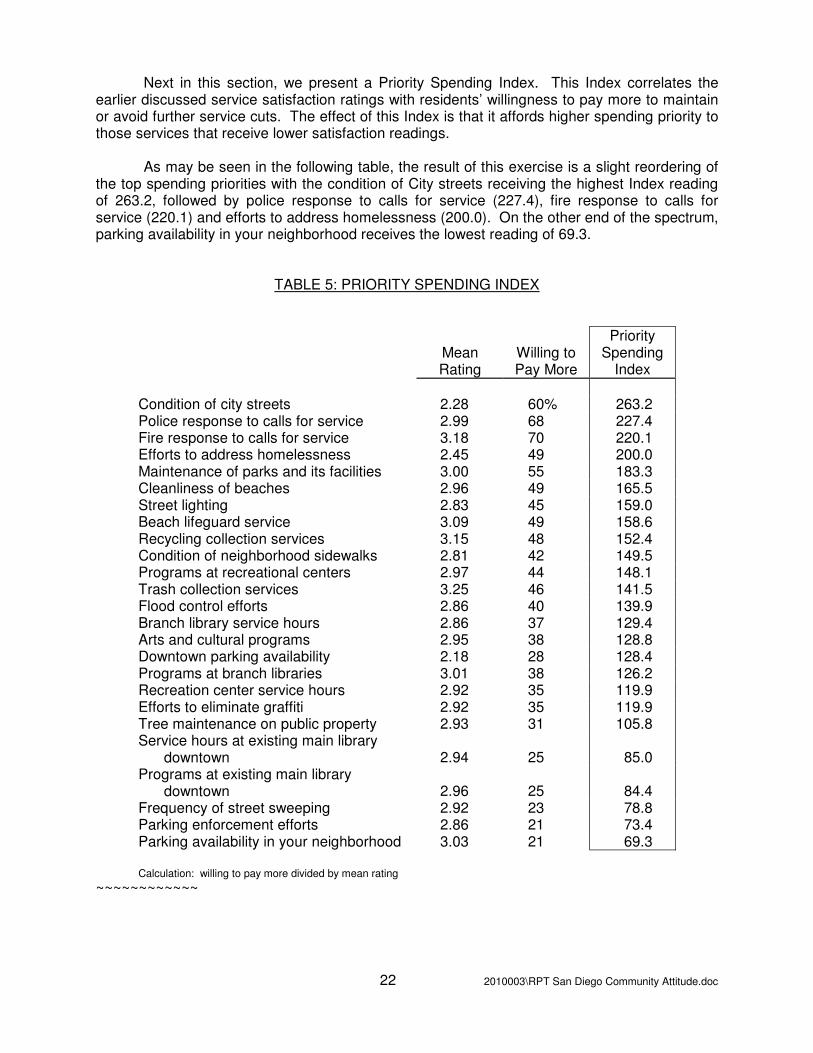
Next in this section, we present a Priority Spending Index. This Index correlates the earlier discussed service satisfaction ratings with residents’ willingness to pay more to maintain or avoid further service cuts. The effect of this Index is that it affords higher spending priority to those services that receive lower satisfaction readings. As may be seen in the following table, the result of this exercise is a slight reordering of the top spending priorities with the condition of City streets receiving the highest Index reading of 263.2, followed by police response to calls for service (227.4), fire response to calls for service (220.1) and efforts to address homelessness (200.0). On the other end of the spectrum, parking availability in your neighborhood receives the lowest reading of 69.3.
TABLE 5: PRIORITY SPENDING INDEX
Mean Rating
Willing to Pay More
Priority Spending
Index Condition of city streets 2.28 60% 263.2 Police response to calls for service 2.99 68 227.4 Fire response to calls for service 3.18 70 220.1 Efforts to address homelessness 2.45 49 200.0 Maintenance of parks and its facilities 3.00 55 183.3 Cleanliness of beaches 2.96 49 165.5 Street lighting 2.83 45 159.0 Beach lifeguard service 3.09 49 158.6 Recycling collection services 3.15 48 152.4 Condition of neighborhood sidewalks 2.81 42 149.5 Programs at recreational centers 2.97 44 148.1 Trash collection services 3.25 46 141.5 Flood control efforts 2.86 40 139.9 Branch library service hours 2.86 37 129.4 Arts and cultural programs 2.95 38 128.8 Downtown parking availability 2.18 28 128.4 Programs at branch libraries 3.01 38 126.2 Recreation center service hours 2.92 35 119.9 Efforts to eliminate graffiti 2.92 35 119.9 Tree maintenance on public property 2.93 31 105.8 Service hours at existing main library downtown 2.94 25 85.0 Programs at existing main library downtown 2.96 25 84.4 Frequency of street sweeping 2.92 23 78.8 Parking enforcement efforts 2.86 21 73.4 Parking availability in your neighborhood 3.03 21 69.3 Calculation: willing to pay more divided by mean rating
~~~~~~~~~~~~

23 2010003\RPT San Diego Community Attitude.doc
REACTION TO SELECT STRATEGIES TO DEAL WITH BUDGET DEFICIT When residents are asked if they approve or disapprove of each of six strategies to deal with the City’s budget deficit, one strategy, “use more private contractors, implement managed competition,” receives approval from 74 percent of residents (20% strongly approve/54% approve) with disapproval of only 20 percent. Two additional strategies also receive approval from a majority of residents, but generate significant disapproval readings: 1) generate new revenue through increased fees to help avoid service reductions (59% approve/36% disapprove); 2) combination of new revenues and service cuts (52% approve/40% disapprove). Each of the three remaining strategies receive disapproval readings which are nearly equal to or exceed their approval readings:
– Further reductions to City employee salaries and benefits (48% approve/47% disapprove)
– Generate new revenue through increased taxes to help avoid service
reductions (46% approve/50% disapprove)
– Eliminate or further reduce City services (26% approve/70% disapprove)
TABLE 6: REACTION TO SELECT STRATEGIES TO DEAL WITH BUDGET DEFICIT
“Next, as you are probably aware, the City of San Diego is currently dealing
with a significant budget deficit. To solve this problem, other cities have implemented a variety of strategies. I’d like to describe several of them to you and then have you tell me if you strongly approve, approve, disapprove or strongly disapprove of each.”
Strongly Approve Approve Disapprove
Strongly Disapprove
Not Sure
TOTAL APPROVE
1
Use more private contractors, implement managed competition 20% 54% 15% 5% 6% 74% Generate new revenue through increased fees to help avoid service reductions 5 54 26 10 5 59 Combination of new revenues and service cuts 6 46 34 6 8 52 Further reductions to City employee salaries and benefits 11 37 36 11 6 48 Generate new revenue through increased taxes to help avoid service reductions 6 40 35 15 4 46 Eliminate or further reduce City services 3 23 56 14 4 26
1Strongly approve + approve
Totals may not equal 100% due to rounding ~~~~~~~~~~~

24 2010003\RPT San Diego Community Attitude.doc
On the following table, it may be seen that males tend to offer higher approval ratings than do females.
TABLE 7: REACTION TO SELECTED STRATEGIES
TO DEAL WITH BUDGET DEFICIT – DETAIL
TOTAL APPROVE
Private
ContractorsIncreased
Fees
Combo Revenue/
Cuts
Employees Salary
Reductions Increased
Taxes Reduced Services
TOTAL 74% 59% 52% 48% 46% 26% GENDER Male 80 62 53 55 49 34 Female 69 56 50 40 43 17 AGE Under 35 78 66 57 38 54 27 35 to 49 73 57 52 51 41 27 50 to 64 75 57 51 58 42 29 65 or over 67 56 42 44 45 25 ETHNICITY White 76 59 51 50 46 26 Minority 71 59 52 44 46 26 INCOME Under $30,000 64 51 36 46 45 18 $30,000 to $59,999 77 61 56 46 47 20 $60,000 to $89,999 74 59 54 47 46 30 $90,000 or over 80 63 57 53 48 29
~~~~~~~~~~~~

25 2010003\RPT San Diego Community Attitude.doc
In a follow-up question which asked residents for their suggestions on other ways to reduce the budget deficit, 74 percent said they did not have any. The most frequently mentioned suggestion was to reduce wasteful spending with a reading of 13 percent.
TABLE 8: OTHER SUGGESTIONS TO REDUCE DEFICIT
“Do you have any other suggestions on how the City could reduce its budget deficit?”
None 74% Cut wasteful spending, better money management 13 Reduce number of employees, cross-train, more efficient 7 Stimulate economy – attract new businesses, increase tourism 3 Sell public land/real estate 2 Enforce laws – collect fines 1 Stop using outside contractors 1 Miscellaneous others 1
~~~~~~~~~~~~

26 2010003\RPT San Diego Community Attitude.doc
SAN DIEGO AS A PLACE TO LIVE Better than nine out of ten San Diego residents (97%) either strongly agree (47%) or agree (50%) that “overall San Diego is a good place to live.” This reading is universal across all population subgroups.
TABLE 9: SAN DIEGO AS A PLACE TO LIVE
“To begin, would you say you strongly agree, agree, disagree or strongly disagree with the following statement, ‘Overall, San Diego is a good place to live’.”
Strongly Agree Agree Disagree
Strongly Disagree
Not Sure
TOTAL AGREE
1 TOTAL 47% 50% 2% 1% *% 97% GENDER Male 50 47 2 1 0 97 Female 43 53 2 1 1 96 AGE Under 35 50 48 1 0 1 98 35 to 49 43 51 4 1 1 94 50 to 64 49 47 2 2 0 96 65 or over 42 54 3 1 0 96 ETHNICITY White 50 47 2 1 * 97 Minority 43 54 3 * * 97 INCOME Under $30,000 32 61 6 1 0 93 $30,000 to $59,999 47 48 3 1 1 95 $60,000 to $89,999 46 51 1 1 1 97 $90,000 or over 55 44 1 0 0 91 1Strongly agree + agree
*Indicates % less than .5 ~~~~~~~~~~~~

27 2010003\RPT San Diego Community Attitude.doc
QUALITY OF LIFE IN SAN DIEGO Residents rate the quality of life in San Diego very highly, with over eight out of ten residents (84%) indicating it is either excellent (31%) or good (53%). In comparison, 14 percent of residents rate the quality of life as fair, while only two percent rate it as poor. When residents’ attitudes about the quality of life in San Diego are analyzed based on population subgroup, we find that positive impressions tend to increase in correlation to increases in yearly income and that white residents reveal a more positive impression about the quality of life in the City than do minority residents.
TABLE 10: QUALITY OF LIFE
IN SAN DIEGO “On the whole, would you say that the quality of life in the City of
San Diego is excellent, good, fair or poor?”
Excel-
lent Good Fair Poor Not
Sure TOTAL
POSITIVE TOTAL 31% 53% 14% 2% *% 84% GENDER Male 34 48 16 2 0 82 Female 28 57 13 2 * 85 AGE Under 35 33 54 12 1 0 87 35 to 49 27 54 17 1 1 81 50 to 64 32 51 15 2 0 83 65 or over 34 49 14 3 0 83 ETHNICITY White 35 51 13 1 0 86 Minority 24 54 18 3 1 78 INCOME Under $30,000 22 56 16 6 0 78 $30,000 to $59,999 22 56 18 3 1 78 $60,000 to $89,999 30 49 20 1 0 79 $90,000 or over 40 52 8 0 0 92 *Indicates % less than .5
~~~~~~~~~~~~

28 2010003\RPT San Diego Community Attitude.doc
LIKELIHOOD OF RECOMMENDING SAN DIEGO/REMAINING IN SAN DIEGO Nearly nine out of ten residents (88%) indicate that they are likely to either recommend San Diego as a place to live or to remain in San Diego for the next five years. These patterns are universal across population subgroups.
TABLE 11: LIKELIHOOD OF TAKING SELECTED STEPS
“How likely are you to do each of the following – very
likely, somewhat likely, somewhat unlikely or very unlikely?”
Recommend Living in
San Diego to Someone
Who Asked
Remain in San Diego for the Next Five Years
Very likely 49% 66% Somewhat likely 39 22 Somewhat unlikely 7 5 Very unlikely 4 5 Not sure 1 2 100% 100%
TOTAL LIKELY TOTAL 88% 88% GENDER Male 88 86 Female 88 90 AGE Under 35 95 86 35 to 49 83 85 50 to 64 85 89 65 or over 89 97 ETHNICITY White 86 87 Minority 94 92 INCOME Under $30,000 87 89 $30,000 to $59,999 87 92 $60,000 to $89,999 88 89 $90,000 or over 92 87
~~~~~~~~~~~~

29 2010003\RPT San Diego Community Attitude.doc
MOST SERIOUS ISSUE FACING RESIDENTS When San Diego residents are asked to indicate the most serious issue facing residents with respect to services provided by the City, improved city services, street repairs, education and fixing the budget lead the list.
TABLE 12: MOST SERIOUS ISSUE FACING RESIDENTS
“Next, what do you think is the most serious issue facing the
residents of San Diego, with respect to services provided by the City, that you would like to see City government do something about?” (OPEN-ENDED QUESTION)
GENDER
TOTAL Male Female
TRANSPORTATION (NET) 20% 19% 21% Streets-repair/fix 14 13 15 Public transportation-expanded/ improve 5 5 5 Other 3 3 3 CITY GOVERNMENT MANAGEMENT (NET) 17 20 14 Budget-balance/fix 10 12 7 Pension fund-fix 4 4 4 Poor leadership 3 4 3 Stop spending-wasteful 2 2 2 Improved City Services 15 14 16 Education 13 9 16 ENVIRONMENTAL (NET) 9 8 9 Conserving water 4 3 4 Developing alternative water sources 2 3 2 Other 3 2 3 Crime 6 6 6 Cost of living 6 6 6 Lack of Social Services 5 6 4 Employment/Jobs 5 4 7 Economy 2 1 2 Growth 1 1 1 Miscellaneous 3 4 3 None/not sure 14 15 13
~~~~~~~~~~~~

30 2010003\RPT San Diego Community Attitude.doc
ATTITUDES ABOUT SAFETY IN SAN DIEGO Residents were asked about safety in their neighborhood and the City as a whole. Here we find that 90 percent of residents rate the safety in their neighborhood in positive terms (39% very safe/51% somewhat safe), while 85 percent rate the safety in the City as a whole in positive terms (12% very safe/73% somewhat safe). These readings are slightly improved from a similar resident survey conducted for the City of San Diego in 2004 (86% positive neighborhood, 77% positive City as a whole). Lower income residents tend to offer slightly lower safety readings than higher income residents.
TABLE 13: ATTITUDES ABOUT SAFETY IN SAN DIEGO
“Next, how would you rate the safety of your neighborhood?”
“How about the safety of the City of San Diego as a whole? Would you say it is...”
Neighbor-
hood City as
a Whole Very safe 39% 12% Somewhat safe 51 73 Somewhat unsafe 8 11 Very unsafe 2 2 Not sure * 2 100% 100%
TOTAL SAFE TOTAL 90% 85% GENDER Male 89 86 Female 90 84 AGE Under 35 87 85 35 to 49 90 87 50 to 64 92 84 65 or over 92 83 ETHNICITY White 92 86 Minority 85 83 INCOME Under $30,000 83 80 $30,000 to $59,999 86 83 $60,000 to $89,999 92 83 $90,000 or over 90 91 *Indicates % less than .5
~~~~~~~~~~~~
31 2010003\RPT San Diego Community Attitude.doc
SOURCES OF INFORMATION The most commonly relied on source of information about what is happening in the City of San Diego is local television programs with 44 percent of residents indicating they rely on such programs a lot. In comparison, 28 percent rely on radio news programs a lot, while 25 percent rely on print newspapers a lot and 24 percent rely on online newspapers a lot. The data also reveals that few residents rely on either the City’s website or cable TV channel a lot (9% and 8%, respectively) and that sources vary greatly depending on population subgroups.
TABLE 14: SOURCES OF INFORMATION “Next, do you rely a lot, some, only a little or not at all on each of
the following for information about the City of San Diego?”
A
Lot Some Only
a Little Not
at All Not Sure
Television news programs 44% 28% 15% 12% 1% Radio news programs 28 25 18 28 1 Print newspapers 25 19 17 39 * Online newspapers 24 27 16 32 1 The City’s web site 9 14 19 57 1 The City’s cable TV channel 8 12 14 64 2
% A LOT
Television News
Programs
Radio News
Programs
Print News- papers
Online News- papers
The City’s Web Site
The City’s Cable TV Channel
TOTAL 44% 28% 25% 24% 9% 8% GENDER Male 39 30 25 25 9 6 Female 49 27 26 23 9 10 AGE Under 35 44 25 16 35 12 9 35 to 49 44 30 21 23 9 8 50 to 64 45 30 32 20 9 8 65 or over 44 28 46 9 3 7 ETHNICITY White 38 26 31 19 6 5 Minority 57 29 15 32 14 15 INCOME Under $30,000 61 33 27 17 19 19 $30,000 to $59,999 44 26 27 28 9 11 $60,000 to $89,999 41 27 21 21 9 5 $90,000 or over 40 27 28 27 6 3
~~~~~~~~~~~~

32 2010003\RPT San Diego Community Attitude.doc
APPENDIX
METHODOLOGY The information contained in this report is based on 600 in-depth telephone interviews conducted with San Diego heads of household. Respondent selection on this project was accomplished via a computer-generated, random digit dial telephone sample which selects households based on residential telephone prefixes and includes all unlisted and newly listed households. This methodology was selected because it ensures a randomly selected sample of households proportionately allocated throughout the sample universe. The questionnaire used in this study was designed by BRC in conjunction with the City of San Diego’s Office of the Independent Budget Analyst. Both English and Spanish versions of the questionnaire were used in the study. All of the interviewing on this project was conducted during March 2010 at the Center's central location Computer-Assisted Telephone Interviewing (CATI) facility where each interviewer worked under the direct supervision of BRC supervisory personnel. All of the interviewers who worked on this project were professional interviewers of the Center. Each had prior experience with BRC and received a thorough briefing on the particulars of this study. During the briefing, the interviewers were trained on: (a) the purpose of the study; (b) sampling procedures; (c) administration of the questions; and (d) other project-related factors. In addition, each interviewer completed a set of practice interviews to ensure that all procedures were understood and followed. Interviewing on this study was conducted during an approximately equal cross-section of evening and weekend hours. This procedure was followed to ensure that all households were equally represented, regardless of work schedules. Further, during the interviewing segment of this study, up to eight separate attempts, on different days and during different times of day, were made to contact each selected resident. Only after eight unsuccessful attempts was a selected household substituted in the sample. Using this methodology, the full sample was completed and partially completed interviews were not accepted nor counted toward fulfillment of the total sample quotas. One hundred percent of the completed interviews were edited and any containing errors of administration (missed skip patterns) were pulled, the respondent re-called, and the errors corrected. In addition, 15 percent of each interviewer's work was randomly selected for validation to ensure its authenticity and correctness. No problems were encountered during this phase of interviewing quality control. As the data collection segment of this study was being undertaken, completed interviews were turned over to BRC's in-house Coding Department. The Coding Department edited, validated and coded the interviews. Upon completion of coding, a series of validity and logic checks were run on the data to insure it was "clean" (did not contain any errors). Following this procedure, the survey sample was weighted by age and gender to bring it more closely into line with the actual estimated distribution of heads of household in San Diego.

33 2010003\RPT San Diego Community Attitude.doc
Unweighted
Sample Weighted Sample
Under 35 30.2% 30.2% 35 to 49 21.8 31.8 50 to 64 33.3 23.3 65 or over 13.8 13.8 Refused .9 .9 100.0% 100.0%
When analyzing the results of this survey, it should be kept in mind that all surveys are subject to sampling error. Sampling error, stated simply, is the difference between the results obtained from a sample and those which would be obtained by surveying the entire population under consideration. The size of sampling error varies, to some extent, with the number of interviews completed and with the division of opinion on a particular question. An estimate of the sampling error range for this study is provided in the following table. The sampling error presented in the table has been calculated at the confidence level most frequently used by social scientists, the 95 percent level. The sampling error figures shown in the table are average figures that represent the maximum error for the sample bases shown (i.e., for the survey findings where the division of opinion is approximately 50%/50%). Survey findings that show a one-sided distribution of opinion, such as 70%/30% or 90%/10%, are usually subject to slightly lower sampling tolerances than those shown in the table. As may be seen in the table, the overall sampling error for this study is approximately +/- 4.1 percent when the sample is studied in total (i.e., all 600 cases). However, when subsets of the total sample are studied, the amount of sampling error increases based on the sample size within the subset.
Sample Size
Approximate Sampling Error At A 95% Confidence
Level (Plus/Minus Percentage Of Sampling Tolerance)
600 4.1% 500 4.5 400 5.0 300 5.8 200 7.1 100 10.1
34 2010003\RPT San Diego Community Attitude.doc
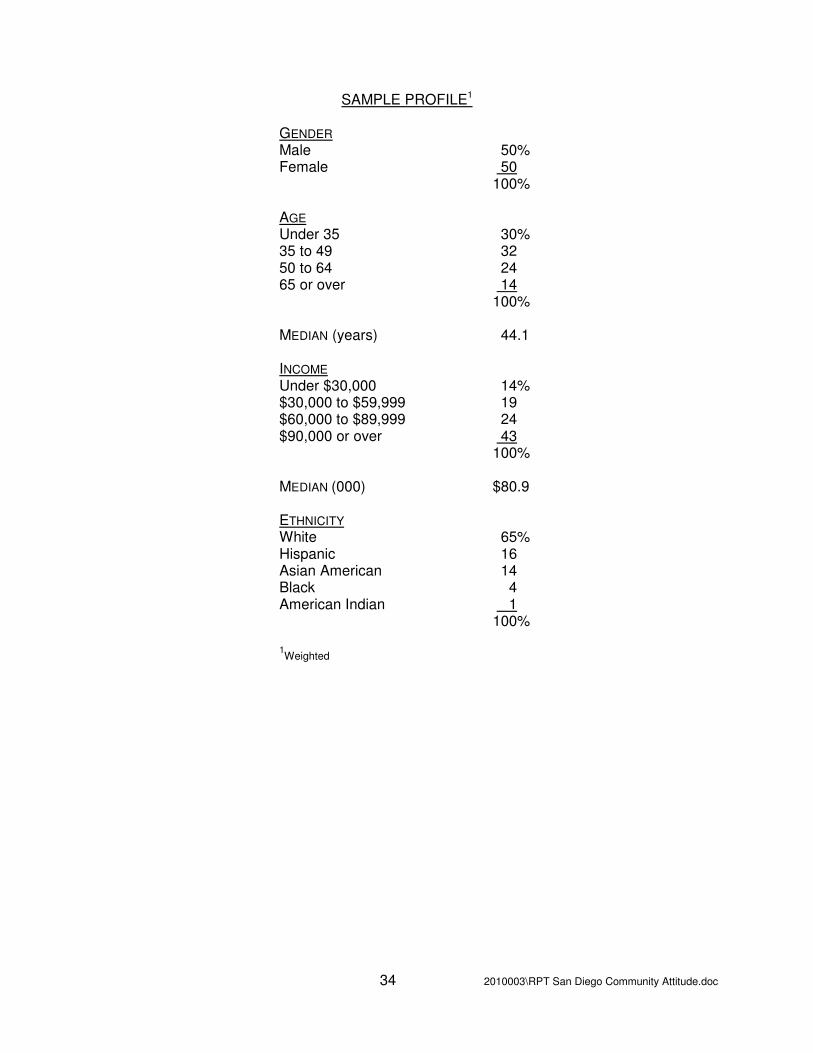
SAMPLE PROFILE1
GENDER Male 50% Female 50 100% AGE Under 35 30% 35 to 49 32 50 to 64 24 65 or over 14 100% MEDIAN (years) 44.1 INCOME Under $30,000 14% $30,000 to $59,999 19 $60,000 to $89,999 24 $90,000 or over 43 100% MEDIAN (000) $80.9 ETHNICITY White 65% Hispanic 16 Asian American 14 Black 4 American Indian 1 100% 1Weighted

2010003\QUE San Diego Community Attitude Survey - 2010.wpd **FINAL** April 15, 2010 (11:19AM) Copyright 8 2006. All rights reserved. For information: Behavior Research Center (602) 258-4554. Page: 1
BEHAVIOR RESEARCH CENTER, INC. CITY OF SAN DIEGO JOB ID 2010003 45 East Monterey Way COMMUNITY ATTITUDE SURVEY Phoenix, AZ 85012 RESIDENTS= OPINIONS ON CITY SERVICES (602) 258-4554 Spring 2010
Hello, my name is and I'm with the Behavior Research Center. We're conducting a survey among San
Diego residents on City services and I'd like to speak with you for a few minutes.
A. Is your residence located within the San Diego city limits?
IF YES: CONTINUE IF NO: THANK AND TERMINATE
B. And are you the (male/female) head of your household?
IF YES: CONTINUE IF NO: ASK TO SPEAK WITH MALE/FEMALE HEAD, RE INTRODUCE YOURSELF AND CONTINUE. IF NONE AVAILABLE, ARRANGE CALLBACK.
Male...1 Female...2
1. To begin, would you say you strongly agree, agree, disagree or strongly
disagree with the following statement, "Overall, San Diego is a good place to live."
Strongly agree...1 Agree...2 Disagree...3 Strongly disagree...4 Not sure...5
2. On the whole, would you say that the quality of life in the City of San Diego is
excellent, good, fair or poor? Excellent...1
Good...2Fair...3
Poor...4Not sure...5
3. How likely are you to do each of the following B very likely, somewhat likely, somewhat unlikely or very unlikely?
Very Somewhat Somewhat Very Not Likely Likely Unlikely Unlikely Sure
A. Recommend living in San Diego to someone who asked ......1 2 3 4 5 B. Remain in San Diego for the next five years ..........................1 2 3 4 5
4. Next, what do you think is the most serious issue facing the residents of San
Diego, with respect to services provided by the City, that you would like to see City government do something about? (PROBE)
________
________
________

2010003\QUE San Diego Community Attitude Survey - 2010.wpd **FINAL** April 15, 2010 (11:19AM) Copyright 8 2006. All rights reserved. For information: Behavior Research Center (602) 258-4554. Page: 2
5. As you know, the City of San Diego provides various services to the community. On a scale of 1 to
4 where 1 means you think a service is not essential, and 4 means you think a service is absolutely essential, how essential do you feel each of the following City services are? (ROTATE)
Rating
A. Police services................................................................................................................................................. B. Fire services .................................................................................................................................................... C. Emergency medical services........................................................................................................................... D. Lifeguard services at the beaches................................................................................................................... E. Fire prevention programs ................................................................................................................................ F. Branch libraries................................................................................................................................................ G. Existing main library downtown ....................................................................................................................... H. Homeless services........................................................................................................................................... I. Art and cultural programs ................................................................................................................................ J. Parks and recreation programs ....................................................................................................................... K. Maintenance of beaches and parks ................................................................................................................ L. Graffiti removal ................................................................................................................................................ M. Neighborhood code enforcement .................................................................................................................... N. Street and sidewalk maintenance.................................................................................................................... O. Pollution prevention in oceans and bays......................................................................................................... P. Residential trash collection services................................................................................................................ Q. Residential recycling services .........................................................................................................................
6. Next, would you say you are very satisfied, satisfied,
dissatisfied or very dissatisfied with each of the following in San Diego? (ROTATE)
Very Very Dis- Dis- Not Satisfied Satisfied Satisfied Satisfied Sure
A. Branch library service hours .............................................. 1 2 3 4 5 B. Programs at branch libraries ............................................. 1 2 3 4 5 C. Recreation center service hours........................................ 1 2 3 4 5 D. Programs at recreational centers ...................................... 1 2 3 4 5 E. Service hours at existing main library downtown .............. 1 2 3 4 5 F. Programs at existing main library downtown..................... 1 2 3 4 5 G. Arts and cultural programs ................................................ 1 2 3 4 5 H. Beach lifeguard services ................................................... 1 2 3 4 5 I. Cleanliness of beaches ..................................................... 1 2 3 4 5 J. Maintenance of parks and its facilities............................... 1 2 3 4 5 K. Condition of neighborhood sidewalks................................ 1 2 3 4 5 L. Condition of city streets ..................................................... 1 2 3 4 5 M. Frequency of street sweeping ........................................... 1 2 3 4 5 N. Police response to calls for service ................................... 1 2 3 4 5 O. Fire response to calls for service....................................... 1 2 3 4 5 P. Tree maintenance on public property................................ 1 2 3 4 5 Q. Efforts to eliminate graffiti .................................................. 1 2 3 4 5 R. Efforts to address homelessness ...................................... 1 2 3 4 5 S. Trash collection services ................................................... 1 2 3 4 5 T. Recycling collection services............................................. 1 2 3 4 5 U. Flood control efforts........................................................... 1 2 3 4 5 V. Downtown parking availability ........................................... 1 2 3 4 5 W. Parking availability in your neighborhood.......................... 1 2 3 4 5 X. Parking enforcement efforts .............................................. 1 2 3 4 5 Y. Street lighting..................................................................... 1 2 3 4 5

2010003\QUE San Diego Community Attitude Survey - 2010.wpd **FINAL** April 15, 2010 (11:19AM) Copyright 8 2006. All rights reserved. For information: Behavior Research Center (602) 258-4554. Page: 3
6a. Now I=d like to quickly read the list again, but this time please tell me if each is one you would or would not be willing to pay more for through increased taxes or fees in order to maintain or avoid further cuts. (ROTATE)
Would Not Would Not Sure
A. Branch library service hours .............................................................................. 1 2 3 B. Programs at branch libraries.............................................................................. 1 2 3 C. Recreation center service hours ........................................................................ 1 2 3 D. Programs at recreational centers....................................................................... 1 2 3 E. Service hours at existing main library downtown............................................... 1 2 3 F. Programs at existing main library downtown ..................................................... 1 2 3 G. Arts and cultural programs................................................................................. 1 2 3 H. Beach lifeguard services .................................................................................... 1 2 3 I. Cleanliness of beaches ...................................................................................... 1 2 3 J. Maintenance of parks and its facilities ............................................................... 1 2 3 K. Condition of neighborhood sidewalks ................................................................ 1 2 3 L. Condition of city streets...................................................................................... 1 2 3 M. Frequency of street sweeping............................................................................ 1 2 3 N. Police response to calls for service.................................................................... 1 2 3 O. Fire response to calls for service ....................................................................... 1 2 3 P. Tree maintenance on public property ................................................................ 1 2 3 Q. Efforts to eliminate graffiti................................................................................... 1 2 3 R. Efforts to address homelessness....................................................................... 1 2 3 S. Trash collection services.................................................................................... 1 2 3 T. Recycling collection services ............................................................................. 1 2 3 U. Flood control efforts ........................................................................................... 1 2 3 V. Downtown parking availability............................................................................ 1 2 3 W. Parking availability in your neighborhood .......................................................... 1 2 3 X. Parking enforcement efforts............................................................................... 1 2 3 Y. Street lighting ..................................................................................................... 1 2 3
7. Next, would you rate each of the following as excellent,
good, fair or poor? (ROTATE) Excel- Not lent Good Fair Poor Sure
A. The value of services you receive for the taxes you pay .......1 2 3 4 5 B. The overall direction the City is taking....................................1 2 3 4 5 C. The job the City does listening to citizens ..............................1 2 3 4 5 D. The job the City does delivering services to residents ...........1 2 3 4 5
8. Next, how would you rate the safety of your neighborhood? Would you say
your neighborhood is... (READ EACH EXCEPT ANOT SURE@) Very safe...1
Somewhat safe...2 Somewhat unsafe...3
Very unsafe...4 Not sure...5
9. How about the safety of the City of San Diego as a whole? Would you say
it is...(READ EACH EXCEPT ANOT SURE@) Very safe...1
Somewhat safe...2Somewhat unsafe...3
Very unsafe...4Not sure...5

2010003\QUE San Diego Community Attitude Survey - 2010.wpd **FINAL** April 15, 2010 (11:19AM) Copyright 8 2006. All rights reserved. For information: Behavior Research Center (602) 258-4554. Page: 5
10. Next, as you are probably aware, the City of San Diego is currently dealing with a significant budget deficit. To
solve this problem other cities have implemented a variety of strategies. I=d like to describe several of them to you and then have you tell me if you strongly approve, approve, disapprove or strongly disapprove of each. (ROTATE A-E)
Strongly Strongly Not
Approve Approve Disapprove Disapprove Sure
A. Generate new revenue through increased fees to help avoid service reductions ................................. 1 2 3 4 5
B. Generate new revenue through increased taxes to help avoid service reductions ................................. 1 2 3 4 5
C. Eliminate or further reduce City services .................... 1 2 3 4 5 D Further reductions to City employee salaries and
benefits ....................................................................... 1 2 3 4 5 E. Use more private contractors, implement managed
competition.................................................................. 1 2 3 4 5 F. Combination of new revenues and service cuts ......... 1 2 3 4 5
10a. Do you have any other suggestions on how the City could reduce its budget deficit?
11. Next, do you rely a lot, some, only a little, or not at all on
each of the following for information about the City of San Diego?
A Only a Not Not Lot Some Little At All Sure
A. Print newspapers .......................................................................... 1 2 3 4 5 B. Online newspapers ....................................................................... 1 2 3 4 5 C. Television news programs............................................................ 1 2 3 4 5 D. Radio news programs................................................................... 1 2 3 4 5 E. The City=s web site ....................................................................... 1 2 3 4 5 F. The City=s cable tv channel........................................................... 1 2 3 4 5
A. Now before I finish, I need a few pieces of information about yourself for
classification purposes only. First, which of the following categories comes closest to your age? (READ EACH EXCEPT REFUSED)
Under 25...1 25 to 34...2 35 to 49...3 50 to 64...4 65 or over...5 (DO NOT READ) Refused...6
B. How many years have you lived in the City of San Diego? YEARS___________ C. Which of the following categories best describes your ethnic
origin? (READ EACH EXCEPT REFUSED)
Hispanic or Latino...1 White, non-Hispanic...2 African American or Black, non-Hispanic...3 Asian or Pacific Islander...4 American Indian or Native American..5or another Ethnic Group(SPECIFY) ...6
(DO NOT READ) Refused...7

2010003\QUE San Diego Community Attitude Survey - 2010.wpd **FINAL** April 15, 2010 (11:19AM) Copyright 8 2006. All rights reserved. For information: Behavior Research Center (602) 258-4554. Page: 5
D. And finally, was your total family income for last year, I mean before taxes and including everyone in your household, under or over $60,000?
UNDER $60,000 Was it under $30,000...1 or over $30,000...2 Refused...3 OVER $60,000 Was it under $90,000...4 or $90,000 or over...5 Refused...6 REFUSED OVERALL.........7
Thank you very much, that completes this interview. My supervisor may want to call you to verify that I conducted
this interview so may I have your first name in order that he/she may do so? (VERIFY PHONE NUMBER)
NAME: PHONE #: ______
FROM SAMPLE: ZIP CODE: