Embed Size (px)
Citation preview

Qualcomm Stadium:Business and Facility Assessment Plan
Audit Committee MeetingJune 6, 2011
June 6, 2011
Benchmark Stadiums
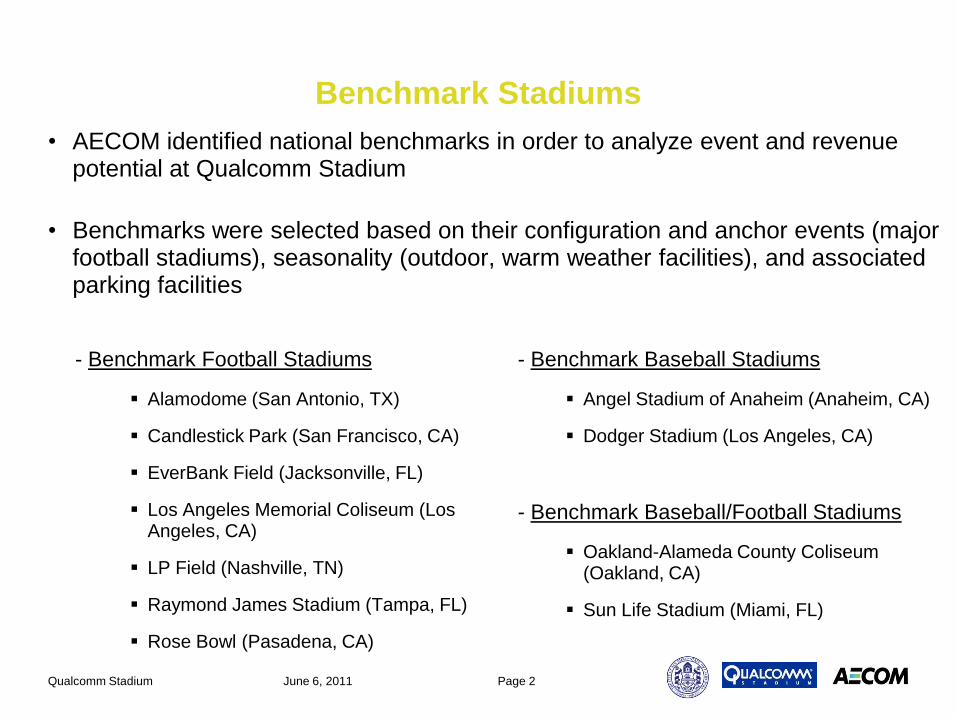
• AECOM identified national benchmarks in order to analyze event and revenue potential at Qualcomm Stadium
• Benchmarks were selected based on their configuration and anchor events (major football stadiums), seasonality (outdoor, warm weather facilities), and associated parking facilities
Qualcomm Stadium Page 2
- Benchmark Football Stadiums
Alamodome (San Antonio, TX)
Candlestick Park (San Francisco, CA)
EverBank Field (Jacksonville, FL)
Los Angeles Memorial Coliseum (Los Angeles, CA)
LP Field (Nashville, TN)
Raymond James Stadium (Tampa, FL)
Rose Bowl (Pasadena, CA)
- Benchmark Baseball Stadiums
Angel Stadium of Anaheim (Anaheim, CA)
Dodger Stadium (Los Angeles, CA)
- Benchmark Baseball/Football Stadiums
Oakland-Alameda County Coliseum (Oakland, CA)
Sun Life Stadium (Miami, FL)
June 6, 2011
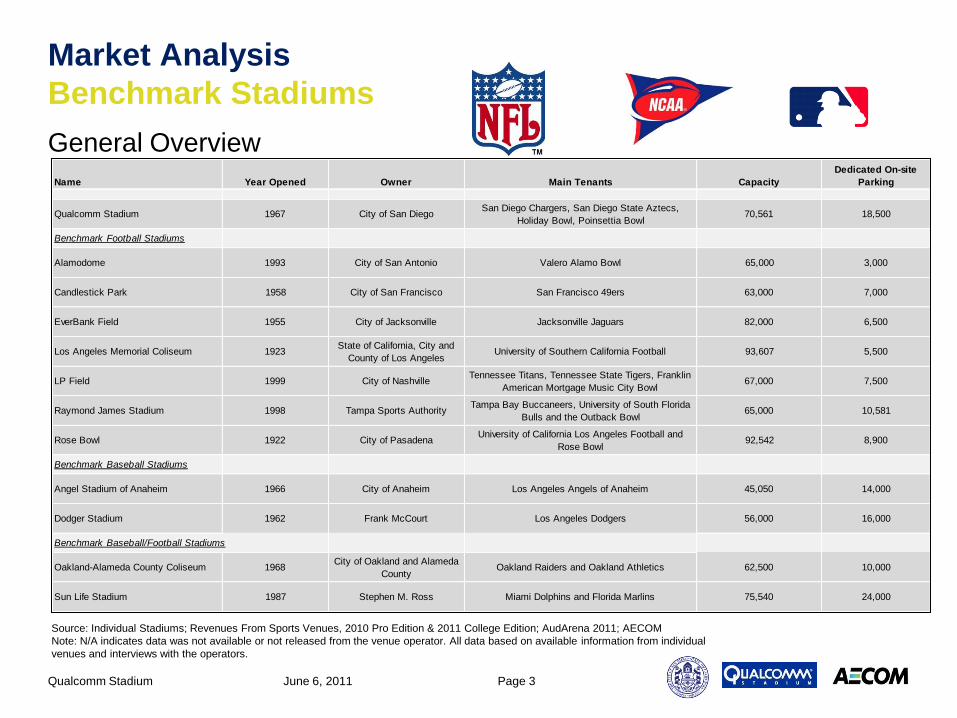
Market Analysis
Benchmark Stadiums
General Overview
Qualcomm Stadium Page 3
Source: Individual Stadiums; Revenues From Sports Venues, 2010 Pro Edition & 2011 College Edition; AudArena 2011; AECOM
Note: N/A indicates data was not available or not released from the venue operator. All data based on available information from individual
venues and interviews with the operators.
Name Year Opened Owner Main Tenants Capacity
Dedicated On-site
Parking
Qualcomm Stadium 1967 City of San DiegoSan Diego Chargers, San Diego State Aztecs,
Holiday Bowl, Poinsettia Bowl70,561 18,500
Benchmark Football Stadiums
Alamodome 1993 City of San Antonio Valero Alamo Bowl 65,000 3,000
Candlestick Park 1958 City of San Francisco San Francisco 49ers 63,000 7,000
EverBank Field 1955 City of Jacksonville Jacksonville Jaguars 82,000 6,500
Los Angeles Memorial Coliseum 1923State of California, City and
County of Los AngelesUniversity of Southern California Football 93,607 5,500
LP Field 1999 City of NashvilleTennessee Titans, Tennessee State Tigers, Franklin
American Mortgage Music City Bowl67,000 7,500
Raymond James Stadium 1998 Tampa Sports AuthorityTampa Bay Buccaneers, University of South Florida
Bulls and the Outback Bowl65,000 10,581
Rose Bowl 1922 City of PasadenaUniversity of California Los Angeles Football and
Rose Bowl92,542 8,900
Benchmark Baseball Stadiums
Angel Stadium of Anaheim 1966 City of Anaheim Los Angeles Angels of Anaheim 45,050 14,000
Dodger Stadium 1962 Frank McCourt Los Angeles Dodgers 56,000 16,000
Benchmark Baseball/Football Stadiums
Oakland-Alameda County Coliseum 1968City of Oakland and Alameda
CountyOakland Raiders and Oakland Athletics 62,500 10,000
Sun Life Stadium 1987 Stephen M. Ross Miami Dolphins and Florida Marlins 75,540 24,000
June 6, 2011

Market Analysis
(Industry Trends)
Other In-Stadium Non-Anchor Events
– Qualcomm Stadium hosts approximately 8 in-stadium non-anchor tenant events annually
– The average in-stadium non-anchor tenant events hosted per benchmark market is between 5 and 6 events
– Qualcomm Stadium is performing above the market average other than the Alamodome, which is removed from this section because it operates more like an arena than a stadium, suggesting there may be limited opportunity to drive additional large scale non-anchor events to Qualcomm Stadium
Qualcomm Stadium Page 4
Note: LA Market considers the average of the LA Coliseum, Rose Bowl, Angel Stadium, and Dodger Stadium and the SF-Oakland market considers
the average of Candlestick Park and the Oakland-Alameda Coliseum. Alamodome removed from Other In-Stadium Non-Anchor Events, because it
operates more like an arena than a stadium in this respect.
0
1
2
3
4
5
6
7
8
9
Qualcomm Stadium LA Market SF-Oakland MarketEverBank Field Raymond James Stadium
LP Field Sun Life Stadium Average
Average Annual Non-Anchor In-Stadium Events
June 6, 2011

Market Analysis
(Industry Trends)
Annual Parking Lot Events
– The benchmark stadiums host an average of 47 parking lot events annually
– Qualcomm Stadium , with an average of over 200 parking lot events annually, significantly outperforms the benchmarks in terms of generating on-site events in its parking on non-stadium event days
Qualcomm Stadium Page 5
Note: LA Market considers the average of the LA Coliseum, Rose Bowl, Angel Stadium, and Dodger Stadium and the SF-Oakland market considers
the average of Candlestick Park and the Oakland-Alameda Coliseum. Sun Life Stadium removed from analysis as venue operator would not release
data specific to parking lot operations.
0
50
100
150
200
250
300
Qualcomm Stadium
LA Market SF-Oakland Market
EverBank FieldRaymond James Stadium
LP Field Alamodome Sun Life Stadium Average
Average Annual Parking Lot Events
June 6, 2011

Market Analysis
(Summary)Parking Lot Events
– AECOM surveyed industry leading car dealerships and promoters of ride and drive events in the Southern California region regarding parking lot events at Qualcomm Stadium
– Many of those surveyed have utilized Qualcomm Stadium’s parking lot for events or have attended a parking lot event at the stadium
Summary of Interview Findings
– Qualcomm Stadium’s parking lot is an asset (best parking lot site on the West Coast)
– Qualcomm Stadium has a reputation of setting up “exclusives” with certain vendors
– Need to market to major users (Ride and Drive, Vehicular Sales, Fairs / Festivals, etc.)
– Users need to be able to have access to utilities, catering, security
– Parking lot needs some repair to make it first class
– Large ride and drive events could generate approximately $10,000 per day
– Vehicular sales events have potential to generate a minimum of $6,500 per day depending on market conditions
Qualcomm Stadium Page 6June 6, 2011

Market Analysis
(Summary)
Recommendations
– AECOM recommends that Qualcomm Stadium replaces the current parking lot rate card, which sets specific lease rates for events and binds the City to those rates, with one that only sets minimums and allows for more pricing flexibility
– A rate card that only sets minimums will allow for clarity and efficiency, but also enable Qualcomm to increase the price of events where the market allows it
– Such a system will allow for market based pricing on an event by event basis to achieve higher rates where possible
– Qualcomm’s rate card allows for operational efficiency (staff do not have to price every event) and clarity to event promoters
Qualcomm Stadium Page 7June 6, 2011

Market Analysis
(Summary)
Recommendations
– Below are the recommended minimum rates per event type for Parking Lot events at Qualcomm Stadium
– Based on pricing and event mix at the benchmarks and discussions with promoters of major parking lot events in Southern California, the minimum price per event for Qualcomm parking lot events could be set at the minimum is noted above.
– This will allow Qualcomm to drive more revenue per event but remain competitively priced within the market and not sacrifice its existing competitive pricing advantage
Qualcomm Stadium Page 8
Parking Lot Event Current Maximum Rates Recommended Minimums
Non-Profit Weekday $1,000 $1,200
Non-Profit Weekend $2,000 $2,400
For Profit Weekday $2,000 $2,750
For Profit Weekend $4,000 $5,500
Commercial Events $5,000 $7,000
Event Parking (per car) $15 $20
Event Parking (per RV) $46 $60
June 6, 2011

Financial Analysis
Introduction• AECOM analyzed the historic and current operations of Qualcomm Stadium based on
data received from the City of San Diego, discussions with Stadium management, interviews with San Diego venues and national benchmark stadiums, and the firm’s extensive experience in the sports and entertainment industry
Three Scenarios
• AECOM analyzed Qualcomm Stadium’s operating profile from three scenarios over a 10-year period:
Scenario 1: Chargers stay at Qualcomm Stadium
– Assumed that the Chargers, SDSU, Poinsettia Bowl and Holiday Bowl remain at stadium for the 10 year period
Scenario 2: Chargers leave Qualcomm Stadium after 5 years but stay in San Diego market
– Assumed that the Chargers build a new stadium locally, but remain in Qualcomm Stadium for the next five years until the Stadium is completed. During the initial five years, SDSU, Poinsettia Bowl and Holiday Bowl also remain at Qualcomm Stadium. Upon opening of the new Stadium, the Chargers, SDSU, Poinsettia Bowl and Holiday Bowl all move to the new San Diego venue
Scenario 3: Chargers leave Qualcomm Stadium and San Diego market immediately
– Assumed that the Chargers build a new stadium outside of the SD market and immediately vacate Qualcomm Stadium to play their games at a stadium in their new market. All other tenants remain at Qualcomm.
Qualcomm Stadium Page 9June 6, 2011

• The illustrative lease agreement above, which was discussed and reviewed with the City of San Diego and Qualcomm Stadium staff, provides a snapshot of the assumed rents and percentages of revenue retained by the City of San Diego / Qualcomm Stadium for each event type
• Assumed the same lease terms in all 3 scenarios
Financial Analysis
Assumed Lease Terms
Qualcomm Stadium Page 10
Rental Rates (Stadium/City receives)
Base Net General Ticketmaster Net Net Net
Revenue/Event Rent Tickets Royalties Concessions Novelties Parking
Anchor Tenants
San Diego Chargers (Regular
Season)1 $2,500,000 0.0% $0.25/ticket 0.0% 0.0% 0.0%
San Diego Chargers (Preseason)1
San Diego State Aztecs2 $1.00/ticket 0.0% $0.00 0.0% 0.0% 0.0%
Other Stadium Events
Poinsettia Bowl $10,000 0% $0.00 100% 100% 100%
Holiday Bowl $10,000 0% $0.25/ticket 100% 100% 100%
Major Concerts N/A 10% $0.00 100% 100% 100%
Minor Concerts N/A 10% $0.00 100% 100% 100%
International Soccer N/A 10% $0.25/ticket 100% 100% 100%
Dirt Events N/A 10% $0.25/ticket 100% 100% 100%
Miscellaneous (Stadium) N/A 10% $0.00 100% 100% 100%
High School Sports N/A 10% $0.00 100% 100% 100%
Other Sports
Auto Events3 $211,000 0% $0.00 100% 100% 100%
Parking Lot Concerts N/A 10% $0.00 100% 100% 100%
Misc/Comm Film (Parking Lot)3 $5,500 0% $0.00 100% 100% 100%1Chargers Rent (for 10 games including Preseason and Regular Season, but no Playoffs) assumed at $2.5 million annually (2004-2012); $3.0 million annually
(2013-2016); $4.0 million annually (2017-2020).
2SDSU Rent also includes repayment by SDSU to City of San Diego of all operational expenses for gameday operations.3SDAC pays an annual rent of $211,000 for use of the parking lot. In addition, based on average rents received for analyzed historical Qualcomm Stadium parking
lot events, an average per event rent $3,500, for non-SDAC events was assumed.
Note: Percentages shown in table are those retained by Qualcomm Stadium. Assumed that the remainder goes to act/promoter
June 6, 2011

• AECOM estimated the annual in-stadium events at Qualcomm Stadium for each of the three scenarios
• Scenario 1 (Chargers stay at Qualcomm Stadium): Qualcomm Stadium operates at its current level hosting approximately 24 events annually over the next 10 years (2011-2020)
• Scenario 2 (Chargers leave Qualcomm Stadium after 5 years but stay in San Diego market): Between 2011-2015, Qualcomm Stadium hosts the same number of events. However, between 2016-2020, with the assumed departure of the Chargers, SDSU, Poinsettia Bowl and Holiday Bowl, it is assumed that on-site events will drop to 4
• Scenario 3 (Charger leave Qualcomm Stadium and San Diego market immediately): With the immediate departure of the Chargers, Qualcomm Stadium will lose 10 guaranteed events annually, however, it is estimated that it will still host a total of 14 with the retention of SDSU and the Poinsettia and Holiday Bowls
Financial Analysis
Event Estimate
Qualcomm Stadium Page 11
0
10
20
30
2011-2020 2011-2015 2016-2020 2011-2020
Scenario 1 Scenario 2 Scenario 3
24 24
4
14
In-Stadium Events
June 6, 2011

• AECOM estimated the annual parking lot events at Qualcomm Stadium for each of the three scenarios
• It is assumed that there may be multiple parking lot events in a single day. Therefore, 242 parking lot events does not equate to 242 individual days of parking lot events, but more likely 200 or less.
• Scenario 1 (Chargers stay at Qualcomm Stadium): Qualcomm Stadium operates at its current level hosting approximately 242 parking lot events annually over the next 10 years (2011-2020)
• Scenario 2 (Chargers leave Qualcomm Stadium after 5 years but stay in San Diego market): Between 2011-2015, Qualcomm Stadium hosts the same number of events. However, between 2016-2020, with the assumed departure of the Chargers, SDSU, Poinsettia Bowl and Holiday Bowl, it is assumed that annual on-site parking lot events will increase, as there will be fewer days (especially prime weekends) lost to in-stadium event parking
• Scenario 3 (Charger leave Qualcomm Stadium and San Diego market immediately): With the immediate departure of the Chargers, Qualcomm Stadium will gain 10 weekend days annually during which parking lot events can be hosted, increasing the opportunity to drive events to the lot during those times
Financial Analysis
Event Estimate
Qualcomm Stadium Page 12
200
225
250
275
300
2011-2020 2011-2015 2016-2020 2011-2020
Scenario 1 Scenario 2 Scenario 3
242 242
259 259
Parking Lot Events
June 6, 2011
• AECOM estimated the annual operating profile for Qualcomm Stadium for each of the three scenarios
• Scenario 1: Chargers stay at Qualcomm Stadium (2011-2020)
– Revenues are projected to increase from an average of approximately $7.8 million annually (2011-2015) to $9.2 million annually (2016-2020), due to the increases in Chargers Rent as outlined in the Lease Agreement with the City of San Diego
• For 10 games including Preseason and Regular Season, but no Playoffs, the Chargers pay a rent of $2.5 million annually (2004-2012); $3.0 million annually (2013-2016); $4.0 million annually (2017-2020)
• City receives an early termination fee per Charger contract
– Expenses are projected to increase at a market average of 2.5% annually from their current level of $18.4 million in the first five years (2011-2015) to $20.8 million in the last five years (2016-2020) of Scenario 1
– The deficit from operations (excluding bond debt service) is assumed to increase from approximately $10.6 million annually to $11.6 million annually between 2011-2020
Financial Analysis
Projected Operating Profile
Qualcomm Stadium Page 13June 6, 2011

• Scenario 2: Chargers leave Qualcomm Stadium after 5 years (after 2015 NFL season) but stay in San Diego market
– After remaining static for the first five years, revenues are projected to decrease from $7.8 million annually (2011-2015) to $1.8 million annually (2016-2020), due to the loss of rent from the Chargers, SDSU, the Holiday Bowl and the Poinsettia Bowl and other large scale stadium events such as dirt shows and concerts, which are assumed to go to the new building in the San Diego market
• The fees received for the Chargers early termination would be in addition to these revenues
– After remaining static for the first five years, expenses are projected to decrease from their current level of $18.4 million in the first five years (2011-2015) to $15.6 million in the last five years (2016-2020) due to a lower operating cost based on fewer events
• Costs such as security and other general maintenance are assumed to continue throughout the year despite the assumed loss of tenants between 2016-2020 in Scenario 2. These adjustments to expenses have been incorporated into the projections
– The deficit from operations (excluding bond debt service) is assumed to increase from approximately $10.6 million annually to $13.8 million annually between 2011-2020
Financial Analysis
Projected Operating Profile
Qualcomm Stadium Page 14June 6, 2011

• Scenario 3: Chargers leave Qualcomm Stadium and San Diego market immediately
– With the immediate departure of the Chargers but retention of SDSU, the Poinsettia Bowl and Holiday Bowl, as well as an increase in parking lot events, revenues are projected at approximately $5.0 million to $5.3 million annually over the next 10 years (2011-2020)
• The fees received for the Chargers early termination would be in addition to these revenues
– Expenses are projected to increase at a market average of 2.5% annually from their current level of $15.6 million in the first five years (2011-2015) to $17.7 million in the last five years (2016-2020) of Scenario 3
• Costs such as security and other general maintenance are assumed to continue throughout the year despite the assumed loss of tenants between 2011-2020 in Scenario 3. These adjustments to expenses have been incorporated into the projections
– The deficit from operations (excluding bond debt service) is assumed to increase from approximately $10.6 million annually to $12.4 million annually between 2011-2020
Financial Analysis
Projected Operating Profile
Qualcomm Stadium Page 15June 6, 2011

Financial Analysis
Projected Operating Profile
Qualcomm Stadium Page 16
Source: AECOM
Note: Assumed annual inflation on expenses of 2.5%. Estimates are based on AECOM’s analysis of the historic and current operations of Qualcomm Stadium based on data received from the City of San Diego (specifically 2006-2010 revenues and expenses to the building), discussions with Stadium management, interviews with San Diego venues and national benchmark stadiums, and the firm’s extensive experience in the sports and entertainment industry
• The fees received for the Chargers early termination would be in addition to the revenues in each Scenario
Scenario 1 Scenario 2 Scenario 3
Qualcomm Stadium Operations Chargers Stay Chargers Leave; Stay in SD Chargers leave SD
(Annual Averages) 2011-2015 2016-2020 2011-2015 2016-2020 2011-2015 2016-2020
Number of Events 266 266 266 263 273 273
In-Stadium 24 24 24 4 14 14
Parking Lot 242 242 242 259 259 259
Annual Paid Attendance (000) 1,051 1,051 1,051 84 405 405
Operating Revenues (000)
Rental Revenues (000) $4,464 $5,604 $4,464 $1,183 $1,665 $1,709
Other Revenues (000) $3,340 $3,594 $3,340 $653 $3,344 $3,601
Total Operating Revenues (000) $7,803 $9,199 $7,803 $1,835 $5,009 $5,310
Total Operating Expenses (000) $18,386 $20,802 $18,386 $15,601 $15,628 $17,681
Surplus / Deficit from Operations (000) ($10,582) ($11,603) ($10,582) ($13,766) ($10,619) ($12,372)
June 6, 2011

Financial Analysis
Projected Operating Profile
Qualcomm Stadium Page 17
Source: AECOM
Note: Estimates are based on AECOM’s analysis of the historic and current operations of Qualcomm Stadium based on data received from the City of San Diego (specifically 2006-2010 revenues and expenses to the building), discussions with Stadium management, interviews with San Diego venues and national benchmark stadiums, and the firm’s extensive experience in the sports and entertainment industry
Explanation of Scenarios:Scenario 1: Chargers stay at Qualcomm StadiumScenario 2: Chargers leave Qualcomm Stadium after 5 years but stay in San Diego marketScenario 3: Chargers leave Qualcomm Stadium and San Diego market immediately
$0
$2,500
$5,000
$7,500
$10,000
2011-2015 2016-2020 2011-2015 2016-2020 2011-2015 2016-2020
Scenario 1 Scenario 2 Scenario 3
$7,803
$9,199
$7,803
$1,835
$5,009 $5,310
Total Operating Revenues (000)
June 6, 2011

Financial Analysis
Projected Operating Profile (Conclusion)
• This analysis is solely on the basis of the Operations of Qualcomm Stadium and does not make any judgment on the relative economic impact to the region with or without a major anchor tenant at Qualcomm Stadium or within the San Diego market area
• Qualcomm Stadium operating at a loss is not a unique example of a major stadium with an NFL franchise operating at a deficit and receiving city funding
– Many city-operated, NFL buildings receive some form of public funding on an annual basis
• For example, Oakland Alameda Coliseum, which receives approximately $14 million annually, and Raymond James Stadium, which receives approximately $3 million from a combination of City and County funds
Qualcomm Stadium Page 18June 6, 2011

Financial Analysis
Recommendations
• Based on the Market and Financial Analysis, AECOM has identified the following four areas, in which the City of San Diego may be able to enhance revenues at Qualcomm Stadium
– Current lease arrangements with Holiday Bowl and Poinsettia Bowl
– Ticket distribution deals
– Marketing opportunities with the Gridiron Stadium Network
– Parking lot pricing and events
Qualcomm Stadium Page 19June 6, 2011

Financial Analysis
Recommendations (Current Lease Arrangements)
• Holiday Bowl and Poinsettia Bowl Leases– Renegotiate leases, which ended with 2010 games
– Currently, the City receives payment of operational expenses and all revenue from sale of concessions and 100% of parking lot fees in addition to the $10,000 per game rent charge
– Particular area for enhancement is the facility fee
• Current lease agreement clause states – “City is granted the right to charge a per ticket facility fee for both games. City and Association will use their best efforts to mutually agree to the amount of any facility fee charged.”
• A facility fee of $1.00 - $2.00 would generate up to $200,000 in additional revenue, based on the current combined attendance to the two games
For example, Raymond James Stadium receives a ticket surcharge in addition to payback of operational expenses for the Outback Bowl
– Rental rate
• After examination of the Bowl Association Agreement with the City of San Diego, AECOM believes there is room to increase rent, food and beverage shares and commissions in the new lease
Qualcomm Stadium Page 20June 6, 2011

Financial Analysis
Recommendations (Ticket Distribution Deals)
• Qualcomm Stadium currently receives an estimated 4% of gross customer convenience fees from Ticketmaster for events subject to the City Royalty
• Although no two venues have exact ticket distribution deals, based on discussions with other venues and industry professionals, Qualcomm Stadium is receiving below market average fees from their current arrangement
• Among the selected benchmark venues, ticket royalties paid to the building owner range up to 8% of customer convenience fees.
– Based on the current agreement with Ticketmaster, the City of San Diego receives $0.25/ticket sold by Ticketmaster, and that fee only applies to Chargers games, the Holiday Bowl, dirt shows, and international soccer matches
• AECOM recommends adding ticket royalties for the Poinsettia Bowl like those existing for the Holiday Bowl
• Ticket royalties paid to the City for Chargers, Holiday Bowl, Poinsettia Bowl, dirt shows, soccer games should be increased to $0.50/ticket to bring Qualcomm Stadium’s agreement with Ticketmaster closer to market rates
Qualcomm Stadium Page 21June 6, 2011

Financial Analysis
Recommendations (Gridiron Stadium Network)
– AECOM reviewed other marketing opportunities for bringing events to Qualcomm Stadium such as the Gridiron Stadium Network (GSN) and analyzed its value to the City of San Diego
• Other venue marketing networks (such as Venue Coalition for arenas) and event and venue operators (such as AEG) exist. However, GSN deemed most appropriate and applicable for Qualcomm based on building type and operational structure
Overview of Gridiron Stadium Network
– Founded in 2005, network of 10 NFL stadiums and 1 Major League Soccer (MLS) stadium
– Optimize opportunities to increase stadium events and attendance
– Knowledge sharing
– $15,000 annual fee
• Annual meeting
• Conference calls
• Training
• Extended network
– Since 2005, GSN has co-promoted 19+ 100% capacity concerts in member stadiums
Qualcomm Stadium Page 22June 6, 2011

Financial Analysis
Recommendations (Parking Lot Events and Pricing)
• Based on the Market Analysis, the Benchmark Venues and Parking Lots, AECOM concluded the following:
– Qualcomm Stadium significantly outperforms the benchmarks in terms of generating on-site events in its parking on non-stadium event days
– However, Qualcomm Stadium has a tighter range and less differentiation in pricing by event type in its parking lot lease rates than the other benchmarks
– Only three of the 11 identified benchmarks use rate cards
– Based on the discussions with parking lot event promoters and analysis of the benchmarks including population per available venue, supporting household income and on-site dedicated parking lot capacity, AECOM believes Qualcomm Stadium has the opportunity to drive more revenue from its parking lots on a per event basis
– Qualcomm is performing significantly above the industry average for Parking Lot Events, but on average leases the lot at a lower cost than other facilities, suggesting there may be room to broaden the range of event pricing and price more on market demand as opposed to a predetermined rate
Qualcomm Stadium Page 23June 6, 2011

Financial Analysis
Recommendations (Parking Lot Events and Pricing)
• Qualcomm Stadium should consider the following:
– Broaden the range of pricing by event type
• All of the price ranges for the identified benchmarks are wider than Qualcomm’s evidenced by the benchmarks with rate cards
• The average price per parking lot event at the benchmark is approximately $3,000 whereas Qualcomm’s average is closer to $2,500 per event
– Price on an event by event, market-driven basis as opposed to a set rate card
• Only 3 of the 11 national benchmarks, as well as Del Mar Racetrack in San Diego, have rate cards (see Appendix for rate cards)
• The other 8 benchmarks price parking lot events on a per event basis
• Based on discussions with venue operators, the per event pricing allows for greater flexibility in pricing
– Important to note that Qualcomm has significantly more events than any of the other benchmarks, which may in part be a result of the lower pricing per event
• Raising pricing will not necessarily allow Qualcomm to maintain the current number of events it generates
Qualcomm Stadium Page 24June 6, 2011

Financial Analysis
Recommendations (Parking Lot Events and Pricing)• AECOM recommends implementing a rate card that sets minimums and allows for
more pricing flexibility
– Recommended minimum rates are as follows:
– Based on pricing and event mix at the benchmarks and discussions with promoters of major parking lot events in Southern California, AECOM recommends setting the minimum price per event for Qualcomm parking lot events as noted above.
– This will allow Qualcomm to drive more revenue per event but remain competitively priced within the market and not sacrifice the existing competitive pricing advantage
Qualcomm Stadium Page 25
Parking Lot Event Current Maximum Rates Recommended Minimums
Non-Profit Weekday $1,000 $1,200
Non-Profit Weekend $2,000 $2,400
For Profit Weekday $2,000 $2,750
For Profit Weekend $4,000 $5,500
Commercial Events $5,000 $7,000
Event Parking (per car) $15 $20
Event Parking (per RV) $46 $60
June 6, 2011
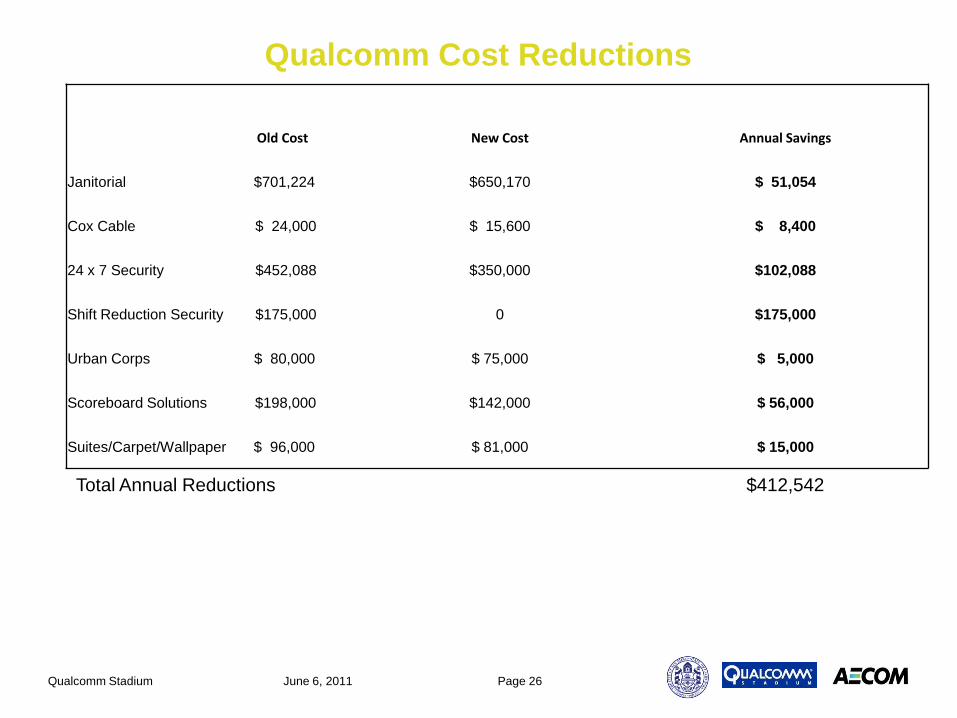
Qualcomm Cost Reductions
Qualcomm Stadium Page 26
Old Cost New Cost Annual Savings
Janitorial $701,224 $650,170 $ 51,054
Cox Cable $ 24,000 $ 15,600 $ 8,400
24 x 7 Security $452,088 $350,000 $102,088
Shift Reduction Security $175,000 0 $175,000
Urban Corps $ 80,000 $ 75,000 $ 5,000
Scoreboard Solutions $198,000 $142,000 $ 56,000
Suites/Carpet/Wallpaper $ 96,000 $ 81,000 $ 15,000
June 6, 2011
Total Annual Reductions $412,542

Revenue Enhancements
Qualcomm Stadium Page 27
Old Rev New Rev Increased Revenues
AT&T Wireless Lease $ 30,000 $ 30,000
Bowl Office Lease $ 57,780 $ 66,168 $ 8,388
Proposed Rate Card Update $1,213,000 $1,385,000$ 172,000
Parking Lot Operator Lease$ 6,000 $ 6,000
SDSU $ 90,000
Verizon Wireless Lease $ 18,000 $ 18,000
Suites/Carpet/Wallpaper $ 96,000 $ 81,000 $ 15,000
June 6, 2011
Total Annual Revenue Increases $324,388
Total – Cost Reductions & Revenue Increases $736,930

Revenue Enhancements
Qualcomm Stadium Page 28June 6, 2011

Qualcomm Stadium Page 29June 6, 2011