Embed Size (px)
Citation preview
Research on natural gas pipeline leakage and ventilation scheme in tunnel
Hongfang Lu1,2, Kun Huang1, Lingdi Fu1, Zhihao Zhang1, Shijuan Wu3, You Lyu4
1 School of Petroleum Engineering, Southwest Petroleum University, Chengdu, Sichuan, China
2Trenchless Technology Center, Louisiana Tech University, Ruston, Louisiana, USA
3 Guangxi Oil Production Plant, Southwest Oil and Gas Company, Sinopec, Deyang, Sichuan, China
4 Nanning Oil & Gas Transmission Sub-Company, PetroChina Southwest Pipeline Company, Nanning, Guangxi, China
Abstract: Due to poor ventilation conditions in the tunnel, if gas pipeline leaks, the consequence of the accident will be
more serious. Therefore, before the emergency repair, gas in the tunnel needs to be excharged so as not to explode during
the repair process. Therefore, it is necessary to study the ventilation of gas in the tunnel. Based on the computational
fluid dynamics (CFD) theory and taking the Yanyingshan tunnel section of China-Myanmar pipeline as an example, this
paper uses Fluent software to establish the leakage model of the gas pipeline and fan model in the tunnel and analyzes
the influence of different fan locations and number of fans on gas concentration. It can be concluded that: (1) the use of
press-in method makes it more efficient to discharge gas out of the tunnel. (2) In order to make ventilation efficient, the
fan should be arranged in a higher position and needs to be at a distance from the top of the tunnel. (3) Parallel use of
two fans has better ventilation effect than single fan.
Keywords: tunnel; gas pipeline; leakage; computational fluid dynamics; ventilation scheme
1. Introduction
Based on the report “Gas Pipeline Incidents” written by EGIG (European Gas pipeline Incident data Group), from
the statistical data from 1970 to 2013, the accident caused by construction defects or material failures accounts for 16%
of all accidents.1 In 2006, a gas pipeline in Respublika Severnaya Osetiya-Alaniya exploded, the gas pipeline passed
through a tunnel and tunnel collapsed by this accident. After that, the pipeline exploded again, and the pipe was forced to
stop.2 Therefore, after the gas pipeline leaks in the tunnel, emergency repair needs to be done, and gas gathered in the
tunnel need to be discharged to avoid secondary accidents. Thus, it is necessary to study the leakage law of gas pipeline
and ventilation scheme of the tunnel.
In 1997, Axel Bring et al. used assembly language to develop a simulation program that calculates the pressure
changes and gas velocity changes along the gas pipeline in the tunnel. The model has some applicability, but the function
is relatively simple and cannot be compared to many kinds of schemes.3 In 2001, Wei Jinfeng et al. studied the
application of Navier-Stokes equation in tunnel ventilation engineering and established a simple two-dimensional
verification model to simulate the ventilation effect of wind tunnel with different length and height, but this research
only studied the single-fan case, and did not study the situation of multi fans.4 In 2008, Peng Fan analyzed the ventilation
of long highway tunnels and discussed the control requirements of fans in different situations.5 In 2008, Mónica
GaldoVega et al. used a three-dimensional numerical simulation of the longitudinal ventilation system (LVS) to analyze
the behavior of a fire in a highway tunnel.6 In 2009, Li Feng conducted a study on the ventilation management of
high-concentration gas tunnels, discussed the management points of high-concentration gas tunnels and elaborated the
Preprints (www.preprints.org) | NOT PEER-REVIEWED | Posted: 19 December 2017 doi:10.20944/preprints201712.0133.v1
© 2017 by the author(s). Distributed under a Creative Commons CC BY license.
construction experience. However, no computer simulation was conducted and only theoretical analysis was made.7 In
2013, Hu Chunliang studied the vertical tunnel ventilation scheme and proposed the optimization scheme. The
experimental model was established by using the principle of water jet, and the computer simulation results were
verified.8 In 2014, Huang Hao et al. Studied the application of high pressure and large flow fan in the tunnel and
established a two-dimensional verification model to compare the effect of ventilation volume on ventilation.9
Based on survey on tunnel ventilation, the focus of the research is mainly on the tunnels in highway and railway,
and the research on the tunnel of oil and gas pipeline is less. However, tunnel of oil and gas pipeline is very different
from other tunnels. Its space is smaller, and there is no special air duct. In addition, there is a higher risk of oil and gas
pipeline leakage and improper handling can cause serious explosions. Therefore, this paper uses numerical simulation
method to study the ventilation scheme of oil and gas pipe tunnel.
2. Basic theory
(1) Leakage jet velocity
In the process of pipe leakage, the frictional influence of air flow at the leakage hole can be neglected, and
assuming that there is no heat exchange with the outside, it can be considered that gas flows in the vicinity of the leakage
hole as an isentropic process. Therefore, leakage jet velocity is:
12
2 11
21 ( )
1
k
kpk
v c RTk p
− = − −
(1)
where c is leakage jet velocity coefficient, it relates to the form of leaks, 0.65 for crack and 0.98 for circular hole; k is
specific heat ratio; v2 is leakage jet speed, m/s; R is gas constant, J/(kg·K); T1 is internal temperature of natural gas
pipeline, K; p2 is atmospheric pressure, Pa; p1 is pipeline inner pressure, Pa.
(2) Leakage rate
For non-critical flow:
2 1
a a0 2
2 2 2
2
( 1)
k
k kP PMkQ c AP
ZRT k P P
+ = − −
(2)
where Q is gas leakage rate, kg/s; M is molecular weight of gas, kg/mol; Pa is atmospheric pressure outside pipe, Pa; c0 is
gas leakage coefficient; Z is compressibility factor.
For critical flow and supercritical flow:
1
1
0 22
2
( 1) 1
k
kMkQ c AP
ZRT k k
+− = − +
(3)
(3) Duration of gas filled with tunnel:
( ) ( )j 1 1
0.1 0.10.59 0.59 0.591 1 1
4 ( '') 4000 ( 2 )50
35 1000 646837 1000 ( 2 )
jS L L S L Lt
Q Q L cQ cQ L L L− −− − −
− −= + +
−
ρ ρ (4)
where S is section area of tunnel, m2; L1 is the smaller distance between leak and tunnel door, m; ρj is gas density under
normal pressure, kg/m3; Q is gas leak rate, kg/s; c is flow rate correction coefficient; L is full length of tunnel, m; L'' is
moving distance between gas and air at 50 seconds of leakage, m.
(4) Turbulence model
Preprints (www.preprints.org) | NOT PEER-REVIEWED | Posted: 19 December 2017 doi:10.20944/preprints201712.0133.v1
The standard K-ε turbulence model is selected.
Turbulent kinetic energy equation (K equation):
ti K b M k
i j k j
( ) ( ) ( )k
k ku G G e Y St x x x
∂ ∂ ∂ ∂+ = + + + − − + ∂ ∂ ∂ ∂
μρ ρ μ ρσ
(5)
Diffusion equation (ε equation):
2t
i 1 k 3e b 2e ei j e j
( ) ( ) ( ) ( )e
e e ee eu C G C G C S
t x x x k k
∂ ∂ ∂ ∂+ = + + + − + ∂ ∂ ∂ ∂
μρ ρ μ ρσ
(6)
where GK is turbulent kinetic energy generated by buoyancy; Gb is turbulent kinetic energy generated by buoyancy; YM is
undulation caused by excessive diffusion in compressible turbulence; C1e, C2e, C3e are constant and C1e=1.44, C2e=1.92,
C3e=0.09; σk and σe are Prandtl number of K equation and ε equation, respectively, and σk=1, σe=1.3.
(5) Component transport model
In order to study the distribution of natural gas in the tunnel, it is necessary to adopt component transport model:
i i i i i( ) ( )Y vY j R St
∂ + ∇ ⋅ = −∇ + +∂
ρ ρ
(7)
3. Case study
3.1 Project overview
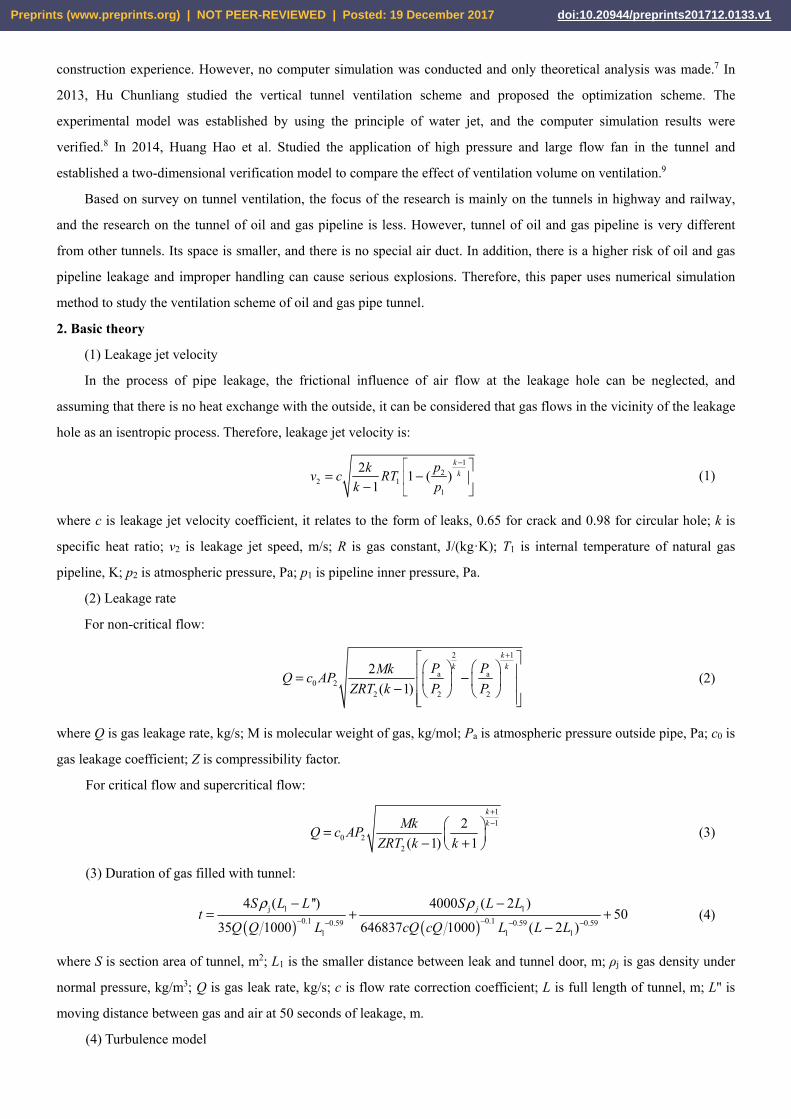
The cross section size of Yanyingshan tunnel is 3.8 m×3.8 m, the bottom is a rectangle, and the upper part is a
semicircular arch. As shown in Fig. 1, the gas pipeline and the crude oil pipeline are laid in parallel with a distance of 1.2
m. The refined oil pipeline is above the crude oil pipeline. The laying form is overhead laying, the specific parameters of
gas pipeline are shown in Table 1, and the gas components are shown in Table 2. In order to reduce the possibility of
third party damage, as shown in Fig. 2, a brick-structured tunnel door with a vent of size 0.3 m×0.3 m will be
constructed at both ends of the tunnel.
3800 mm
Refined oil pipe
Crude oil pipeGas pipe
1200 mm
Fig.1 Layout diagram of pipes in Yanyingshan tunnel
Table 1. Parameters of pipes in Yanyingshan tunnel
Diameter (mm) Thickness (Straight pipe)
(mm)
Thickness (Hot-bending
bend) (mm)
Thickness (Cold-bending
bend) (mm) Pressure (MPa) Material
1016 28.6 31.8 28.6 10 X70
Preprints (www.preprints.org) | NOT PEER-REVIEWED | Posted: 19 December 2017 doi:10.20944/preprints201712.0133.v1

Table 2. Gas components
Component CH4 C2H6 N2 CO2 H2S
Volume fraction (%) 93.984 2.972 1.934 0.683 0.427
Fig. 2 Schematic diagram of the vent on the tunnel door
3.2 Numerical simulation
(1) Grid generation
Because of the complexity and uncertainty of the gas flow, the two-dimensional model cannot accurately describe
the diffusion of gas in the tunnel, so a three-dimensional numerical simulation model is adopted. A high speed jet is
produced at the leakage hole, the velocity and pressure gradient are relatively large. Therefore, in order to guarantee the
accuracy of simulation, the grid at the pipeline leakage should be refined, taking into account the computational cost, we
need to ensure that the total number of grids is in a certain range. Tetrahedral mesh is used near the leakage hole. The
total length of the tunnel is about 2000 m, therefore, in order to reduce the amount of calculation, the grid far away from
the leakage hole can be rough, a part of grid result of tunnel model is shown in Fig. 3. The total number of grids is about
700 thousand, and the grid result of the whole tunnel is shown in Fig. 4.
Fig.3 Grid of tunnel and pipe model (A part)
Fig.4 Grid of whole tunnel (1:1)
(2) Boundary condition
Preprints (www.preprints.org) | NOT PEER-REVIEWED | Posted: 19 December 2017 doi:10.20944/preprints201712.0133.v1
Boundary conditions within the Yayingshan tunnel are divided into three sections: leakage hole of gas pipeline,
tunnel wall and pipe wall, vents of export and import of tunnel.
Leakage hole of gas pipeline: Pressure import.
Tunnel wall and pipe wall: Wall boundary.
Vents of export and import of tunnel: Pressure outlet.
(3) Step of calculation
The ideal initial step is the minimum size of the grid divided by the maximum velocity of the fluid. During the
calculation, it is guaranteed that the time step can be gradually increased with the convergence of the calculation. Select
0.0001 s based on the initial step.
4. Results and discussions
If the gas pipeline leaks in the tunnel, both ends of the valve chamber should be closed. As the leakage progresses,
the pressure in the pipe decreases and the leakage rate decreases. When the pressure in the pipe is equal to the outside
pressure, the leak stops. Therefore, it is necessary to obtain the relationship between the leakage rate and the internal
pressure of the pipeline and calculate the total leakage, thus the duration of the leakage jet can be obtained.
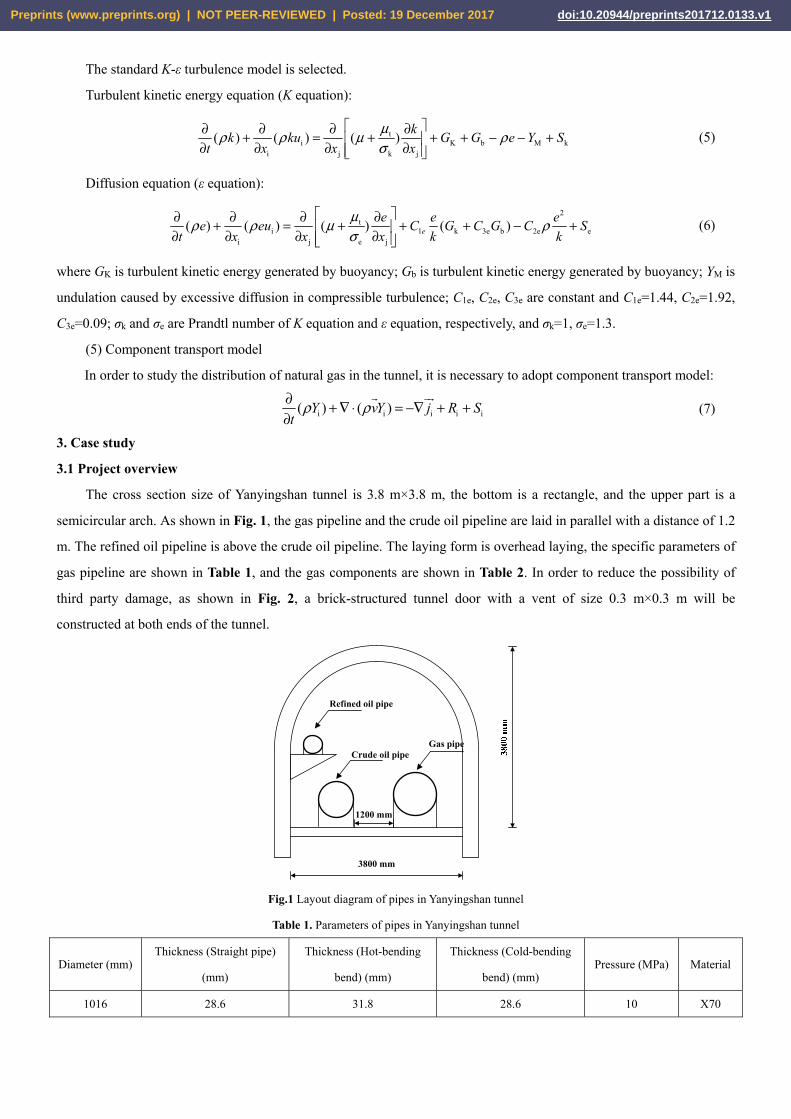
4.1 Relationship between leakage rate and pipeline pressure
When the leakage area is 0.01 m2, different leakage rates can be obtained by changing the internal pressure of the
pipeline, as shown in Fig. 5. The relationship between pipe internal pressure and leakage rate can be expressed as a
one-quadratic equation:
20.2009 16.76 0.0751r i iL p p= + + (R2=1) (8)
where Lr is leakage rate, kg/s; pi is internal pressure of pipeline, MPa.
Fig.5 Relationship between internal pressure and leakage rate
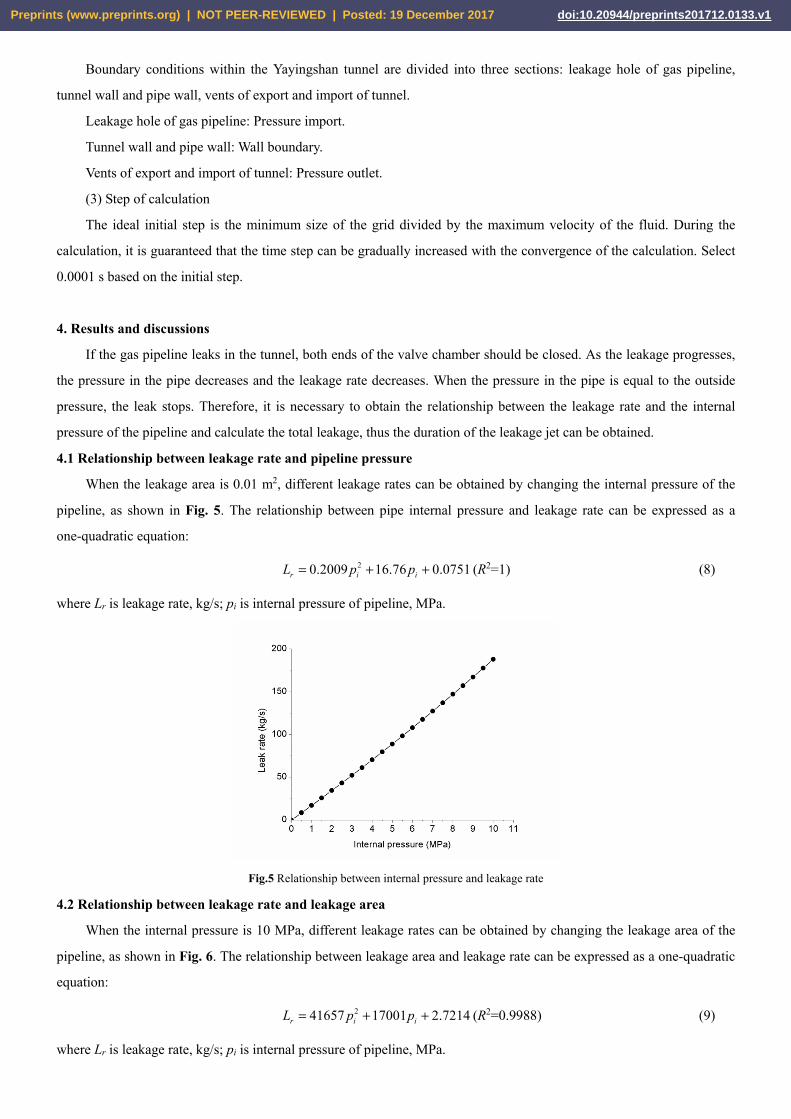
4.2 Relationship between leakage rate and leakage area
When the internal pressure is 10 MPa, different leakage rates can be obtained by changing the leakage area of the
pipeline, as shown in Fig. 6. The relationship between leakage area and leakage rate can be expressed as a one-quadratic
equation:
241657 17001 2.7214r i iL p p= + + (R2=0.9988) (9)
where Lr is leakage rate, kg/s; pi is internal pressure of pipeline, MPa.
Preprints (www.preprints.org) | NOT PEER-REVIEWED | Posted: 19 December 2017 doi:10.20944/preprints201712.0133.v1
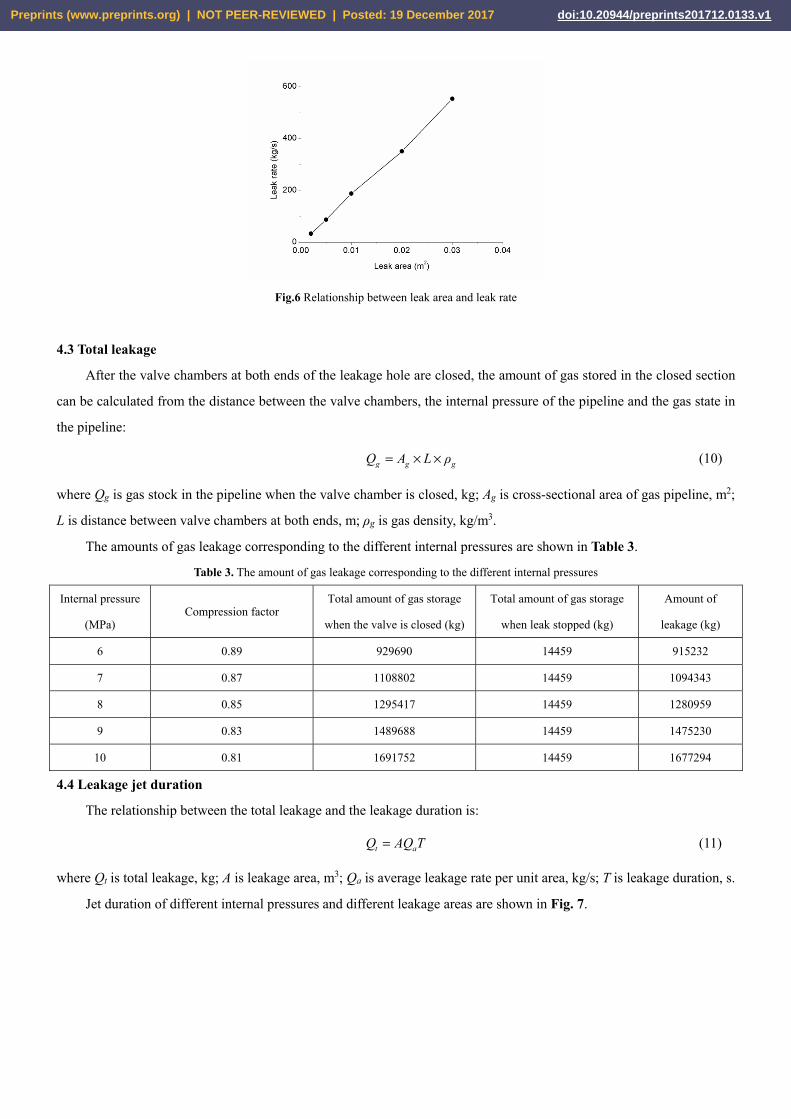
Fig.6 Relationship between leak area and leak rate
4.3 Total leakage
After the valve chambers at both ends of the leakage hole are closed, the amount of gas stored in the closed section
can be calculated from the distance between the valve chambers, the internal pressure of the pipeline and the gas state in
the pipeline:
g g gQ A L ρ= × × (10)
where Qg is gas stock in the pipeline when the valve chamber is closed, kg; Ag is cross-sectional area of gas pipeline, m2;
L is distance between valve chambers at both ends, m; ρg is gas density, kg/m3.
The amounts of gas leakage corresponding to the different internal pressures are shown in Table 3.
Table 3. The amount of gas leakage corresponding to the different internal pressures
Internal pressure
(MPa) Compression factor
Total amount of gas storage
when the valve is closed (kg)
Total amount of gas storage
when leak stopped (kg)
Amount of
leakage (kg)
6 0.89 929690 14459 915232
7 0.87 1108802 14459 1094343
8 0.85 1295417 14459 1280959
9 0.83 1489688 14459 1475230
10 0.81 1691752 14459 1677294
4.4 Leakage jet duration
The relationship between the total leakage and the leakage duration is:
t aQ AQ T= (11)
where Qt is total leakage, kg; A is leakage area, m3; Qa is average leakage rate per unit area, kg/s; T is leakage duration, s.
Jet duration of different internal pressures and different leakage areas are shown in Fig. 7.
Preprints (www.preprints.org) | NOT PEER-REVIEWED | Posted: 19 December 2017 doi:10.20944/preprints201712.0133.v1
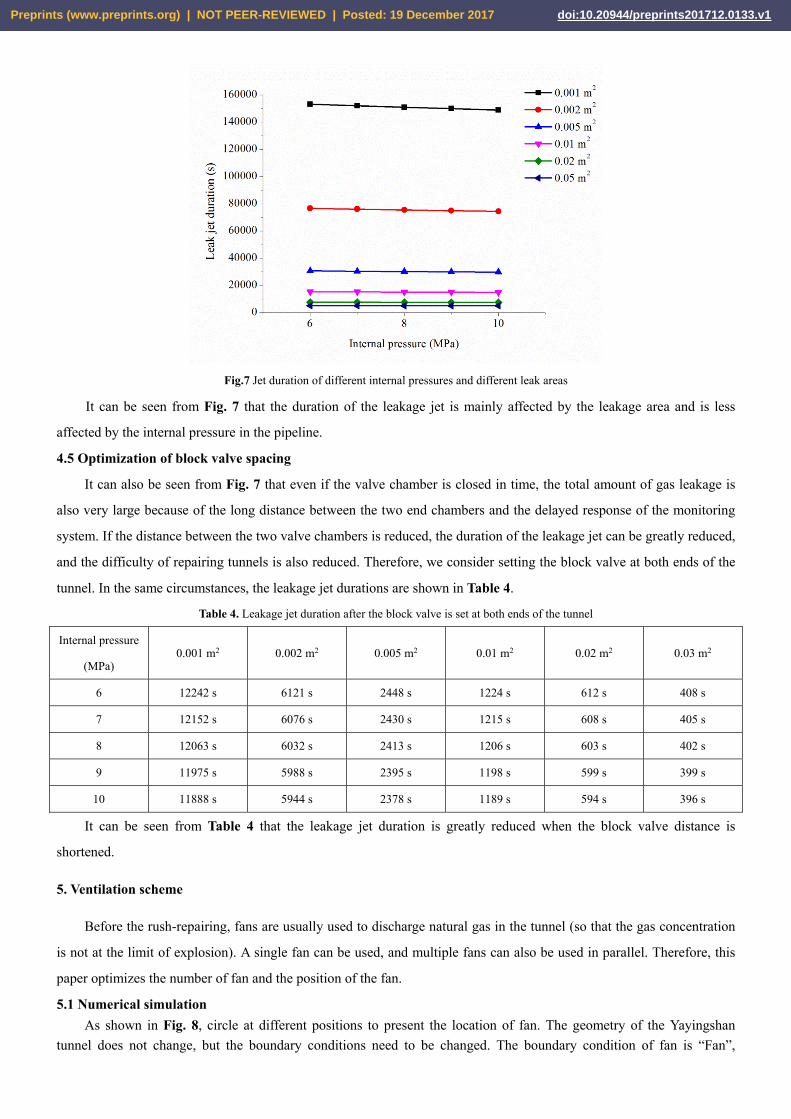
Fig.7 Jet duration of different internal pressures and different leak areas
It can be seen from Fig. 7 that the duration of the leakage jet is mainly affected by the leakage area and is less
affected by the internal pressure in the pipeline.
4.5 Optimization of block valve spacing
It can also be seen from Fig. 7 that even if the valve chamber is closed in time, the total amount of gas leakage is
also very large because of the long distance between the two end chambers and the delayed response of the monitoring
system. If the distance between the two valve chambers is reduced, the duration of the leakage jet can be greatly reduced,
and the difficulty of repairing tunnels is also reduced. Therefore, we consider setting the block valve at both ends of the
tunnel. In the same circumstances, the leakage jet durations are shown in Table 4.
Table 4. Leakage jet duration after the block valve is set at both ends of the tunnel
Internal pressure
(MPa) 0.001 m2 0.002 m2 0.005 m2 0.01 m2 0.02 m2 0.03 m2
6 12242 s 6121 s 2448 s 1224 s 612 s 408 s
7 12152 s 6076 s 2430 s 1215 s 608 s 405 s
8 12063 s 6032 s 2413 s 1206 s 603 s 402 s
9 11975 s 5988 s 2395 s 1198 s 599 s 399 s
10 11888 s 5944 s 2378 s 1189 s 594 s 396 s
It can be seen from Table 4 that the leakage jet duration is greatly reduced when the block valve distance is
shortened.
5. Ventilation scheme
Before the rush-repairing, fans are usually used to discharge natural gas in the tunnel (so that the gas concentration
is not at the limit of explosion). A single fan can be used, and multiple fans can also be used in parallel. Therefore, this
paper optimizes the number of fan and the position of the fan.
5.1 Numerical simulation
As shown in Fig. 8, circle at different positions to present the location of fan. The geometry of the Yayingshan
tunnel does not change, but the boundary conditions need to be changed. The boundary condition of fan is “Fan”,
Preprints (www.preprints.org) | NOT PEER-REVIEWED | Posted: 19 December 2017 doi:10.20944/preprints201712.0133.v1
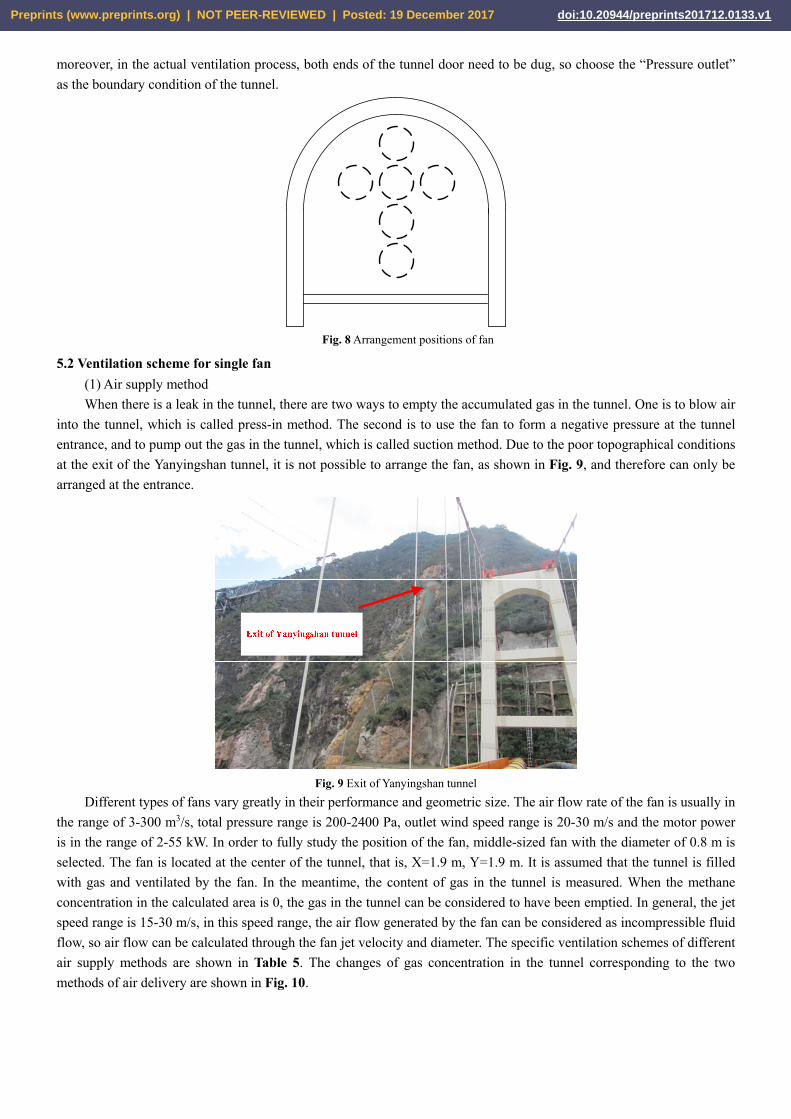
moreover, in the actual ventilation process, both ends of the tunnel door need to be dug, so choose the “Pressure outlet”
as the boundary condition of the tunnel.
Fig. 8 Arrangement positions of fan
5.2 Ventilation scheme for single fan
(1) Air supply method
When there is a leak in the tunnel, there are two ways to empty the accumulated gas in the tunnel. One is to blow air
into the tunnel, which is called press-in method. The second is to use the fan to form a negative pressure at the tunnel
entrance, and to pump out the gas in the tunnel, which is called suction method. Due to the poor topographical conditions
at the exit of the Yanyingshan tunnel, it is not possible to arrange the fan, as shown in Fig. 9, and therefore can only be
arranged at the entrance.
Fig. 9 Exit of Yanyingshan tunnel
Different types of fans vary greatly in their performance and geometric size. The air flow rate of the fan is usually in
the range of 3-300 m3/s, total pressure range is 200-2400 Pa, outlet wind speed range is 20-30 m/s and the motor power
is in the range of 2-55 kW. In order to fully study the position of the fan, middle-sized fan with the diameter of 0.8 m is
selected. The fan is located at the center of the tunnel, that is, X=1.9 m, Y=1.9 m. It is assumed that the tunnel is filled
with gas and ventilated by the fan. In the meantime, the content of gas in the tunnel is measured. When the methane
concentration in the calculated area is 0, the gas in the tunnel can be considered to have been emptied. In general, the jet
speed range is 15-30 m/s, in this speed range, the air flow generated by the fan can be considered as incompressible fluid
flow, so air flow can be calculated through the fan jet velocity and diameter. The specific ventilation schemes of different
air supply methods are shown in Table 5. The changes of gas concentration in the tunnel corresponding to the two
methods of air delivery are shown in Fig. 10.
Preprints (www.preprints.org) | NOT PEER-REVIEWED | Posted: 19 December 2017 doi:10.20944/preprints201712.0133.v1
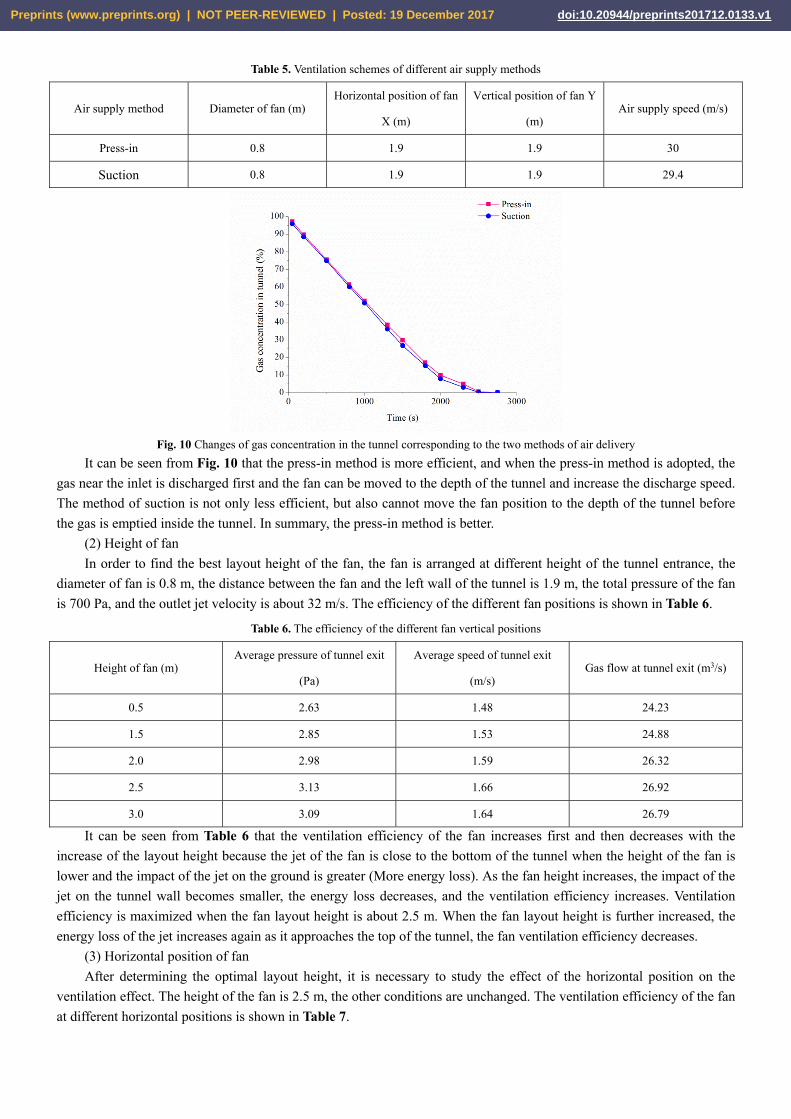
Table 5. Ventilation schemes of different air supply methods
Air supply method Diameter of fan (m) Horizontal position of fan
X (m)
Vertical position of fan Y
(m) Air supply speed (m/s)
Press-in 0.8 1.9 1.9 30
Suction 0.8 1.9 1.9 29.4
Fig. 10 Changes of gas concentration in the tunnel corresponding to the two methods of air delivery
It can be seen from Fig. 10 that the press-in method is more efficient, and when the press-in method is adopted, the
gas near the inlet is discharged first and the fan can be moved to the depth of the tunnel and increase the discharge speed.
The method of suction is not only less efficient, but also cannot move the fan position to the depth of the tunnel before
the gas is emptied inside the tunnel. In summary, the press-in method is better.
(2) Height of fan
In order to find the best layout height of the fan, the fan is arranged at different height of the tunnel entrance, the
diameter of fan is 0.8 m, the distance between the fan and the left wall of the tunnel is 1.9 m, the total pressure of the fan
is 700 Pa, and the outlet jet velocity is about 32 m/s. The efficiency of the different fan positions is shown in Table 6.
Table 6. The efficiency of the different fan vertical positions
Height of fan (m) Average pressure of tunnel exit
(Pa)
Average speed of tunnel exit
(m/s) Gas flow at tunnel exit (m3/s)
0.5 2.63 1.48 24.23
1.5 2.85 1.53 24.88
2.0 2.98 1.59 26.32
2.5 3.13 1.66 26.92
3.0 3.09 1.64 26.79
It can be seen from Table 6 that the ventilation efficiency of the fan increases first and then decreases with the
increase of the layout height because the jet of the fan is close to the bottom of the tunnel when the height of the fan is
lower and the impact of the jet on the ground is greater (More energy loss). As the fan height increases, the impact of the
jet on the tunnel wall becomes smaller, the energy loss decreases, and the ventilation efficiency increases. Ventilation
efficiency is maximized when the fan layout height is about 2.5 m. When the fan layout height is further increased, the
energy loss of the jet increases again as it approaches the top of the tunnel, the fan ventilation efficiency decreases.
(3) Horizontal position of fan
After determining the optimal layout height, it is necessary to study the effect of the horizontal position on the
ventilation effect. The height of the fan is 2.5 m, the other conditions are unchanged. The ventilation efficiency of the fan
at different horizontal positions is shown in Table 7.
Preprints (www.preprints.org) | NOT PEER-REVIEWED | Posted: 19 December 2017 doi:10.20944/preprints201712.0133.v1
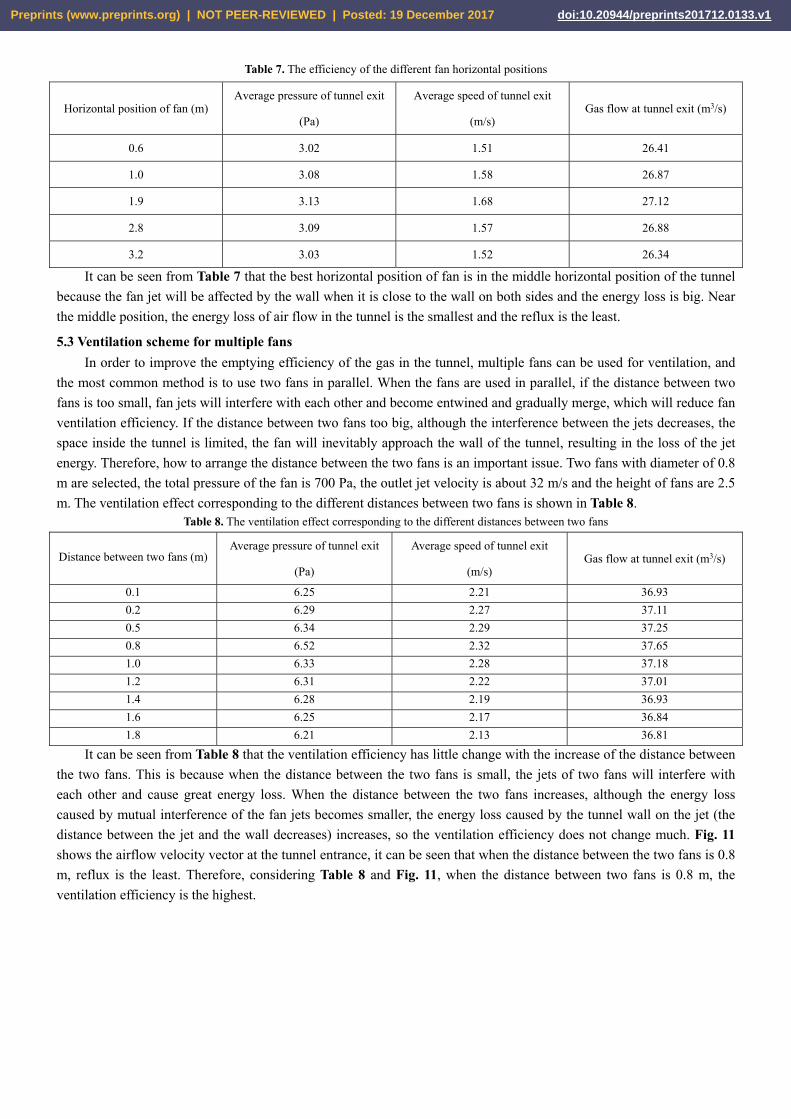
Table 7. The efficiency of the different fan horizontal positions
Horizontal position of fan (m) Average pressure of tunnel exit
(Pa)
Average speed of tunnel exit
(m/s) Gas flow at tunnel exit (m3/s)
0.6 3.02 1.51 26.41
1.0 3.08 1.58 26.87
1.9 3.13 1.68 27.12
2.8 3.09 1.57 26.88
3.2 3.03 1.52 26.34
It can be seen from Table 7 that the best horizontal position of fan is in the middle horizontal position of the tunnel
because the fan jet will be affected by the wall when it is close to the wall on both sides and the energy loss is big. Near
the middle position, the energy loss of air flow in the tunnel is the smallest and the reflux is the least.
5.3 Ventilation scheme for multiple fans
In order to improve the emptying efficiency of the gas in the tunnel, multiple fans can be used for ventilation, and
the most common method is to use two fans in parallel. When the fans are used in parallel, if the distance between two
fans is too small, fan jets will interfere with each other and become entwined and gradually merge, which will reduce fan
ventilation efficiency. If the distance between two fans too big, although the interference between the jets decreases, the
space inside the tunnel is limited, the fan will inevitably approach the wall of the tunnel, resulting in the loss of the jet
energy. Therefore, how to arrange the distance between the two fans is an important issue. Two fans with diameter of 0.8
m are selected, the total pressure of the fan is 700 Pa, the outlet jet velocity is about 32 m/s and the height of fans are 2.5
m. The ventilation effect corresponding to the different distances between two fans is shown in Table 8. Table 8. The ventilation effect corresponding to the different distances between two fans
Distance between two fans (m) Average pressure of tunnel exit
(Pa)
Average speed of tunnel exit
(m/s) Gas flow at tunnel exit (m3/s)
0.1 6.25 2.21 36.93
0.2 6.29 2.27 37.11
0.5 6.34 2.29 37.25
0.8 6.52 2.32 37.65
1.0 6.33 2.28 37.18
1.2 6.31 2.22 37.01
1.4 6.28 2.19 36.93
1.6 6.25 2.17 36.84
1.8 6.21 2.13 36.81
It can be seen from Table 8 that the ventilation efficiency has little change with the increase of the distance between
the two fans. This is because when the distance between the two fans is small, the jets of two fans will interfere with
each other and cause great energy loss. When the distance between the two fans increases, although the energy loss
caused by mutual interference of the fan jets becomes smaller, the energy loss caused by the tunnel wall on the jet (the
distance between the jet and the wall decreases) increases, so the ventilation efficiency does not change much. Fig. 11
shows the airflow velocity vector at the tunnel entrance, it can be seen that when the distance between the two fans is 0.8
m, reflux is the least. Therefore, considering Table 8 and Fig. 11, when the distance between two fans is 0.8 m, the
ventilation efficiency is the highest.
Preprints (www.preprints.org) | NOT PEER-REVIEWED | Posted: 19 December 2017 doi:10.20944/preprints201712.0133.v1
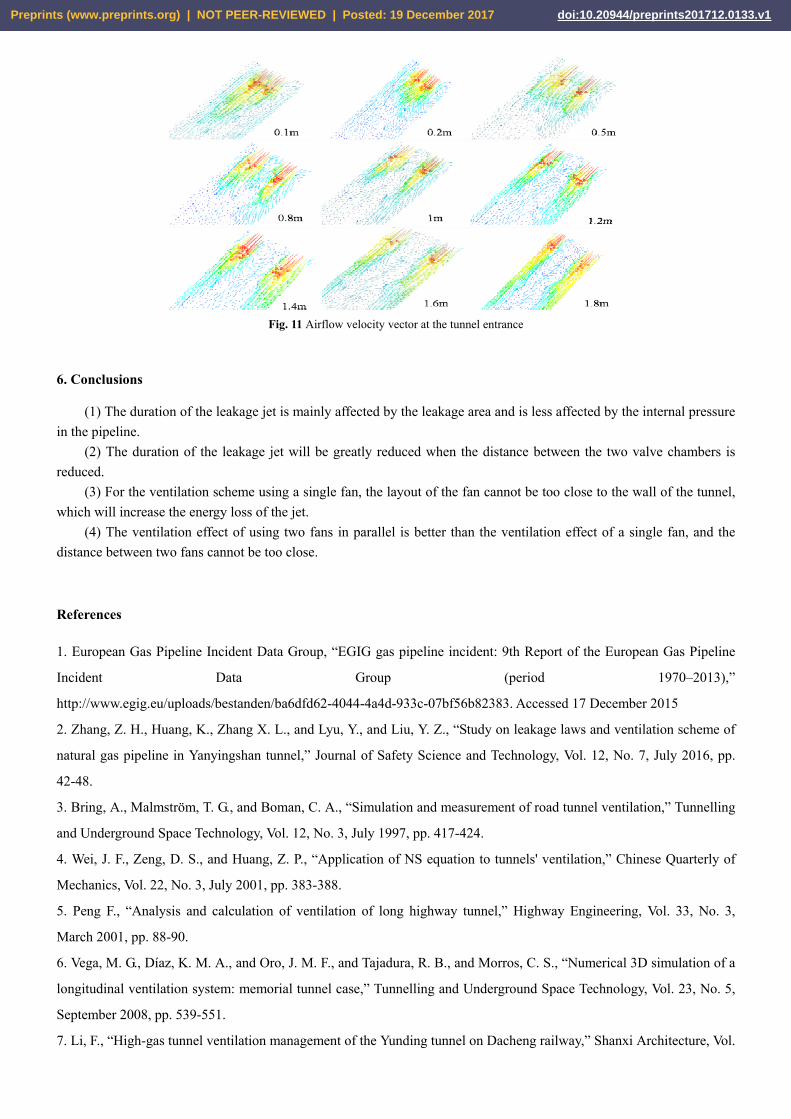
Fig. 11 Airflow velocity vector at the tunnel entrance
6. Conclusions
(1) The duration of the leakage jet is mainly affected by the leakage area and is less affected by the internal pressure
in the pipeline.
(2) The duration of the leakage jet will be greatly reduced when the distance between the two valve chambers is
reduced.
(3) For the ventilation scheme using a single fan, the layout of the fan cannot be too close to the wall of the tunnel,
which will increase the energy loss of the jet.
(4) The ventilation effect of using two fans in parallel is better than the ventilation effect of a single fan, and the
distance between two fans cannot be too close.
References
1. European Gas Pipeline Incident Data Group, “EGIG gas pipeline incident: 9th Report of the European Gas Pipeline
Incident Data Group (period 1970–2013),”
http://www.egig.eu/uploads/bestanden/ba6dfd62-4044-4a4d-933c-07bf56b82383. Accessed 17 December 2015
2. Zhang, Z. H., Huang, K., Zhang X. L., and Lyu, Y., and Liu, Y. Z., “Study on leakage laws and ventilation scheme of
natural gas pipeline in Yanyingshan tunnel,” Journal of Safety Science and Technology, Vol. 12, No. 7, July 2016, pp.
42-48.
3. Bring, A., Malmström, T. G., and Boman, C. A., “Simulation and measurement of road tunnel ventilation,” Tunnelling
and Underground Space Technology, Vol. 12, No. 3, July 1997, pp. 417-424.
4. Wei, J. F., Zeng, D. S., and Huang, Z. P., “Application of NS equation to tunnels' ventilation,” Chinese Quarterly of
Mechanics, Vol. 22, No. 3, July 2001, pp. 383-388.
5. Peng F., “Analysis and calculation of ventilation of long highway tunnel,” Highway Engineering, Vol. 33, No. 3,
March 2001, pp. 88-90.
6. Vega, M. G., Díaz, K. M. A., and Oro, J. M. F., and Tajadura, R. B., and Morros, C. S., “Numerical 3D simulation of a
longitudinal ventilation system: memorial tunnel case,” Tunnelling and Underground Space Technology, Vol. 23, No. 5,
September 2008, pp. 539-551.
7. Li, F., “High-gas tunnel ventilation management of the Yunding tunnel on Dacheng railway,” Shanxi Architecture, Vol.
Preprints (www.preprints.org) | NOT PEER-REVIEWED | Posted: 19 December 2017 doi:10.20944/preprints201712.0133.v1

35, No. 21, August 2009, pp. 347-349.
8. Hu, C. L., Zhang, H. L., and Wang, M., and Yu, Y. J., “Study on air flow distribution in tunnel under different axial
distances among fans,”Sichuan Building Science, Vol. 40, No. 1, February 2014, pp. 94-97.
9. Huang, H., Chen, M., and Lu, W. B., and Yan, P., “Application of high-pressure and large-flow ventilator to tunneling
ventilation,” Water Resources and Hydropower Engineering, Vol. 45, No. 2, April 2014, pp. 97-99.
Acknowledgement
This article is funded by China Scholarship Council (201708030006).
Preprints (www.preprints.org) | NOT PEER-REVIEWED | Posted: 19 December 2017 doi:10.20944/preprints201712.0133.v1