Embed Size (px)
Citation preview
VISVESVARAYA TECHNOLOGICAL UNIVERSITY
BELGAUM
A
PROJECT REPORT
On
“DEVELOPMENT OF DATA ACQUISITION FOR UNDERGROUND
WATER AND GAS PIPELINE LEAKAGE MONITORING USING
IOT”
Submitted in partial fulfillment of the Bachelor Degree
In
INFORMATION SCIENCE AND ENGINEERING
VIII SEMESTER Project Work (06IS85) By
Neethi Ramaiah (1HK13IS026)
Divya.P (1HK13IS012)
Poornima.P ( 1HK12IS023)
Nikil Kumar.G (1HK08IS032)
Under the guidance of
Prof. Savithri Ramesh,
Department of Information Science and Engineering
HKBK College of Engineering, Bengaluru.
2016-2017
HKBK COLLEGE OF ENGINEERING
22/1, Nagawara, Bengaluru – 560045.
E-mail: [email protected], URL: www.hkbkeducation.org
BENGALURU-560045.
DEPARTMENT OF INFORMATION SCIENCE AND ENGINEERING
VISVESVARAYA TECHNOLOGICAL UNIVERSITY
PROJECT REPORT
ON
“DEVELOPMENT OF DATA ACQUISITION FOR
UNDERGROUND WATER AND GAS PIPELINE
LEAKAGE MONITORING USING IOT”
Submitted in partial fulfillment for the project in
VIII Semester, Project Work (06IS85)
2016-2017
SUBMITTED BY:
Neethi Ramaiah (1HK13IS026)
Divya.P (1HK13IS012)
Poornima.P (1HK12IS023)
G.Nikil Kumar (1HK09IS014)
HKBK COLLEGE OF ENGINEERING 22/1, Nagawara, Bengaluru – 560 045.
DEPARTMENT OF INFORMATION SCIENCE AND ENGINEERING
CERTIFICATE
Certified that the project work entitled “DEVELOPMENT OF DATA ACQUISITION FOR
UNDERGROUND WATER AND GAS PIPELINE LEAKAGE MONITORING USING
IOT” is a bonafide work carried out by Neethi Ramaiah (1HK13IS026), Divya.P
(1HK13IS012), Poornima.P (1HK12IS023), G.Nikil Kumar (1HK09IS014) in partial
fulfillment for the award of Degree in Bachelor of Engineering in Information Science and
Engineering of the Visvesvaraya Technological University, Belgaum during the year 2016-2017.
It is certified that all corrections/suggestions indicated for Internal Assessment have been
incorporated in the Report deposited in the departmental library. The project report has been
approved as it satisfies the academic requirements in respect of Project work prescribed for the
Bachelor of Engineering Degree.
----------------------------- ----------------------------- ----------------------------- Signature of the Guide Signature of the HOD Signature of the Principal
(Pror. Savithri Ramesh) (Prof. Syed Mustafa) (Dr. Chaitanya Kumar M.V)
Name of the Examiners Signature with date
1. ---------------------------
2. ---------------------------
ACKNOWLEDGEMENT
We would like to place our regards and acknowledgement to all who helped in making this project
possible. There are many people who worked behind the screen to help make it possible the below
listed are a few of them.
First of all we would take this opportunity to express my heartfelt gratitude to Chairman
Mr. C.M. Ibrahim, and Administrator Mr. C.M. Fiaz, Principal Dr. Chaitanya kumar M.V.
We deeply indebted to Prof. A. Syed Mustafa, HOD, Information Science and Engineering for the
ineffable encouragement he provided in successful completion of the project.
We express my heartfelt sincere gratitude to project guide, Prof. Savithri Ramesh for her constant
assistance, support, patience, endurance and constructive suggestions for the betterment of the
project.
We are extremely thankful to the teaching and non-teaching staff of the Department of Information
Science and Engineering for their valuable guidance and cooperation throughout our dissertation.
We thank our parents for their support and guidance provided to us to finish our project well ahead
of time. We thank our friends who lent their support in every way possible to make sure the project
has been completed. Last but not the least we would like to thank God for giving us this opportunity
to do everything in the appropriate time to finish this project.
PROJECT ASSOCIATES: Neethi Ramaiah (1HK13IS026)
Divya.P (1HK13IS012)
Poornima.P (1HK12IS023)
G.Nikil Kumar (1HK09IS014)
8th Semester, ISE, BE, HKBKCE 2016-2017
Development of Data Acquisition for Underground Water and Gas
Pipeline Leakage Monitoring Using IOT
TABLE OF CONTENTS
ABSTRACT I
CHAPTER 1 INTRODUCTION [1-2]
CHAPTER 2 LITERATURE SURVEY [3-8]
2.1 Survey 3
2.1.1 Manual Monitoring 3
2.1.2 Acoustic Leak Detection 3
2.1.3 Correlate Leak Detection 3
2.1.4 Ground Penetrating radar 4
2.1.5 Pressure/Flow monitoring 4
2.2 Problem Statement 4
2.3 Existing System 5
2.3.1 Pipeline Pigs 5
2.3.2 Fiber Optics Cables 6
2.3.3 Gradient Intersection Method 6
2.3.4 Wave Propagation Method 7
2.3.5 Advantages 7
2.3.6 Disadvantages 7
2.4 Proposed System 7
2.4.1 Advantages 8
CHAPTER 3 REQUIREMENTS [9-14]
3.1 Software Requirements 9
3.2 Hardware Requirements 9
3.3 Specific Requirements 10
3.3.1 External Interface Requirements 10
3.4 Functional Requirements 10
3.5 Non-Functional Requirements 11
3.6 Safety and Security Requirements 12
3.7 Software Quality Attributes 12
CHAPTER 4 SYSTEM DESIGN [15-34]
4.1 Introduction 15
4.2 System Architecture 16
8th Semester, ISE, BE, HKBKCE 2016-2017
Development of Data Acquisition for Underground Water and Gas
Pipeline Leakage Monitoring Using IOT
4.2.1 Hardware Module 17
4.2.1.1 Raspberry Pi 18
4.2.1.2 Solenoid Valve 18
4.2.1.3 Water Flow Sensor 19
4.2.1.4 IR Sensor 19
4.2.1.5 ARM7LPC2148 20
4.2.1.6 Moisture Sensor 21
4.2.2 Software Module 21
4.2.3 Activity Life Cycle Of Personal Computer (PC) 28
4.3 Data Flow Diagram 30
4.3.1 Data Flow Diagram-Level 0 30
4.3.2 Data Flow Diagram-Level 1 31
4.3.3 Data Flow Diagram-Level 2 32
4.4 Context Analysis 33
4.4.1 Use Case Diagram 33
4.4.2 Sequence Diagram 33
CHAPTER 5 IMPLEMENTATION [35-64]
5.1 Introduction 35
5.2 Hardware Module Implementation 35
5.2.1 Code For Functioning Of ARM7 Microcontroller 35
5.2.2 Code For Functioning of Raspberry PI Microcontroller 40
5.3 Software Module Implementation 46
5.3.1 Home Page 46
5.3.2 Login Page 48
5.3.3 Control Page 51
5.3.4 Status 54
5.3.5 Monitoring 60
CHAPTER 6 SYSTEM TESTING [65-72]
6.1 Testing Methodology 65
6.1.1 Unit Testing 66
6.1.2 Integration Testing 66
6.1.3 User Acceptance Testing 66
6.1.4 Output Testing 67
8th Semester, ISE, BE, HKBKCE 2016-2017
Development of Data Acquisition for Underground Water and Gas
Pipeline Leakage Monitoring Using IOT
6.1.5 System Testing 67
6.2 Test Cases 68
6.2.1 Non Functional Testing 68
6.2.2 Functional Testing 69
6.2.2.1 Non Functional Testing 70
6.2.2.2 Testing For IR Sensors 71
6.2.2.3 Testing for Moisture Sensors 71
CHAPTER 7 SNAPSHOTS [73-76]
7.1 Experimental Results 73
7.1.1 Home Page 73
7.1.2 Login Page 74
7.1.3 Control Page 74
7.1.4 Status 75
7.1.5
7.1.6
Monitoring
Complete Hardware Snapshot
75
76
CONCLUSION 77
REFERENCES [78-79]
8th Semester, ISE, BE, HKBKCE 2016-2017
Development of Data Acquisition for Underground Water and Gas
Pipeline Leakage Monitoring Using IOT
4.1 System Architecture 16
4.2 Raspberry Pi 18
4.3 Solenoid Valve 18
4.4 Water Flow Sensor 19
4.5 IR sensor 19
4.6 ARM7LPC2148 20
4.7 Moisture Sensor 21
4.8 Activity Life Cycle Of PC 28
4.9 Level 0 DFD 30
4.10 Level 1 DFD 31
4.11 Level 2 DFD 32
4.12 Use Case Diagram 33
4.13 Sequence Diagram Of User Interaction With The System
34
TABLE OF FIGURES
8th Semester, ISE, BE, HKBKCE 2016-2017
Development of Data Acquisition for Underground Water and Gas
Pipeline Leakage Monitoring Using IOT
LIST OF TABLES
6.1 Test Case for Successful Login 67
6.2 Test Case for Unsuccessful Login 68
6.3 Test Case for To Check The Rate of Flow Of Rate 68
6.4 Test Case for Detection Of IR sensors 68
6.5 Test Case for Moisture Sensor Detection 69
6.6 Test Case for ON Condition For Solenoid Valve 69
6.7 Test Case for OFF Condition For Solenoid Valve 69
6.8 Test Case for Checking The Reduction Of Flow Rate in Flow Sensor1 69
6.9 Test Case for Checking The Reduction Of Flow Rate in Flow Sensor2 70
6.10 Test Case for Checking The Reduction Of Flow Rate in Flow Sensor3 70
6.11 Test Case for Obstacle Detection BY IR Sensor1 70
6.12 Test Case for Obstacle Detection BY IR Sensor2 71
6.13 Test Case for Moisture Sensing By Moisture Sensor1 71
6.14 Test Case for Moisture Sensing By Moisture Sensor2 71
6.15 Test Case for Moisture Sensing By Moisture Sensor1 71
6.16 Test Case for Moisture Sensing By Moisture Sensor1 72
I
ABSTRACT
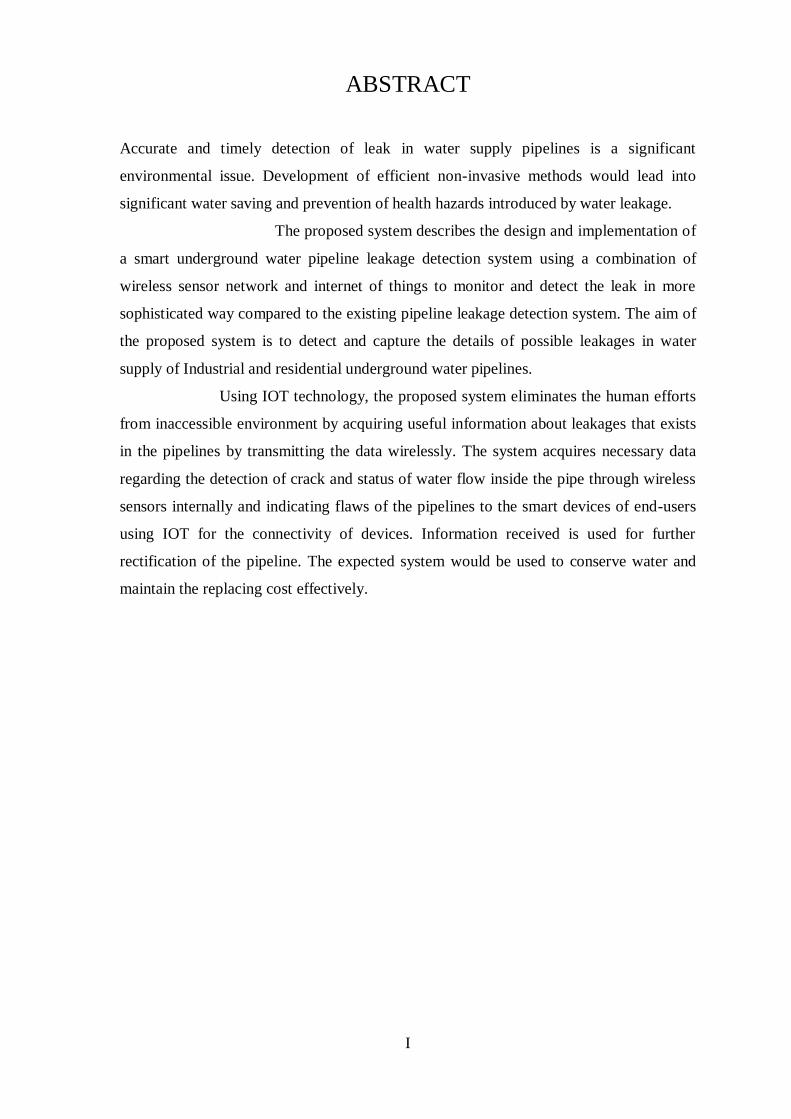
Accurate and timely detection of leak in water supply pipelines is a significant
environmental issue. Development of efficient non-invasive methods would lead into
significant water saving and prevention of health hazards introduced by water leakage.
The proposed system describes the design and implementation of
a smart underground water pipeline leakage detection system using a combination of
wireless sensor network and internet of things to monitor and detect the leak in more
sophisticated way compared to the existing pipeline leakage detection system. The aim of
the proposed system is to detect and capture the details of possible leakages in water
supply of Industrial and residential underground water pipelines.
Using IOT technology, the proposed system eliminates the human efforts
from inaccessible environment by acquiring useful information about leakages that exists
in the pipelines by transmitting the data wirelessly. The system acquires necessary data
regarding the detection of crack and status of water flow inside the pipe through wireless
sensors internally and indicating flaws of the pipelines to the smart devices of end-users
using IOT for the connectivity of devices. Information received is used for further
rectification of the pipeline. The expected system would be used to conserve water and
maintain the replacing cost effectively.
8th Semester, ISE, BE, HKBKCE 1 2016-2017
Development of Data Acquisition for Underground
Water and Gas Pipeline Leakage Monitoring Using IOT Introduction
CHAPTER 1
INTRODUCTION
Water is considered to be one of the vital resources used around the world. And most of
the countries highly depend on the standard of water management. Sustainability of
available water resources has now become a dominant issue for several reasons. The issue
is quiet related to poor water allocation, inefficient use and absence of good enough and
integrated water regulation. Therefore, wastage of water due to pipeline leakages is one of
the most critical and largest challenges confronted throughout the globe. Previous few
decades many tracking gadget integrated with water leakage detection have been
common. Monitoring water leakage is a necessary responsibility for government and
residence prospect. Thus from an engineer’s aspect, distribution of water can be enhanced
mainly by limiting the water waste that occurs along the path, between the source and the
end-users. But leakages are unavoidable due to some circumstances, such as corrosions,
manufacturing defects and aging of pipes.
When leak occurs in pipelines, large volume of water is lost, causing adverse impact on
the production industries and common people’s routine. Since the pipes are invisible and
unreachable, indication of cracks is not noticed. Hence finding the leakages and replacing
the defective pipe is very crucial during the distribution of water and gas. Therefore
implementation of pipeline leakage detecting system has importance in domestic
applications and industries.
The existing leak detecting systems such as acoustic waves system, ground penetrating
radar (GPR) systems, pressure measurements, fiber optic monitoring and vision based
systems etc are based on measurement of acoustic waves, radar waves, pressure, of
needed lots of labor efforts and erroneous measurements of leaks would lead to expensive
repairing of the pipeline laid underground.
Therefore a possible system is to be built, that can effectively detect the leaks in the
pipeline to minimize human intervention by using reliable networks with stable
communication such as Zigbee and WSN is needed to invigilate cracks and identify
leakage position, which composes small Printed Circuit Boards (PCB), data from
8th Semester, ISE, BE, HKBKCE 2 2016-2017
Development of Data Acquisition for Underground
Water and Gas Pipeline Leakage Monitoring Using IOT Introduction
different sensors such as IR and Water flow sensors, which are collected and monitored
data on a PC or smart phones through IOT. IOT is mainly used for the connectivity of
devices. The PCBs are powered by voltage through battery. When a crack is noticed,
remedial measures are taken to reduce water losses in the water distribution system. Exact
leakage position and replacement of underground water pipelines in a distribution system
highly reduces the loss of water. So the expected system will be used to conserve water
and minimize the repairing cost.
Objectives
To implement a wireless sensor based monitoring and controlling system that can
be accessed in close proximity along with remote access.
To make certain provision of the monitoring system in case of underground water
distribution where there is a constant need to detect possible underground water
leakage for residential water pipes which can be monitored from a Personal
Computer.
To ensure this proposed system can be employed globally and to provide a very
user friendly environment for people to use the application and the hardware
without need for extensive training.
To Publish connectivity to unreachable and dangerous areas
To notify the water leakage without human intervention under the ground.
8th Semester, ISE, BE, HKBKCE 3 2016-2017
Development of Data Acquisition for Underground
Water and Gas Pipeline Leakage Monitoring Using IOT Literature Survey
CHAPTER 2
LITERATURE SURVEY
2.1 Survey
Wireless sensors based systems are the new generation systems where these sensors are
used to monitor the environment to detect any slight variations in any specified values.
But these are some things which are available now before the extent of wireless sensor
network technology things were different. The various methods used before are all
discussed below.
2.1.1 Manual monitoring: When leakages are caused in underground water
pipelines there need to be a person to monitor, who had to do it manually and had to go to
the location to check if there is any cracks exist in the pipelines. But this method was very
inefficient because there was no indication if the water is already overflowing or he might
have to go and check it many times before he finishes his job. The biggest disadvantage is
that the person can’t know it before hand and this could lead to problem such as
overflowing of water and result in water wastage.
2.1.2 Acoustic leak detection: Acoustic leak detection is one of the internally-based
technologies, sometimes called as rarefaction-wave monitoring. This technology is
primarily based on detecting absolute pressure waves that are generated when a leak
occurs. Acoustic pressure waves passing inside the pipeline at the speed of sound of the
fluid that is being transported and can be detected through dynamic pressure sensors.
Numerous filters and algorithms can be used to analyze this disturbance and distinguish it
from other pressure events on the pipeline.
2.1.3 Correlate leak detection: A leak noise correlator is an electronic device used
for Leak Detection and as a leak locator to find leaks in pressurized water or gas lines.
Usually, microphones or acoustic sound sensors are located in touch with the pipe, at two
or more points, to file the sound emitted by a leak (e.g. a hissing noise) between the
points. The two recordings to decide the difference between the times it takes noise to
travel from the site of the leak to each of the sensors. Hence the sound input is processed
8th Semester, ISE, BE, HKBKCE 4 2016-2017
Development of Data Acquisition for Underground
Water and Gas Pipeline Leakage Monitoring Using IOT Literature Survey
via a mathematical algorithm which compares or correlates these recordings. If the
distance between the sensors is known in advance, this timing information can be used to
determine the location of the leak.
2.1.4 Ground penetrating radar: It is a geophysical method that uses radar pulses
to image the subsurface. This nondestructive technique uses electromagnetic reflected in
the microwave band (UHF/VHF frequencies) of the radio spectrum, and detects the
pondered signals from subsurface structures. GPR may have applications in a variety of
media, along with rock, soil, ice, fresh water, pavements and structures. In certain
circumstances, professionals can use GPR to identify subsurface objects, variations in
material properties, and voids and cracks.
GPR makes use of high-frequency (usually polarized) radio waves, normally in the range
10 MHz to 2.6 GHz. A GPR transmitter emits electromagnetic energy into the ground.
When the energy encounters a buried item or a boundary between materials having
different permittivities, it may be reflected or refracted or scattered back to the surface.
To record the variations in the return signal a receiving antenna is used. The principles
involved are similar to seismology, except GPR technique implementation
electromagnetic energy is preference to acoustic energy, the reflected energy at
boundaries where subsurface electrical properties exchange in place of subsurface
mechanical properties as is the case with seismic energy.
2.1.5 Pressure/Flow monitoring: The hydraulics of the pipeline changes due to
leaks, and thus changes the pressure or flow rate after some time. Simple leak detection
method can be obtained by local monitoring of pressure or flow rate at one point. As it is
done locally it requires in principle no telemetry. It is only useful in steady-state
conditions, however, and its ability to deal with gas pipelines is limited.
2.2 Problem statement
The current biggest issues with existing water pipeline leakage detection and monitoring
systems includes indispensible labor effort from dangerous work and to act in
inaccessible environment.
Costly repairing and monitoring
8th Semester, ISE, BE, HKBKCE 5 2016-2017
Development of Data Acquisition for Underground
Water and Gas Pipeline Leakage Monitoring Using IOT Literature Survey
Environmental damage
Lost of investment
2.3 Existing System
As we have already slightly mentioned about the few existing systems are pretty good
they still lack the availability issue and being costly. When we are paying in such large
amounts the least we can expect is that the system is constantly available for monitoring
and controlling the system. The existing water leakage monitoring and control systems
are monitored manually and controlled automatically or vice versa. There are various
systems that have been developed to support monitoring and controlling of water pipes,
but such systems will usually have a lot of disadvantages such as increased cost and labor,
also monitoring and controlling these systems will have a big disadvantage that is there
will be human intervention necessary, but this method was very inefficient because there
was no indication if the water is already overflowing or he might have to go and check it
many times before he finishes his job. The biggest disadvantage is that the person can’t
know it before hand and this could lead to problem such as overflowing of water and
result in water wastage. Let us check certain existing water level monitoring systems and
its advantages & disadvantages.
2.3.1. Pipeline Pigs
Pipeline pigs are utilized for a variety of tasks in pipeline integrity management. This
includes cleaning the pipelines, separating product batches, as well as gauging pipeline
condition. It can help gain valuable information about corrosion, cracks, wall thickness as
well as existing leaks in pipelines. In this case, we use the term smart pigging. To perform
pigging, a pig is inserted into the pipeline using a pig launcher. The pig advances through
the pipeline, propelled by the medium and gathers data along the way. A receiver is used
to guide the pig out of the pipeline in order to subsequently analyze the collected data.
Various techniques are used to collect pipeline information using smart pigs; two of the
most common are the magnetic flux leakage method and the ultrasonic principle. With the
magnetic flux leakage method, a strong permanent magnet is used to magnetize the
pipeline. Any changes to the wall of the pipe, such as corrosion, change the magnetic flux
lines which are then recorded by sensing probes attached to the pig. Following pigging,
the recorded signals are evaluated based on reference signals to detect any defects or
8th Semester, ISE, BE, HKBKCE 6 2016-2017
Development of Data Acquisition for Underground
Water and Gas Pipeline Leakage Monitoring Using IOT Literature Survey
abnormalities in the pipe wall.
2.3.2. Fiber Optic Cables
The use of fiber optic cables for the continuous external monitoring of leaks is based on
physical changes that occur at the leak site. One of those physical changes is a typical
change in temperature profile. To detect such changes, the fiber optic cable is placed
along the pipeline. A laser then emits pulses that are reflected by molecules in the fiber
optic cable. The reflected laser pulse magnitude gives insight as to the temperature at the
place where the photon hits the molecule. By adding these reflections, a temperature
profile can be made and it is then possible to detect the characteristic change in
temperature that occurs at the leak site. Monitoring pipelines with fiber optic cables is a
good option for accurately localizing leaks. However, use of this method is only possible
up to limited lengths of pipeline and many reflections are required to plot a useful
temperature profile. When installing the cable it is also necessary to pay attention to the
medium to be monitored. If it is a gas to be monitored, the cable should be installed above
the pipeline as gas normally rises. When it comes to liquids, it makes sense to install the
cable below the pipeline.
2.3.3. Gradient Intersection Method
The Gradient Intersection Method uses the pressure profile along the pipeline to localize
the leak. Ideally, the pressure drop is linear (in a horizontal pipeline without elevation
changes). If a leak occurs, the flow before the leak site increases and decreases after. This
results in an increase in the pressure drop before the leak and decreases after the leak,
whereby we obtain two lines with different slopes for the pressure profile. If you then
follow the lines to the intersection, the leak site can be determined. The advantages of this
method are that spontaneous and creeping leaks can be localized and that the accuracy is
good in stationary operation. One weakness of this method is that the accuracy depends
on the total length of the pipeline and that localizing accuracy is not good in transient
operation. In addition, with non-model-based systems you must take into account any
changes in the height, cross-section and pipe friction along the pipeline because the
pressure drop is then nonlinear due to these physical attributes of the pipeline and not
from a leak.
8th Semester, ISE, BE, HKBKCE 7 2016-2017
Development of Data Acquisition for Underground
Water and Gas Pipeline Leakage Monitoring Using IOT Literature Survey
2.3.4. Wave Propagation Method
The Wave Propagation Method uses the sound velocity of the medium in the pipeline.
Spontaneously occurring leaks create a negative pressure wave which propagates in both
directions of the pipeline at the speed of sound. Pressure gauges at the inlet and outlet
record these pressure waves and we obtain the point in time at which the pressure wave
reached the sensors. The differential time of arrival of the pressure wave can now be
obtained from these points in time. If the pressure wave arrives at both sensors at the
same time that would mean that the leak was in the middle of the pipeline as the wave
propagates in both directions at the speed of sound of the media, and if we assume a
uniform density travels at the same speed in both directions
2.3.5 Advantages
The biggest advantage is the range of these systems they can be monitored and
controlled from anywhere as long as the device is connected.
They are quite reliable because there is much human intervention.
2.3.6 Disadvantages
All though these devices are very good in terms of range it’s not worth the effort for the
investment required if availability is very poor.
They are costly to setup as well as human requires training to use the technology
efficiently.
Requires slight training before the system can be efficiently used.
May require a person to sometimes monitor the system for some possible exceptions.
2.4 Proposed System
In our proposed system we have introduced a very simple and easily applicable solution
to the problems faced by the existing system. As we know that the biggest problem with
the existing system is the demand for constant availability of a person at the target site to
check if there are any cracks existing in the pipelines. So to control the system, we can
introduce a wireless sensor based system that uses zigbee technology to monitor and
control the water leak present in the pipelines. Since cloud technology is easily available
and by making use of simple website with a user friendly UI design, any type of user can
8th Semester, ISE, BE, HKBKCE 8 2016-2017
Development of Data Acquisition for Underground
Water and Gas Pipeline Leakage Monitoring Using IOT Literature Survey
connect to the hardware which is interfaced using zigbee module and the valves can be
turned on or off whenever the sensors detects a leak in the pipelines. Here we can see that
two of the disadvantages with existing system are easily overcome. The first is immediate
intimation to the user about the leakage in the pipes and the second is much human
intervention is reduced.
2.4.1 Advantages
This can be applied in gas industries, by making use of Zigbee based systems. We
can make sure that the system is always monitored and excess gas leak is
controlled, thereby disasters caused by poisonous gas are prevented.
Authorized person can only access the device to control it.
The only requirement is a mobile device (such as mobile or laptop), with internet
to monitor and control the water or gas leakage.
Can be applied in district water supply management and can also be used to
control the wastage of water.
The proposed system can be used to prevent unnecessary wastage of water and
gas thereby reducing the cost that could be incurred.
Illegal tapping can also be detected using this system
8th Semester, ISE, BE, HKBKCE 9 2016-2017
Development of Data Acquisition for Underground
Water and Gas Pipeline Leakage Monitoring Using IOT Requirements
CHAPTER 3
REQUIREMENTS
The software requirement specification is a comprehensive description of the proposed
system. The software requirement specification describes completely what the system can
do and how it is expected to perform. An SRS (Software Requirement Specification)
helps to reduce the time and energy needed by developers to attain their desired goals and
additionally minimizes the time for development. A decent SRS defines how an
application ought to interact with the system hardware parts, different programs and
human users in an exceedingly wide selection of real world things. The parameters like
operation speed, interval, availability, portability, maintainability, foot print, security and
speed of recovery from adverse events are evaluated.
3.1 Software Requirements
Programming language Python
Linux
IOT
Embedded C
Keil uv5
3.2 Hardware Requirements
Raspberry Pi
Relays
Water flow sensors
Monitor
ARM 7 LPC2148
Moisture sensors
Power supply
8th Semester, ISE, BE, HKBKCE 10 2016-2017
Development of Data Acquisition for Underground
Water and Gas Pipeline Leakage Monitoring Using IOT Requirements
3.3 Specific Requirements
The requirements specification document enlists all necessary requirements that are
required for the project development. To derive the necessities one should have clear and
thorough understanding of the products to be developed. This is prepared after detailed
communications with the project team and customers.
3.3.1 External Interface Requirements
User Interfaces: The product should be usable from the text command line, significantly
underneath in operating systems wherever command line could be a standard common
user interface (such as Linux) however, some guidelines do apply.
Help: Help ought to be obtainable for all tools.
Feedback: Each and every tool ought to offer feedback to the user describing the results
of their last action; in alternative words, issue submissions ought to be acknowledged
with some positive indication of the result.
Simple UI Design: The main focus in the app is to make it as simple to use as possible
any layman should be able to use it. So the requirements from most probable users were
taken to understand what design would make the app simple to use.
3.4 Functional Requirements
In the functional requirement we focus on documenting the operations and activities that
our app as well as the hardware is supposed to perform and they include the following.
The description of each sensor and the values it could display.
The proper labeling of each valves and the two states that it can be in (on and off).
The requirement of the hardware is needed for the entire setup to function
seamlessly.
The description of the flow of control of the entire system.
The description of the various operations each module has to perform.
How the system will meet the applicable regulatory requirements.
8th Semester, ISE, BE, HKBKCE 11 2016-2017
Development of Data Acquisition for Underground
Water and Gas Pipeline Leakage Monitoring Using IOT Requirements
The main focus of the functional specification is that it is designed to be read by a general
audience and they should be able to understand it without having any prior technical
knowledge to be able to read and understand the document and working of the system.
3.5 Non-Functional Requirements
In terms of non-functional requirements we should be mainly focusing on the
performance requirements of our system, and at a minimum the performance requirement
should document the following:
The ideal wait time is a very important performance requirement and it is
supposed to be from the time the user provides the input to start a function till he
gets a complete and satisfactory feedback from the system so that he can continue
with the next set of instructions to be given to the system.
The next is the time interval the user has to wait for the throughput if the current
interest for the user is to wait for half the time we have specified then unless we
can provide that time interval for the throughput we cannot move forward to the
next requirement specification.
The size of the application being developed should be as small as possible because
just for the purpose of monitoring a system we should make sure the size required
shouldn’t exceed the already existing systems size requirements. Also since our
prime focus is to introduce the application to an android device and we should
consider the space constraint in case of smaller devices.
The next performance constraint that should be focused on is availability of the
entire system. We should make sure the app as well as the hardware will be
consistently providing a very good performance rating because the application of
this system is in a critical area and there is a big necessity for constant availability.
Then comes the number of users that can concurrently be connected to the same
system and also receive updates on the status of the system as well as monitor and
control the system by not interfering with other users.
8th Semester, ISE, BE, HKBKCE 12 2016-2017
Development of Data Acquisition for Underground
Water and Gas Pipeline Leakage Monitoring Using IOT Requirements
And lastly the most important requirement is that the cost of the system since most
existing systems are quite efficient as it is the only problems we face with those
systems are human intervention at inaccessible places. Since these systems are
very costly to implement we had to make sure our system will be able to handle
their disadvantage as well as be made easily available.
3.6 Safety and Security Requirements
The most important factor in any system being implemented is the safety and security
concerns. The systems being developed should be made with the thought of safety of the
users as well as the surroundings in mind. By implementing a new system they will be
only concern of how safe is the system and what are the diverse effects of the system is
implemented. In case of the system we are developing we have researched few existing
systems and the diverse effects. Some being the effects of severely limited by less-than-
ideal environmental conditions, it involves human efforts in hearing the sound waves
which effects the health, The main downside of getting an pipeline tracing system is the
cost.
Also the system being designed is mostly used in underground water pipeline and there is
a probability of wasting water due to slight crack or leak in the pipes. To avoid such
incidents a system being designed we have made sure to avoid the use of any harmful
sound waves as well as less human labor. In case of security we have made sure the
pairing cannot happen without authorization and the key required to access the system
will be available only with the higher security officials which means unless the users get
the clearance from the administrator to gain access to the systems the users cannot access
the system. By applying such security measures we can guarantee no security breaches
will occur and the system will be safe to use at all times without any disruptions to the
process and will not cause any downtime.
3.7 Software Quality Attributes
Software quality attributes are used to measure the products performance and we need to
make sure the software being developed is up to the industry standards and also to ensure
that our system meets all the below mentioned quality attributes so that all the qualities
that are to be meet is being explored :
8th Semester, ISE, BE, HKBKCE 13 2016-2017
Development of Data Acquisition for Underground
Water and Gas Pipeline Leakage Monitoring Using IOT Requirements
Reliability: Reliability is an important quality in any product for that matter. Since the
product is being used for a specific reason if the product isn’t reliable then there is no
point in using it. People can go for other similar products. And in case of the system we
are making sure that the system usability will be 100% reliable. That is, by introducing
wireless zigbee technology we want to improve reliable quality of our system.
Maintainability: The system being developed should be easier to perform maintenance
on. Any issues that may occur shouldn’t cause any large scale damage and any repairs to
be done should be easy to perform and in the system we have developed the maintenance
will be of less of human labor and easy to perform as the hard ware will be placed in an
closed location while the sensors will be placed inside the protective layer of the pipes,
making any kind of upgrades or repairs easier. Also the software is just a simple website
any latest releases will be easily accessible by a common IP address.
Usability: Usability is the factor which focuses on ease of use that is how easy it is for
people to use the system. Since the system we proposed make use of the application is the
one which is under the limelight here. The app has been designed in such a way that the
UI can’t be made anymore simpler. Any person who can understand the terms ON and
OFF can make use of the system. For as long as the app is paired to the hardware it will
be the most easiest to use as the person only needs to turn on or off the motor depending
on the sensor value which is displayed.
Portability: Portability is one of the biggest advantages with any system. If the system
can be taken to any place without having to go through a lot of trouble then that system
has the biggest advantage. Which is the case with our system, since our system is very
small and can be moved around without any issues and since there isn’t any requirement
for a specific system to be connected to this hardware for it to work we can say this
system is portable.
And since monitoring happens via mobile devices there is no need to be worried about the
systems to be moved about when relocating.
Correctness: The values being displayed in the system and the truthfulness of the results
are shown is very much important. If the system fails to show correct results or correct
values then the entire reason in installing the entire system fails. The case with our system
8th Semester, ISE, BE, HKBKCE 14 2016-2017
Development of Data Acquisition for Underground
Water and Gas Pipeline Leakage Monitoring Using IOT Requirements
is that since we are making use of digital systems to send values the possibility of any
external stimulus to cause a failure is close to zero. And since the sensors are placed
inside the tanks external disturbances are not possible.
Efficiency: Efficiency is the major system quality attribute. If the system isn’t efficient
then the whole point in introducing a solution to a problem is moot. We should make sure
the system being designed for a specific problem has to be prepared for any kind of
efficiency problems that may occur. As in our case the system was designed to make sure
the existing systems can be incorporated along with our system to complement each other
and thereby helping in improving the efficiency of the entire setup. By making sure the
systems are being merged the possible errors of the existing system will be patched by
this system and the disadvantages if any will be easily patched by the existing system.
There by providing an efficient solution to the problem.
8th Semester, ISE, BE, HKBKCE 15 2016-2017
Development of Data Acquisition for Underground
Water and Gas Pipeline Leakage Monitoring Using IOT System Design
CHAPTER 4
SYSTEM DESIGN
4.1 Introduction
System design is the phase where we address a solution to the problem statement we
mentioned earlier and plan the entire process as to achieve the entire requirement we
specified in the requirement specification stage of our project. In other terms we are
staring with a design that would help us understand how to solve all the problems
specified by the requirements specification. The system design is used to understand the
different modules in the system and the development of each module and a detailed
description of the entire system.
The system design is employed to form a communication bridge between the
requirements specification and the implementation. The system design stage shows the
variation in viewing the system from a user’s point of view to a programmer’s point of
view.
In our system design we have two modules and they are:
Hardware Module.
Software Module (Website).
In this detailed description of the system design we will be considering the various
components.
In this system we are interfacing between the hardware components via the website
application and this is happening through a two way communication using serial
transmission of data between two zigbee modules one placed along with the transmitter
and the one available at the receiver. This requirement is to be noted as without the
availability of two zigbee modules the communication cannot happen. Let us discuss the
design process from the next section.
8th Semester, ISE, BE, HKBKCE 16 2016-2017
Development of Data Acquisition for Underground
Water and Gas Pipeline Leakage Monitoring Using IOT System Design
4.2 System Architecture
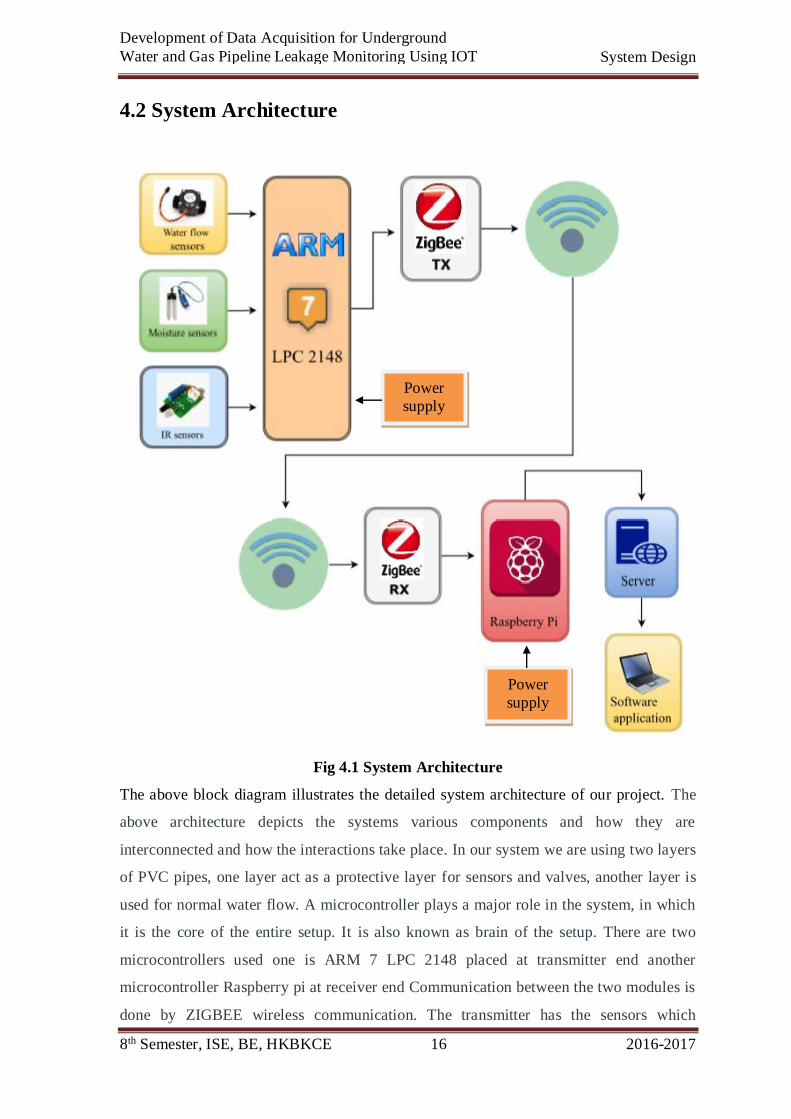
Fig 4.1 System Architecture
The above block diagram illustrates the detailed system architecture of our project. The
above architecture depicts the systems various components and how they are
interconnected and how the interactions take place. In our system we are using two layers
of PVC pipes, one layer act as a protective layer for sensors and valves, another layer is
used for normal water flow. A microcontroller plays a major role in the system, in which
it is the core of the entire setup. It is also known as brain of the setup. There are two
microcontrollers used one is ARM 7 LPC 2148 placed at transmitter end another
microcontroller Raspberry pi at receiver end Communication between the two modules is
done by ZIGBEE wireless communication. The transmitter has the sensors which
Power
supply
Power
supply
8th Semester, ISE, BE, HKBKCE 17 2016-2017
Development of Data Acquisition for Underground
Water and Gas Pipeline Leakage Monitoring Using IOT System Design
monitors the flow rate of water. The flow rate value is transmitted by a time interval of 1
second. In the receiver side the flow rate values are compared if there is a change in the
flow rate value These instructions tell the entire system what to be done and how to
interact with the android app. The zigbee module is connected to the microcontrollers to
act as an interface between the hardware and the software modules. The three sensors
(water flow sensor, IR sensor, moisture sensor) are connected to the ARM 7 LPC 2148
microcontroller and then placed inside the protective layer of the pipe for sensing the
water leakage and send the values back to the microcontroller which will forward it back
to the app. The solenoid valve connected to the microcontroller is used to close the valve
of the pipe if there is any leak. A power supply is connected to the microcontroller to
provide the entire system with the required amount of power.
The architecture consists of the two modules which our project whole they are:
Hardware module
Software module
The hardware module consists of the following components.
4.2.1 Hardware Module
Hardware:
Raspberry Pi
Solenoid valve
Water Flow sensor
Mobile App
ARM 7 LPC2148
IR Sensor
Moisture Sensor
Power Supply
8th Semester, ISE, BE, HKBKCE 18 2016-2017
Development of Data Acquisition for Underground
Water and Gas Pipeline Leakage Monitoring Using IOT System Design
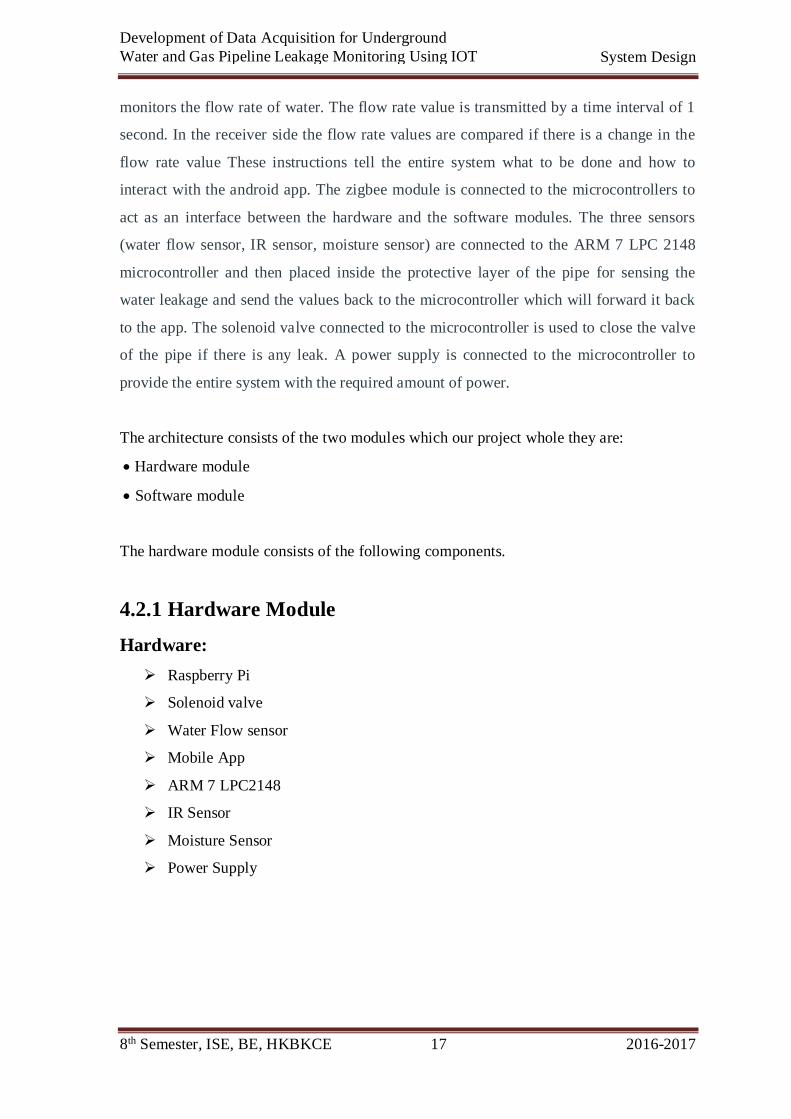
4.2.1.1 Raspberry Pi
4.2 Raspberry Pi
A Raspberry Pi is a credit card-sized pc originally designed for education, discovered by
BBC small in 1981. The Raspberry Pi is slower than a laptop or desktop, however it
remains an entire Linux computer and may give all the expected requirements that
suggests at a low-power consumption level. Here's how it works: An SD card inserted
into the slot on the board acts because the disk drive for the Raspberry Pi. It is powered
by USB and the video output can be hooked up to a traditional RCA TV set, a more
modern monitor, or even a TV using the HDMI port.
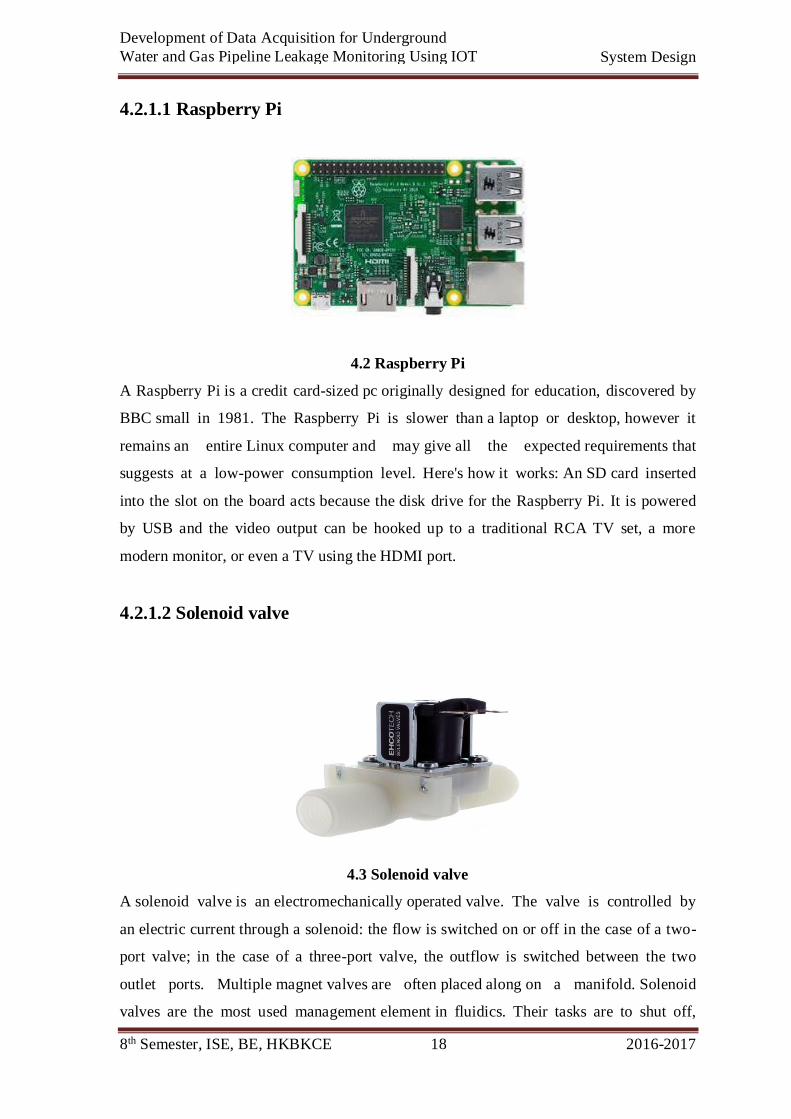
4.2.1.2 Solenoid valve
4.3 Solenoid valve
A solenoid valve is an electromechanically operated valve. The valve is controlled by
an electric current through a solenoid: the flow is switched on or off in the case of a two-
port valve; in the case of a three-port valve, the outflow is switched between the two
outlet ports. Multiple magnet valves are often placed along on a manifold. Solenoid
valves are the most used management element in fluidics. Their tasks are to shut off,
8th Semester, ISE, BE, HKBKCE 19 2016-2017
Development of Data Acquisition for Underground
Water and Gas Pipeline Leakage Monitoring Using IOT System Design
release, dose, distribute or combine fluids. They are found in several application areas.
Solenoids provide quick and safe switching, high reliability, long service life, smart
medium compatibility of the materials used, low management power and compact design.
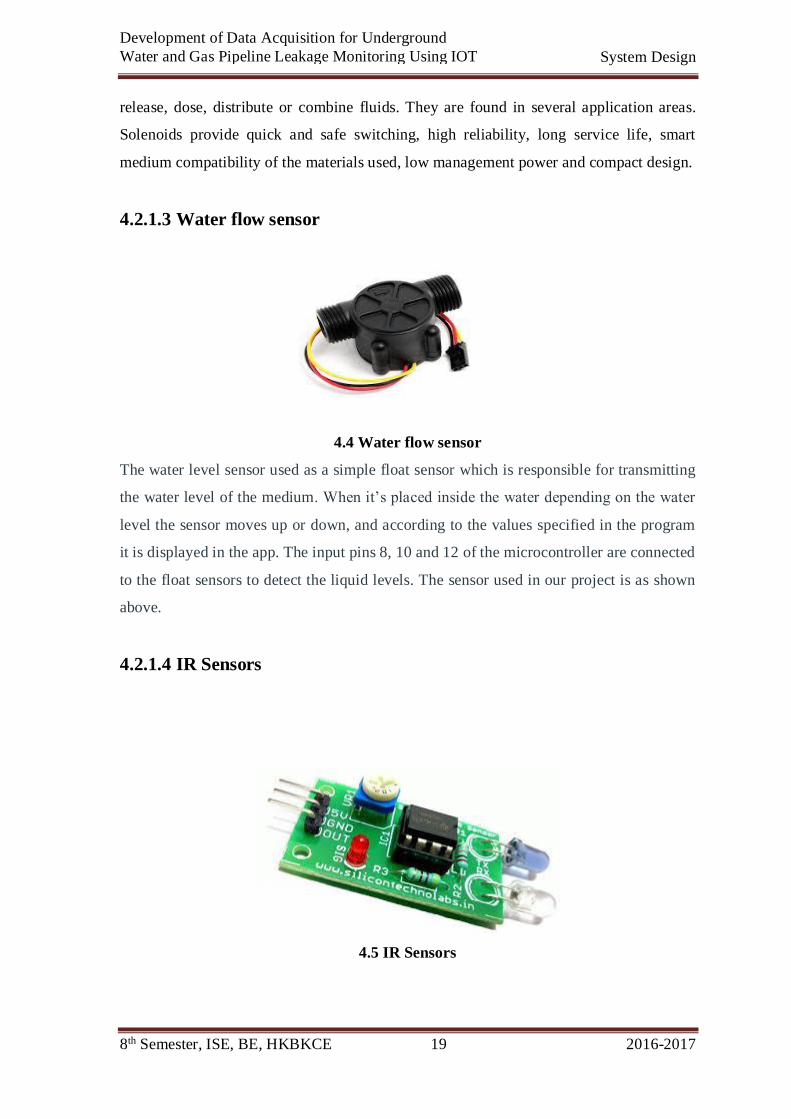
4.2.1.3 Water flow sensor
4.4 Water flow sensor
The water level sensor used as a simple float sensor which is responsible for transmitting
the water level of the medium. When it’s placed inside the water depending on the water
level the sensor moves up or down, and according to the values specified in the program
it is displayed in the app. The input pins 8, 10 and 12 of the microcontroller are connected
to the float sensors to detect the liquid levels. The sensor used in our project is as shown
above.
4.2.1.4 IR Sensors
4.5 IR Sensors
8th Semester, ISE, BE, HKBKCE 20 2016-2017
Development of Data Acquisition for Underground
Water and Gas Pipeline Leakage Monitoring Using IOT System Design
Infrared radiation, or simply infrared or IR sensor, is an electromagnetic radiation (EMR)
with longer wavelengths than those of visible light, and is therefore invisible, although it
is sometimes loosely called infrared light. It extends from the nominal red edge of
the visible spectrum at 700 nanometers (frequency 430 THz), to 1000000 nm (300 GHz)
(although people can see infrared up to at least 1050 nm in experiments). Most of
the thermal radiation emitted by objects near room temperature is infrared. Like all EMR,
IR carries radiant energy, and behaves both like a wave and like its quantum particle,
the photon. Infrared radiation is emitted or absorbed by molecules when they change
their rotational-vibrational movements.
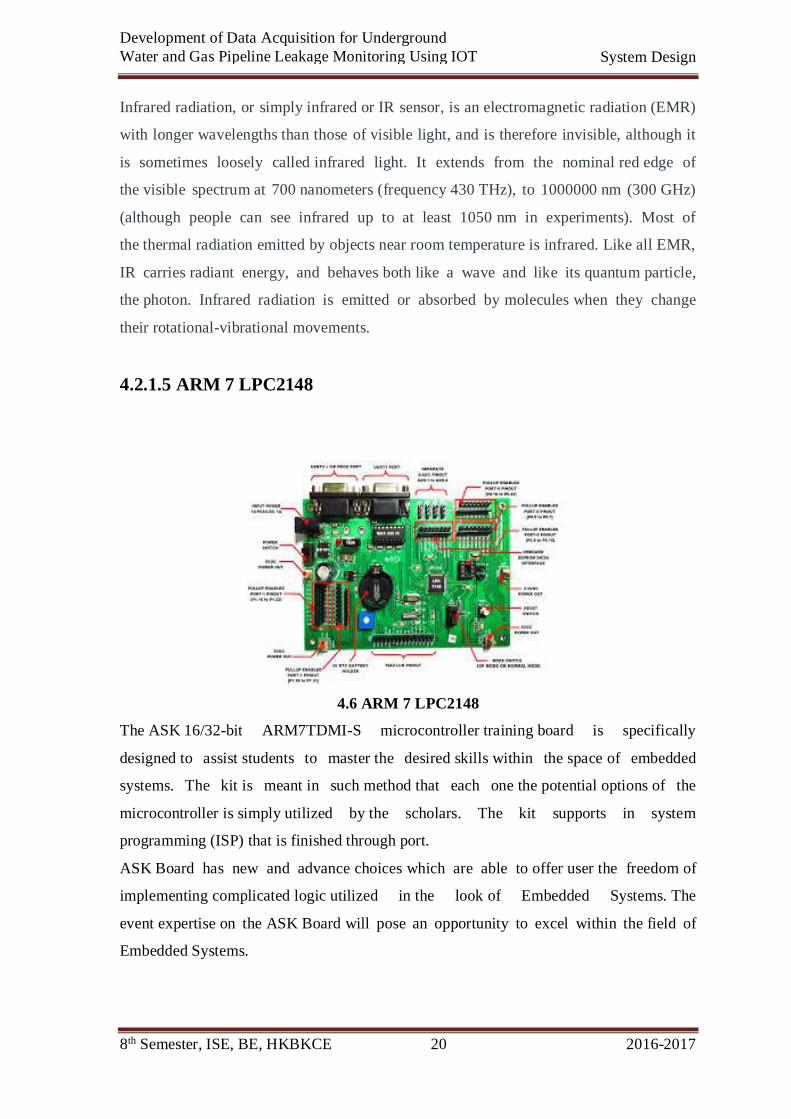
4.2.1.5 ARM 7 LPC2148
4.6 ARM 7 LPC2148
The ASK 16/32-bit ARM7TDMI-S microcontroller training board is specifically
designed to assist students to master the desired skills within the space of embedded
systems. The kit is meant in such method that each one the potential options of the
microcontroller is simply utilized by the scholars. The kit supports in system
programming (ISP) that is finished through port.
ASK Board has new and advance choices which are able to offer user the freedom of
implementing complicated logic utilized in the look of Embedded Systems. The
event expertise on the ASK Board will pose an opportunity to excel within the field of
Embedded Systems.
8th Semester, ISE, BE, HKBKCE 21 2016-2017
Development of Data Acquisition for Underground
Water and Gas Pipeline Leakage Monitoring Using IOT System Design
4.2.1.6 Moisture Sensor
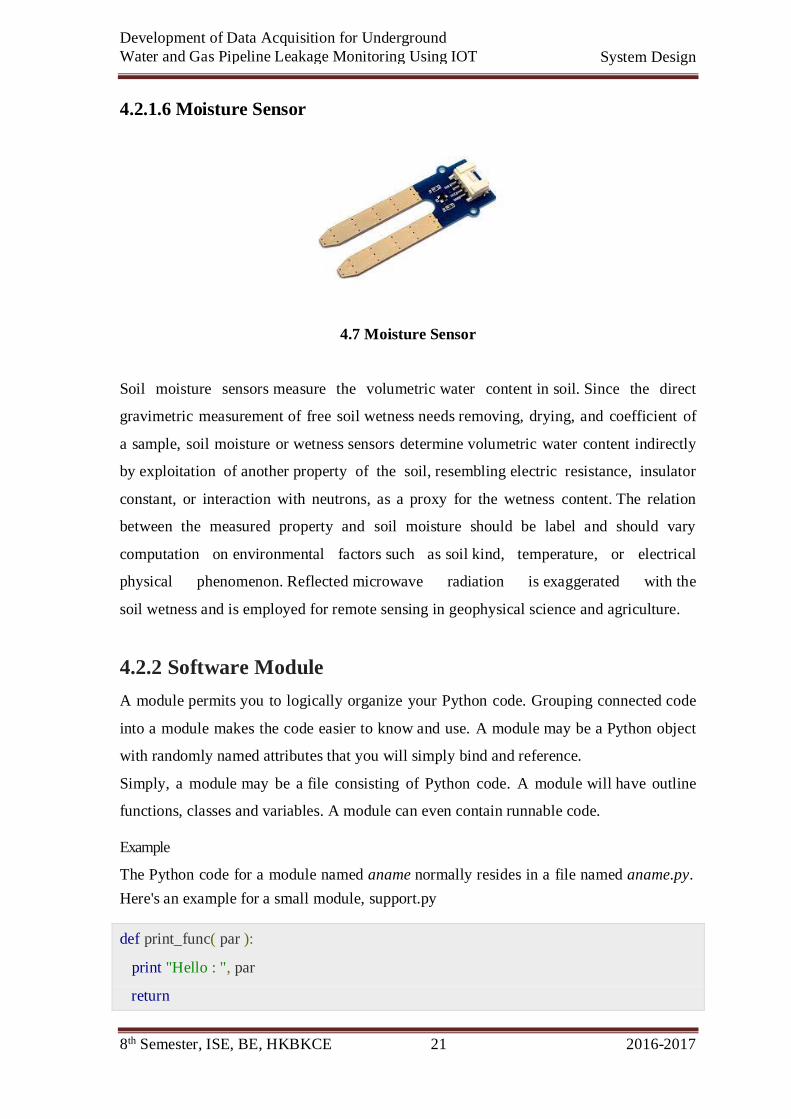
4.7 Moisture Sensor
Soil moisture sensors measure the volumetric water content in soil. Since the direct
gravimetric measurement of free soil wetness needs removing, drying, and coefficient of
a sample, soil moisture or wetness sensors determine volumetric water content indirectly
by exploitation of another property of the soil, resembling electric resistance, insulator
constant, or interaction with neutrons, as a proxy for the wetness content. The relation
between the measured property and soil moisture should be label and should vary
computation on environmental factors such as soil kind, temperature, or electrical
physical phenomenon. Reflected microwave radiation is exaggerated with the
soil wetness and is employed for remote sensing in geophysical science and agriculture.
4.2.2 Software Module
A module permits you to logically organize your Python code. Grouping connected code
into a module makes the code easier to know and use. A module may be a Python object
with randomly named attributes that you will simply bind and reference.
Simply, a module may be a file consisting of Python code. A module will have outline
functions, classes and variables. A module can even contain runnable code.
Example
The Python code for a module named aname normally resides in a file named aname.py.
Here's an example for a small module, support.py
def print_func( par ):
print "Hello : ", par
return
8th Semester, ISE, BE, HKBKCE 22 2016-2017
Development of Data Acquisition for Underground
Water and Gas Pipeline Leakage Monitoring Using IOT System Design
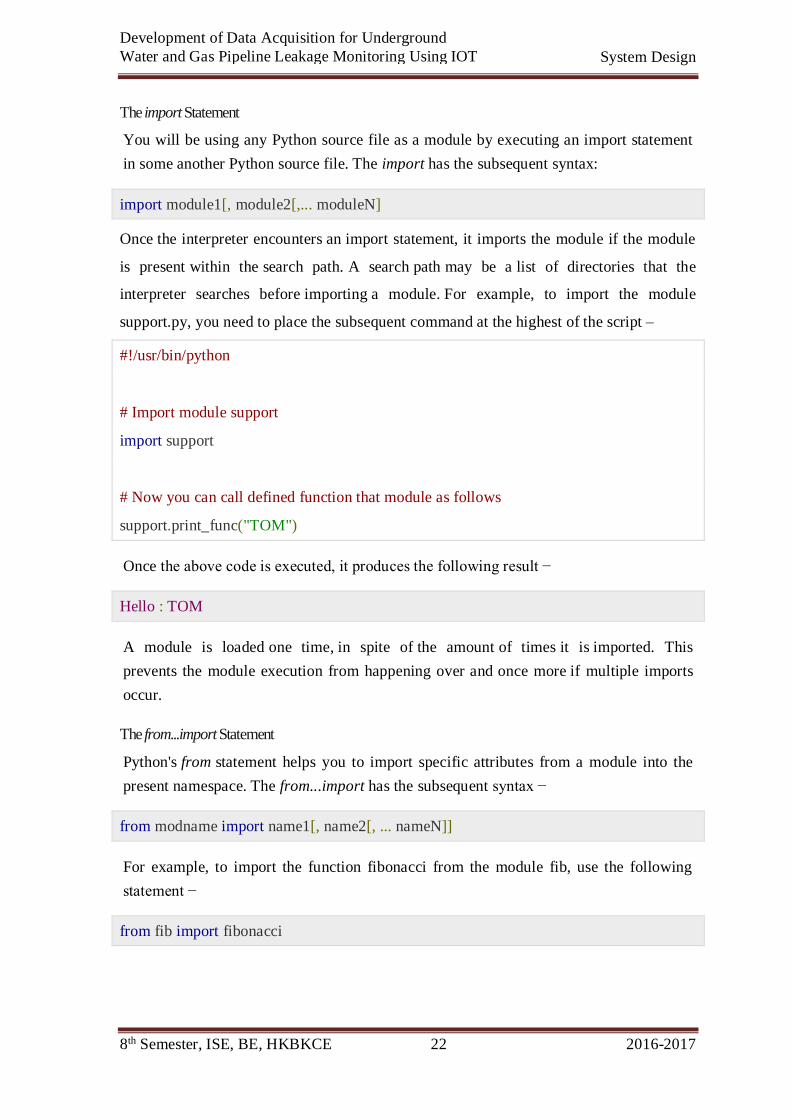
The import Statement
You will be using any Python source file as a module by executing an import statement
in some another Python source file. The import has the subsequent syntax:
import module1[, module2[,... moduleN]
Once the interpreter encounters an import statement, it imports the module if the module
is present within the search path. A search path may be a list of directories that the
interpreter searches before importing a module. For example, to import the module
support.py, you need to place the subsequent command at the highest of the script –
#!/usr/bin/python
# Import module support
import support
# Now you can call defined function that module as follows
support.print_func("TOM")
Once the above code is executed, it produces the following result −
Hello : TOM
A module is loaded one time, in spite of the amount of times it is imported. This
prevents the module execution from happening over and once more if multiple imports
occur.
The from...import Statement
Python's from statement helps you to import specific attributes from a module into the
present namespace. The from...import has the subsequent syntax −
from modname import name1[, name2[, ... nameN]]
For example, to import the function fibonacci from the module fib, use the following
statement −
from fib import fibonacci
8th Semester, ISE, BE, HKBKCE 23 2016-2017
Development of Data Acquisition for Underground
Water and Gas Pipeline Leakage Monitoring Using IOT System Design
This statement does not import the complete module fib into the present namespace; it
just introduces the item fibonacci from the module fib into the worldwide symbol table
of the importing module.
The from...import * Statement:
It is also possible to import all names from a module into the present namespace by
using the following import statement −
from modname import *
This provides an easy way to import all the items from a module into the present
namespace; however, this statement should be used sparingly.
Locating Modules
When you import a module, the Python interpreter searches for the module within the
following sequences −
The current directory.
If the module is not found, Python then searches every directory in the shell
variable PYTHONPATH.
If all else fails, Python checks the default path. On UNIX, this default path is
generally /usr/local/lib/python/.
The module search path is hold on within the system module sys as
the sys.path variable. The sys.path variable contains the current directory,
PYTHONPATH, and therefore the installation-dependent default.
The PYTHONPATH Variable:
The PYTHONPATH is an environment variable, consisting of a list of directories. The
syntax of PYTHONPATH is the same as that of the shell variable PATH.
Here maybe a typical PYTHONPATH from a Windows system:
set PYTHONPATH=c:\python20\lib;
And here is a typical PYTHONPATH from a UNIX system:
set PYTHONPATH=/usr/local/lib/python
8th Semester, ISE, BE, HKBKCE 24 2016-2017
Development of Data Acquisition for Underground
Water and Gas Pipeline Leakage Monitoring Using IOT System Design
Namespaces and Scoping
Variables are names (identifiers) that map to objects. A namespace may be a lexicon of
variable names (keys) and their corresponding objects (values).
A Python statement will access variables in a local namespace and within the global
namespace. If a local and a global variable have an equivalent name, the local variable
shadows the global variable.
Each function has its own local namespace. Class methods follow constant scoping rule
as normal functions.
Python makes educated guesses on whether the variables are local or global. It assumes
that any variable allotted a value is local.
Therefore, as to assign a value to a global variable within a function, you want to
initialize the global statement.
The statement global VarName tells Python that VarName is a global variable. Python
stops looking out the local namespace for the variable.
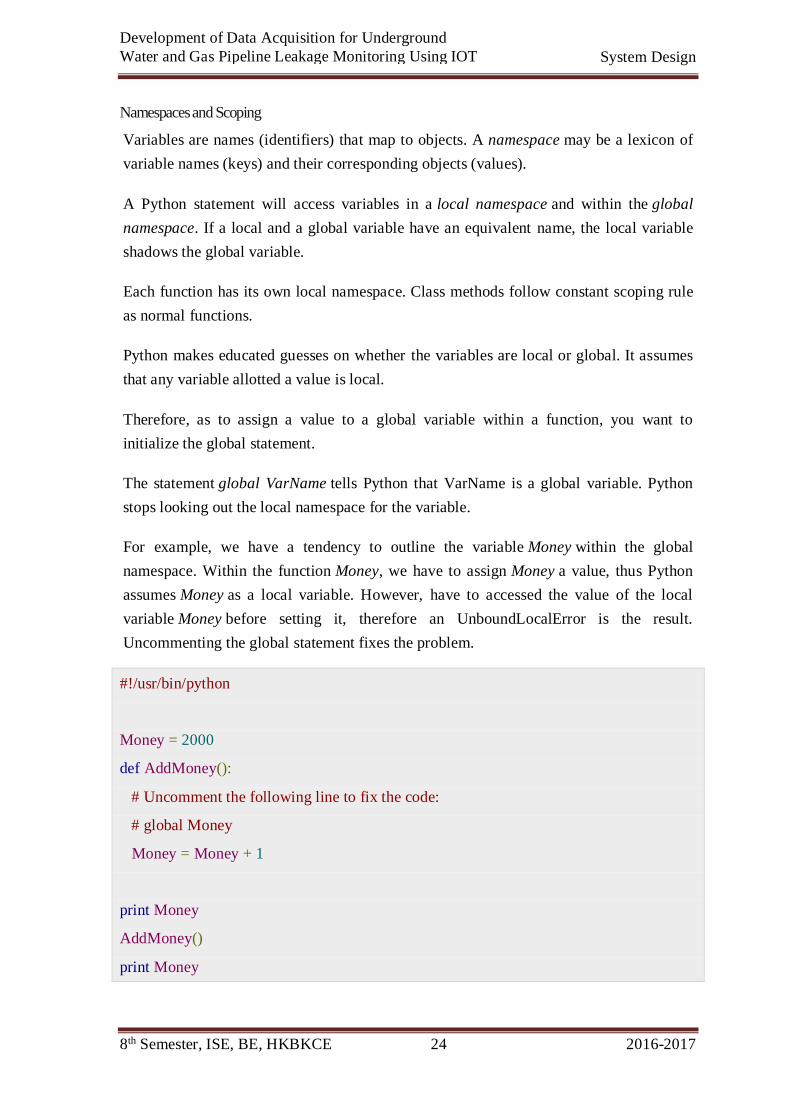
For example, we have a tendency to outline the variable Money within the global
namespace. Within the function Money, we have to assign Money a value, thus Python
assumes Money as a local variable. However, have to accessed the value of the local
variable Money before setting it, therefore an UnboundLocalError is the result.
Uncommenting the global statement fixes the problem.
#!/usr/bin/python
Money = 2000
def AddMoney():
# Uncomment the following line to fix the code:
# global Money
Money = Money + 1
print Money
AddMoney()
print Money
8th Semester, ISE, BE, HKBKCE 25 2016-2017
Development of Data Acquisition for Underground
Water and Gas Pipeline Leakage Monitoring Using IOT System Design
The dir( ) Function
The dir() built-in function returns a sorted list of strings containing the names defined by
a module.
The list contains the names of all the modules, variables and functions that are defined in
a module. Following is one easy example −
#!/usr/bin/python
# Import built-in module math
import math
content = dir(math)
print content
Once the above code is executed, it produces the subsequent result −
['__doc__', '__file__', '__name__', 'acos', 'asin', 'atan',
'atan2', 'ceil', 'cos', 'cosh', 'degrees', 'e', 'exp',
'fabs', 'floor', 'fmod', 'frexp', 'hypot', 'ldexp', 'log',
'log10', 'modf', 'pi', 'pow', 'radians', 'sin', 'sinh',
'sqrt', 'tan', 'tanh']
Here, the special string variable __name__ is the module's name, and __file__ is the
filename from which the module was loaded.
The globals() and locals() Functions −
The globals() and locals() functions will be used to return the names within the global
and local namespaces looking on the place from wherever they are referred to.
If locals() is termed from a function, it will return all the names which will be accessed
locally from that function.
If globals() is termed from a function, it will return all the names which will be accessed
globally from that function.
The return type of each of these functions is dictionary. Therefore, names will be
extracted by the keys() function.
8th Semester, ISE, BE, HKBKCE 26 2016-2017
Development of Data Acquisition for Underground
Water and Gas Pipeline Leakage Monitoring Using IOT System Design
The reload() Function
Once the module is imported into a script, the code within the top-level portion of a
module is executed just once.
Therefore, if you want to reexecute the top-level code in a module, you will be able to
use the reload() function. The reload() function imports a formerly imported module
once again. The syntax of the reload() function is that is −
reload(module_name)
Here, module_name is the name of the module you would like to reload and not the
string containing the module name. For example, to reload hello module, do the
following −
reload(hello)
Packages in Python
A package is a hierarchical file directory structure that defines a one Python application
environment that consists of modules and subpackages and sub-subpackages, and so on.
Consider a file Pots.py available in Phone directory. This file has following line of
source code −
#!/usr/bin/python
def Pots():
print "I'm Pots Phone"
Similar way, we have another two files having different functions with a similar name as
above −
Phone/Isdn.py file contain function Isdn()
Phone/G3.py file contain function G3()
At this time, create one more file __init__.py in Phone directory −
Phone/__init__.py
To create all of your functions available when you've imported Phone, you would like to
place explicit import statements in __init__.py as follows −
8th Semester, ISE, BE, HKBKCE 27 2016-2017
Development of Data Acquisition for Underground
Water and Gas Pipeline Leakage Monitoring Using IOT System Design
from Pots import Pots
from Isdn import Isdn
from G3 import G3
After you add these lines to __init__.py, you have all of these classes available when you
import the Phone package.
#!/usr/bin/python
# Now import your Phone Package.
import Phone
Phone.Pots()
Phone.Isdn()
Phone.G3()
Once the above code is executed, it generates the subsequent result −
I'm Pots Phone
I'm 3G Phone
I'm ISDN Phone
In the above example, we have taken example of a single function in each file, but you
can keep multiple functions in your files. You can additionally outline the different
Python classes in those files and then you can create your packages out of those classes.
8th Semester, ISE, BE, HKBKCE 28 2016-2017
Development of Data Acquisition for Underground
Water and Gas Pipeline Leakage Monitoring Using IOT System Design
4.2.3 Activity Life Cycle of Personal Computer (PC)
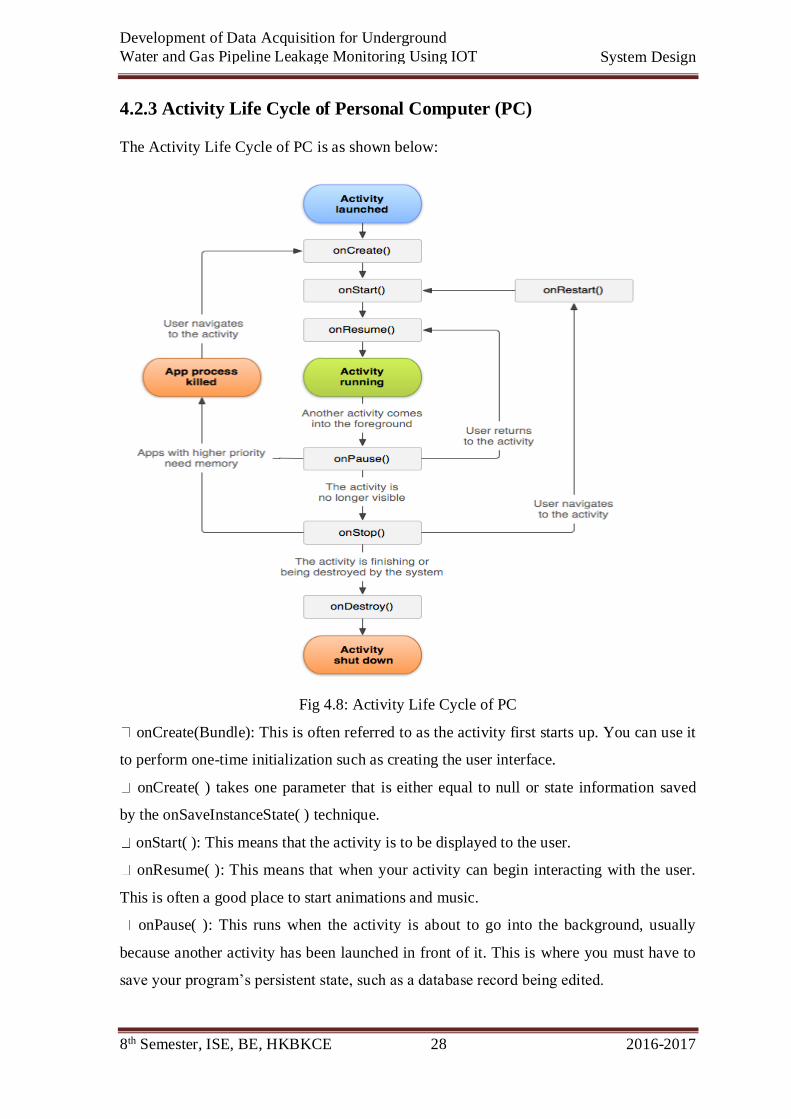
The Activity Life Cycle of PC is as shown below:
Fig 4.8: Activity Life Cycle of PC
onCreate(Bundle): This is often referred to as the activity first starts up. You can use it
to perform one-time initialization such as creating the user interface.
onCreate( ) takes one parameter that is either equal to null or state information saved
by the onSaveInstanceState( ) technique.
onStart( ): This means that the activity is to be displayed to the user.
onResume( ): This means that when your activity can begin interacting with the user.
This is often a good place to start animations and music.
onPause( ): This runs when the activity is about to go into the background, usually
because another activity has been launched in front of it. This is where you must have to
save your program’s persistent state, such as a database record being edited.
8th Semester, ISE, BE, HKBKCE 29 2016-2017
Development of Data Acquisition for Underground
Water and Gas Pipeline Leakage Monitoring Using IOT System Design
onStop( ): This is often known as when your activity is not any longer visible to the
user and it won’t be required for a short time. If the memory is tight, onStop( ) could
never be known as (the system may simply terminate your process).
onRestart( ): If this process is called, it indicates that your activity is being redisplayed
to the user from a stopped state.
onDestroy( ): This is often known as the right before your activity is destroyed. If the
memory is tight, onDestroy( ) could never be known as (the system may simply terminate
your process).
onSaveInstanceState(Bundle): PC can call this process to permit the activity to avoid
wasting per-instance state, similar to a pointer position among a text field. Usually you
won’t have to compelled to override it because the default implementation saves the state
for all your user interface controls mechanically.
onRestoreInstanceState(Bundle): This is often known as the activity is being reinitialized
from a state previously saved by the onSaveInstanceState( ) method. The default
implementation restores the state of your user interface.
Platform Selection
The reason we selected PC/android as the platform is because it is an open source
platform and is available to users because it is user friendly. Although the websites can be
made for cross platform as of now the websites run very well in the PC. The other reasons
why android can be used is because most common people can afford an android device
when compared to other devices. And the platform is chosen as a PC where we can store
large amount of data than in androids.
Language Selection
Python is the language used to develop the website from the system point of view, and in
the hardware logic coding. The reason why we chose python is because of its robust
nature and no difficulty to use. We could bend the logic to our will and create a very
concise and efficient website for the PC’s. More over the PC’s has a built in platform in
it, and development of websites is well suited with python than any other programming
languages. We could have used C# or Objective C but to apply this in a PC would require
us to implement the required libraries to be included inside the websites. Also this would
put quite a lot of strain on the users as well by having to configure the website by the
8th Semester, ISE, BE, HKBKCE 30 2016-2017
Development of Data Acquisition for Underground
Water and Gas Pipeline Leakage Monitoring Using IOT System Design
users themselves whereas by making use of python and built in tools we can make the OS
perform all this tasks without making the user worry about its internal functions.
Python is once again an open source system and the coding is simpler as we can make use
of simple C programming logic along with the coding required to interface the hardware.
4.3 DATA FLOW DIAGRAMS
A DFD is a graphical representation of the flow of the data that flows entirely through the
system. A DFD can also be used to envision the flow of data through the system. The data
can flow from an outsider source of data or from an insider source of data to an external
destination or an internal destination itself through an internal method or subroutine. A data
flow diagram is an imaginative and instinctive way of displaying how the data and
information is processed and flows inside the system. These Data flow diagrams are mainly
used to explain the system design and how the data flow in a specific sequence will change
the system behavior and how it affects the system as a whole. If there are older systems of
similar type the DFD’s of those systems can be compared with new DFD’s to obtain
comparisons and will help is implementing a very efficient system.
The data flow diagrams will help in providing a physical idea to the common users in
understanding when the data is provided as an input how the system processes it and makes it
into a meaningful information or output, and that each input will ultimately have some or the
other effect to the systems functioning.
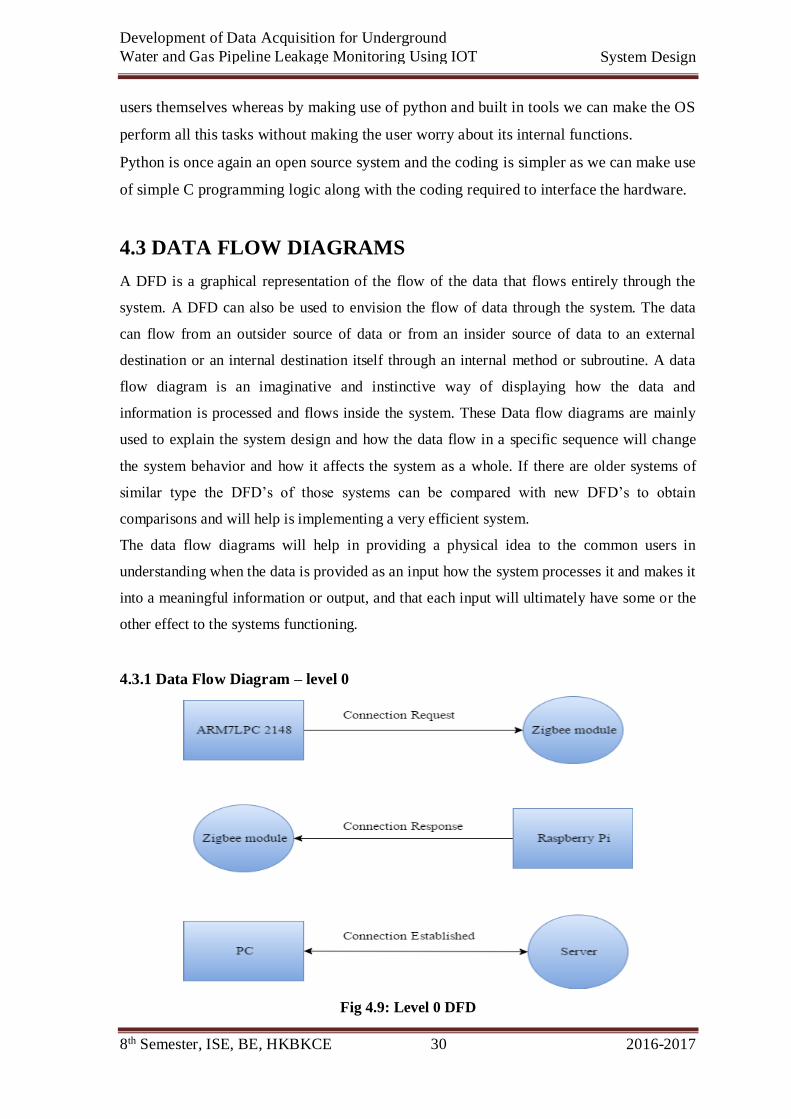
4.3.1 Data Flow Diagram – level 0
Fig 4.9: Level 0 DFD
8th Semester, ISE, BE, HKBKCE 31 2016-2017
Development of Data Acquisition for Underground
Water and Gas Pipeline Leakage Monitoring Using IOT System Design
The level 0 DFD is commonly referred to as the context level DFD’s and it is mainly created
for the purpose of depicting the outsider’s involvement in the system. The designers usually
create this to show how exactly different entities can interact with the system and how the
system can be controlled by the users to make efficient use of the system. These Level 0
DFD’s are then explored to get a detailed description of the remaining system. In the Fig we
have one entity that is the user controlling by PC. We have a system component Zigbee
module which is used in the project. This Zigbee is used as an interface between the
Raspberry pi and the ARM7 LPC 2148 board. The user to gain access to the system needs,
the system should connect via Server. For that the user utilizes the connect ( ) method to send
a connection request to start a serial communication and once paired with the system it will
send an acknowledgement back stating connection has been established.
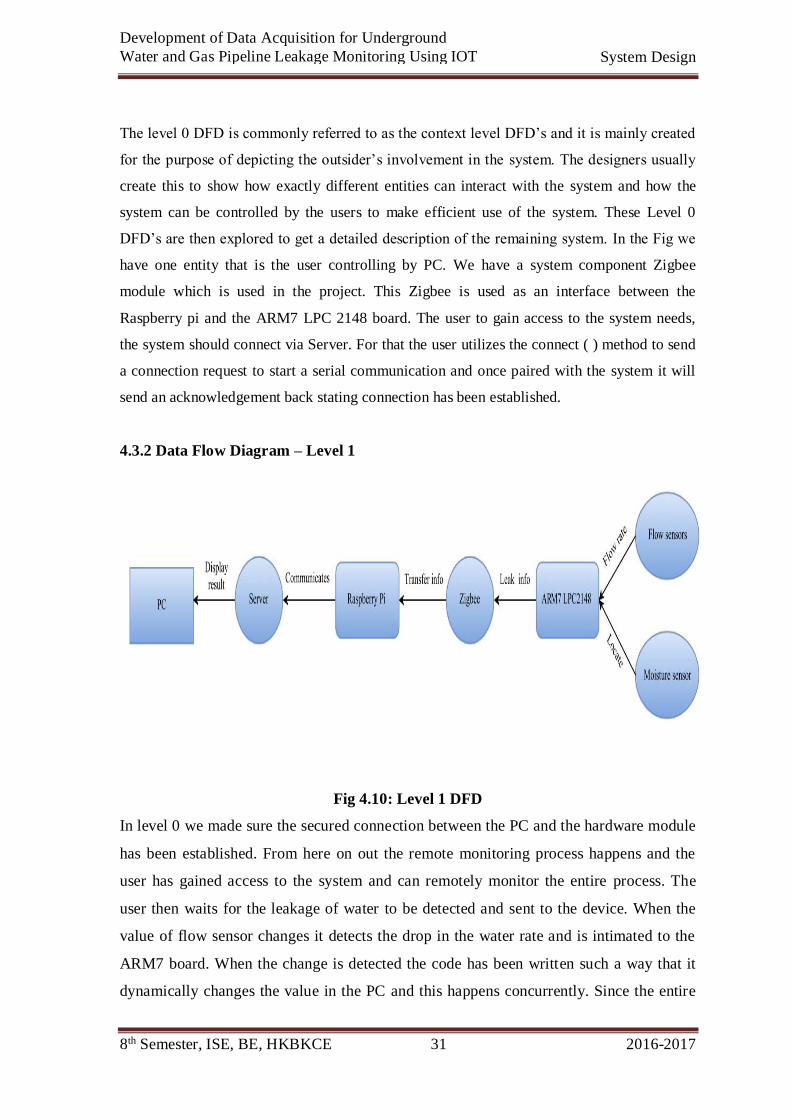
4.3.2 Data Flow Diagram – Level 1
Fig 4.10: Level 1 DFD
In level 0 we made sure the secured connection between the PC and the hardware module
has been established. From here on out the remote monitoring process happens and the
user has gained access to the system and can remotely monitor the entire process. The
user then waits for the leakage of water to be detected and sent to the device. When the
value of flow sensor changes it detects the drop in the water rate and is intimated to the
ARM7 board. When the change is detected the code has been written such a way that it
dynamically changes the value in the PC and this happens concurrently. Since the entire
8th Semester, ISE, BE, HKBKCE 32 2016-2017
Development of Data Acquisition for Underground
Water and Gas Pipeline Leakage Monitoring Using IOT System Design
system is synchronized we can get updates to the second and can be constantly
monitored. The user can then issue the command based on his requirements.
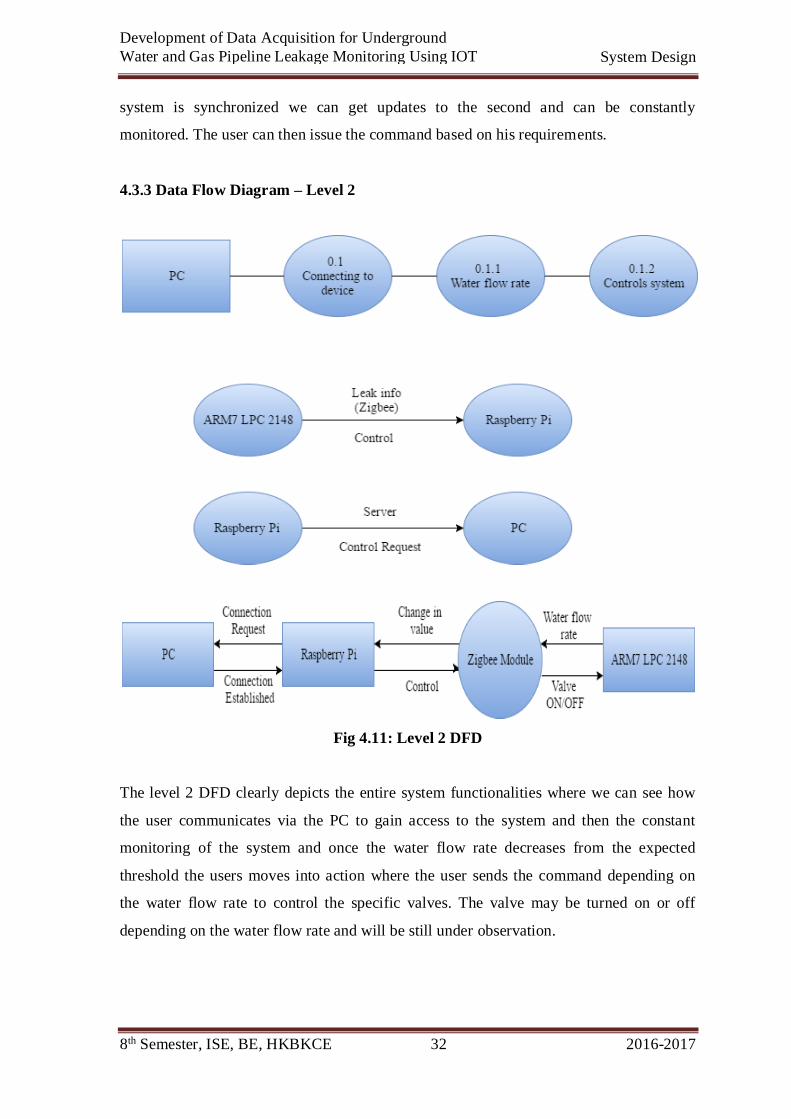
4.3.3 Data Flow Diagram – Level 2
Fig 4.11: Level 2 DFD
The level 2 DFD clearly depicts the entire system functionalities where we can see how
the user communicates via the PC to gain access to the system and then the constant
monitoring of the system and once the water flow rate decreases from the expected
threshold the users moves into action where the user sends the command depending on
the water flow rate to control the specific valves. The valve may be turned on or off
depending on the water flow rate and will be still under observation.
8th Semester, ISE, BE, HKBKCE 33 2016-2017
Development of Data Acquisition for Underground
Water and Gas Pipeline Leakage Monitoring Using IOT System Design
4.4 Context Analysis
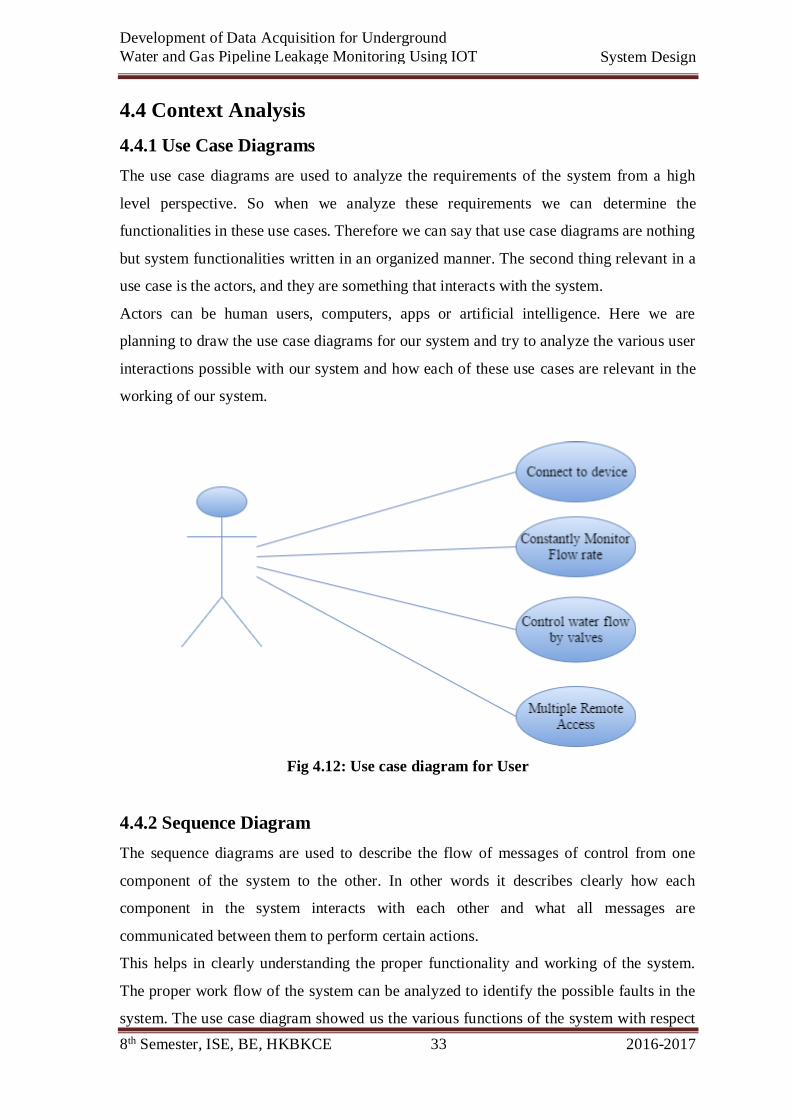
4.4.1 Use Case Diagrams
The use case diagrams are used to analyze the requirements of the system from a high
level perspective. So when we analyze these requirements we can determine the
functionalities in these use cases. Therefore we can say that use case diagrams are nothing
but system functionalities written in an organized manner. The second thing relevant in a
use case is the actors, and they are something that interacts with the system.
Actors can be human users, computers, apps or artificial intelligence. Here we are
planning to draw the use case diagrams for our system and try to analyze the various user
interactions possible with our system and how each of these use cases are relevant in the
working of our system.
Fig 4.12: Use case diagram for User
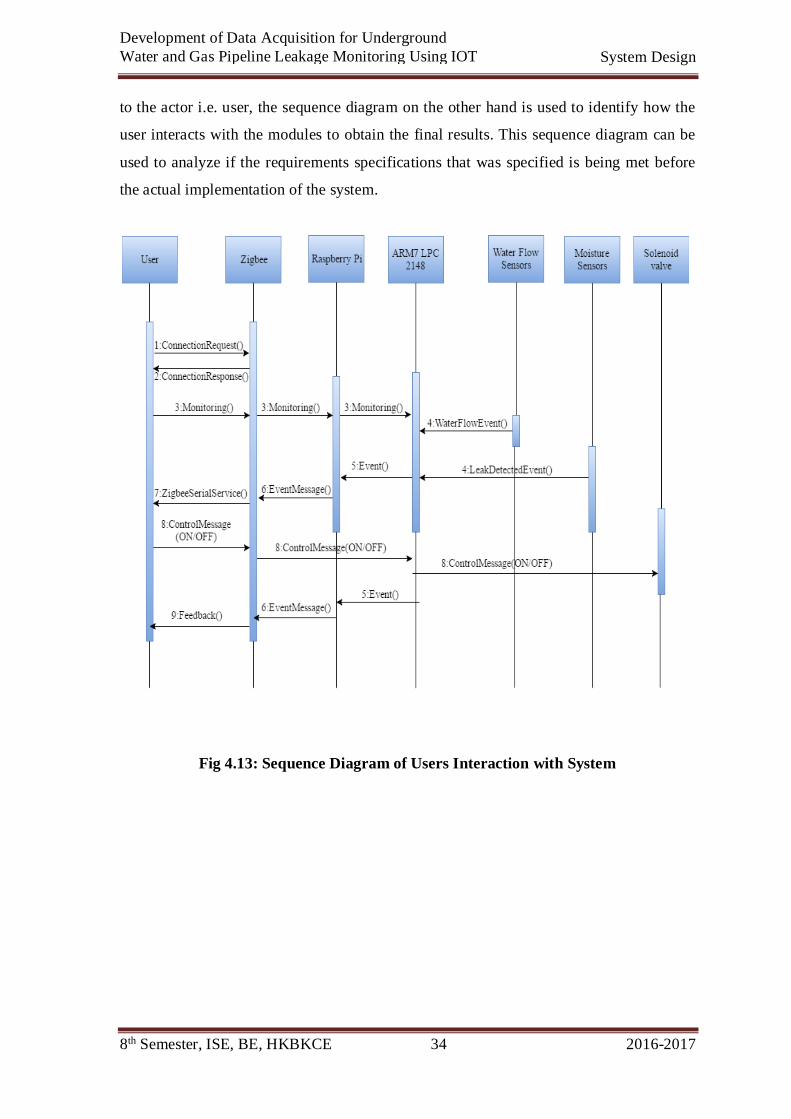
4.4.2 Sequence Diagram
The sequence diagrams are used to describe the flow of messages of control from one
component of the system to the other. In other words it describes clearly how each
component in the system interacts with each other and what all messages are
communicated between them to perform certain actions.
This helps in clearly understanding the proper functionality and working of the system.
The proper work flow of the system can be analyzed to identify the possible faults in the
system. The use case diagram showed us the various functions of the system with respect
8th Semester, ISE, BE, HKBKCE 34 2016-2017
Development of Data Acquisition for Underground
Water and Gas Pipeline Leakage Monitoring Using IOT System Design
to the actor i.e. user, the sequence diagram on the other hand is used to identify how the
user interacts with the modules to obtain the final results. This sequence diagram can be
used to analyze if the requirements specifications that was specified is being met before
the actual implementation of the system.
Fig 4.13: Sequence Diagram of Users Interaction with System
8th Semester, ISE, BE, HKBKCE 35 2016-2017
Development of Data Acquisition for Underground
Water and Gas Pipeline Leakage Monitoring Using IOT Implementation
CHAPTER 5
IMPLEMENTATION
5.1 Introduction
Implementation stage is where we convert our design into a working real world system.
We need to put together all the details we collected in the requirements and design stage
and device a plan to give shape to our system. By incorporating all the designs and
requirements we can start our implementation of the system by coding the entire system
according to the architecture and the various functions and system properties we devised
in the sequence diagrams as well as ensure all the use cases can be incorporated in the
systems implementation We have two modules that needs to be implemented and the
third is the interface between these two modules. The two modules are software and
hardware the software module mainly uses the python language to create a framework for
the entire design and create system logic as well as the engine to make the entire system
function as required. The software module is as explained below:
5.2 Hardware Module Implementation
A module permits you to logically arrange your Python code. Usually by grouping
related code into a module makes the code easier to understand and use. A module is a
Python object with randomly named attributes that you can bind and reference.
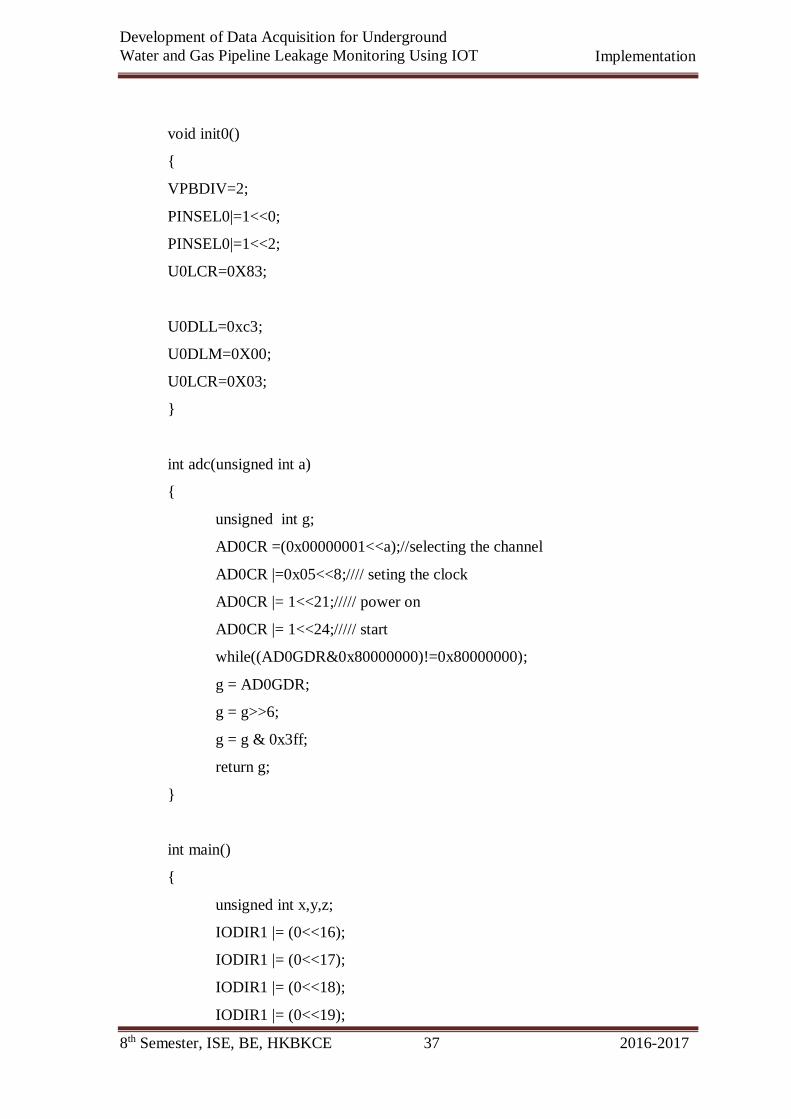
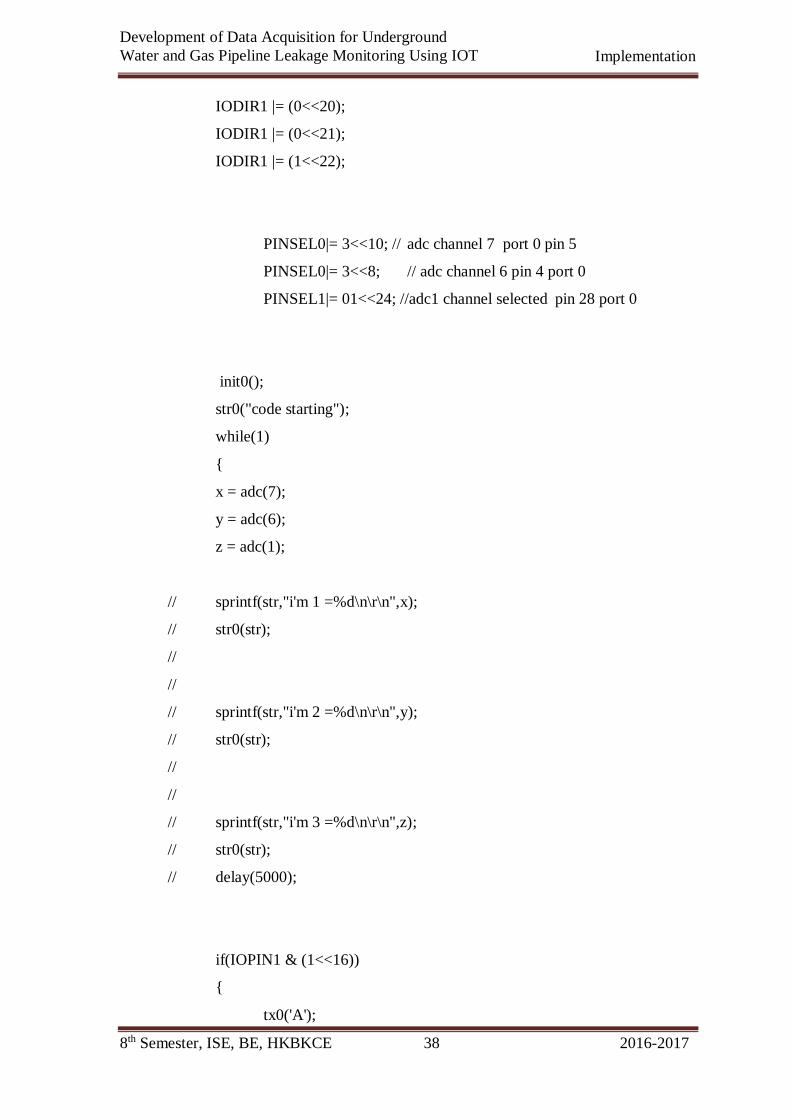
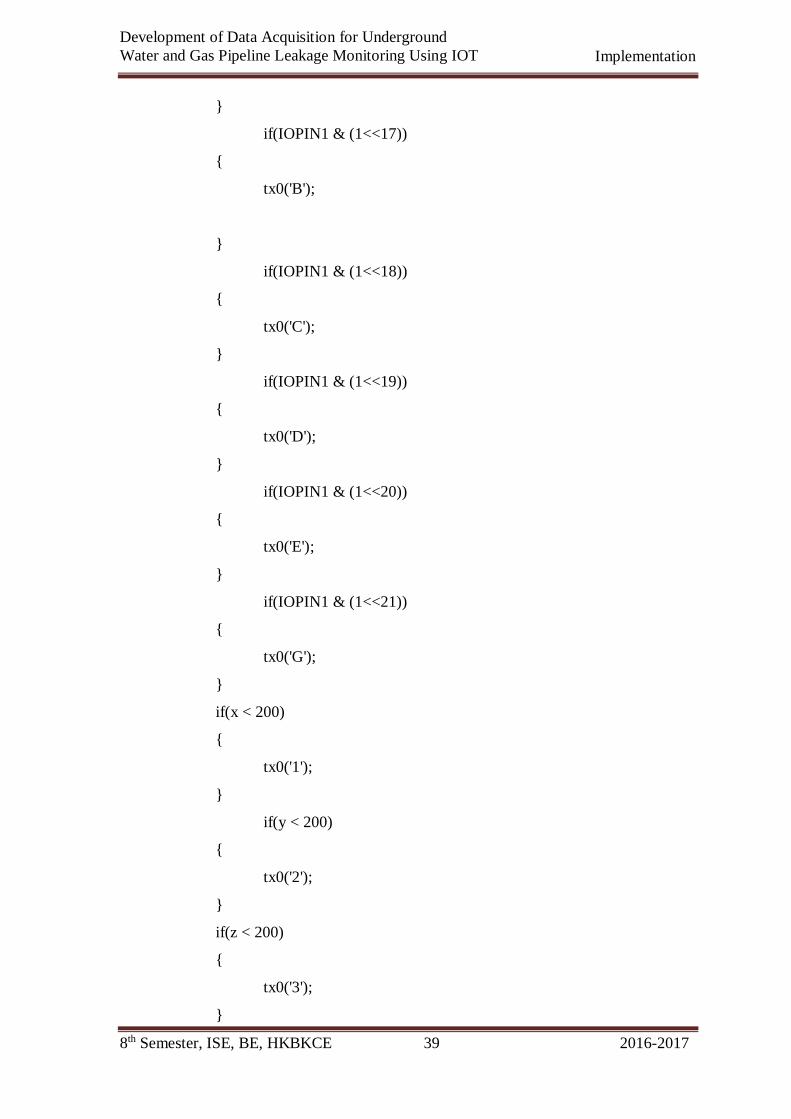
5.2.1. Code for functioning of ARM7 microcontroller
The following code is used to implement the working of the ARM7 microcontroller
which is buried underground. It involves collaboration of three components that is water
flow sensors, solenoid valve, and moisture sensor.
Flow sensors return the water flow status to the microcontroller based on the water flow.
And based on sensing of leaked water by the moisture sensor, the status of the moisture
sensor is received from the ARM7 microcontroller. Thereby the solenoid valve is
controlled (ON/OFF) by using relay. It sends and receives information serially.
#include<lpc214x.h>
#include<stdio.h>
char str[10] = " ";
8th Semester, ISE, BE, HKBKCE 36 2016-2017
Development of Data Acquisition for Underground
Water and Gas Pipeline Leakage Monitoring Using IOT Implementation
void delay(int x)
{
int i,j;
for(i = 0;i<x;i++)
for(j = 0;j<1275;j++);
}
void tx0(char x)
{
while((U0LSR&0x20)!=0x20);
U0THR=x;
}
char rx0()
{
while((U0LSR&0x01)!=0x01);
{
return U0RBR;
}
}
void str0(char *p )
{
while(*p)
{
tx0(*p++);
}
}
8th Semester, ISE, BE, HKBKCE 37 2016-2017
Development of Data Acquisition for Underground
Water and Gas Pipeline Leakage Monitoring Using IOT Implementation
void init0()
{
VPBDIV=2;
PINSEL0|=1<<0;
PINSEL0|=1<<2;
U0LCR=0X83;
U0DLL=0xc3;
U0DLM=0X00;
U0LCR=0X03;
}
int adc(unsigned int a)
{
unsigned int g;
AD0CR =(0x00000001<<a);//selecting the channel
AD0CR |=0x05<<8;//// seting the clock
AD0CR |= 1<<21;///// power on
AD0CR |= 1<<24;///// start
while((AD0GDR&0x80000000)!=0x80000000);
g = AD0GDR;
g = g>>6;
g = g & 0x3ff;
return g;
}
int main()
{
unsigned int x,y,z;
IODIR1 |= (0<<16);
IODIR1 |= (0<<17);
IODIR1 |= (0<<18);
IODIR1 |= (0<<19);
8th Semester, ISE, BE, HKBKCE 38 2016-2017
Development of Data Acquisition for Underground
Water and Gas Pipeline Leakage Monitoring Using IOT Implementation
IODIR1 |= (0<<20);
IODIR1 |= (0<<21);
IODIR1 |= (1<<22);
PINSEL0|= 3<<10; // adc channel 7 port 0 pin 5
PINSEL0|= 3<<8; // adc channel 6 pin 4 port 0
PINSEL1|= 01<<24; //adc1 channel selected pin 28 port 0
init0();
str0("code starting");
while(1)
{
x = adc(7);
y = adc(6);
z = adc(1);
// sprintf(str,"i'm 1 =%d\n\r\n",x);
// str0(str);
//
//
// sprintf(str,"i'm 2 =%d\n\r\n",y);
// str0(str);
//
//
// sprintf(str,"i'm 3 =%d\n\r\n",z);
// str0(str);
// delay(5000);
if(IOPIN1 & (1<<16))
{
tx0('A');
8th Semester, ISE, BE, HKBKCE 39 2016-2017
Development of Data Acquisition for Underground
Water and Gas Pipeline Leakage Monitoring Using IOT Implementation
}
if(IOPIN1 & (1<<17))
{
tx0('B');
}
if(IOPIN1 & (1<<18))
{
tx0('C');
}
if(IOPIN1 & (1<<19))
{
tx0('D');
}
if(IOPIN1 & (1<<20))
{
tx0('E');
}
if(IOPIN1 & (1<<21))
{
tx0('G');
}
if(x < 200)
{
tx0('1');
}
if(y < 200)
{
tx0('2');
}
if(z < 200)
{
tx0('3');
}
8th Semester, ISE, BE, HKBKCE 40 2016-2017
Development of Data Acquisition for Underground
Water and Gas Pipeline Leakage Monitoring Using IOT Implementation
}
}
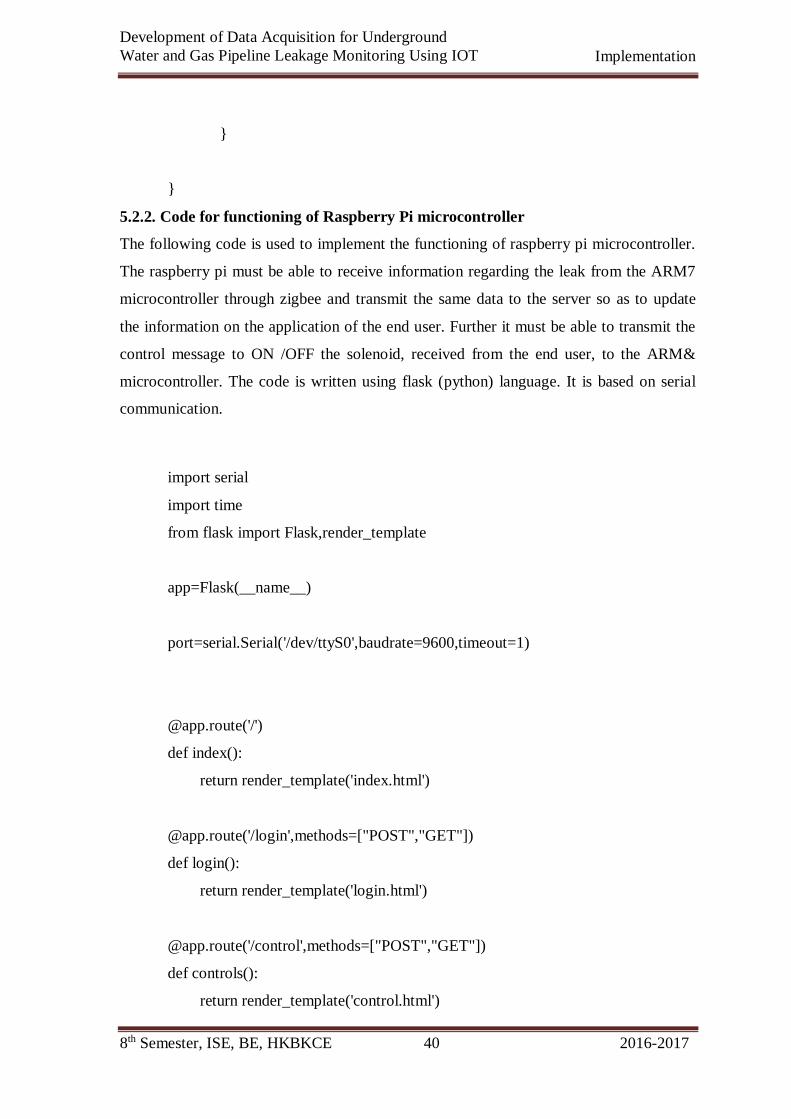
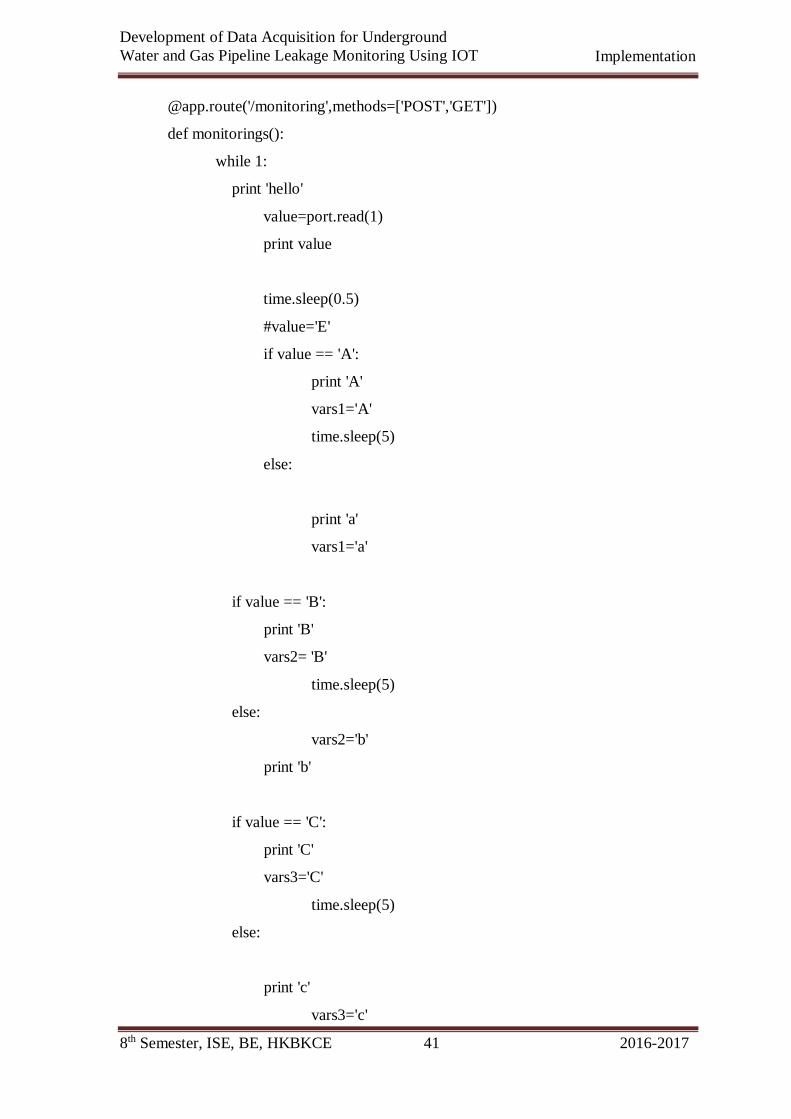
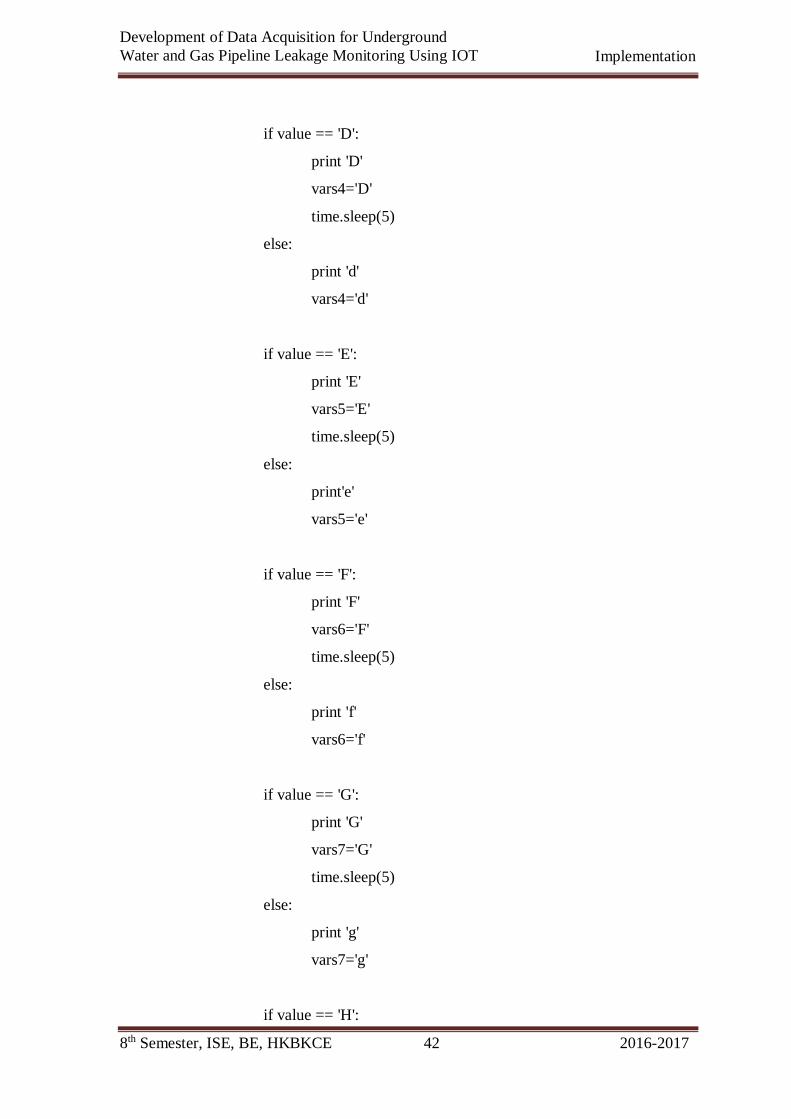
5.2.2. Code for functioning of Raspberry Pi microcontroller
The following code is used to implement the functioning of raspberry pi microcontroller.
The raspberry pi must be able to receive information regarding the leak from the ARM7
microcontroller through zigbee and transmit the same data to the server so as to update
the information on the application of the end user. Further it must be able to transmit the
control message to ON /OFF the solenoid, received from the end user, to the ARM&
microcontroller. The code is written using flask (python) language. It is based on serial
communication.
import serial
import time
from flask import Flask,render_template
app=Flask(__name__)
port=serial.Serial('/dev/ttyS0',baudrate=9600,timeout=1)
@app.route('/')
def index():
return render_template('index.html')
@app.route('/login',methods=["POST","GET"])
def login():
return render_template('login.html')
@app.route('/control',methods=["POST","GET"])
def controls():
return render_template('control.html')
8th Semester, ISE, BE, HKBKCE 41 2016-2017
Development of Data Acquisition for Underground
Water and Gas Pipeline Leakage Monitoring Using IOT Implementation
@app.route('/monitoring',methods=['POST','GET'])
def monitorings():
while 1:
print 'hello'
value=port.read(1)
print value
time.sleep(0.5)
#value='E'
if value == 'A':
print 'A'
vars1='A'
time.sleep(5)
else:
print 'a'
vars1='a'
if value == 'B':
print 'B'
vars2= 'B'
time.sleep(5)
else:
vars2='b'
print 'b'
if value == 'C':
print 'C'
vars3='C'
time.sleep(5)
else:
print 'c'
vars3='c'
8th Semester, ISE, BE, HKBKCE 42 2016-2017
Development of Data Acquisition for Underground
Water and Gas Pipeline Leakage Monitoring Using IOT Implementation
if value == 'D':
print 'D'
vars4='D'
time.sleep(5)
else:
print 'd'
vars4='d'
if value == 'E':
print 'E'
vars5='E'
time.sleep(5)
else:
print'e'
vars5='e'
if value == 'F':
print 'F'
vars6='F'
time.sleep(5)
else:
print 'f'
vars6='f'
if value == 'G':
print 'G'
vars7='G'
time.sleep(5)
else:
print 'g'
vars7='g'
if value == 'H':
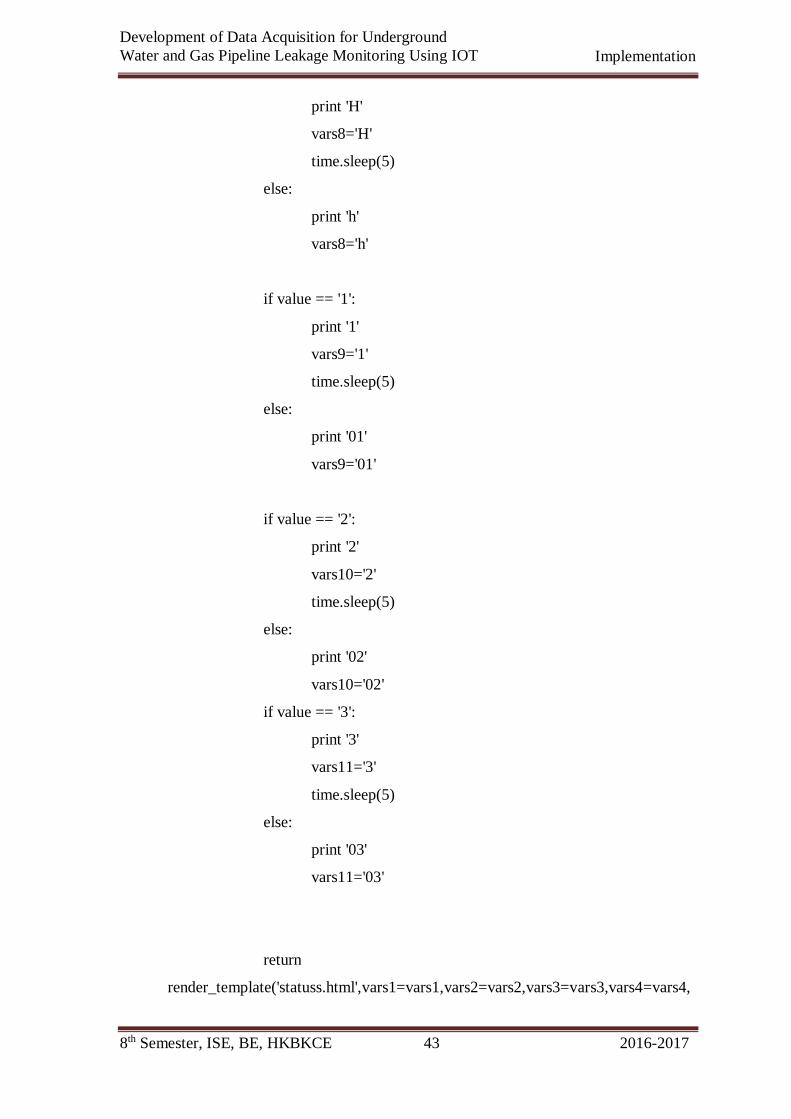
8th Semester, ISE, BE, HKBKCE 43 2016-2017
Development of Data Acquisition for Underground
Water and Gas Pipeline Leakage Monitoring Using IOT Implementation
print 'H'
vars8='H'
time.sleep(5)
else:
print 'h'
vars8='h'
if value == '1':
print '1'
vars9='1'
time.sleep(5)
else:
print '01'
vars9='01'
if value == '2':
print '2'
vars10='2'
time.sleep(5)
else:
print '02'
vars10='02'
if value == '3':
print '3'
vars11='3'
time.sleep(5)
else:
print '03'
vars11='03'
return
render_template('statuss.html',vars1=vars1,vars2=vars2,vars3=vars3,vars4=vars4,
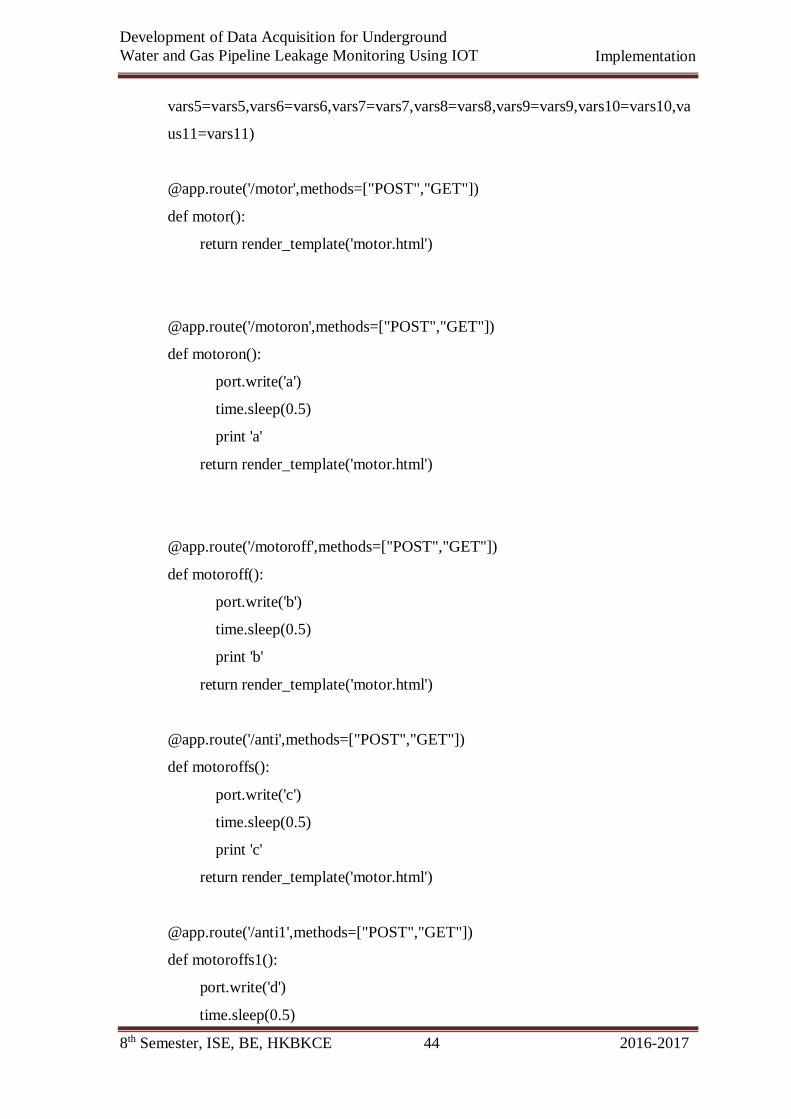
8th Semester, ISE, BE, HKBKCE 44 2016-2017
Development of Data Acquisition for Underground
Water and Gas Pipeline Leakage Monitoring Using IOT Implementation
vars5=vars5,vars6=vars6,vars7=vars7,vars8=vars8,vars9=vars9,vars10=vars10,va
us11=vars11)
@app.route('/motor',methods=["POST","GET"])
def motor():
return render_template('motor.html')
@app.route('/motoron',methods=["POST","GET"])
def motoron():
port.write('a')
time.sleep(0.5)
print 'a'
return render_template('motor.html')
@app.route('/motoroff',methods=["POST","GET"])
def motoroff():
port.write('b')
time.sleep(0.5)
print 'b'
return render_template('motor.html')
@app.route('/anti',methods=["POST","GET"])
def motoroffs():
port.write('c')
time.sleep(0.5)
print 'c'
return render_template('motor.html')
@app.route('/anti1',methods=["POST","GET"])
def motoroffs1():
port.write('d')
time.sleep(0.5)
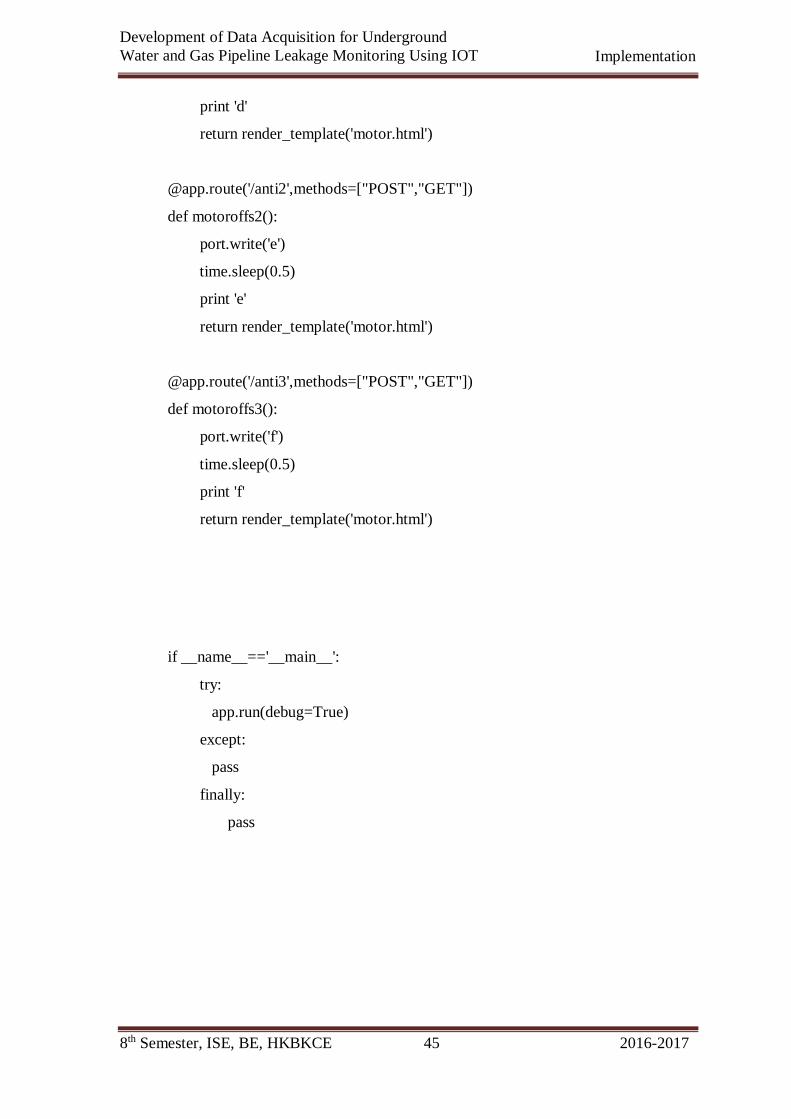
8th Semester, ISE, BE, HKBKCE 45 2016-2017
Development of Data Acquisition for Underground
Water and Gas Pipeline Leakage Monitoring Using IOT Implementation
print 'd'
return render_template('motor.html')
@app.route('/anti2',methods=["POST","GET"])
def motoroffs2():
port.write('e')
time.sleep(0.5)
print 'e'
return render_template('motor.html')
@app.route('/anti3',methods=["POST","GET"])
def motoroffs3():
port.write('f')
time.sleep(0.5)
print 'f'
return render_template('motor.html')
if __name__=='__main__':
try:
app.run(debug=True)
except:
pass
finally:
pass
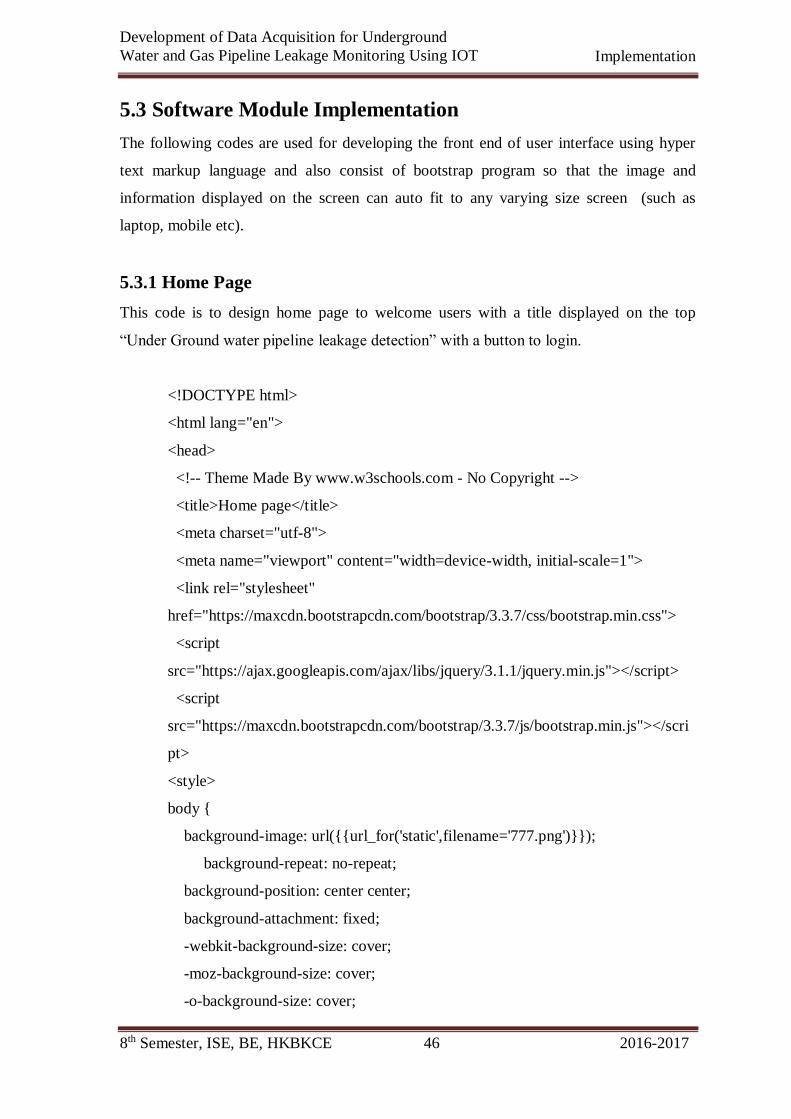
8th Semester, ISE, BE, HKBKCE 46 2016-2017
Development of Data Acquisition for Underground
Water and Gas Pipeline Leakage Monitoring Using IOT Implementation
5.3 Software Module Implementation
The following codes are used for developing the front end of user interface using hyper
text markup language and also consist of bootstrap program so that the image and
information displayed on the screen can auto fit to any varying size screen (such as
laptop, mobile etc).
5.3.1 Home Page
This code is to design home page to welcome users with a title displayed on the top
“Under Ground water pipeline leakage detection” with a button to login.
<!DOCTYPE html>
<html lang="en">
<head>
<!-- Theme Made By www.w3schools.com - No Copyright -->
<title>Home page</title>
<meta charset="utf-8">
<meta name="viewport" content="width=device-width, initial-scale=1">
<link rel="stylesheet"
href="https://maxcdn.bootstrapcdn.com/bootstrap/3.3.7/css/bootstrap.min.css">
<script
src="https://ajax.googleapis.com/ajax/libs/jquery/3.1.1/jquery.min.js"></script>
<script
src="https://maxcdn.bootstrapcdn.com/bootstrap/3.3.7/js/bootstrap.min.js"></scri
pt>
<style>
body {
background-image: url({{url_for('static',filename='777.png')}});
background-repeat: no-repeat;
background-position: center center;
background-attachment: fixed;
-webkit-background-size: cover;
-moz-background-size: cover;
-o-background-size: cover;
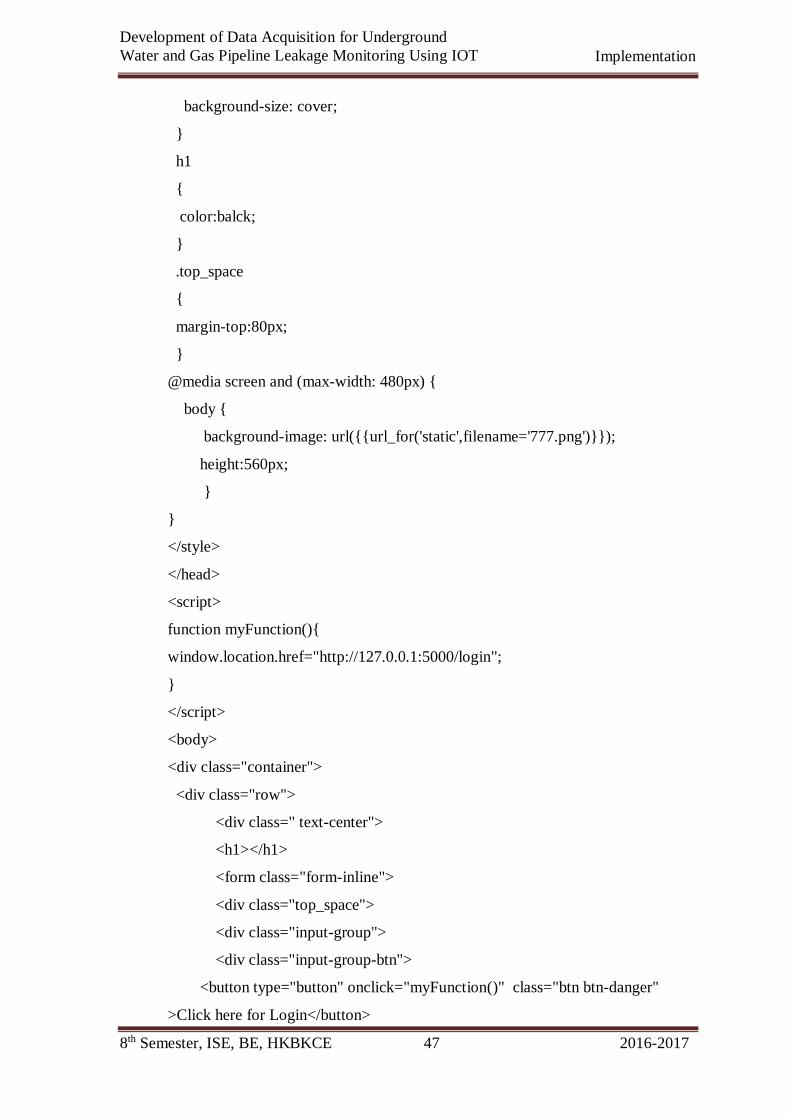
8th Semester, ISE, BE, HKBKCE 47 2016-2017
Development of Data Acquisition for Underground
Water and Gas Pipeline Leakage Monitoring Using IOT Implementation
background-size: cover;
}
h1
{
color:balck;
}
.top_space
{
margin-top:80px;
}
@media screen and (max-width: 480px) {
body {
background-image: url({{url_for('static',filename='777.png')}});
height:560px;
}
}
</style>
</head>
<script>
function myFunction(){
window.location.href="http://127.0.0.1:5000/login";
}
</script>
<body>
<div class="container">
<div class="row">
<div class=" text-center">
<h1></h1>
<form class="form-inline">
<div class="top_space">
<div class="input-group">
<div class="input-group-btn">
<button type="button" onclick="myFunction()" class="btn btn-danger"
>Click here for Login</button>
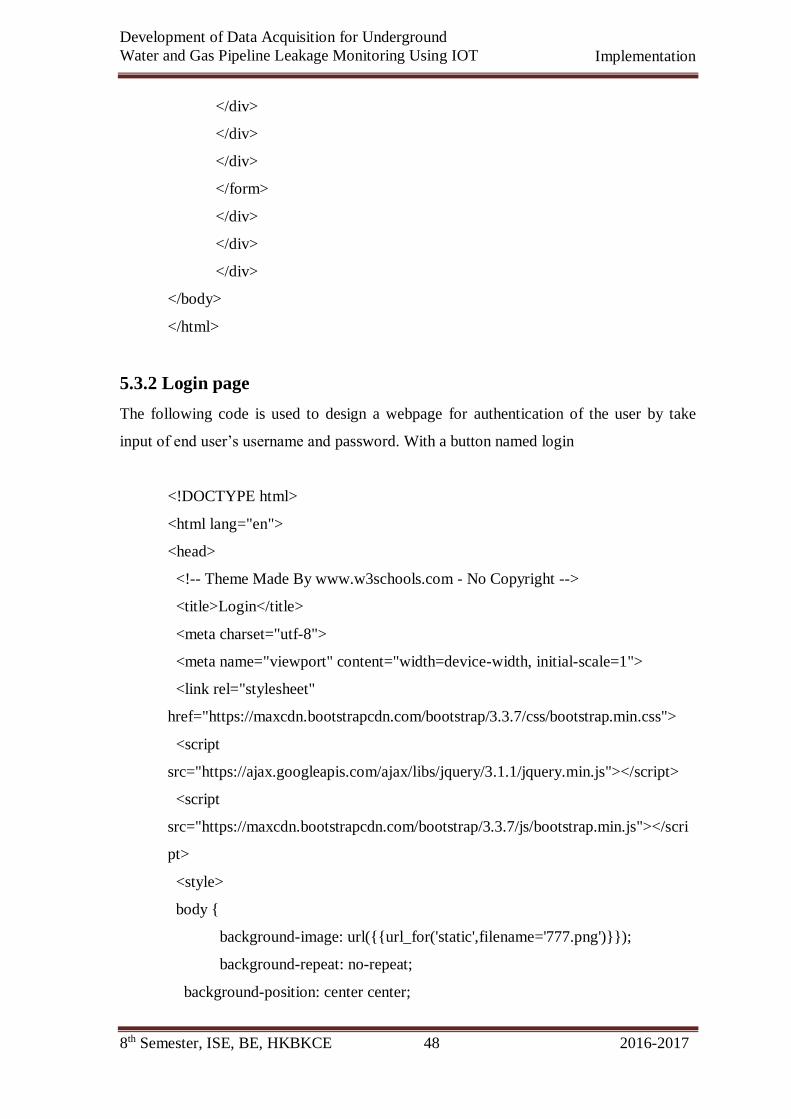
8th Semester, ISE, BE, HKBKCE 48 2016-2017
Development of Data Acquisition for Underground
Water and Gas Pipeline Leakage Monitoring Using IOT Implementation
</div>
</div>
</div>
</form>
</div>
</div>
</div>
</body>
</html>
5.3.2 Login page
The following code is used to design a webpage for authentication of the user by take
input of end user’s username and password. With a button named login
<!DOCTYPE html>
<html lang="en">
<head>
<!-- Theme Made By www.w3schools.com - No Copyright -->
<title>Login</title>
<meta charset="utf-8">
<meta name="viewport" content="width=device-width, initial-scale=1">
<link rel="stylesheet"
href="https://maxcdn.bootstrapcdn.com/bootstrap/3.3.7/css/bootstrap.min.css">
<script
src="https://ajax.googleapis.com/ajax/libs/jquery/3.1.1/jquery.min.js"></script>
<script
src="https://maxcdn.bootstrapcdn.com/bootstrap/3.3.7/js/bootstrap.min.js"></scri
pt>
<style>
body {
background-image: url({{url_for('static',filename='777.png')}});
background-repeat: no-repeat;
background-position: center center;
8th Semester, ISE, BE, HKBKCE 49 2016-2017
Development of Data Acquisition for Underground
Water and Gas Pipeline Leakage Monitoring Using IOT Implementation
background-attachment: fixed;
-webkit-background-size: cover;
-moz-background-size: cover;
-o-background-size: cover;
background-size: cover;
}
h1
{
color:black;
}
.top_space
{
margin-top:80px;
}
@media screen and (max-width: 480px) {
body {
background-image: url({{url_for('static',filename='777.png')}});
height:560px;
}
}
</style>
</head>
<script>
function myFunction() {
var x, text="iot",text1,passw,pass="iot";
// Get the value of the input field with id="numb"
x = document.getElementById("email").value;
passw=document.getElementById("pwd").value;
// If x is Not a Number or than one or greater than 10
if (x==text && pass==passw) {
window.location.href = "http://127.0.0.1:5000/monitoring";
text1="login successful";
8th Semester, ISE, BE, HKBKCE 50 2016-2017
Development of Data Acquisition for Underground
Water and Gas Pipeline Leakage Monitoring Using IOT Implementation
} else if(x!=text && pass==passw) {
text1 = "user name is invalid";
}
else if(x==text && pass!=passw)
{
text1="password is invalid";
}
else{
text1="both invalid";
}
document.getElementById("demo").innerHTML = text1;
}
</script>
<body>
<div class="container">
<div class="row">
<div class="text-center">
<h1></h1>
<form class="form-inline">
<div class="top_space">
<div class="col-md-12">
<div class="form-group">
<label for="email">User Name:</label>
<input type="email" class="form-control" id="email">
</div>
</div>
<br>
<br>
<br>
<div class="clearfix"></div>
<div class="col-md-12">
<div class="form-group">
8th Semester, ISE, BE, HKBKCE 51 2016-2017
Development of Data Acquisition for Underground
Water and Gas Pipeline Leakage Monitoring Using IOT Implementation
<label for="pwd">Password:</label>
<input type="password" class="form-control" id="pwd">
</div>
</div>
<br>
<br>
<br>
<div class="clearfix"></div>
<div class="col-md-12">
<div class="input-group">
<div class="input-group-btn">
<button type="button" onclick="myFunction()" class="btn btn-
danger">Login</button>
<br>
<p id="demo"></p>
</div>
</div>
</div>
</div>
</form>
</div>
</div>
</div>
</body>
</html>
5.3.3 Control Page
Following code is design a webpage to provide users two buttons to monitor and control
the hardware.
<!DOCTYPE html>
<html lang="en">
<head>
8th Semester, ISE, BE, HKBKCE 52 2016-2017
Development of Data Acquisition for Underground
Water and Gas Pipeline Leakage Monitoring Using IOT Implementation
<!-- Theme Made By www.w3schools.com - No Copyright -->
<title>Control page</title>
<meta charset="utf-8">
<meta name="viewport" content="width=device-width, initial-scale=1">
<link rel="stylesheet"
href="https://maxcdn.bootstrapcdn.com/bootstrap/3.3.7/css/bootstrap.min.css">
<script
src="https://ajax.googleapis.com/ajax/libs/jquery/3.1.1/jquery.min.js"></script>
<script
src="https://maxcdn.bootstrapcdn.com/bootstrap/3.3.7/js/bootstrap.min.js"></scri
pt>
<style>
body {
background-image: url({{url_for('static',filename='777.png')}});
background-repeat: no-repeat;
background-position: center center;
background-attachment: fixed;
-webkit-background-size: cover;
-moz-background-size: cover;
-o-background-size: cover;
background-size: cover;
}
.top_space
{
margin-top:109px;
}
h1
{
color:#E8E4DB;
}
@media screen and (max-width: 480px) {
body {
background-image: url({{url_for('static',filename='777.png')}});
8th Semester, ISE, BE, HKBKCE 53 2016-2017
Development of Data Acquisition for Underground
Water and Gas Pipeline Leakage Monitoring Using IOT Implementation
height:560px;
}
}
</style>
</head>
<script>
function myStatus() {
window.location.href = "http://127.0.0.1:5000/status";
}
function myMaps() {
window.location.href = "http://127.0.0.1:5000/motor";
}
</script>
<body>
<div class="container">
<div class="row">
<div class="text-center">
<h1></h1>
<form class="form-inline">
<div class="top_space">
<div class="input-group">
<div class="input-group-btn">
<button type="button" onclick="myStatus()" class="btn btn-danger"
>Monitoring</button>
</div>
</div>
<div class="clearfix"></div>
<br>
<br>
<br>
8th Semester, ISE, BE, HKBKCE 54 2016-2017
Development of Data Acquisition for Underground
Water and Gas Pipeline Leakage Monitoring Using IOT Implementation
<div class="input-group">
<div class="input-group-btn">
<button type="button" onclick="myMaps()" class="btn btn-danger" >Motor
Control</button>
</div>
</div>
</div>
</form>
</div>
</div>
</div>
</body>
</html>
5.3.4 Status
The following code is used to design a webpage to indicate the status of the water flow
sensors and moisture sensor, if a defect is found then the locality is also indicated on the
screen.
<!DOCTYPE html>
<html lang="en">
<head>
<meta http-equiv="refresh" content="1">
<!-- Theme Made By www.w3schools.com - No Copyright -->
<title>Monitoring page</title>
<meta charset="utf-8">
<meta name="viewport" content="width=device-width, initial-scale=1">
<link rel="stylesheet"
href="https://maxcdn.bootstrapcdn.com/bootstrap/3.3.7/css/bootstrap.min.css">
<script src="https://ajax.googleapis.com/ajax/libs/jquery/3.1.1/jquery.min.js"></script>
<script
src="https://maxcdn.bootstrapcdn.com/bootstrap/3.3.7/js/bootstrap.min.js"></script>
<style>
8th Semester, ISE, BE, HKBKCE 55 2016-2017
Development of Data Acquisition for Underground
Water and Gas Pipeline Leakage Monitoring Using IOT Implementation
body {
background-image: url({{url_for('static',filename='777.png')}});
background-repeat: no-repeat;
background-position: center center;
background-attachment: fixed;
-webkit-background-size: cover;
-moz-background-size: cover;
-o-background-size: cover;
background-size: cover;
}
h1
{
color:#E8E4DB;
}
.top_space
{
margin-top:80px;
}
@media screen and (max-width: 480px) {
body {
background-image: url({{url_for('static',filename='777.png')}});
height:560px;
}
}
</style>
</head>
<script>
function myIndex(){
window.location.href ="http://127.0.0.1:5000/control";
}
8th Semester, ISE, BE, HKBKCE 56 2016-2017
Development of Data Acquisition for Underground
Water and Gas Pipeline Leakage Monitoring Using IOT Implementation
</script>
<body>
<div class="container">
<div class="row">
<div class="text-center">
<h1></h1>
<form class="form-inline">
<div class="top_space">
<div class="col-md-12">
<div class="form-group">
<br>
<label for="email"> {{vars1}}</label>
</div>
</div>
<div class="clearfix"></div>
<div class="col-md-12">
<div class="form-group">
<br>
<label for="email">{{vars2}}</label>
</div>
</div>
<div class="clearfix"></div>
<div class="col-md-12">
<div class="form-group">
<br>
<label for="email">{{vars3}}</label>
</div>
</div>
<div class="clearfix"></div>
<div class="col-md-12">
<div class="form-group">
<br>
8th Semester, ISE, BE, HKBKCE 57 2016-2017
Development of Data Acquisition for Underground
Water and Gas Pipeline Leakage Monitoring Using IOT Implementation
<label for="email">{{vars4}}</label>
</div>
</div>
<br>
<br>
<br>
<br>
<div class="clearfix"></div>
<div class="col-md-12">
<div class="form-group">
<br>
<label for="email">{{vars5}}</label>
</div>
</div>
<br>
<br>
<br>
<div class="clearfix"></div>
<div class="col-md-12">
<div class="form-group">
<br>
<label for="email">{{vars6}}</label>
</div>
</div>
<br>
<br>
<br>
<div class="clearfix"></div>
<div class="col-md-12">
<div class="form-group">
<br>
8th Semester, ISE, BE, HKBKCE 58 2016-2017
Development of Data Acquisition for Underground
Water and Gas Pipeline Leakage Monitoring Using IOT Implementation
<label for="email">{{vars7}}</label>
</div>
</div>
<br>
<br>
<br>
<div class="clearfix"></div>
<div class="col-md-12">
<div class="form-group">
<br>
<label for="email">{{vars8}}</label>
</div>
</div>
<br>
<br>
<br>
<div class="clearfix"></div>
<div class="col-md-12">
<div class="form-group">
<br>
<label for="email">{{vars9}}</label>
</div>
</div>
<br>
<br>
<br>
<div class="clearfix"></div>
<div class="col-md-12">
<div class="form-group">
<br>
<label for="email">{{vars10}}</label>
</div>
</div>
<br>
8th Semester, ISE, BE, HKBKCE 59 2016-2017
Development of Data Acquisition for Underground
Water and Gas Pipeline Leakage Monitoring Using IOT Implementation
<br>
<br>
<div class="clearfix"></div>
<div class="col-md-12">
<div class="form-group">
<br>
<label for="email">{{vars11}}</label>
</div>
</div>
<br>
<br>
<br>
<div class="clearfix"></div>
<div class="col-md-12">
<div class="input-group">
<div class="input-group-btn">
<button type="button" onclick="myIndex()" class="btn btn-danger">Go
Back</button>
</div>
</div>
</div>
<br>
<br>
</form>
</div>
</div>
</div>
</body>
</html>
8th Semester, ISE, BE, HKBKCE 60 2016-2017
Development of Data Acquisition for Underground
Water and Gas Pipeline Leakage Monitoring Using IOT Implementation
5.3.5 Monitoring
The following code is used to design a webpage to control the values (ON/OFF). Hence
six buttons are provided in which a pair of button is dedicated to on and off of one value
followed by the pairs of rest other valves and a button to return back to the control page is
provided
<!DOCTYPE html>
<html lang="en">
<head>
<!-- Theme Made By www.w3schools.com - No Copyright -->
<title>Motor page</title>
<meta charset="utf-8">
<meta name="viewport" content="width=device-width, initial-scale=1">
<link rel="stylesheet"
href="https://maxcdn.bootstrapcdn.com/bootstrap/3.3.7/css/bootstrap.min.css">
<script src="https://ajax.googleapis.com/ajax/libs/jquery/3.1.1/jquery.min.js"></script>
<script
src="https://maxcdn.bootstrapcdn.com/bootstrap/3.3.7/js/bootstrap.min.js"></script>
<style>
body {
background-image: url({{url_for('static',filename='777.png')}});
background-repeat: no-repeat;
background-position: center center;
background-attachment: fixed;
-webkit-background-size: cover;
-moz-background-size: cover;
-o-background-size: cover;
background-size: cover;
}
.top_space
{
margin-top:109px;
}
8th Semester, ISE, BE, HKBKCE 61 2016-2017
Development of Data Acquisition for Underground
Water and Gas Pipeline Leakage Monitoring Using IOT Implementation
h1
{
color:#E8E4DB;
}
@media screen and (max-width: 480px) {
body {
background-image: url({{url_for('static',filename='777.png')}});
height:560px;
}
}
</style>
</head>
<script>
function myStatus() {
window.location.href = "http://127.0.0.1:5000/control";
}
function myMaps() {
window.location.href = "http://127.0.0.1:5000/motoron";
}
function myMotoroff()
{
window.location.href="http://127.0.0.1:5000/motoroff";
}
function myOpen()
{
window.location.href="http://127.0.0.1:5000/anti";
}
function myOpen1()
{
window.location.href="http://127.0.0.1:5000/anti1";
8th Semester, ISE, BE, HKBKCE 62 2016-2017
Development of Data Acquisition for Underground
Water and Gas Pipeline Leakage Monitoring Using IOT Implementation
}
function myOpen2()
{
window.location.href="http://127.0.0.1:5000/anti2";
}
function myOpen3()
{
window.location.href="http://127.0.0.1:5000/anti3";
}
</script>
<body>
<div class="container">
<div class="row">
<div class="text-center">
<h1></h1>
<form class="form-inline">
<div class="top_space">
<div class="input-group">
<div class="input-group-btn">
<button type="button" onclick="myStatus()" class="btn btn-danger" >To Go
Back</button>
</div>
</div>
<div class="clearfix"></div>
<br>
<br>
<br>
<div class="input-group">
<div class="input-group-btn">
8th Semester, ISE, BE, HKBKCE 63 2016-2017
Development of Data Acquisition for Underground
Water and Gas Pipeline Leakage Monitoring Using IOT Implementation
<button type="button" onclick="myMaps()" class="btn btn-danger" >VALVE1
ON</button>
</div>
</div>
<br>
<br>
<br>
<div class="input-group">
<div class="input-group-btn">
<button type="button" onclick="myMotoroff()" class="btn btn-danger" >VALVE1
OFF</button>
</div>
</div>
<br>
<br>
<br>
<div class="input-group">
<div class="input-group-btn">
<button type="button" onclick="myOpen()" class="btn btn-danger" >VALVE2
ON</button>
</div>
</div>
<br>
<br>
<br>
<div class="input-group">
<div class="input-group-btn">
<button type="button" onclick="myOpen1()" class="btn btn-danger" >VALVE2
OFF</button>
</div>
</div>
8th Semester, ISE, BE, HKBKCE 64 2016-2017
Development of Data Acquisition for Underground
Water and Gas Pipeline Leakage Monitoring Using IOT Implementation
<br>
<br>
<br>
<div class="input-group">
<div class="input-group-btn">
<button type="button" onclick="myOpen2()" class="btn btn-danger" >VALVE3
ON</button>
</div>
</div>
<br>
<br>
<br>
<div class="input-group">
<div class="input-group-btn">
<button type="button" onclick="myOpen3()" class="btn btn-danger" >VALVE3
OFF</button>
</div>
</div>
<br>
<br>
<br>
</div>
</form>
</div>
</div>
</div>
</body>
</html>
8th Semester, ISE, BE, HKBKCE 65 2016-2017
Development of Data Acquisition for Underground
Water and Gas Pipeline Leakage Monitoring Using IOT System Testing
CHAPTER 6
SYSTEM TESTING System testing is the process used to help identify the correctness, completeness, security,
and quality of developed computer software. Testing maybe a method of technical
investigation, performed on behalf of stake holders, i.e. intended to reveal the quality-
related information regarding the product with reference to context during which it is
suppose to be control. This includes, however it is not restricted to, the method of
executing a program or application with the intension of finding errors. Testing furnishes
a ‘criticism’ or comparison that compares the state and behavior of the product against
specification.
There are many approaches to software testing; however effective testing of complex
products is actually a method of investigation not just a matter of creating and following
routine procedure. One definition of testing is “The process of questioning a product in
order to judge it”, where the “questions” are operations the tester makes an attempt to
execute with the product, and the product answers with its behavior in reaction to the
probing of the tester. Although most of the intellectual processes of testing are nearly
equal to that of review or inspection, the word testing is connoted to mean the dynamic
analysis of the product-putting the product through its paces.
There are several number of the common quality attributes which includes potential,
dependability, efficiency, portability, maintainability, compatibility and usability. A good
test is sometimes described as one, which reveals an error; however, more recent thinking
suggest that a good test is one which reveals information of interest to someone who
matters within the project community.
6.1 Testing Methodologies
The following are the Testing Methodologies:
Unit Testing.
Integration Testing.
User Acceptance Testing.
8th Semester, ISE, BE, HKBKCE 66 2016-2017
Development of Data Acquisition for Underground
Water and Gas Pipeline Leakage Monitoring Using IOT System Testing
Output Testing.
System Testing.
6.1.1 Unit Testing
Individual component are tested to make sure that they operate correctly. Each
component is tested independently, without other system component. This system was
tested with the set of proper test data for each module and the results were checked with
the expected output. Unit testing focuses on verification effort on the tiniest unit of the
software design module. This is also known as module testing. This testing is distributed
throughout phases, each module is found to be functioning adequately as regards to the
expected output from the module.
6.1.2 Integration Testing
Integration testing is another aspect of testing that is generally done in order to find out
the errors related with the flow of data across interfaces. The unit-tested modules are
grouped together and tested in small segment, which makes it simpler to isolate and
correct errors. This approach is continued until it has been integrated all modules to form
the system as an entire.
6.1.3 User Acceptance Testing
User Acceptance of a method is the key factor for the success of any system. The system
under consideration is tested for user acceptance by regularly in contact with the
prospective system users at time of developing and making changes wherever required is
done in regard to the subsequent point:
Input Screen design
Output Screen design
Menu driven system
8th Semester, ISE, BE, HKBKCE 67 2016-2017
Development of Data Acquisition for Underground
Water and Gas Pipeline Leakage Monitoring Using IOT System Testing
6.1.4 Output Testing
Output testing of the proposed system is very much essential as no system could be useful
if it does not create the required output in the specified format. Asking the users regarding
the format needed by them tests the outputs generated or displayed by the system into
consideration. Hence the output format is measured in two ways – one is on screen and
another in printed format.
6.1.5 System Testing
System testing is generally a series of various tests whose primary purpose is to
completely exercise the computer-based system. Although every test has a completely
special purpose, all work to verify that every system elements have been properly
integrated and perform allocated functions.
Testing is the final verification and validation activity within the organization itself. In the
testing stage, try to achieve the following goals; to affirm the quality of the product, to
find and eliminate any residual errors from previous stages, to validate the software as a
result to the original problem, to demonstrate the presence of all specified functionality in
the product, to estimate the operational responsibleness of the system. At some stage in
testing the major activities are determined on the examination and adjustment of the
source code.
8th Semester, ISE, BE, HKBKCE 68 2016-2017
Development of Data Acquisition for Underground
Water and Gas Pipeline Leakage Monitoring Using IOT System Testing
6.2 Test Cases
Here are the test cases and the expected outcomes which comprised the test plan
developed for this system.
6.2.1NON-FUNCTIONAL TESTING
Non-functional testing is the testing of a software application or system for its non-
functional requirements: the way a system operates, relatively than specific behaviors of
that system.
Sl # Test Case : - 1
Name of Test: - To Authenticate The user
Item being tested: - Login Template
Sample Input: - User Name And Password
Expected output: - Login Successfully(if password matches)
Actual output: - Successful Login
Remarks: - Pass
Table 6.1 – Test Cases for successful login
Sl # Test Case : - 2
Name of Test: - To Authenticate The User
Item being tested: - Login Template
Sample Input: - Username, Password
Expected output: - Login Unsuccessfully(if password not matches)
Actual output: - Unsuccessful Login
Remarks: - Pass
Table 6.2 – Test Cases for unsuccessful login
Sl # Test Case : - 3
Name of Test: - To test rate of flow of water
Item being tested: - Flow sensors
Sample Input: - Flow rate Below 200.
Expected output: - Flow Rate Is Less
Actual output: - Flow Rate is less
Remarks: - Pass
Table 6.3– Test Cases to check the rate of flow of water
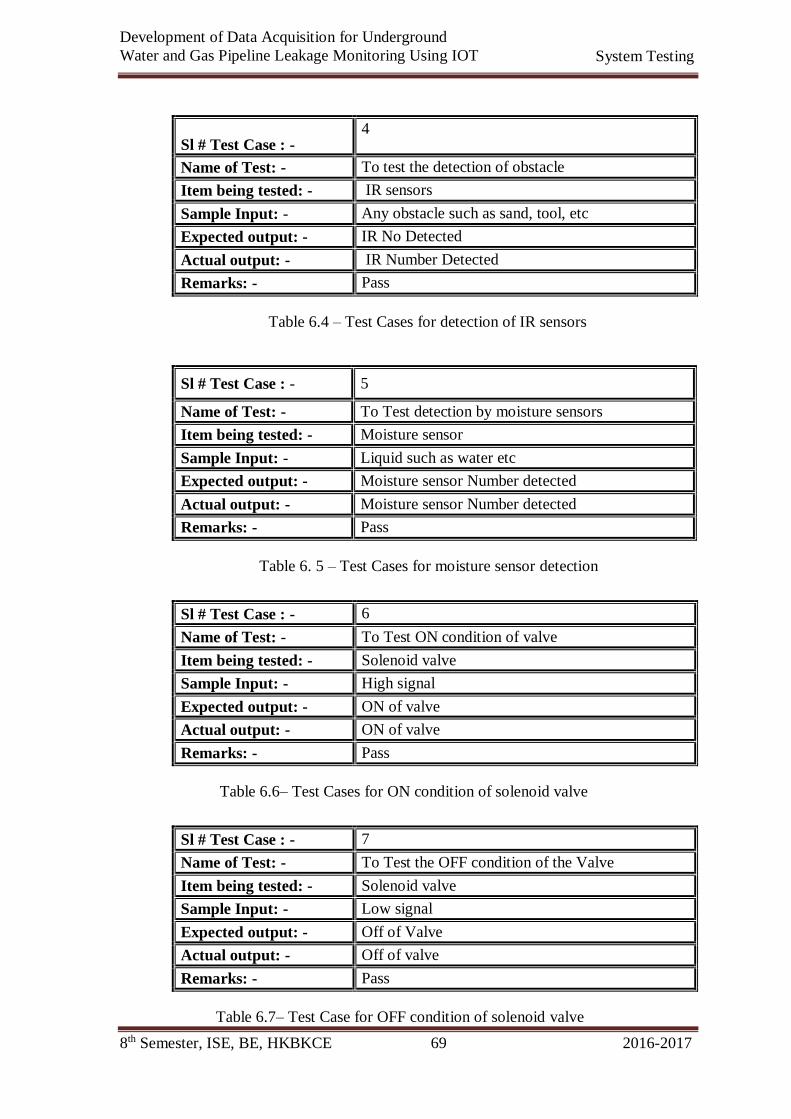
8th Semester, ISE, BE, HKBKCE 69 2016-2017
Development of Data Acquisition for Underground
Water and Gas Pipeline Leakage Monitoring Using IOT System Testing
Sl # Test Case : - 4
Name of Test: - To test the detection of obstacle
Item being tested: - IR sensors
Sample Input: - Any obstacle such as sand, tool, etc
Expected output: - IR No Detected
Actual output: - IR Number Detected
Remarks: - Pass
Table 6.4 – Test Cases for detection of IR sensors
Sl # Test Case : - 5
Name of Test: - To Test detection by moisture sensors
Item being tested: - Moisture sensor
Sample Input: - Liquid such as water etc
Expected output: - Moisture sensor Number detected
Actual output: - Moisture sensor Number detected
Remarks: - Pass
Table 6. 5 – Test Cases for moisture sensor detection
Sl # Test Case : - 6
Name of Test: - To Test ON condition of valve
Item being tested: - Solenoid valve
Sample Input: - High signal
Expected output: - ON of valve
Actual output: - ON of valve
Remarks: - Pass
Table 6.6– Test Cases for ON condition of solenoid valve
Sl # Test Case : - 7
Name of Test: - To Test the OFF condition of the Valve
Item being tested: - Solenoid valve
Sample Input: - Low signal
Expected output: - Off of Valve
Actual output: - Off of valve
Remarks: - Pass
Table 6.7– Test Case for OFF condition of solenoid valve
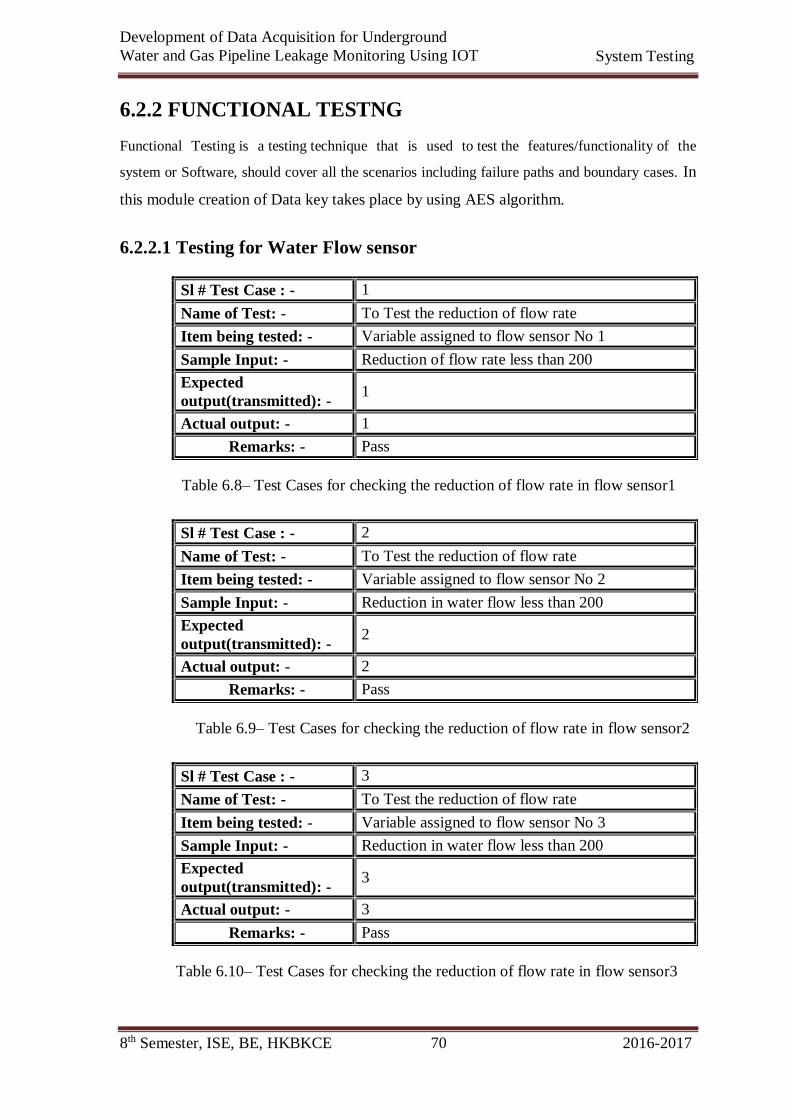
8th Semester, ISE, BE, HKBKCE 70 2016-2017
Development of Data Acquisition for Underground
Water and Gas Pipeline Leakage Monitoring Using IOT System Testing
6.2.2 FUNCTIONAL TESTNG
Functional Testing is a testing technique that is used to test the features/functionality of the
system or Software, should cover all the scenarios including failure paths and boundary cases. In
this module creation of Data key takes place by using AES algorithm.
6.2.2.1 Testing for Water Flow sensor
Sl # Test Case : - 1
Name of Test: - To Test the reduction of flow rate
Item being tested: - Variable assigned to flow sensor No 1
Sample Input: - Reduction of flow rate less than 200
Expected
output(transmitted): - 1
Actual output: - 1
Remarks: - Pass
Table 6.8– Test Cases for checking the reduction of flow rate in flow sensor1
Sl # Test Case : - 2
Name of Test: - To Test the reduction of flow rate
Item being tested: - Variable assigned to flow sensor No 2
Sample Input: - Reduction in water flow less than 200
Expected
output(transmitted): - 2
Actual output: - 2
Remarks: - Pass
Table 6.9– Test Cases for checking the reduction of flow rate in flow sensor2
Sl # Test Case : - 3
Name of Test: - To Test the reduction of flow rate
Item being tested: - Variable assigned to flow sensor No 3
Sample Input: - Reduction in water flow less than 200
Expected
output(transmitted): - 3
Actual output: - 3
Remarks: - Pass
Table 6.10– Test Cases for checking the reduction of flow rate in flow sensor3
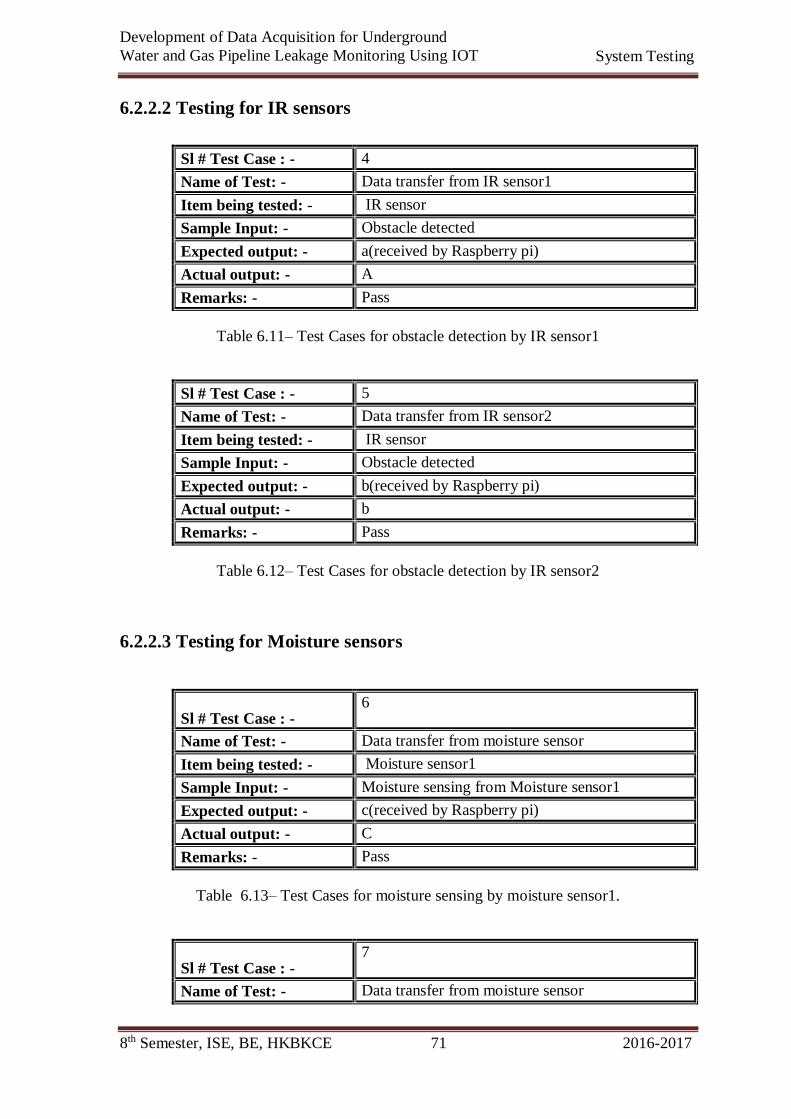
8th Semester, ISE, BE, HKBKCE 71 2016-2017
Development of Data Acquisition for Underground
Water and Gas Pipeline Leakage Monitoring Using IOT System Testing
6.2.2.2 Testing for IR sensors
Sl # Test Case : - 4
Name of Test: - Data transfer from IR sensor1
Item being tested: - IR sensor
Sample Input: - Obstacle detected
Expected output: - a(received by Raspberry pi)
Actual output: - A
Remarks: - Pass
Table 6.11– Test Cases for obstacle detection by IR sensor1
Sl # Test Case : - 5
Name of Test: - Data transfer from IR sensor2
Item being tested: - IR sensor
Sample Input: - Obstacle detected
Expected output: - b(received by Raspberry pi)
Actual output: - b
Remarks: - Pass
Table 6.12– Test Cases for obstacle detection by IR sensor2
6.2.2.3 Testing for Moisture sensors
Sl # Test Case : - 6
Name of Test: - Data transfer from moisture sensor
Item being tested: - Moisture sensor1
Sample Input: - Moisture sensing from Moisture sensor1
Expected output: - c(received by Raspberry pi)
Actual output: - C
Remarks: - Pass
Table 6.13– Test Cases for moisture sensing by moisture sensor1.
Sl # Test Case : - 7
Name of Test: - Data transfer from moisture sensor
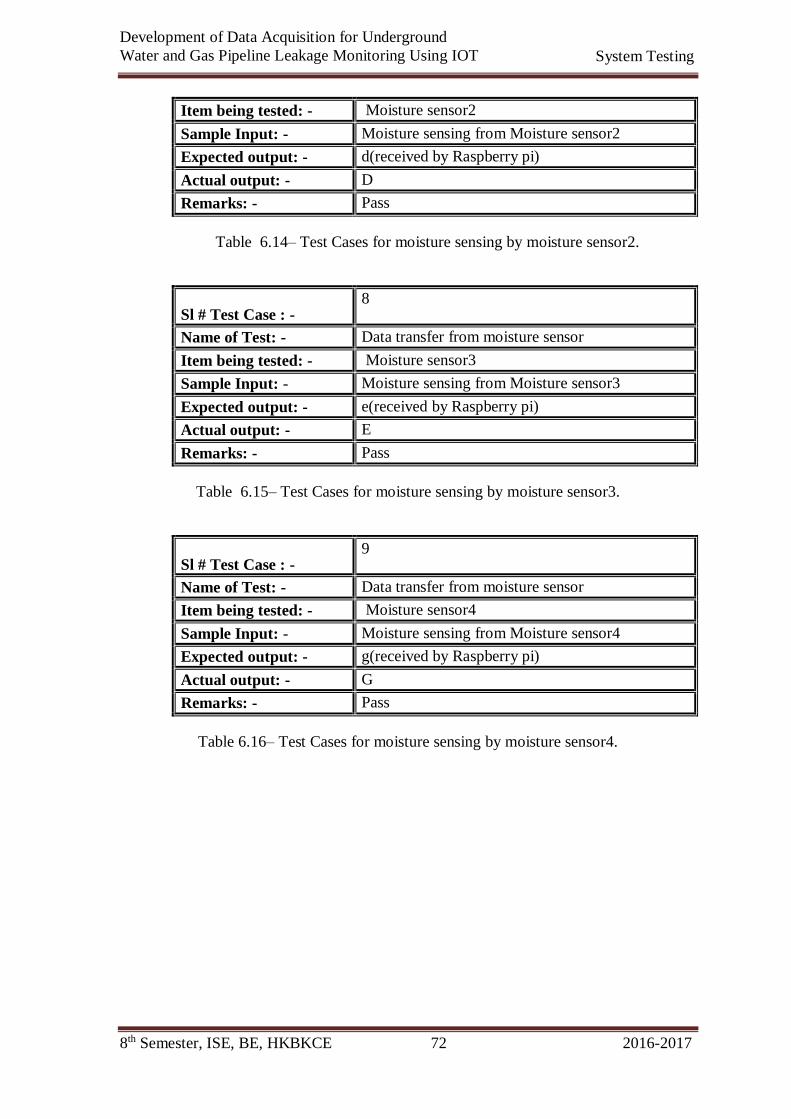
8th Semester, ISE, BE, HKBKCE 72 2016-2017
Development of Data Acquisition for Underground
Water and Gas Pipeline Leakage Monitoring Using IOT System Testing
Item being tested: - Moisture sensor2
Sample Input: - Moisture sensing from Moisture sensor2
Expected output: - d(received by Raspberry pi)
Actual output: - D
Remarks: - Pass
Table 6.14– Test Cases for moisture sensing by moisture sensor2.
Sl # Test Case : - 8
Name of Test: - Data transfer from moisture sensor
Item being tested: - Moisture sensor3
Sample Input: - Moisture sensing from Moisture sensor3
Expected output: - e(received by Raspberry pi)
Actual output: - E
Remarks: - Pass
Table 6.15– Test Cases for moisture sensing by moisture sensor3.
Sl # Test Case : - 9
Name of Test: - Data transfer from moisture sensor
Item being tested: - Moisture sensor4
Sample Input: - Moisture sensing from Moisture sensor4
Expected output: - g(received by Raspberry pi)
Actual output: - G
Remarks: - Pass
Table 6.16– Test Cases for moisture sensing by moisture sensor4.
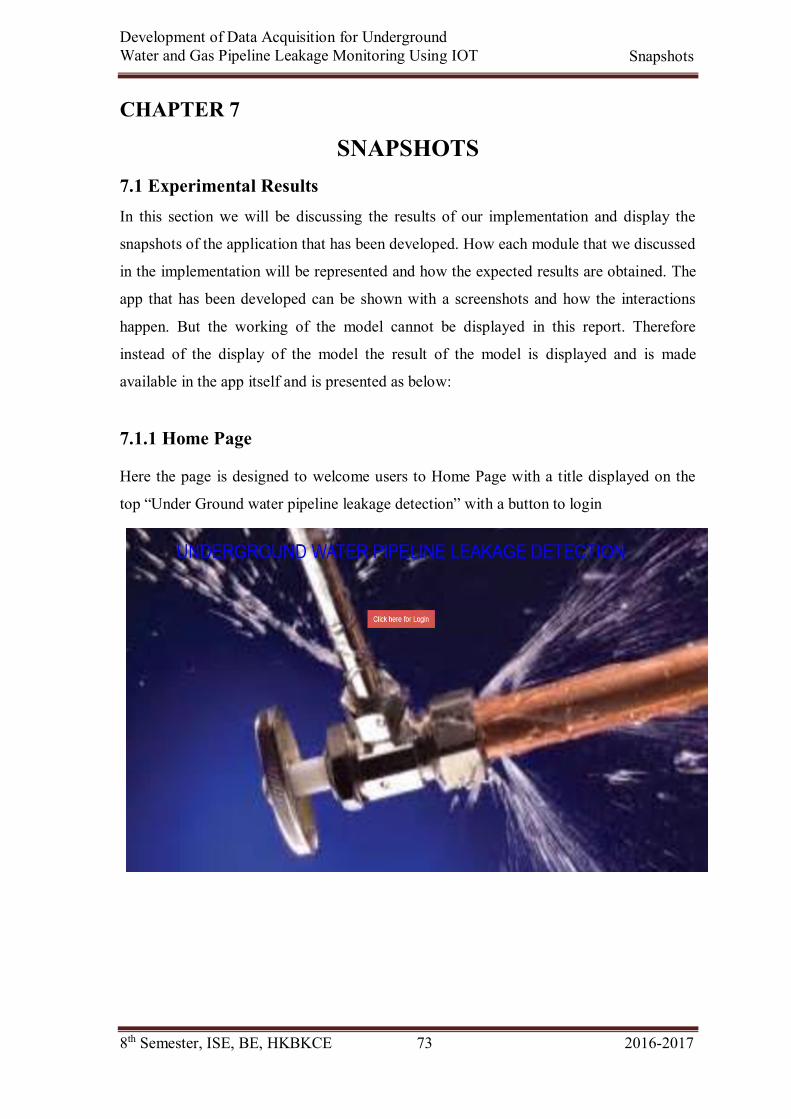
8th Semester, ISE, BE, HKBKCE 73 2016-2017
Development of Data Acquisition for Underground Water and Gas Pipeline Leakage Monitoring Using IOT Snapshots
CHAPTER 7
SNAPSHOTS 7.1 Experimental Results In this section we will be discussing the results of our implementation and display the
snapshots of the application that has been developed. How each module that we discussed
in the implementation will be represented and how the expected results are obtained. The
app that has been developed can be shown with a screenshots and how the interactions
happen. But the working of the model cannot be displayed in this report. Therefore
instead of the display of the model the result of the model is displayed and is made
available in the app itself and is presented as below:
7.1.1 Home Page Here the page is designed to welcome users to Home Page with a title displayed on the
top “Under Ground water pipeline leakage detection” with a button to login
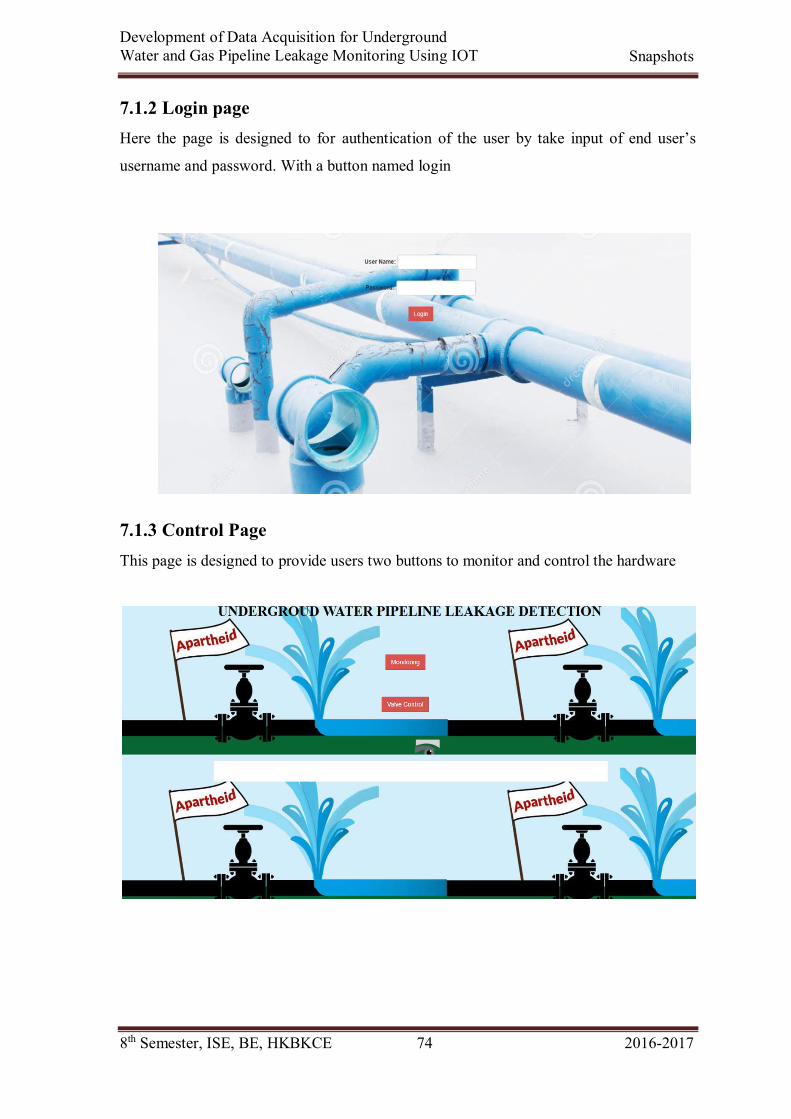
8th Semester, ISE, BE, HKBKCE 74 2016-2017
Development of Data Acquisition for Underground Water and Gas Pipeline Leakage Monitoring Using IOT Snapshots
7.1.2 Login page Here the page is designed to for authentication of the user by take input of end user’s
username and password. With a button named login
7.1.3 Control Page This page is designed to provide users two buttons to monitor and control the hardware
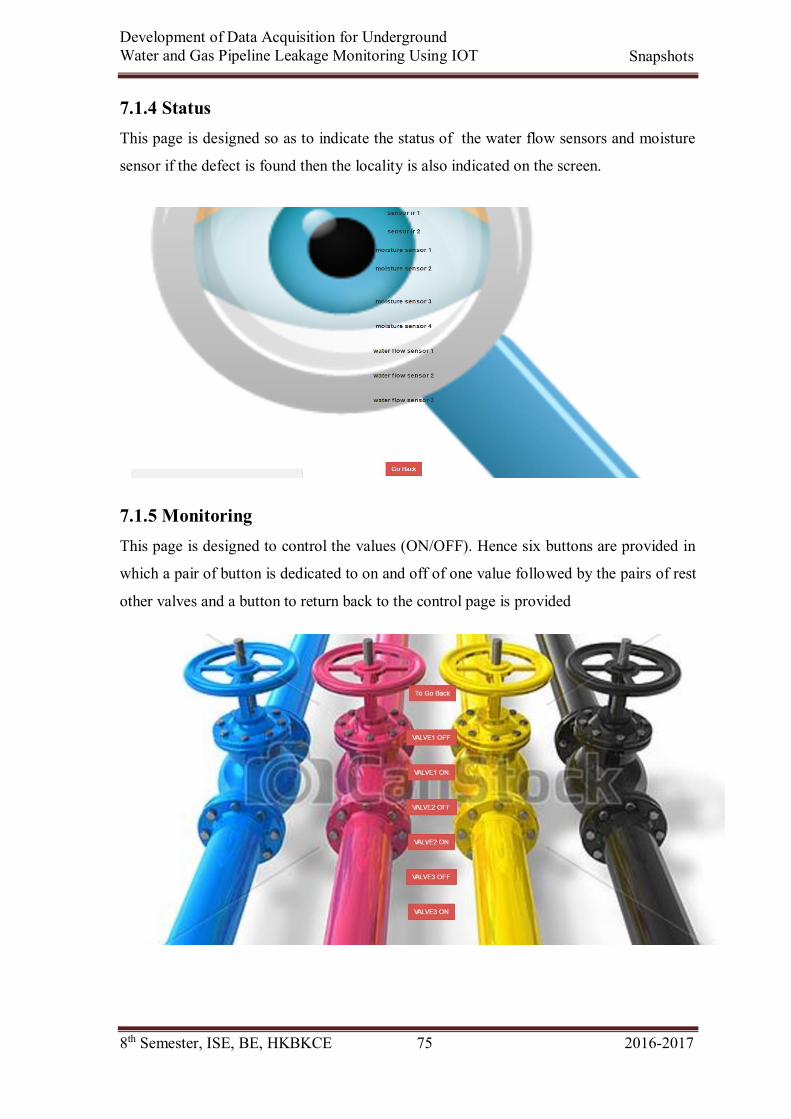
8th Semester, ISE, BE, HKBKCE 75 2016-2017
Development of Data Acquisition for Underground Water and Gas Pipeline Leakage Monitoring Using IOT Snapshots
7.1.4 Status This page is designed so as to indicate the status of the water flow sensors and moisture
sensor if the defect is found then the locality is also indicated on the screen.
7.1.5 Monitoring This page is designed to control the values (ON/OFF). Hence six buttons are provided in
which a pair of button is dedicated to on and off of one value followed by the pairs of rest
other valves and a button to return back to the control page is provided
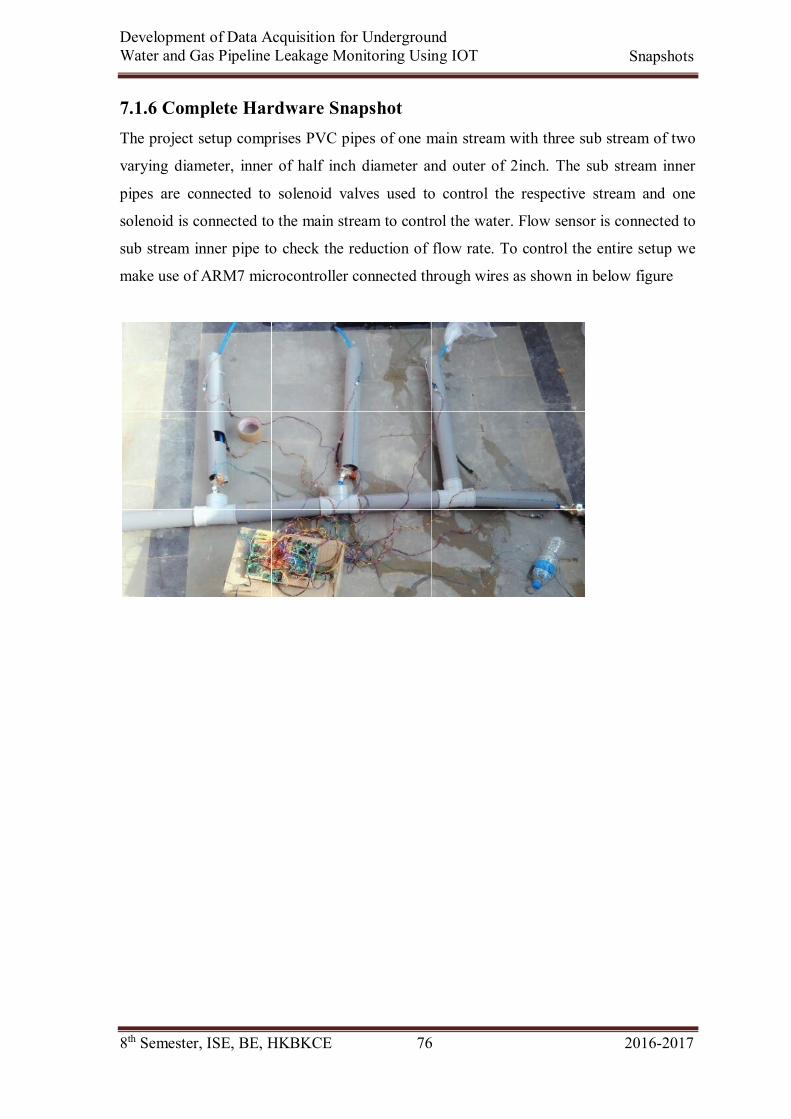
8th Semester, ISE, BE, HKBKCE 76 2016-2017
Development of Data Acquisition for Underground Water and Gas Pipeline Leakage Monitoring Using IOT Snapshots
7.1.6 Complete Hardware Snapshot The project setup comprises PVC pipes of one main stream with three sub stream of two
varying diameter, inner of half inch diameter and outer of 2inch. The sub stream inner
pipes are connected to solenoid valves used to control the respective stream and one
solenoid is connected to the main stream to control the water. Flow sensor is connected to
sub stream inner pipe to check the reduction of flow rate. To control the entire setup we
make use of ARM7 microcontroller connected through wires as shown in below figure
8th Semester, ISE, BE, HKBKCE 77 2016-17
Development of Data Acquisition for Underground Water and Gas Pipeline Leakage Monitoring Using IOT Conclusion
CONCLUSION
Thus the proposed system makes use of modern technology and equipment that help in
reducing and controlling the major problem of water loss. Large volumes of water are
being wasted from main transmission lines and are traditionally are difficult to detect.
Some of the technologies used for detecting are relatively new and resulting in rapid
development of instrumentation, interpretation and communication.
This has enabled the service engineers to adopt a 'multi-sensor' and ‘cloud’ approach to
utilize the whole range of internet of things(IOT) technology and selecting an appropriate
mix of equipment for specific network characteristics, site locations and type of leak and
as well as user interface to detect and control leak .
New systems and instruments are continuously being developed. Some of the
technologies discussed are in the experimental stage, others are still being trailed, but
many of them are already being used or nearing production, this proposed system adds a
new range of tools to the multi-sensor concept and also makes use of relatively new cloud
concept. The system proposed leak detection methods does allow practical
implementation.
Detection system (PLDS) experimental testing technique for future applications was
established using PVC pipe and is intended to accommodate dissimilar types of pipe and
is designed to accommodate different types of pipe and leak configurations. Leak
detection experiments could be used by local service providers to implement the
technology necessary to spot leaks in the water distribution system and reduce water loss.
8th Semester, ISE, BE, HKBKCE 78 2016-17
Development of Data Acquisition for Underground
Water and Gas Pipeline Leakage Monitoring Using IOT References
REFERENCES
[1]. Yu, X.; Wu, P.; Han, W.; Zhang, Z. Overview of wireless underground sensor
networks for agriculture. Afr. J. Biotechnology. 2012, 11, 3942–3948.
[2]. Hieu, B.; Choi, S.; Kim, Y.U.; Park, Y.; Jeong, T. Wireless transmission of acoustic
emission signals for real-time monitoring of leakage in underground pipes. KSCE J. Civ.
Eng. 2011, 15, 805–812.
[3]. Akyildiz, I.F.; Sun, Z.; Vuran, M.C. Signal propagation techniques for wireless
underground communication networks. Phys. Commun. 2009, 2, 167–183.
[4]. Liu, Z.; Kleiner, Y. State-of-the-art review of technologies for pipe structural health
monitoring. IEEE Sens. J. 2012, 12, 1987–1992.
[5]. Kingajay, M.; Jitson, T. Real-time laser monitoring based on pipe detective operation.
Proc. World Acad. Sci. Eng. Technol. 2008, 44, 127–132.
[6]. Sinha, S.K.; Knight, M.A. Intelligent system for condition monitoring of underground
pipelines. Comput. Civ. Infrastruct. Eng. 2004, 19, 42–53.
[7]. Gao, Y.; Brennan, M.; Joseph, P.; Muggleton, J.; Hunaidi, O. On the selection of
acoustic/vibration sensors for leak detection in plastic water pipes. J. Sound Vib. 2005,
283, 927–941.
[8]. Khulief, Y.A.; Khalifa, A.; Ben Mansour, R.; Habib, M.A. Acoustic detection of
leaks in water pipelines using measurements inside pipe. J. Pipeline Syst. Eng. Pract.
2012, 3, 47–54. J. Sens. Actuator Netw. 2014, 3 78
[9]. Ahadi, M.; Bakhtiar, M.S. Leak detection in water-filled plastic pipes through the
application of tuned wavelet transforms to Acoustic Emission signals. Appl. Acoust.
2010, 71, 634–639.
8th Semester, ISE, BE, HKBKCE 79 2016-17
Development of Data Acquisition for Underground
Water and Gas Pipeline Leakage Monitoring Using IOT References
[10]. Gao, Y.; Brennan, M.J.; Joseph, P.F.; Muggleton, J.M.; Hunaidi, O. A model of the
correlation function of leak noise in buried plastic pipes. J. Sound Vib. 2004, 277, 133–
148.
[11]. Nakhkash, M. Water Leak Detection Using Ground Penetrating Radar. In
Proceedings of the 10th International Conference on Ground Penetrating Radar, Delft,
The Netherlands, 21–24 June 2004; pp. 525–528.
[12]. Li, H.-N.; Li, D.-S.; Song, G.-B. Recent applications of fiber optic sensors to health
monitoring in civil engineering. Eng. Struct. 2004, 26, 1647–1657.
[13]. Yan, S.Z.; Chyan, L.S. Performance enhancement of BOTDR fiber optic sensor for
oil and gas pipeline monitoring. Opt. Fiber Technol. 2010, 16, 100–109.
[14]. Nikles, M. Long-distance fiber optic sensing solutions for pipeline leakage,
intrusion and ground movement detection. Proc. SPIE 2009, vol. 7316, 731602–731613.
[15]. López-higuera, J.M.; Cobo, L.R.; Incera, A.Q.; Cobo, A. Fiber optic sensors in
structural health monitoring. J. Light. Technol. 2011, 29, 587–608.