Embed Size (px)
Citation preview
Reporting the Forest Ecological Integrityof Northeastern National Parks
Geri TierneySUNY-ESF
Brian MitchellNPS
Don Faber-LangendoenNatureServe
James GibbsSUNY-ESF
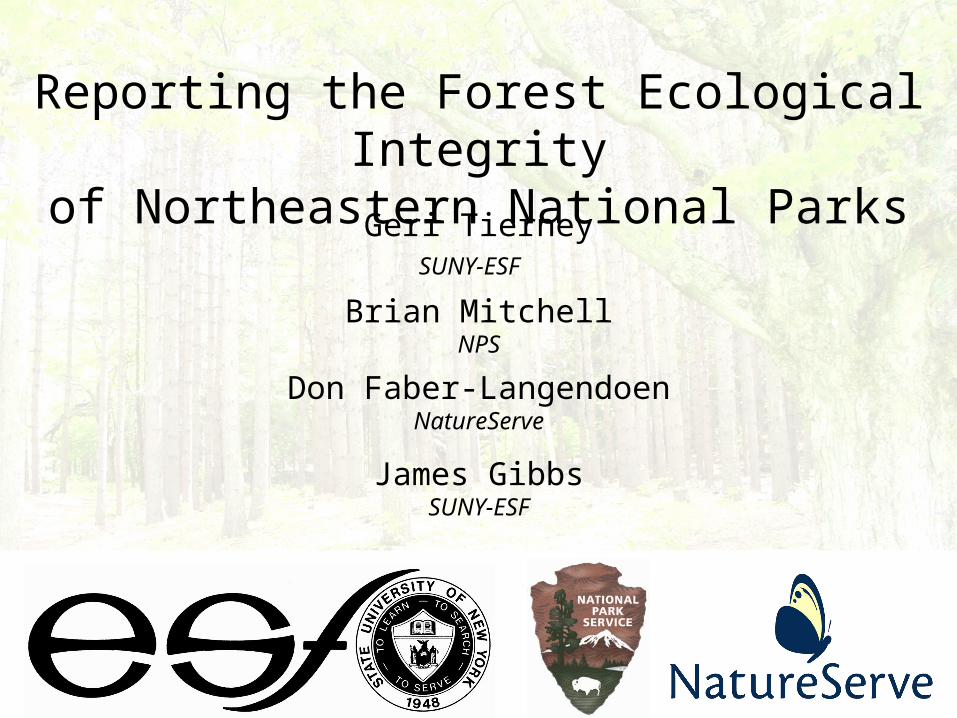
Inventory & Monitoring ProgramNortheast Temperate Network
• Natural Resource Challenge
• Inventory and Monitoring Program
• Vital Signs Monitoring
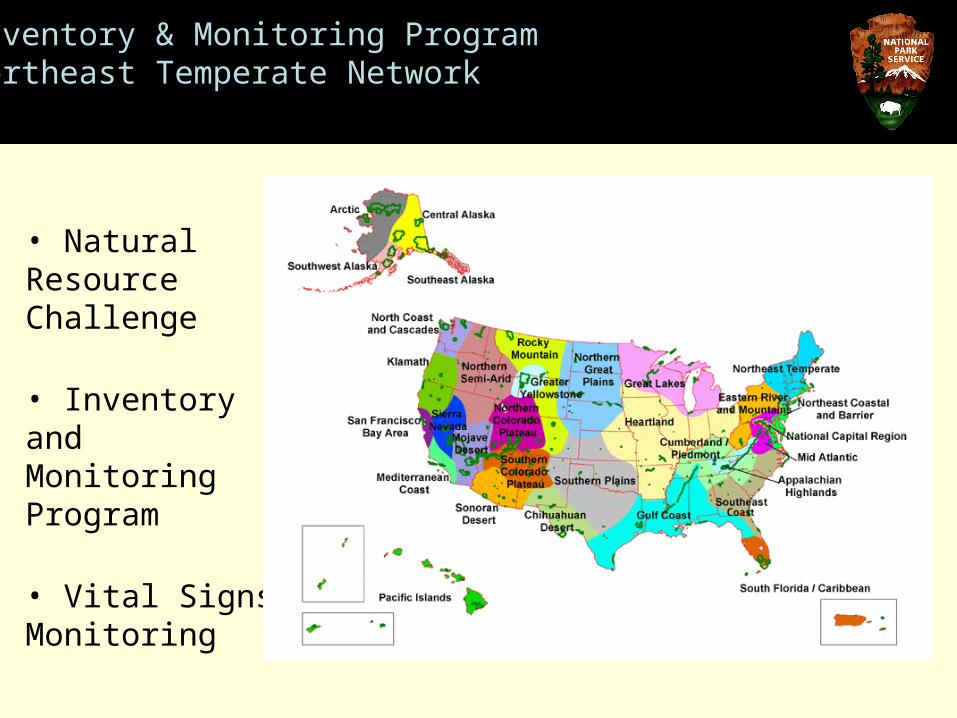
Inventory & Monitoring ProgramNortheast Temperate Network
• Northeast Temperate Network
• Vital Signs Monitoring Plan
• Protocols:
Forest Health
Lakes and Streams
Forest/Grassland Birds
Wetlands
Rocky Intertidal
Coastal Birds
Inventory & Monitoring ProgramNortheast Temperate Network
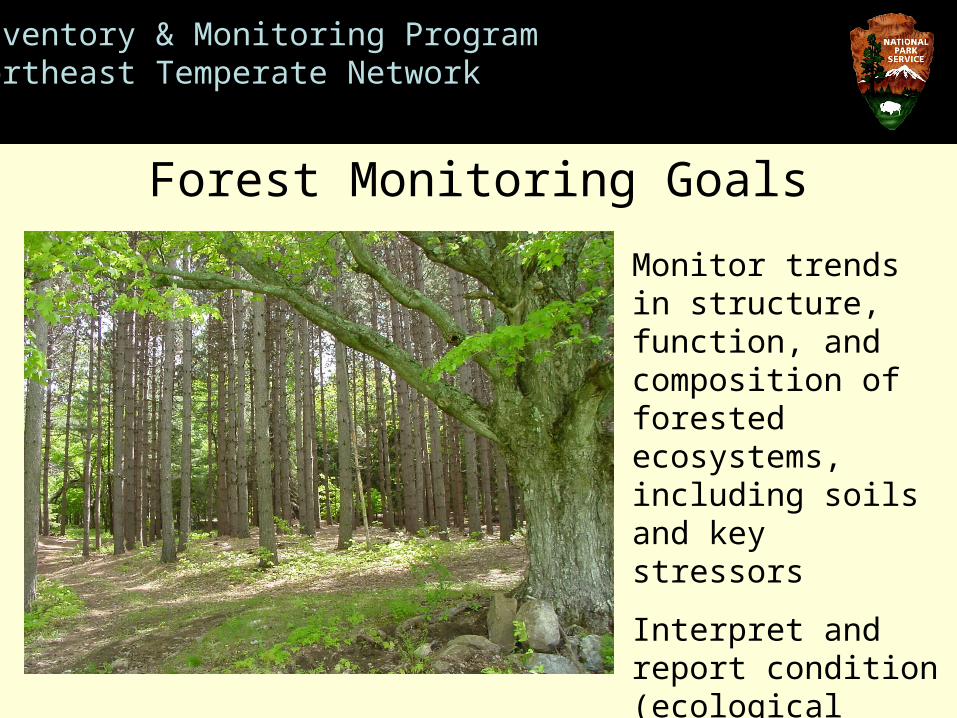
Monitor trends in structure, function, and composition of forested ecosystems, including soils and key stressors
Interpret and report condition (ecological integrity) of forested systems
Forest Monitoring Goals
Inventory & Monitoring ProgramNortheast Temperate Network
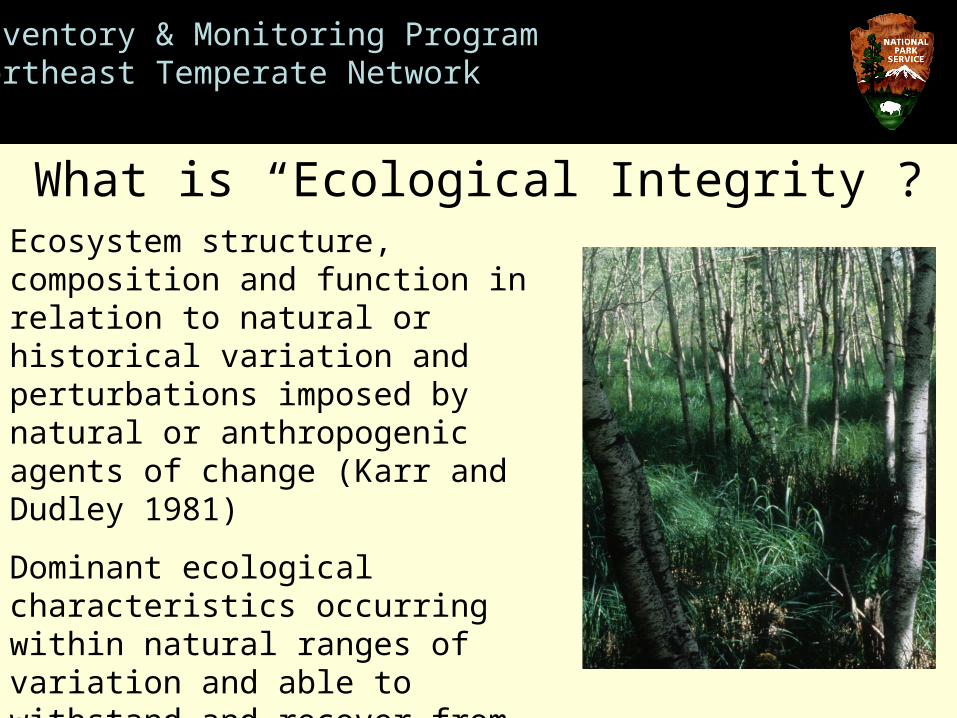
Ecosystem structure, composition and function in relation to natural or historical variation and perturbations imposed by natural or anthropogenic agents of change (Karr and Dudley 1981)
Dominant ecological characteristics occurring within natural ranges of variation and able to withstand and recover from most perturbations imposed by natural dynamics or human disruptions (Parrish et al. 2003)
What is “Ecological Integrity”?

Inventory & Monitoring ProgramNortheast Temperate Network
A set of measures of ecosystem structure, function, and composition
Reference to the range of natural variation and resistance to perturbation
Ensure links with management needs
What is “Ecological Integrity”?
Inventory & Monitoring ProgramNortheast Temperate Network
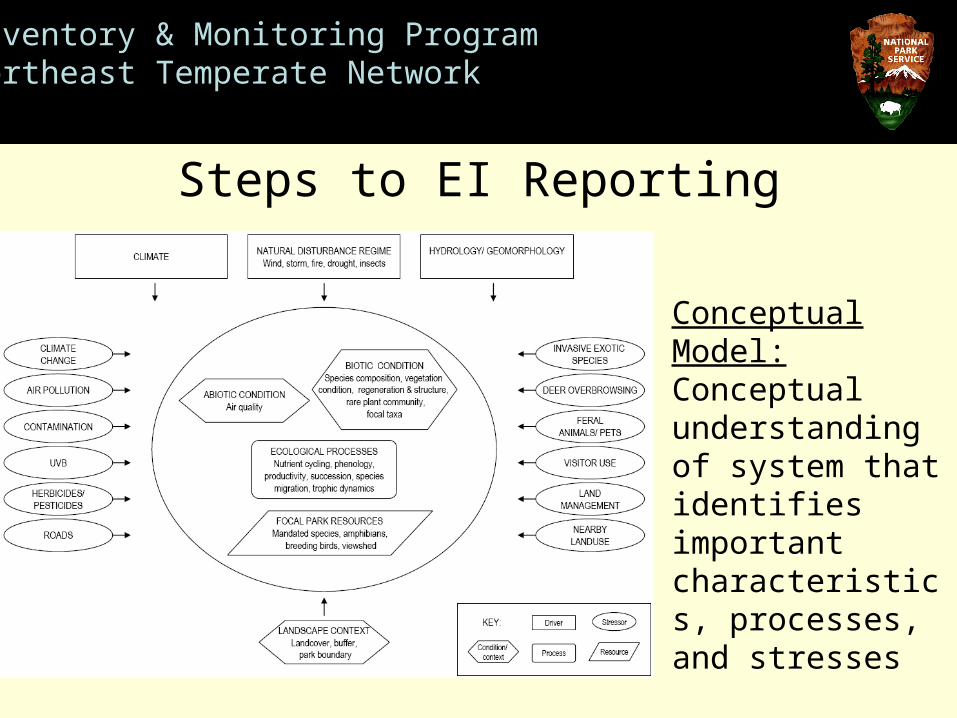
Conceptual Model: Conceptual understanding of system that identifies important characteristics, processes, and stresses
Steps to EI Reporting
Inventory & Monitoring ProgramNortheast Temperate Network
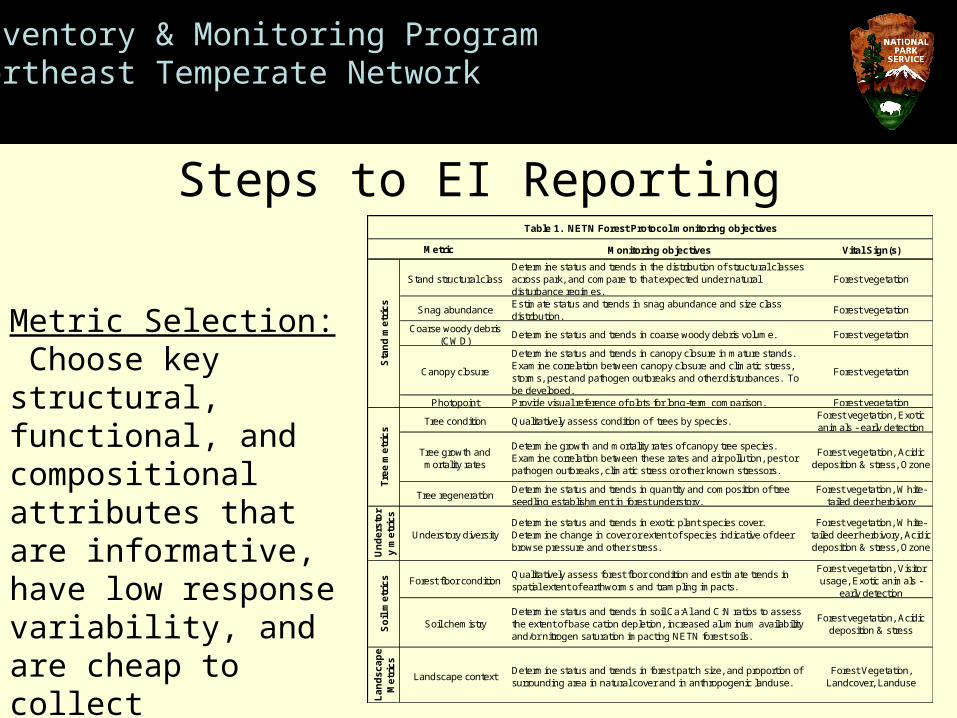
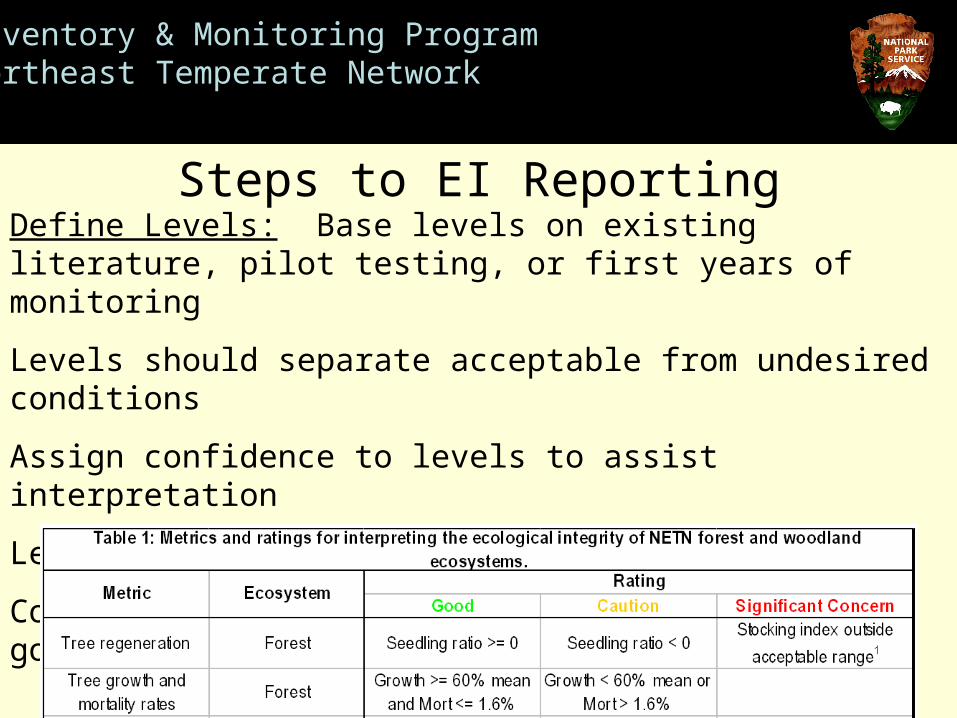
Metric Selection: Choose key structural, functional, and compositional attributes that are informative, have low response variability, and are cheap to collect
Steps to EI ReportingMonitoring objectives Vital Sign(s)
Stand structural classDetermine status and trends in the distribution of structural classes across park, and compare to that expected under natural disturbance regimes.
Forest vegetation
Snag abundanceEstimate status and trends in snag abundance and size class distribution.
Forest vegetation
Coarse woody debris (CWD)
Determine status and trends in coarse woody debris volume. Forest vegetation
Canopy closure
Determine status and trends in canopy closure in mature stands. Examine correlation between canopy closure and climatic stress, storms, pest and pathogen outbreaks and other disturbances. To be developed.
Forest vegetation
Photopoint Provide visual reference of plots for long-term comparison. Forest vegetation
Tree condition Qualitatively assess condition of trees by species. Forest vegetation, Exotic animals - early detection
Tree growth and mortality rates
Determine growth and mortality rates of canopy tree species. Examine correlation between these rates and air pollution, pest or pathogen outbreaks, climatic stress or other known stressors.
Forest vegetation, Acidic deposition & stress, Ozone
Tree regenerationDetermine status and trends in quantity and composition of tree seedling establishment in forest understory.
Forest vegetation, White-tailed deer herbivory
Un
de
rsto
ry
me
tric
s
Understory diversityDetermine status and trends in exotic plant species cover. Determine change in cover or extent of species indicative of deer browse pressure and other stress.
Forest vegetation, White-tailed deer herbivory, Acidic deposition & stress, Ozone
Forest floor conditionQualitatively assess forest floor condition and estimate trends in spatial extent of earthworms and trampling impacts.
Forest vegetation, Visitor usage, Exotic animals -
early detection
Soil chemistryDetermine status and trends in soil Ca:Al and C:N ratios to assess the extent of base cation depletion, increased aluminum availability and/or nitrogen saturation impacting NETN forest soils.
Forest vegetation, Acidic deposition & stress
La
nd
sc
ap
e
Me
tric
s
Landscape contextDetermine status and trends in forest patch size, and proportion of surrounding area in natural cover and in anthropogenic landuse.
Forest Vegetation, Landcover, Landuse
So
il m
etr
ics
Table 1. NETN Forest Protocol monitoring objectives
Metric
Tre
e m
etr
ics
Sta
nd
me
tric
s
Inventory & Monitoring ProgramNortheast Temperate Network
Define Levels: Base levels on existing literature, pilot testing, or first years of monitoring
Levels should separate acceptable from undesired conditions
Assign confidence to levels to assist interpretation
Levels can vary by habitat or location
Consider developing a complementary management goals report
Steps to EI Reporting
Inventory & Monitoring ProgramNortheast Temperate Network
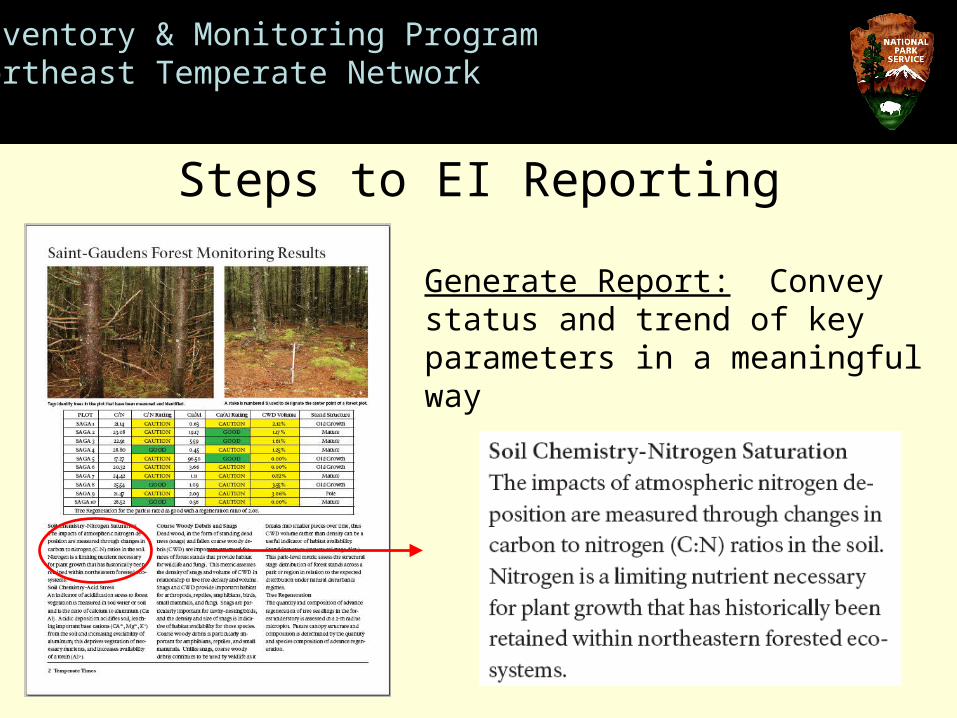
Generate Report: Convey status and trend of key parameters in a meaningful way
Steps to EI Reporting
Inventory & Monitoring ProgramNortheast Temperate Network
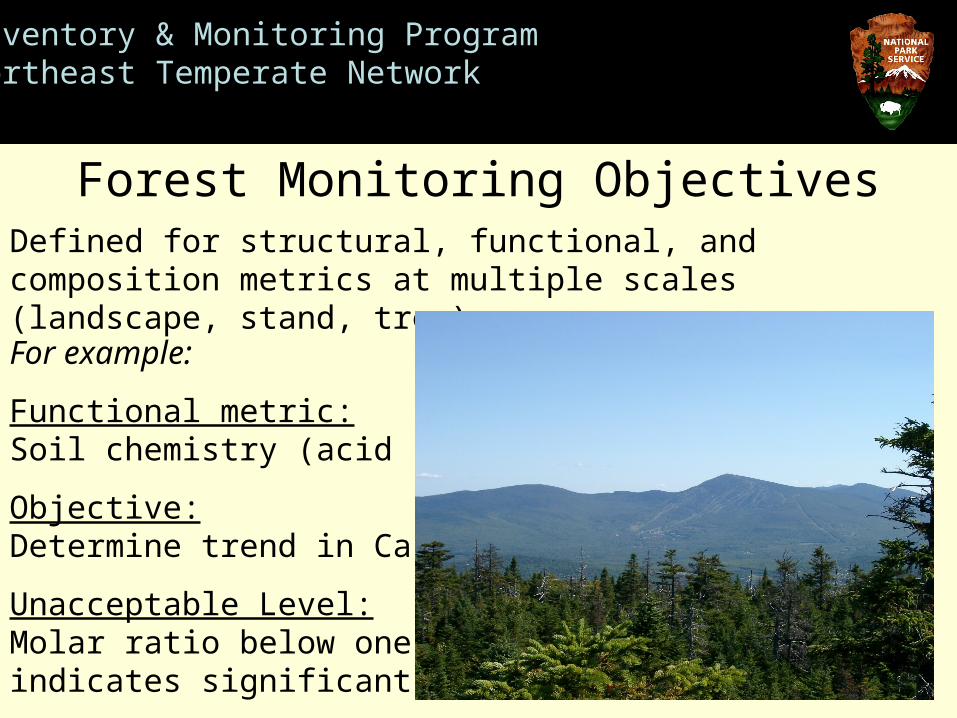
Defined for structural, functional, and composition metrics at multiple scales (landscape, stand, tree)
Forest Monitoring Objectives
For example:
Functional metric: Soil chemistry (acid stress)
Objective: Determine trend in Ca:Al ratio
Unacceptable Level: Molar ratio below one indicates significant acid stress
Inventory & Monitoring ProgramNortheast Temperate Network
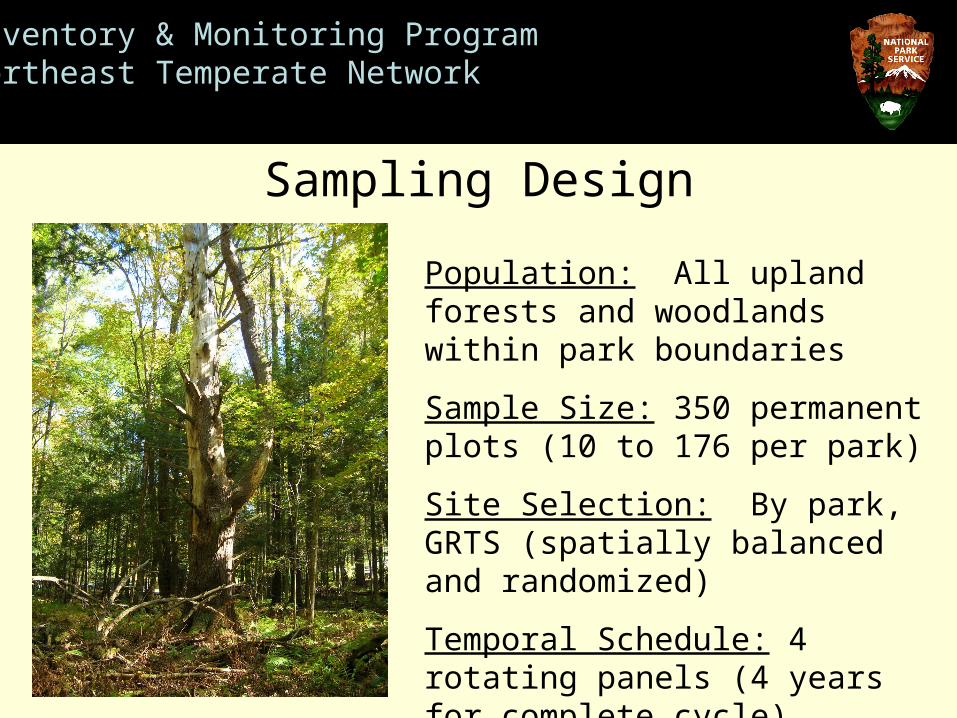
Population: All upland forests and woodlands within park boundaries
Sample Size: 350 permanent plots (10 to 176 per park)
Site Selection: By park, GRTS (spatially balanced and randomized)
Temporal Schedule: 4 rotating panels (4 years for complete cycle)
Sampling Design

Inventory & Monitoring ProgramNortheast Temperate Network
Plot Sampling
S3
S4
S5
15 m (ACAD); 20 m (NHP)
2 m
UL
ML MR
BL BR
UR
1 m
2 m
Upslope or N
Figure 1: NETN plot layout showing square tree plot with 3 nested 2-m radius regeneration microplots, 8 1-m2 veg quadrats, and 3 15-m CWD transects. Sx is location of soil sample.
15 m CWD
15 mCWD
15 m CWD
4 m
UC
BC
4 mS1
S2
B
Measures: • Stand structure• Snag abundance• CWD• Canopy Closure• Tree condition• Tree growth• Tree mortality• Tree regeneration• Understory diversity• Biotic homogenization• Soil chemistry• Landscape context
Inventory & Monitoring ProgramNortheast Temperate Network
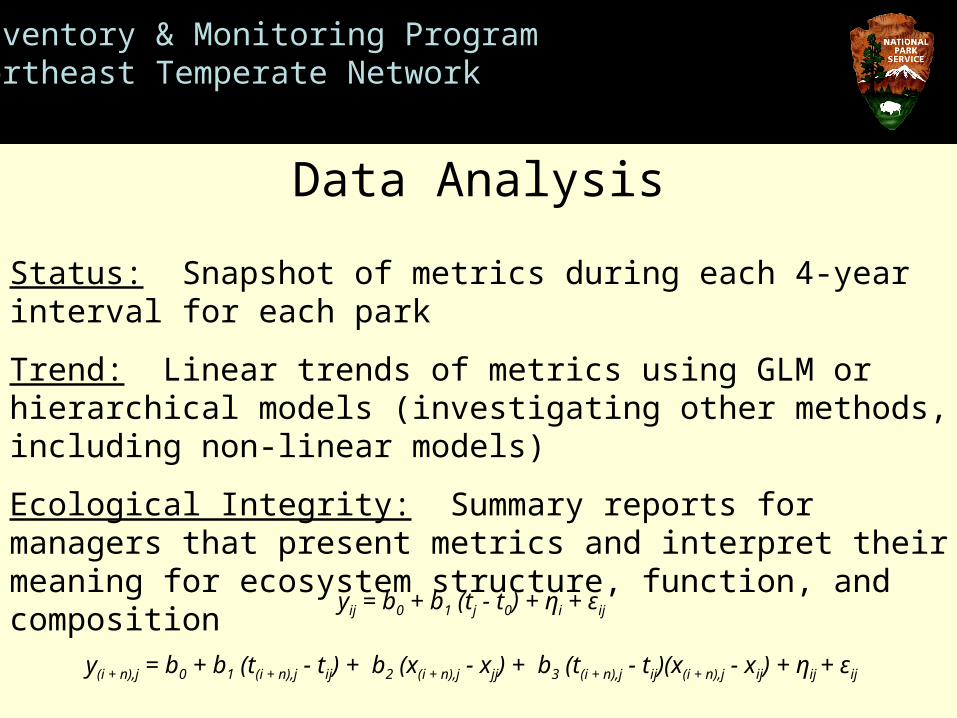
Status: Snapshot of metrics during each 4-year interval for each park
Trend: Linear trends of metrics using GLM or hierarchical models (investigating other methods, including non-linear models)
Ecological Integrity: Summary reports for managers that present metrics and interpret their meaning for ecosystem structure, function, and composition
Data Analysis
yij = b0 + b1 (tj - t0) + ηi + εij
y(i + n),j = b0 + b1 (t(i + n),j - tij) + b2 (x(i + n),j - xjj) + b3 (t(i + n),j - tij)(x(i + n),j - xij) + ηij + εij
Inventory & Monitoring ProgramNortheast Temperate Network
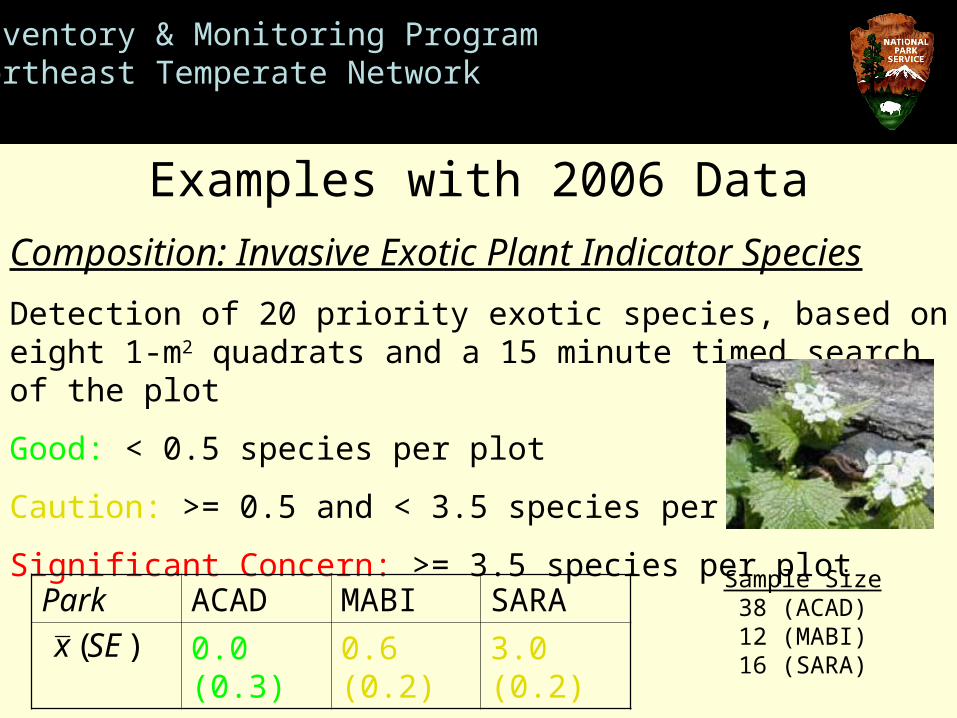
Composition: Invasive Exotic Plant Indicator Species
Detection of 20 priority exotic species, based on eight 1-m2 quadrats and a 15 minute timed search of the plot
Good: < 0.5 species per plot
Caution: >= 0.5 and < 3.5 species per plot
Significant Concern: >= 3.5 species per plot
Examples with 2006 Data
Park ACAD MABI SARA
0.0 (0.3) 0.6 (0.2) 3.0 (0.2))(SEx
Sample Size 38 (ACAD) 12 (MABI) 16 (SARA)
Inventory & Monitoring ProgramNortheast Temperate Network
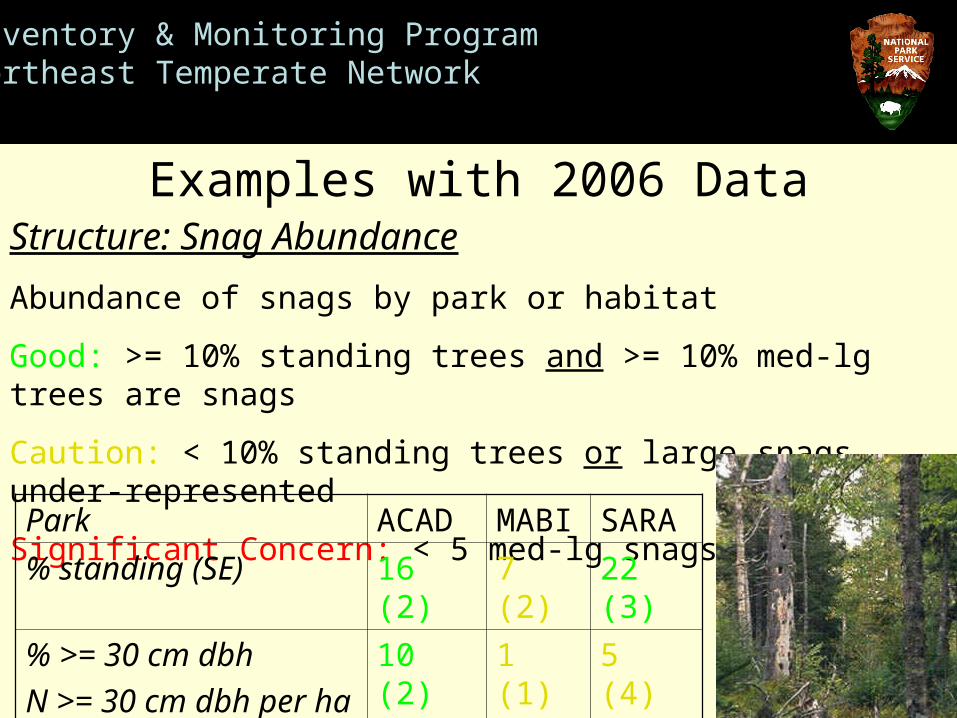
Structure: Snag Abundance
Abundance of snags by park or habitat
Good: >= 10% standing trees and >= 10% med-lg trees are snags
Caution: < 10% standing trees or large snags under-represented
Significant Concern: < 5 med-lg snags per ha
Examples with 2006 Data
Park ACAD MABI SARA
% standing (SE) 16 (2) 7 (2) 22 (3)
% >= 30 cm dbh
N >= 30 cm dbh per ha
10 (2)
8 (4)
1 (1)
2 (2)
5 (4)
5 (3)
Inventory & Monitoring ProgramNortheast Temperate Network
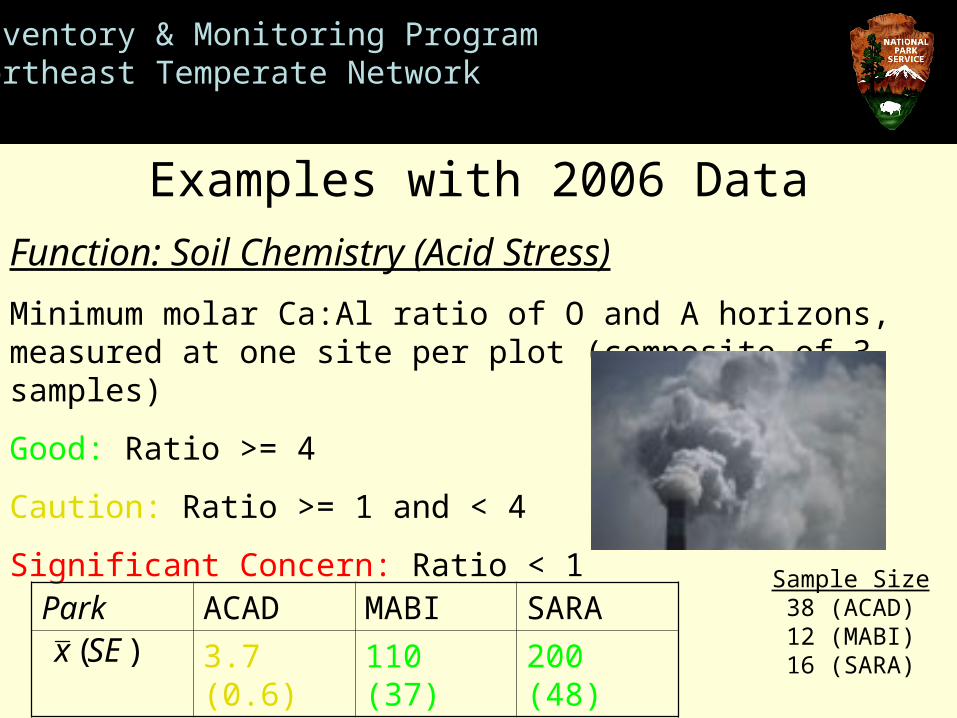
Function: Soil Chemistry (Acid Stress)
Minimum molar Ca:Al ratio of O and A horizons, measured at one site per plot (composite of 3 samples)
Good: Ratio >= 4
Caution: Ratio >= 1 and < 4
Significant Concern: Ratio < 1
Examples with 2006 Data
Park ACAD MABI SARA
3.7 (0.6) 110 (37) 200 (48))(SEx
Sample Size 38 (ACAD) 12 (MABI) 16 (SARA)
Inventory & Monitoring ProgramNortheast Temperate Network
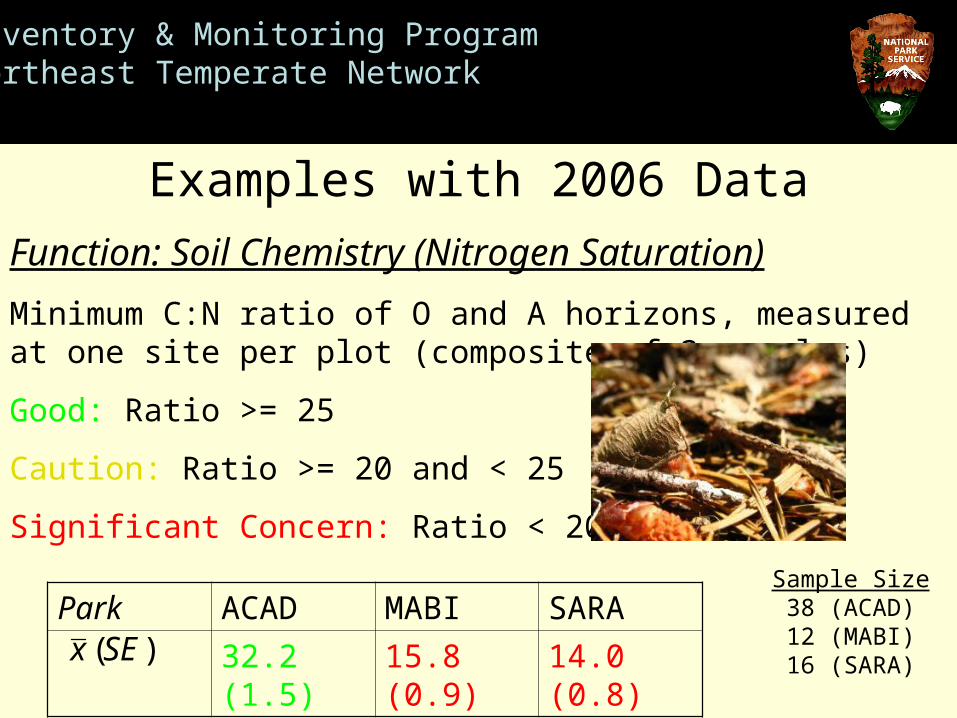
Function: Soil Chemistry (Nitrogen Saturation)
Minimum C:N ratio of O and A horizons, measured at one site per plot (composite of 3 samples)
Good: Ratio >= 25
Caution: Ratio >= 20 and < 25
Significant Concern: Ratio < 20
Examples with 2006 Data
Park ACAD MABI SARA
32.2 (1.5) 15.8 (0.9) 14.0 (0.8))(SEx
Sample Size 38 (ACAD) 12 (MABI) 16 (SARA)
Inventory & Monitoring ProgramNortheast Temperate Network
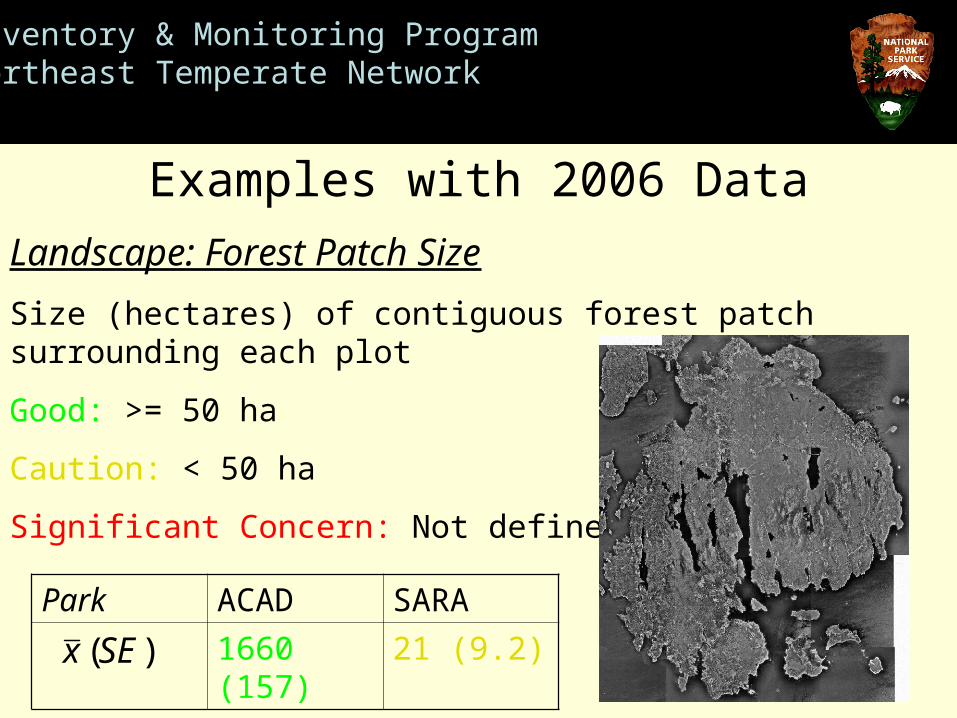
Landscape: Forest Patch Size
Size (hectares) of contiguous forest patch surrounding each plot
Good: >= 50 ha
Caution: < 50 ha
Significant Concern: Not defined
Examples with 2006 Data
Park ACAD SARA
1660 (157) 21 (9.2))(SEx
Inventory & Monitoring ProgramNortheast Temperate Network
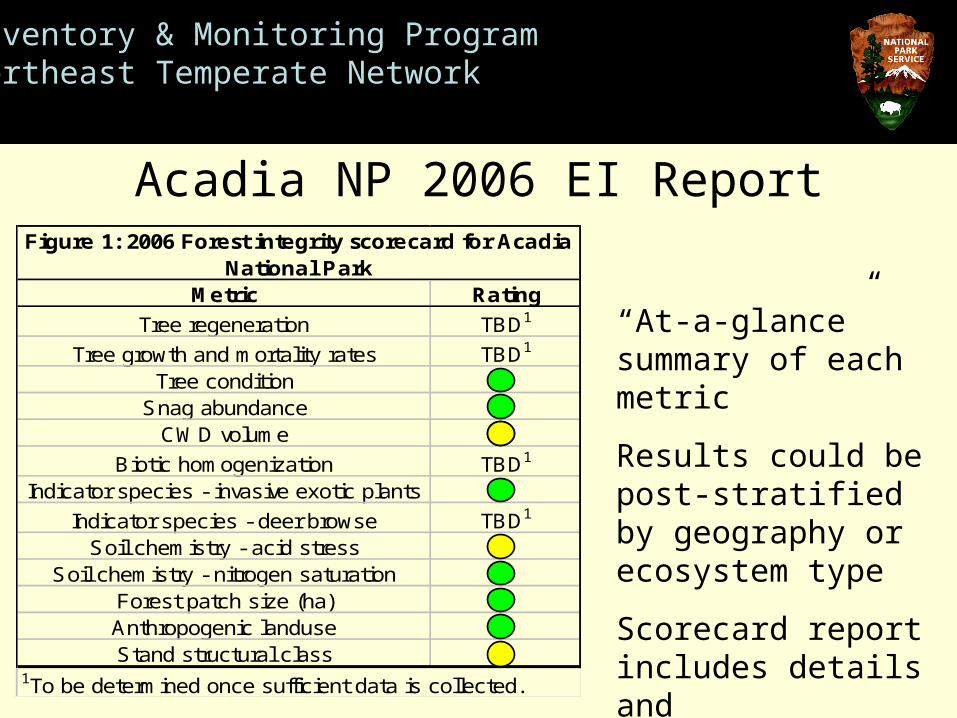
“At-a-glance” summary of each metric
Results could be post-stratified by geography or ecosystem type
Scorecard report includes details and interpretation
Acadia NP 2006 EI Report
Metric Rating
Tree regeneration TBD1
Tree growth and mortality rates TBD1
Tree conditionSnag abundance
CWD volume
Biotic homogenization TBD1
Indicator species - invasive exotic plants
Indicator species - deer browse TBD1
Soil chemistry - acid stressSoil chemistry - nitrogen saturation
Forest patch size (ha)Anthropogenic landuseStand structural class
1To be determined once sufficient data is collected.
Figure 1: 2006 Forest integrity scorecard for Acadia National Park
Inventory & Monitoring ProgramNortheast Temperate Network
2006 & 2007 Field Work: 86 (2006) and 83 (2007) plots
Review of EI Methods: EI reporting documents ready for external review
EI Manuscript: In draft form
NPS Collaboration: Working with eastern NPS programs on monitoring and reporting
Other Collaboration: Working with state and federal agencies on regional efforts
Current Status
Inventory & Monitoring ProgramNortheast Temperate Network
Science Based: Our Ecological Integrity report is scientifically sound, flexible, and transparent
Interpretive: Simple summary format is helpful for non-technical audiences
Not a Replacement: Still need rigorous trend and other analyses of raw metrics
Conclusions