Embed Size (px)
Citation preview

Occupier Perspective Global Occupancy Costs - Offices 2013
Cost saving opportunities in weak markets
DTZ Research
29 January 2013
Contents
Introduction 2
Section 1 - Global ranking 3
Section 2 - Scenarios 6
Section 3 - Secondary costs 7
Section 4 - Regional commentary 8
Authors
Karine Woodford
Head of Occupier Research + 44 (0)20 3296 2306 [email protected] Milena Kuljanin Occupier Research + 44 (0)20 3296 2305 [email protected]
This 16th edition of the Global Occupancy Costs - Offices report presents the costs of occupying prime office space across 126 markets worldwide. In this report, we present our global ranking of occupancy costs and provide a commentary for each region. Furthermore, we consider the impact of different economic scenarios and analyse occupancy costs for average-grade buildings in selected markets.
Global occupancy costs for prime offices increased by an average 1% during 2012. Whilst occupiers benefitted from the greatest cost savings in the United States, growth was also weak and below the global average in Central & South America and Europe. At 6%, North Asia witnessed the highest increase in costs on the back of strong occupier activity, particularly from non-financial sectors.
Tier II cities in China and India continue to dominate the list of top 10 most affordable markets globally. In 2012, London West End regained its position as the least affordable market globally, formerly lost to Hong Kong in 2011. This was due to rental declines in Hong Kong Central, where occupiers sought to reduce operating costs through downsizing or decentralisation.
In fact, occupiers are focusing on cost control in many markets and increasingly considering secondary space, particularly where prime space is limited. The biggest difference in costs can be seen in Shanghai and Moscow, where occupying prime space costs over 100% more than taking space in an average grade building.
Under the base case scenario, we expect rents to increase by 2.3% over the next two years, with occupiers in Asia Pacific expected to witness the highest growth rate. Across the five most affordable markets globally, the impact of the downside scenario is most significant for the Indian markets in the short term (2013-2014). Looking at the five least affordable markets, occupiers in Tokyo will be challenged by strong growth in rents under all three scenarios, whereas rents in Zurich will remain largely unchanged (Figure 1).
Figure 1
Forecast pa increase in rents, base case and scenarios, 2013-2014
Source: DTZ Research, Oxford Economics
-10%
-5%
0%
5%
10%
15%
20%
Base Case Downside Upside
5 most affordable markets 5 least affordable markets

Global Occupancy Costs - Offices
www.dtz.com Occupier Perspective 2
Introduction This 16th edition of Global Occupancy Costs - Offices presents occupancy costs per workstation across 126 business districts in 49 countries worldwide.
Using data collected from our extensive network of local offices around the world, this survey looks at the main components of occupancy costs across the globe (see Figure 2). The report provides a ranking of occupancy costs based on annual costs per workstation, taking into account differences in space utilisation per workstation in all markets.
The data is submitted in local currency and according to local measurement practices. The methodology used in the calculation of occupancy cuts through these local market practices to provide standardised cost units. We do this by converting all data into the RICS definition of Net Internal Area (NIA) and USD.
This report consists of four main sections. The first section provides a global ranking of all markets. We rank the markets according to affordability, with the most affordable market presented first. In the second section, we present the impact of the different economic scenarios: the base case scenario, downside scenario and upside scenario. The base case scenario assumes that policy makers do just enough to avoid a deep recession. The downside scenario assumes a multiple eurozone exit, whilst the upside scenarios is based on a corporate reawakening. Unless otherwise stated, forecasts in all other sections reflect the base case scenario. Our third section provides occupancy costs for average-grade buildings in a number of locations. In the final Regional commentary section, we provide detailed results from each region surveyed: North Asia, South Asia, Europe, UK, Middle East & Africa, North America and Central & South America.
Figure 2
Main components of occupancy costs
Source: DTZ Research
Time horizon In this report, we present changes in occupancy costs over the course of 2012. It should be noted that our data reflects the change in costs from Q4 2011 to Q3 2012. Given that there was little movement in our cost components (i.e. rents, outgoings, space utilisation standards) between Q3 and Q4 2012, we believe that our analysis presents a valid year-to-year picture. Whilst we produce five-year forecasts, we believe that occupiers have a short-term horizon, hence why this report provides forecasts to 2014 only. Not only do short-term forecasts offer a higher degree of certainty but we also believe that landlords are unlikely to address lease expiries that are beyond two years.
Prime rent
Outgoings
The highest rent that could be achieved for a typical building/unit of the highest quality and specification in the best location to a tenant with a
good (i.e. secure) covenant
Maintenance costs and property tax(if these are normally payable by the occupier)
Total Occupancy Costs

Global Occupancy Costs - Offices
www.dtz.com Occupier Perspective 3
Section 1 - Global ranking
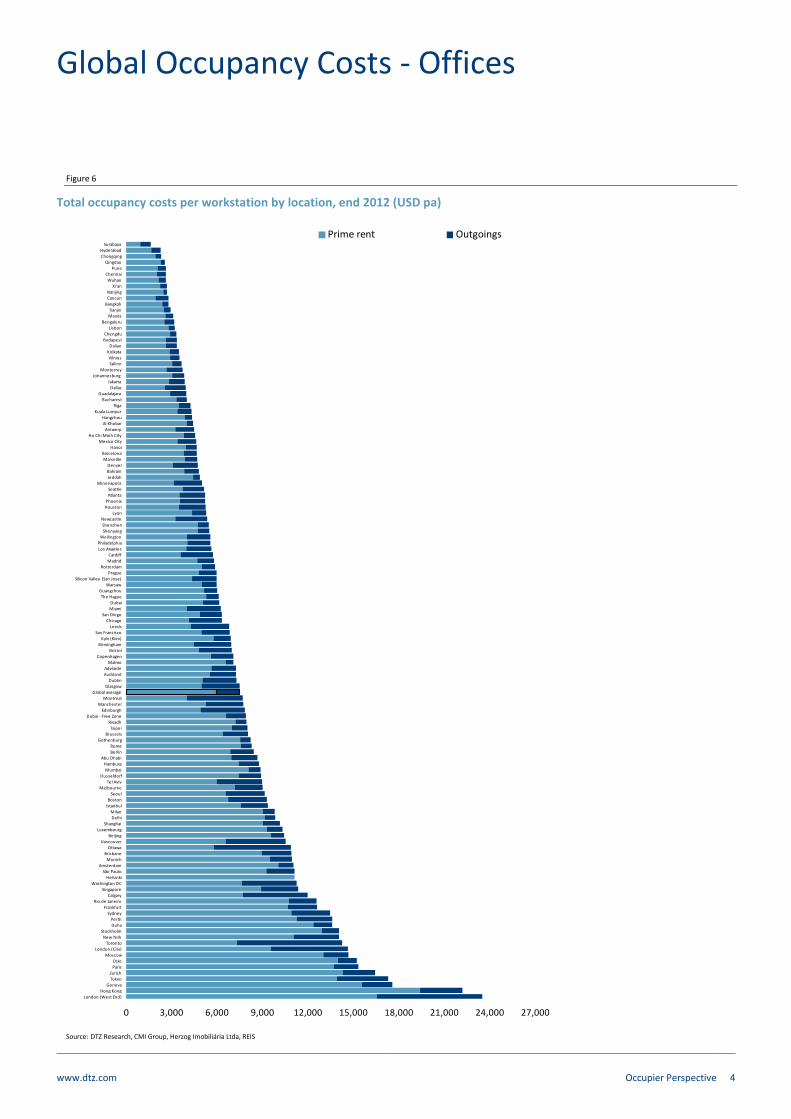
North America offered occupiers the greatest cost savings 2012 was a year of mixed fortunes for occupiers globally. Whilst some markets reported weakening levels of demand due to economic and political uncertainty, others saw relatively sustained growth. On the whole, opportunities for re-gearing leases have been limited and occupiers continue to exercise caution in their decision making, focusing on cost control and efficient space use, rather than expansion. Average global office occupancy costs grew by 1% over the year. There were marked regional differences, however. North America offered occupiers the greatest cost saving opportunities, with occupancy costs per workstation falling by 6.4% (Figure 3). This was due to a regional decrease in space utilisation of 11.8%. Whilst growth was recorded in Central & South America (0.6%), Europe (0.9%) and Middle East & Africa (1.4%), this remained below the global inflation rate of 3.2%. North Asia and South Asia witnessed growth above the global inflation rate (at 6.3% and 3.7% respectively). This was due primarily to strong domestic consumption and activity from non-financial sectors eager to tap into Asia Pacific’s brighter growth prospects. Asia Pacific to record the strongest growth going forward Looking forward, global occupancy costs are projected to rise by an average of 2.3% over the forecast period. We forecast the highest annual occupancy cost growth in North and South Asia, with growth above the global inflation average in both time horizons. While occupiers in Europe are anticipated to experience muted growth of 1.3% pa in 2013-2014, the growth will gradually increase. Looking at the long term average growth rate (2013-2017), Europe’s growth will be on a par with growth in the US (Figure 4). Costs in Rome expected to decline over the next two years Asia Pacific markets dominate our list of locations projected to experience the highest cost increases. In particular, Jakarta and Beijing are set to see the strongest growth (11.9% and 10.7% pa respectively) over the next two years. On the other hand, European markets dominate our lowest growth locations. Occupiers in Rome will benefit from the greatest cost savings as we anticipate costs to decrease by 2.1% (Figure 5 and Map 1). The most affordable office market remains Surabaya (USD 1,610 per workstation pa), followed by Hyderabad and Chongqing (Figure 6). At USD 23,500, London West End has regained its position as the world’s most expensive office location in 2012, overtaking Hong Kong which was the least affordable market in last year’s report.
Figure 3
Change in total occupancy costs per workstation by region, 2012 (USD)
Source: DTZ Research, CMI Group, Herzog Imobiliária Ltda, REIS
Figure 4
Forecast pa increase in total occupancy costs per workstation by region (USD)
Source: DTZ Research, Oxford Economics
Figure 5
Forecast pa increase in total occupancy costs per workstation, end 2012-2014 (USD)
Source: DTZ Research
-8%
-6%
-4%
-2%
0%
2%
4%
6%
8%
North America
Central & South
America
Europe Global average
occupancy costs
Middle East & Africa
Global average inflation
South Asia North Asia
0%
1%
2%
3%
4%
5%
2013-2014 2013-2017
Europe USGlobal average growth North AsiaSouth Asia Global average inflation
-4%
-2%
0%
2%
4%
6%
8%
10%
12%
14% Lowest cost increases Highest cost increases
Global Occupancy Costs - Offices
www.dtz.com Occupier Perspective 4
Figure 6
Total occupancy costs per workstation by location, end 2012 (USD pa)
Source: DTZ Research, CMI Group, Herzog Imobiliária Ltda, REIS
0 3,000 6,000 9,000 12,000 15,000 18,000 21,000 24,000 27,000
London (West End)
Hong Kong
Geneva
Tokyo
Zurich
Paris
Oslo
Moscow
London (City)
Toronto
New York
Stockholm
Doha
Perth
Sydney
Frankfurt
Rio de Janeiro
Calgary
Singapore
Washington DC
Helsinki
São Paulo
Amsterdam
Munich
Brisbane
Ottawa
Vancouver
Beijing
Luxembourg
Shanghai
Delhi
Milan
Istanbul
Boston
Seoul
Melbourne
Tel Aviv
Dusseldorf
Mumbai
Hamburg
Abu Dhabi
Berlin
Rome
Gothenburg
Brussels
Taipei
Riyadh
Dubai - Free Zone
Edinburgh
Manchester
Montreal
Global average
Glasgow
Dublin
Auckland
Adelaide
Malmo
Copenhagen
Bristol
Birmingham
Kyiv (Kiev)
San Francisco
Leeds
Chicago
San Diego
Miami
Dubai
The Hague
Guangzhou
Warsaw
Silicon Valley (San Jose)
Prague
Rotterdam
Madrid
Cardiff
Los Angeles
Philadelphia
Wellington
Shenyang
Shenzhen
Newcastle
Lyon
Houston
Phoenix
Atlanta
Seattle
Minneapolis
Jeddah
Bahrain
Denver
Marseille
Barcelona
Hanoi
Mexico City
Ho Chi Minh City
Antwerp
Al Khobar
Hangzhou
Kuala Lumpur
Riga
Bucharest
Guadalajara
Dallas
Jakarta
Johannesburg
Monterrey
Tallinn
Vilnius
Kolkata
Dalian
Budapest
Chengdu
Lisbon
Bengaluru
Manila
Tianjin
Bangkok
Cancun
Nanjing
Xi'an
Wuhan
Chennai
Pune
Qingdao
Chongqing
Hyderabad
Surabaya
Prime rent Outgoings

Global Occupancy Costs - Offices
www.dtz.com Occupier Perspective 5
Map 1
Forecast global occupancy costs and pa increase in occupancy costs, 2012-2014 (USD)
Source: DTZ Research, ESRI
Los Angeles
San Diego
Tokyo
Seoul
Qingdao
ShenyangNew York
San Francisco
Seattle
Denver
ChengduDelhi
MumbaiKolkata
Beijing
Taipei
Melbourne
Perth
Kuala Lumpur
Bangkok
Hyderabad
Pune
Hong Kong
Shenzhen
Guangzhou
ChennaiBengaluru
Singapore
Jakarta
Brisbane
Sydney
Rome
ParisZurich
Warsaw
Prague
Antwerp
BrusselsBucharest
Dusseldorf
Riga
Miami
Madrid
Dallas
Tallinn
Phoenix
Houston
Glasgow
Chicago
Atlanta
Helsinki
MarseilleBarcelona
Minneapolis
Kyiv (Kiev)
Philadelphia
Washington DC
Moscow
Shanghai
Brussels
Luxembourg
Rotterdam
Antwerp
Moscow
Rome
Paris Zurich
Warsaw
Prague
Vilnius
Bucharest
Dusseldorf
Riga
Milan
Madrid
Geneva
Berlin
Tallinn
Glasgow
Bristol
Helsinki
Budapest
Stockholm
Marseille
Barcelona
Amsterdam
Manchester
Copenhagen
Birmingham
Kyiv (Kiev)
Oslo
Munich
Dublin Hamburg
Istanbul
Frankfurt
Edinburgh
London
Total occupancy costs per workstation, 2014(USD per annum)
2,580 to 5,000
5,001 to 10,000
10,001 to 15,000
15,001 to 25,830
-3.00 to 0.00%
0.01% to 2.00%
2.01% to 6.00%
6.01 to 12.00%
Average growth in total occupancy costs per workstation, 2012-2014

Global Occupancy Costs - Offices
www.dtz.com Occupier Perspective 6
Section 2 - Scenarios
Rents under three different economic scenarios In this section, we analyse movements in rents, the main cost component, under three different scenarios: the base case, downside and upside. The base case assumes that policy makers continue to do just enough to avoid a deep recession. The downside scenario assumes a multiple eurozone exit, whilst the upside scenario assumes a corporate reawakening. Looking at GDP growth under the different scenarios, South Asia shows the strongest performance under the base case, whilst North Asia shows the strongest growth under the upside (Figure 7). Unsurprisingly, Europe is affected the most under the downside scenario, with negative GDP growth of 1.0%. Low growth in rents under the downside scenario The outlook for GDP growth is reflected in our rental forecasts. If we accept inflation as a proxy for general production cost increases, the US has the least challenging rental growth rate relative to local inflation of the regions. However, under our downside scenario, European markets show a sustained period of rental decline, offering tenants cost savings. In South Asia, the impact is bigger than expected. The downside scenario would provide a window of opportunity for occupiers to re-negotiate leases before rental growth accelerates. The impact on US markets is more muted under the downside scenario, when compared to South Asia. North Asia is the region which shows the largest increase under all three scenarios, with growth of 1.7% even under the downside scenario (Figure 8). Indian occupiers benefit under the downside scenario Across the five most affordable markets globally, the impact of the downside scenario is most significant for the Indian markets in the short term (2013-14), with rents falling by up to 5% pa in some markets. Consequently, tenants would be able to lock in cost savings in India. However, these are also the markets where rents are expected to rise the most under the base case, as well as under the upside scenario. Rents in the Chinese markets of Qingdao and Nanjing are expected to rise under all scenarios, albeit at a modest rate (Figure 9). Looking at the five least affordable markets, we expect rents in Zurich to remain unchanged under the base case and upside scenarios, but to display negative growth of 0.9% under the downside scenario. Tokyo and Geneva are expected to see positive growth under all three scenarios. Occupiers in Tokyo in particular will be challenged by strong growth in rents, of 10.3% under the base case, 8.5% under the downside and 13.8% under the upside (Figure 9).
Figure 7
Average increase in GDP by region, 2013-14 (pa)
Source: Oxford Economics
Figure 8
Forecast pa increase in rents by region, base case and scenarios, 2013-2014
Source: DTZ Research, Oxford Economics
Figure 9
Forecast pa increase in rents, base case and scenarios, 2013-2014
Source: DTZ Research, Oxford Economics
-2%
0%
2%
4%
6%
8%
EU27 USA North Asia South Asia
Downside Base Case Upside
-2%
0%
2%
4%
6%
8%
10%
12%
Europe US South Asia North Asia
Downside Base Case Upside Average Inflation Rate, Base Case
-10%
-5%
0%
5%
10%
15%
20%
Base Case Downside Upside
5 most affordable markets 5 least affordable markets

Global Occupancy Costs - Offices
www.dtz.com Occupier Perspective 7
Section 3 - Secondary costs DTZ’s Global Occupancy Costs - Offices report tracks occupancy costs per workstation in prime markets globally. However, in line with our clients’ growing interest in secondary office buildings, we also analyse occupancy costs per workstation for average-grade buildings (secondary space) in 14 major centres in Europe and Asia Pacific. Over the course of 2012, occupancy costs for average grade buildings grew by 4.2% compared to 1.0% for prime space (Figure 10). Occupancy costs for secondary space increased in eight of the 14 markets surveyed. Six of these eight markets saw secondary costs increase by a higher rate than prime space (Paris, Moscow, London West End, London City, Geneva and Shanghai). Occupiers in these markets are increasingly looking for secondary space as prime stock is limited and expensive. Meanwhile, secondary space became more affordable in Hong Kong Central, where costs decreased by 6.1%, compared to a decrease of 11.8% for prime space.
The difference in cost between prime and secondary space varies significantly across different markets. The biggest difference in costs can be seen in Shanghai and Moscow, where occupying prime space costs over 100% more than taking space in an average grade building (Figure 11). On the other hand, prime offers more value in markets such as Stockholm, London City and Sydney where the difference in cost in occupying prime compared to secondary is much less pronounced. As we can observe, London West End is the least affordable location in the world for occupying both prime and secondary office space. Table 1 provides a more detailed breakdown.
Figure 10
Prime versus secondary markets – Change in total occupancy costs per workstation, 2012 (USD)
Source: DTZ Research
Figure 11
Prime versus secondary markets – Total occupancy costs per workstation, 2012 (USD pa)
Source: DTZ Research
Table 1
Secondary occupancy costs per workstation, end 2012 (USD pa) – selected markets
Source: DTZ Research
-15%
-10%
-5%
0%
5%
10%
15%
20%
25%
30%
Prime costs Secondary costs
0%
20%
40%
60%
80%
100%
120%
140%
0
5,000
10,000
15,000
20,000
25,000
Prime (LHS) Secondary (LHS) Difference between prime and secondary (RHS)
Secondary Rank
2012
Prime Rank
2012Market Country/Territory Region
Total occupancy cost per
workstation pa -
secondary space (USD pa)
Total occupancy cost
per workstation pa -
prime space (USD pa)
Difference
between prime
and secondary
1 2 Shanghai Chinese Mainland Asia Pacific 4,390 10,130 130.8%
3 8 Moscow Russia Europe 7,000 14,650 109.3%
6 10 Zurich Switzerland Europe 8,600 16,420 90.9%
7 12 Geneva Switzerland Europe 9,980 17,560 76.0%
2 1 Delhi India Asia Pacific 5,950 9,810 64.9%
4 4 Frankfurt Germany Europe 8,240 12,600 52.9%
10 11 Tokyo Japan Asia Pacific 11,640 17,280 48.5%
14 14 London West End United Kingdom Europe 16,270 23,500 44.4%
9 9 Paris France Europe 11,000 15,320 39.3%
13 13 Hong Kong Hong Kong SAR Asia Pacific 16,110 22,190 37.7%
5 3 Singapore Singapore Asia Pacific 8,470 11,350 34.0%
8 5 Sydney Australia Asia Pacific 10,470 13,440 28.4%
12 7 London City United Kingdom Europe 12,250 14,620 19.3%
11 6 Stockholm Sweden Europe 11,950 14,040 17.5%

Global Occupancy Costs - Offices
www.dtz.com Occupier Perspective 8
Section 4 - Regional commentary
North Asia
Strong growth in costs recorded in the first half of 2012 Despite global headwinds, occupancy costs continued to grow in the majority of markets in North Asia (Figure 12). Persistent lack of supply in Beijing enabled landlords to further increase prime rents, although not as aggressively as in previous years. This resulted in a 17.7% increase in occupancy costs. It should be noted that the demand in most Chinese markets was particularly strong in H1, but started to weaken in Q3 as reduced external demand started to affect corporate expansion. There are some exceptions, however, with Chengdu and Chongqing, seeing sustained tenant demand since Q4 2011. These markets benefit from demand from companies eager to tap into growth in Central and Western China. Many occupiers in Hong Kong Central reduced operating costs through downsizing or decentralisation in light of high occupancy costs. This supported rents in decentralised areas whilst rising vacancy in Hong Kong Central led to rental decline, causing occupancy costs to fall by 12%. In Seoul, face rents increased but an injection of new Grade A office space and more favourable incentives enabled occupiers to relocate to higher-quality buildings, allowing for 11% more space per employee. Continued growth in major markets Economic concerns will continue to dampen sentiment in the short term. In Beijing, prime rents are expected to increase by nearly 14% y-o-y in 2013 - significantly lower than the 50% and 22% y-o-y increases witnessed in 2011 and 2012 respectively. The strongest growth in costs over the forecast period is expected in the major markets of Beijing (10.7%), Tokyo (8.3%) and Hong Kong (7.9%). We believe that subdued sentiment combined with a large development pipeline will have a dampening effect on costs in Shenzhen (-0.1%), Tianjin (1.4%) and Guangzhou (1.7%). However, policies encouraging domestic demand and service-sector expansion in China are likely to stimulate regional demand after 2013 (Figure 13). Opportunity to renegotiate leases in Hong Kong and Tokyo Despite recent falls in costs in Hong Kong, we believe that a stabilising economic outlook combined with tight office supply in Central will have a rebounding effect on rents. Similarly, we expect a return to growth in Tokyo in 2012 following four years of rental decline. The rise in total occupancy costs in Tokyo this year was due to increased space utilisation standards rather than costs. Hong Kong and Tokyo will remain the least affordable markets in North Asia in 2014 (Figure 14).
Figure 12
Change in total occupancy costs per workstation, 2012 (local currency) – North Asia
Source: DTZ Research
Figure 13
Forecast pa increase in total occupancy costs per workstation, end 2012-2014 (USD) – North Asia
Source: DTZ Research
Figure 14
Total occupancy costs per workstation, end 2012 and 2014 – North Asia (USD pa)
Source: DTZ Research
-15% -10% -5% 0% 5% 10% 15% 20%
Beijing
Chongqing
Shenyang
Shanghai
Wuhan
Seoul
Chengdu
Dalian
Xi'an
Qingdao
North Asia Average
Tokyo
Tianjin
Taipei
Hangzhou
Nanjing
Shenzhen
Guangzhou
Hong Kong
-1%
0%
1%
2%
3%
4%
5%
6%
7%
8%
9%
10%
11%
0
5,000
10,000
15,000
20,000
25,000
30,000
2012 2014

Global Occupancy Costs - Offices
www.dtz.com Occupier Perspective 9
South Asia
Occupiers in Jakarta challenged by rising costs in 2012 Occupiers in 15 out of 22 South Asian markets saw costs increase over 2012. However, the average growth in the region was more muted than in North Asia, at 2.7% (Figure 15). The strongest growth was recorded in Jakarta (20.7%) due to rising rental values. Investors are attracted to Indonesia due to its natural resources and a growing middle class. This is fuelling demand for office space in the capital. Simultaneously, a shortage of supply is making it possible for landlords to demand higher rents. In India, occupiers continued to consolidate and relocate to less premium areas in order to rationalise real estate costs. In spite of this, total occupancy costs increased in five out of six Indian markets. With rents remaining largely stable, the increase in costs was driven by increased outgoings on the back of prevailing high inflation. At the other end of the scale, Singapore witnessed the biggest decrease in costs (by 4.1%). However, it should be noted that the rental decline has been lower than previously expected, as year-to-date demand is already higher than the annual average during 2007-2011. While financial services firms have held back on their expansion plans and are limiting manpower increases to only critical hires, some of the slack has been picked up by the non-financial sector, e.g. legal, pharmaceutical, engineering and media. Cost saving opportunities in Kuala Lumpur and Singapore Prime rents in Jakarta will continue to rise in 2013 and 2014, reaching an average annual growth rate of 11.9% (Figure 16). However, we expect the pace of growth to moderate after 2014 due to a strong development pipeline and relatively low levels of pre-commitment. Costs are also expected to rise with significant pace in India as improved economic indicators will filter through to occupier markets. Meanwhile, there will be opportunities for occupiers seeking to establish Asian operations in Kuala Lumpur and Singapore, where we anticipate costs to decrease by 1.3% and 0.7% respectively over the next two years. However, it should be noted that island-wide vacancy rates in Singapore are currently at their lowest level since 2008, and we expect costs to rise steadily in the long term. Subdued demand combined with new supply will lead to a low growth in costs in Melbourne (2.3%). Demand for space in Australia is generally subdued amid global uncertainty in the financial sectors and a weakening resources sector. Nevertheless, the Australian markets will continue to be the most unaffordable in South Asia in 2014, with Perth in the lead, at USD 15,420 per workstation (Figure 17).
Figure 15
Change in total occupancy costs per workstation, 2012 (local currency) – South Asia
Source: DTZ Research
Figure 16
Forecast pa increase in total occupancy costs per workstation, end 2012-2014 (USD) – South Asia
Source: DTZ Research
Figure 17
Total occupancy costs per workstation, end 2012 and 2014 – South Asia (USD pa)
Source: DTZ Research
-10% -5% 0% 5% 10% 15% 20% 25%
JakartaKolkata
PerthBrisbane
ManilaAdelaide
BengaluruSouth Asia Average
HyderabadChennai
WellingtonMelbourne
SurabayaPune
BangkokSydney
Kuala LumpurDelhi
AucklandMumbai
HanoiHo Chi Minh City
Singapore
-2%
0%
2%
4%
6%
8%
10%
12%
14% Lowest costs increases Highest costs increases
0
2,000
4,000
6,000
8,000
10,000
12,000
14,000
16,000
18,000
2012 2014

Global Occupancy Costs - Offices
www.dtz.com Occupier Perspective 10
Europe
Occupier cost savings realised through space efficiency Total occupancy costs remained stable across Europe during the year, registering growth of 0.3% (Figure 18). Over half of the markets surveyed (23 out of 40) witnessed either static or falling occupancy costs, with occupiers in Copenhagen, Lisbon, Geneva and Madrid witnessing the greatest cost savings (with declines of 5.7-10% respectively). Whilst falls in Madrid were the result of softening rents, declines in Copenhagen, Lisbon and Geneva were all due to improved space efficiency, as the space utilisation standard per workstation fell between 6 and 10% in all three markets. Greater space efficiency is an ongoing trend throughout the region, with many occupiers focusing on cost control and efficient space use rather than expansion. In the last five years, the space utilisation standard across the region has fallen by an aggregate average of 6%. The Nordics and Germany account for the highest space allocation per worker - at 20 sq m (24 sq m in Helsinki); whilst Lisbon and the CEE markets account for the lowest, at 9 sq m and 12.4 sq m respectively. An increase in occupancy costs was witnessed in 17 markets, with the highest increase of 9.1% recorded in Tallinn. The increase was due to higher rents and outgoings. Costs also increased in Oslo (7.4%) and Marseille (5.5%) due to increased rental values (Figure 18). Although Tallinn recorded the greatest cost increase during the year, it remains one of the most affordable markets in the region, alongside Budapest and Vilnius (Figure 20). There was also upward pressure on rental values in the Nordics and Germany, where the economic fundamentals are relatively strong. Poor economic prospects to cause decline in costs As markets start to recover, we forecast occupancy costs in Europe to increase by 1.3% pa over the short term forecast period. Moscow will be the highest growth market between now and 2014 (4.0%), reflecting the shortage in new supply and continuous solid demand (Figure 19). Occupiers in Moscow could benefit from considering secondary space, as it is twice as affordable as prime (see Table 1). At the other end of the scale, poor economic prospects are expected to cause the biggest drop in costs in Rome (-2.0%), Barcelona (-1.1%) and Kyiv (-1.0%) (Figure 19). Average occupancy costs per workstation in Europe are expected to reach EUR 7,300 per workstation in 2014, compared to EUR 7,100 per workstation in 2012 (Figure 20).
Figure 18
Change in total occupancy costs per workstation, 2012 (local currency) – Europe
Source: DTZ Research
Figure 19
Forecast pa increase in total occupancy costs per workstation, end 2012-2014 (EUR)
Source: DTZ Research
-15% -10% -5% 0% 5% 10% 15%
TallinnOslo
MarseilleIstanbul
VilniusBucharest
London CityDusseldorf
MunichHelsinkiWarsaw
Europe average inflationBrussels
StockholmBerlin
GothenburgHamburgMoscow
Europe average growthLondon West End
MalmoLyon
FrankfurtRiga
ZurichLuxembourg
BarcelonaDublinRome
AmsterdamRotterdamKyiv (Kiev)
AntwerpPrague
MilanBudapest
The HagueParis
MadridGeneva
LisbonCopenhagen
-3%
-2%
-1%
0%
1%
2%
3%
4%
5%Lowest cost increases Highest cost increases

Global Occupancy Costs - Offices
www.dtz.com Occupier Perspective 11
Figure 20
Total occupancy costs per workstation, end 2012 and 2014 – Europe (EUR pa)
Source: DTZ Research
0 5,000 10,000 15,000 20,000 25,000
London West EndGeneva
ZurichOslo
MoscowLondon City
ParisStockholmFrankfurt
HelsinkiMunich
AmsterdamLuxembourg
IstanbulMilan
Europe averageHamburg
DusseldorfBerlin
GothenburgBrussels
RomeDublin
CopenhagenMalmo
Kyiv (Kiev)The Hague
PragueWarsawMadrid
LyonMarseilleAntwerp
BarcelonaRiga
BucharestTallinnVilnius
Budapest
2012 2014

Global Occupancy Costs - Offices
www.dtz.com Occupier Perspective 12
UK
Costs unchanged in several regional cities Average occupancy costs per workstation in the UK increased by 1.6% in 2012, with marked differences between the markets. Whilst occupiers benefitted from no cost increases in the regional cities of Leeds, Newcastle, and Glasgow - and very minor increases in Birmingham, Bristol and Edinburgh - growth in Cardiff was as high as 7% (Figure 21). This was primarily due to an increase in rents, as well as to the outgoings following a rise in service charges. In London West End, occupancy costs per workstation remained stable during the year, following marked increases the previous year. As for London City, whilst 2011 brought large decreases in overall costs due to improved space use, 2012 saw occupancy costs per workstation increase by 3.7%, on the back of rises in outgoings. London City occupiers showed overall subdued demand and reluctance to move unless compelled by factors outside their control. Although the average space utilisation standard per workstation across the UK has remained unchanged - at 10 sq m - there is still an apparent trend for companies to focus on optimising space use. As a result, developers are adapting designs to next generation buildings to accommodate one worker per 8 sq m where possible. Occupiers are also increasingly seeking energy efficient buildings with good Energy Performance Certificate (EPC) ratings due to their lower running costs. Occupiers in Bristol to benefit from the lowest increases in costs over the next two years Occupiers in Bristol will see costs grow at the lowest regional rate of 1.2% pa, as uncertainty will continue to dampen rental growth (Figure 22). At the other end of the scale, above UK average growth is expected in London West End (4.0%), London City (3.6%), Edinburgh (2.4%), Manchester (2.3%) and Newcastle (2.3%). Companies are generally unsure of where their businesses are going, wish to be enticed into leases with incentives and are looking for a 3-year break on a 5-year lease. Newcastle to remain the most affordable UK city in 2014 On average, UK occupancy costs are expected to grow by 2.2% pa over the two-year forecast period, reaching GBP 6,100 per workstation in 2014. In terms of current ranking, London West End and London City are the most expensive office locations in the UK, whilst the most affordable market is Newcastle. The ranking will remain largely unchanged by 2014, with only Bristol and Birmingham swapping positions. Costs in London West End are expected to reach GBP 15,690 per workstation pa in 2014 (Figure 23).
Figure 21
Change in total occupancy costs per workstation, 2012 (GBP) – UK
Source: DTZ Research
Figure 22
Forecast pa increase in total occupancy costs per workstation, end 2012-2014 (GBP)
Source: DTZ Research
Figure 23
Total occupancy costs per workstation, end 2012 and 2014 – UK (GBP pa)
Source: DTZ Research
0%
1%
2%
3%
4%
5%
6%
7%
8%
No change
0%
1%
2%
3%
4%
5%
0
2,000
4,000
6,000
8,000
10,000
12,000
14,000
16,000
18,000
2012 2014

Global Occupancy Costs - Offices
www.dtz.com Occupier Perspective 13
Middle East and Africa
Occupiers in Abu Dhabi and Dubai benefit from the greatest cost savings Occupier demand in the Middle East and Africa during the first three quarters of 2012 remained subdued and more focused on cost control than on expansion. This led to falling or stable occupancy costs in most markets. Nevertheless, average regional occupancy costs per workstation still grew by an average of 1.6% (Figure 24). This was driven by a sharp increase of 16.3% in Tel Aviv, on the back of rising rents and outgoings, supported by robust demand. At the same time, there have been limited new project completions and thus minimal supply. Going forward, we expect rents to stabilise, in anticipation of an injection of newly built properties at the end of 2013 and beginning of 2014 in central Tel Aviv. However, in the prime high tech parks of Tel Aviv, rents are expected to increase due to strong demand from international technology companies combined with limited supply. Although increases were also recorded in Doha and Johannesburg, all other markets witnessed falls or stable costs. Occupiers benefited from cost savings in three markets across the United Arab Emirates: Abu Dhabi (-4.5%), Dubai (-3.5%) and Dubai Free Zone (-2.7%) (Figure 24). In Dubai, rising supply and high vacancy levels have caused rents to decrease. Existing occupiers are focusing on optimising their portfolios and increasing quality through consolidation of operations into one location. There is limited demand from new entrants. Johannesburg still in the lead for most affordable market In terms of ranking, Johannesburg was once again the most affordable market in the region (at USD 3,810 per workstation pa) despite witnessing an increase in costs. Availability for prime space continues to be very tight which accounts for the rise in rents. Occupiers also benefit from low costs in Al Khobar, Bahrain and Jeddah. At the other end of the scale, Doha in Qatar is the least affordable market in the region, at USD 13,590 - up from USD 12,510 last year. Average regional costs are USD 7,033 (Figure 25).
Figure 24
Change in total occupancy costs per workstation, 2012 (local currency) – Middle East and Africa
Source: DTZ Research
Figure 25
Total occupancy costs per workstation, end 2012 and 2014 – Middle East and Africa (USD pa)
Source: DTZ Research
-10%
-5%
0%
5%
10%
15%
20%
0
2,000
4,000
6,000
8,000
10,000
12,000
14,000
16,000

Global Occupancy Costs - Offices
www.dtz.com Occupier Perspective 14
North America
Cost savings through space efficiency All US cities witnessed falls in occupancy costs per workstation during 2012. Demand for space was at a low level, reflecting a sluggish labour market and weak corporate sentiment. However, the biggest reason for the decline was a considerable reduction in space utilisation standard across the board. On average, these fell by 11.8% during 2012. The biggest decreases were recorded in Washington DC (-17%) and Los Angeles (-14%) where greater space efficiency is becoming more of a trend than in previous years (Figure 26). Despite these falls, space utilisation standards remain the highest in the US, averaging 14 sq m compared to the global average of 12 sq m. In Canada, most markets witnessed renewed confidence feeding through to an increase in occupier demand. In fact, the major Canadian markets returned to pre-recession levels of occupier activity and take-up. Decreasing vacancy rates have put upward pressure on rents. Calgary saw the biggest increase in occupancy costs at 14%. Going forward, we expect demand to continue to outpace supply in both Calgary and Toronto, causing prime rents to rise as quality space is leased up. If the strong demand sustains, many Canadian markets are indeed likely to suffer from a lack of supply, as new construction was slow after the recession. New York, San Francisco and Denver to see costs grow above the inflation average Occupancy costs are forecast to increase across the US over the next two years, albeit at a muted rate. Occupiers in New York will face the greatest uplift, by 3.7% y-o-y to reach USD 15,100 per workstation in 2014 (Figure 27 and Figure 28). However, in a wider global context, New York’s growth rate is relatively low, a full eight percentage points below projected growth in costs in Jakarta, our global top performer. Denver and San Francisco will also see costs grow above the inflation average. Occupiers in Phoenix and San Diego will benefit from the lowest growth, of 0.9% pa (Figure 27). Dallas maintains its position as most affordable city At USD 3,940 per workstation pa, Dallas currently offers occupiers the most affordable prime office space in the US, followed by Denver, Minneapolis and Seattle (Figure 28). These will remain the most affordable locations in 2014, reaching USD 4,050 in Dallas, USD 4,960 in Denver and USD 5,230 in Minneapolis. At the other end of the scale, New York, Washington DC, Boston and San Francisco continue to be the least affordable office locations in the US, and will maintain their position in our five year forecast period.
Figure 26
Change in total occupancy costs per workstation, 2012 (USD) – North America
Source: DTZ Research, REIS
Figure 27
Forecast pa increase in total occupancy costs per workstation, end 2012-2014 (USD)
Source: DTZ Research
Figure 28
Total occupancy costs per workstation, end 2012 and 2014 – US (USD pa)
Source: DTZ Research, REIS
-20% -15% -10% -5% 0% 5% 10% 15% 20%
CalgaryToronto
North America average inflationVancouver
MontrealOttawa
North America average costsSan Francisco
SeattleHouston
BostonDenver
Silicon Valley (San Jose)San Diego
DallasPhiladelphia
AtlantaNew York
MinneapolisPhoenix
MiamiChicago
Los AngelesWashington DC
0%
1%
2%
3%
4%
5%
0 2,000 4,000 6,000 8,000 10,000 12,000 14,000 16,000
New York
Washington DC
Boston
San Francisco
US average
Chicago
Miami
San Diego
Los Angeles
Philadelphia
Houston
Atlanta
Seattle
Phoenix
Minneapolis
Denver
Dallas
2012 2014

Global Occupancy Costs - Offices
www.dtz.com Occupier Perspective 15
Central & South America
Total occupancy costs hold up despite high levels of new supply in major Latin American cities Last year’s report commented on the exceptionally high growth in occupancy costs per workstation in the Brazilian markets of São Paulo (22%) and Rio de Janeiro (37%) - contrasted against no growth or slight decreases in the Mexican cities. This year’s figures present a more balanced and moderate picture across the region as a whole. Whilst São Paulo continued to witness relatively high growth (10%), growth in Rio de Janeiro was more moderate at 5%. By contrast, Mexico City, which witnessed no growth last year, saw occupancy costs per workstation rise by 8% in 2012 (Figure 29). In general, occupiers in Brazil are now benefitting from more balanced fundamentals, with more stock coming onto the market, providing occupiers with more space options. Mexico City is also witnessing a surge in supply. Even so, prime rents have increased particularly in the CBD and financial corridor of the city, on the back of higher levels of demand than in previous years. We expect further rental growth in Mexico City in the short to medium term. Cancun and Guadalajara are displaying a more balanced outlook. There have been no changes to space utilisation standards per workstation in either market during the year. Space per workstation stands at 12.5 sq m in Brazil and ranges between 8 sq m in Cancun and 10 sq m in Guadalajara, Mexico City, and Monterrey (Mexico). As today’s mature and sophisticated occupiers are requiring higher levels of efficiency and sustainability, we anticipate decreasing space utilisations standards going forward and more efficient use of space across the entire region. Meanwhile, outgoings have increased in Brazil as well as Mexico. In Brazil, outgoings have suffered increases in recent years, mainly due to salary adjustments on the part of service providers. Cancun and Monterrey most affordable Latin American cities In terms of ranking, Rio de Janeiro and São Paulo remain the most expensive cities in the region in terms of total occupancy costs per workstation, at USD 12,570 and USD 11,090. Globally, Rio de Janeiro ranks the 17
th least
affordable market, compared to 14th
least affordable in 2011 (and 28
th in 2010). Cancun and Monterrey are the
most affordable Latin American cities covered in our survey - at USD 2,780 and USD 3,720 respectively (Figure 30).
Figure 29
Change in total occupancy costs per workstation, 2012 (local currency) – Central and South America
Source: CMI Group, Herzog Imobiliária Ltda
Figure 30
Total occupancy costs per workstation, end 2012 – Central and South America (USD pa)
Source: CMI Group, Herzog Imobiliária Ltda
-4%
-2%
0%
2%
4%
6%
8%
10%
12%
Monterrey Cancun Guadalajara Rio de Janeiro
Central & South
America
average
Mexico City São Paulo
0
2,000
4,000
6,000
8,000
10,000
12,000
14,000
Cancun Monterrey Guadalajara Mexico City Central & South
America average
São Paulo Rio de Janeiro

Global Occupancy Costs - Offices
www.dtz.com Occupier Perspective 16
Appendix 1
Table 2
Top 50 ranking of markets: total occupancy costs per workstation per annum (USD and local currency)
Source: DTZ Research, CMI Group, Herzog Imobiliaria Ltda, REIS
2012 2011 Unit 2012 2011
1 1 Surabaya Indonesia Asia Pacific 1,610 1,680 -4% IDR 15,420,480 15,231,480 1%
2 3 Hyderabad India Asia Pacific 2,280 2,230 2% INR 120,480 117,480 3%
3 2 Chongqing China Asia Pacific 2,300 1,950 18% RMB 14,520 12,360 17%
4 5 Qingdao China Asia Pacific 2,560 2,380 8% RMB 16,080 15,000 7%
5 8 Pune India Asia Pacific 2,620 2,590 1% INR 138,240 136,800 1%
6 7 Chennai India Asia Pacific 2,620 2,570 2% INR 138,480 135,720 2%
7 4 Wuhan China Asia Pacific 2,630 2,290 15% RMB 16,440 14,400 14%
8 6 Xi'an China Asia Pacific 2,670 2,470 8% RMB 16,800 15,480 9%
9 11 Nanjing China Asia Pacific 2,700 2,800 -4% RMB 16,920 17,640 -4%
10 10 Cancun Mexico Central & South America 2,780 2,780 0% USD 2,760 2,760 0%
11 9 Bangkok Thailand Asia Pacific 2,780 2,690 3% THB 85,800 85,200 1%
12 13 Tianjin China Asia Pacific 2,910 2,870 1% RMB 18,240 18,000 1%
13 12 Manila Philippines Asia Pacific 3,110 2,820 10% PHP 129,960 123,600 5%
14 16 Bengaluru India Asia Pacific 3,180 3,100 3% INR 167,880 163,200 3%
15 22 Lisbon Portugal Europe 3,190 3,580 -11% EUR 2,520 2,760 -9%
16 14 Chengdu China Asia Pacific 3,300 2,960 11% RMB 20,760 18,600 12%
17 21 Budapest Hungary Europe 3,330 3,530 -6% EUR 2,640 2,760 -4%
18 15 Dalian China Asia Pacific 3,340 3,010 11% RMB 21,000 18,960 11%
19 17 Kolkata India Asia Pacific 3,490 3,150 11% INR 184,320 165,600 11%
20 20 Vilnius Lithuania Europe 3,510 3,460 1% EUR 2,760 2,640 5%
21 19 Tallinn Estonia Europe 3,660 3,430 7% EUR 2,880 2,640 9%
22 24 Monterrey Mexico Central & South America 3,720 3,840 -3% USD 3,720 3,840 -3%
23 23 Johannesburg South Africa Middle East & Africa 3,810 3,720 2% ZAR 31,680 30,120 5%
24 18 Jakarta Indonesia Asia Pacific 3,840 3,360 14% IDR 36,786,360 30,487,680 21%
25 30 Dallas United States North America 3,940 4,390 -10% USD 3,940 4,400 -10%
26 25 Guadalajara Mexico Central & South America 3,950 3,840 3% USD 3,960 3,840 3%
27 26 Bucharest Romania Europe 3,980 3,940 1% EUR 3,120 3,000 4%
28 28 Riga Latvia Europe 4,220 4,260 -1% EUR 3,240 3,240 0%
29 27 Kuala Lumpur Malaysia Asia Pacific 4,290 4,150 3% MYR 13,080 13,080 0%
30 33 Hangzhou China Asia Pacific 4,350 4,520 -4% RMB 27,360 28,440 -4%
31 31 Al Khobar Saudi Arabia Middle East & Africa 4,400 4,390 0% SAR 16,500 16,500 0%
32 34 Antwerp Belgium Europe 4,470 4,570 -2% EUR 3,470 3,540 -2%
33 35 Ho Chi Minh City Vietnam Asia Pacific 4,540 4,660 -3% USD 4,560 4,680 -3%
34 29 Mexico City Mexico Central & South America 4,610 4,320 7% USD 4,680 4,320 8%
35 39 Hanoi Vietnam Asia Pacific 4,640 4,830 -4% USD 4,680 4,800 -3%
36 36 Barcelona Spain Europe 4,640 4,680 -1% EUR 3,610 3,610 0%
37 32 Marseille France Europe 4,680 4,470 5% EUR 3,640 3,450 6%
38 44 Denver United States North America 4,730 5,250 -10% USD 4,720 5,250 -10%
39 38 Bahrain Bahrain Middle East & Africa 4,780 4,780 0% BHD 1,800 1,800 0%
40 40 Jeddah Saudi Arabia Middle East & Africa 4,840 4,840 0% SAR 18,150 18,150 0%
41 46 Minneapolis United States North America 5,010 5,610 -11% USD 5,000 5,610 -11%
42 47 Seattle United States North America 5,140 5,650 -9% USD 5,134 5,644 -9%
43 50 Atlanta United States North America 5,190 5,830 -11% USD 5,190 5,820 -11%
44 51 Phoenix United States North America 5,210 5,870 -11% USD 5,208 5,875 -11%
45 48 Houston United States North America 5,240 5,780 -9% USD 5,230 5,780 -10%
46 45 Lyon France Europe 5,270 5,300 -1% EUR 4,100 4,100 0%
47 42 Newcastle United Kingdom Europe 5,340 5,140 4% GBP 3,300 3,300 0%
48 49 Shenzhen China Asia Pacific 5,440 5,780 -6% RMB 34,200 36,360 -6%
49 37 Shenyang China Asia Pacific 5,480 4,720 16% RMB 34,440 29,640 16%
50 41 Wellington New Zealand Asia Pacific 5,550 5,100 9% NZD 6,690 6,560 2%
*Note that las t year's ranking for some locations may have changed due to data revis ions
**Figures have been rounded to the nearest 10
YOY
change
Total occupancy cost per
workstation pa**
(USD)
Total occupancy cost per workstation pa**
(Locally quoted)YOY change
Rank
2012
Rank
2011*RegionMarket Country/Territory

Global Occupancy Costs - Offices
www.dtz.com Occupier Perspective 17
Appendix 2
Table 3
Top 50 ranking of markets: total occupancy costs per 1,000 sq m (NIA) per annum (USD)
Source: DTZ Research, CMI Group, Herzog Imobiliaria Ltda, REIS
Ranking 2012 Market Country/Territory RegionLease conversion
rate
Typical building in
prime market
Equivalent to 1,000
sq m (NIA) space
requirement
Total Occupancy
Cost (USD per sq m
per annum)
Total Occupancy Cost
(USD per annum) per
1,000 sq m (NIA)
1 Surabaya Indonesia Asia Pacific 1.10 Mid/High Rise 1,100 133.08 146,389
2 Kuala Lumpur Malaysia Asia Pacific 1.00 Mid/High Rise 1,000 263.72 263,716
3 Bangkok Thailand Asia Pacific 1.06 Mid/High Rise 1,060 252.85 268,021
4 Vilnius Lithuania Europe 1.06 Average 1,060 270.11 286,320
5 Tallinn Estonia Europe 1.06 Average 1,060 281.28 298,160
6 Riga Latvia Europe 1.06 Average 1,060 281.28 298,160
7 Dallas United States North America 1.28 Average 1,281 239.51 306,771
8 Manila Philippines Asia Pacific 1.00 Mid/High Rise 1,000 311.08 311,077
9 Wuhan China Asia Pacific 1.43 Mid/High Rise 1,430 219.04 313,229
10 Hyderabad India Asia Pacific 1.61 Mid/High Rise 1,610 195.22 314,306
11 Jakarta Indonesia Asia Pacific 1.10 Mid/High Rise 1,100 286.71 315,382
12 Antwerp Belgium Europe 1.28 Low Rise 1,279 248.23 317,535
13 Al Khobar Saudi Arabia Middle East & Africa 1.10 Mid/High Rise 1,100 293.56 322,917
14 Dalian China Asia Pacific 1.47 Mid/High Rise 1,470 222.60 327,223
15 Chongqing China Asia Pacific 1.43 Mid/High Rise 1,430 230.33 329,375
16 Atlanta United States North America 1.28 Average 1,281 262.21 335,834
17 Budapest Hungary Europe 1.21 Low Rise 1,210 277.61 335,834
18 Bahrain Bahrain Middle East & Africa 1.06 Mid/High Rise 1,065 318.51 339,063
19 Phoenix United States North America 1.28 Average 1,281 268.09 343,368
20 Johannesburg South Africa Middle East & Africa 1.36 Mid/High Rise 1,360 254.06 345,521
21 Wellington New Zealand Asia Pacific 1.16 Mid/High Rise 1,160 298.79 346,598
22 Denver United States North America 1.28 Average 1,281 270.61 346,598
23 Rotterdam Netherlands Europe 1.16 Low Rise 1,161 300.38 348,750
24 Jeddah Saudi Arabia Middle East & Africa 1.10 Mid/High Rise 1,100 322.92 355,209
25 Qingdao China Asia Pacific 1.43 Mid/High Rise 1,430 248.40 355,209
26 Minneapolis United States North America 1.28 Average 1,281 282.38 361,667
27 The Hague Netherlands Europe 1.16 Low Rise 1,161 313.36 363,820
28 Nanjing China Asia Pacific 1.43 Mid/High Rise 1,430 256.68 367,049
29 Malmo Sweden Europe 1.06 Low Rise 1,061 354.05 375,660
30 Pune India Asia Pacific 1.61 Mid/High Rise 1,610 234.67 377,813
31 Xi'an China Asia Pacific 1.43 Mid/High Rise 1,430 264.20 377,813
32 Chennai India Asia Pacific 1.61 Mid/High Rise 1,610 236.67 381,042
33 Cancun Mexico Central & South America 1.12 Low Rise 1,118 347.51 388,577
34 Marseille France Europe 1.10 Low Rise 1,100 360.10 396,112
35 Houston United States North America 1.28 Average 1,281 316.83 405,799
36 Philadelphia United States North America 1.36 Mid/High Rise 1,363 298.54 406,875
37 Barcelona Spain Europe 1.25 Low Rise 1,247 331.53 413,334
38 Tianjin China Asia Pacific 1.43 Mid/High Rise 1,430 290.55 415,487
39 Bengaluru India Asia Pacific 1.61 Mid/High Rise 1,610 264.08 425,174
40 Lisbon Portugal Europe 1.22 Low Rise 1,218 354.33 431,632
41 Auckland New Zealand Asia Pacific 1.16 Mid/High Rise 1,160 375.81 435,938
42 Monterrey Mexico Central & South America 1.19 Mid/High Rise 1,190 371.76 442,396
43 Chengdu China Asia Pacific 1.43 Mid/High Rise 1,430 310.87 444,549
44 Lyon France Europe 1.10 Low Rise 1,100 405.11 445,625
45 Dubai United Arab Emirates Middle East & Africa 1.10 Mid/High Rise 1,100 410.01 451,007
46 Ho Chi Minh City Vietnam Asia Pacific 1.00 Mid/High Rise 1,000 454.24 454,237
47 San Diego United States North America 1.28 Average 1,281 354.65 454,237
48 Gothenburg Sweden Europe 1.06 Low Rise 1,061 431.15 457,466
49 Bucharest Romania Europe 1.28 Average 1,281 362.21 463,924
50 Hanoi Vietnam Asia Pacific 1.00 Mid/High Rise 1,000 463.92 463,924
Box 1: Occupancy costs per 1,000 sq m per annum DTZ’s Global Occupancy Costs: Offices report tracks occupancy costs per workstation. For the second consecutive year, we have also analysed the cost of taking the equivalent of 1,000 sq m NIA across the markets. This approach cuts through variability of space utilisation standards, taking into account the fact that more people can occupy a building than there are workstations and businesses go through cycles of under- and over- occupancy. Except for some countries using BOMA (Building Owners and Managers Association) as a generally accepted market practice, every country has a different approach to and definition of “lease area”. Whilst a handful of countries have an official measuring code, the majority rely on accepted local market practice, whilst in some emerging markets the definition of a “leasable square metre” may vary depending on the landlord. This means that €200 per sq m in Paris does not compare to €200 per sq m in Delhi. When leases are based on the UK definition of Net Internal Area (NIA), the tenant pays for net usable space only. Where lease area is based on gross space, floor plate inefficiency is passed onto the tenant, who not only pays for usable floor area, but also for common areas, lifts, structural columns, exterior walls etc. Thus increasing total occupancy costs per sq m.

Global Occupancy Costs - Offices
www.dtz.com Occupier Perspective 18
Appendix 3 Table 4
Forecast total occupancy costs per workstation per annum and change in affordability rank, 2012 and 2014 (USD)
Country/Territory Market 2012 (USD pa)
Rank 2012
2014 (USD pa)
Rank 2014
Change in rank
Average annual growth end
2012-14
Country/Territory Market 2012 (USD pa)
Rank 2012
2014 (USD pa)
Rank 2014
Change in rank
Average annual growth end
2012-14
Australia Brisbane 10,900 73 11,570 76 ▼ 3.0% Malaysia Kuala Lumpur 4,290 19 4,180 17 ▲ -1.3%
Australia Delhi 9,810 69 11,200 72 ▼ 6.8% Netherlands Amsterdam 11,030 75 11,080 70 ▲ 0.2%
Australia Melbourne 8,990 64 9,400 64 - 2.3% Netherlands The Hague 6,110 41 6,400 41 - 2.3%
Australia Perth 13,580 81 15,420 83 ▼ 6.6% Norway Oslo 15,200 86 16,110 87 ▼ 2.9%
Australia Sydney 13,440 80 14,450 80 - 3.7% Poland Warsaw 5,970 39 5,940 38 ▲ -0.3%
Belgium Antwerp 4,470 21 4,570 20 ▲ 1.1% Romania Bucharest 3,980 17 4,000 15 ▲ 0.3%
Belgium Brussels 8,040 57 8,100 56 ▲ 0.4% Russia Moscow 14,650 85 15,860 86 ▼ 4.0%
China Beijing 10,410 72 12,750 78 ▼ 10.7% Singapore Singapore 11,350 78 11,190 71 ▲ -0.7%
China Chengdu 3,300 9 3,520 10 ▼ 3.3% South Korea Seoul 9,150 65 9,500 65 - 1.9%
China Dalian 3,340 11 3,500 9 ▲ 2.4% Spain Barcelona 4,640 22 4,530 19 ▲ -1.2%
China Guangzhou 5,980 40 6,180 40 - 1.7% Spain Madrid 5,780 37 5,660 33 ▲ -1.0%
China Hangzhou 4,350 20 4,690 21 ▼ 3.8% Sweden Gothenburg 8,190 58 8,290 58 - 0.6%
China Nanjing 2,700 5 2,850 3 ▲ 2.7% Sweden Malmo 7,080 51 7,080 46 ▲ 0.0%
China Qingdao 2,560 2 2,710 2 - 2.9% Sweden Stockholm 14,040 82 14,900 81 ▲ 3.0%
China Shanghai 10,130 70 11,270 73 ▼ 5.5% Switzerland Geneva 17,560 90 17,820 89 ▲ 0.7%
China Shenyang 5,480 33 5,770 35 ▼ 2.6% Switzerland Zurich 16,420 88 16,460 88 - 0.1%
China Shenzhen 5,440 32 5,430 31 ▲ -0.1% Taiwan Taipei 8,010 56 8,330 59 ▼ 2.0%
China Tianjin 2,910 7 2,990 6 ▲ 1.4% Thailand Bangkok 2,780 6 2,860 4 ▲ 1.4%
Czech Republic Prague 5,940 38 6,010 39 ▼ 0.6% Turkey Istanbul 9,360 67 9,940 68 ▼ 3.1%
Denmark Copenhagen 7,070 50 7,240 51 ▼ 1.2% Ukraine Kyiv (Kiev) 6,910 47 6,780 45 ▲ -0.9%
Estonia Tallinn 3,660 14 3,820 13 ▲ 2.2% United Kingdom Birmingham 6,920 48 7,180 50 ▼ 1.9%
Finland Helsinki 11,110 76 11,490 75 ▲ 1.7% United Kingdom Bristol 6,960 49 7,140 48 ▲ 1.3%
France Lyon 5,270 30 5,380 29 ▲ 1.0% United Kingdom Cardiff 5,730 36 5,880 37 ▼ 1.3%
France Marseille 4,680 23 4,870 23 - 2.0% United Kingdom Edinburgh 7,830 55 8,200 57 ▼ 2.3%
France Paris 15,320 87 15,530 84 ▲ 0.7% United Kingdom Glasgow 7,480 53 7,660 53 - 1.2%
Germany Berlin 8,410 60 8,860 60 - 2.6% United Kingdom Leeds 6,780 45 7,080 46 ▼ 2.2%
Germany Dusseldorf 8,880 63 9,080 61 ▲ 1.1% United Kingdom London City 14,620 84 15,680 85 ▼ 3.6%
Germany Frankfurt 12,600 79 13,300 79 - 2.7% United Kingdom London West End
23,500 92 25,370 91 ▲ 3.9%
Germany Hamburg 8,770 61 9,120 62 ▼ 2.0% United Kingdom Manchester 7,740 54 8,090 55 ▼ 2.2%
Germany Munich 10,920 74 11,350 74 - 1.9% United Kingdom Newcastle 5,340 31 5,590 32 ▼ 2.3%
Hong Kong SAR Hong Kong 22,190 91 25,830 92 ▼ 7.9% United States Atlanta 5,190 27 5,370 28 ▼ 1.7%
Hungary Budapest 3,330 10 3,380 8 ▲ 0.7% United States Boston 9,280 66 9,680 66 - 2.1%
India Bengaluru 3,180 8 3,560 12 ▼ 5.8% United States Chicago 6,310 44 6,560 44 - 2.0%
India Chennai 2,620 4 2,930 5 ▼ 5.8% United States Dallas 3,940 16 4,050 16 - 1.4%
India Hyderabad 2,280 1 2,580 1 - 6.4% United States Denver 4,730 24 4,960 24 - 2.4%
India Kolkata 3,490 12 3,820 13 ▼ 4.6% United States Houston 5,240 29 5,390 30 ▼ 1.4%
India Mumbai 8,870 62 9,300 63 ▼ 2.4% United States Los Angeles 5,620 35 5,860 36 ▼ 2.1%
India Pune 2,620 3 3,060 7 ▼ 8.1% United States Miami 6,250 42 6,430 43 ▼ 1.4%
Indonesia Jakarta 3,840 15 4,810 22 ▼ 11.9% United States Minneapolis 5,010 25 5,230 25 - 2.2%
Ireland Dublin 7,270 52 7,360 52 - 0.6% United States New York 14,050 83 15,100 82 ▲ 3.7%
Italy Milan 9,800 68 9,840 67 ▲ 0.2% United States Philadelphia 5,550 34 5,660 33 ▲ 1.0%
Italy Rome 8,290 59 7,940 54 ▲ -2.1% United States Phoenix 5,210 28 5,300 26 ▲ 0.9%
Japan Tokyo 17,280 89 20,280 90 ▼ 8.3% United States San Diego 6,290 43 6,400 41 ▲ 0.9%
Latvia Riga 4,220 18 4,370 18 - 1.8% United States San Francisco 6,810 46 7,150 49 ▼ 2.5%
Lithuania Vilnius 3,510 13 3,550 11 ▲ 0.6% United States Seattle 5,140 26 5,350 27 ▼ 2.0%
Luxembourg Luxembourg 10,310 71 10,810 69 ▲ 2.4% United States Washington DC
11,240 77 11,600 77 - 1.6%
Source: DTZ Research, REIS NB: Our forecasts do not cover all 126 markets. Figures have been rounded to the nearest 10

Global Occupancy Costs - Offices
www.dtz.com Occupier Perspective 19
Definitions
Total occupancy cost Total occupancy cost is defined as the average total cost of leasing prime net usable space. It includes rents and outgoings, such as maintenance costs and property tax, if these are normally payable by the occupier. It excludes leasing incentives, such as rent-free periods and fitting-out costs, as well as facilities costs specific to the tenant, such as cleaning or IT. It also excludes amortization of capital and related expenditure.
Space utilisation standard per workstation Space utilisation standard per workstation is defined as the net internal area divided by the number of planned workstations for which the space is intended. It relates to the type of occupier that typically occupies prime Grade A office space for which this survey is intended. It gives a comparison of the amount of space required in different business districts, based on a given number of workstations. Space utilisation standard does not change significantly from year to year as it is closely correlated to long-established working cultures/styles, building design and nature of the office markets. Nevertheless, it does evolve over time, reflecting changing work styles and technology.
Total occupancy cost per workstation Total occupancy cost on a per workstation basis provides a better comparison of costs around business districts, as it reflects the way organisations occupy and use space in different parts of the world.
Prime space Buildings newly developed or comprehensively refurbished (involving structural alteration, and/or the substantial replacement of the main services and finishes), not previously occupied, including sublet space not previously occupied.
Prime rent The highest rent that could be achieved for a typical building/unit of the highest quality and specification in the best location to a tenant with a good (i.e. secure) covenant.
(NB. This is a net rent, excluding service charge or tax, and is based on a standard lease, excluding exceptional deals for that particular market.
Gross lettable area (GLA) GLA is the total of all covered areas occupied by the tenant. There is no standard global definition of “lease area”; whilst a handful of countries have an official measuring code, the majority rely on accepted local market practice, whilst in some emerging markets the definition of a “leasable square metre” may vary depending on the landlord. This means that €200 per sq m in Paris does not compare to €200 per sq m in Delhi. For cross-border comparison, this report uses conversion rates based on the RICS Net Internal Area (NIA) definition.
Net internal area (NIA) NIA refers to space functional to the occupier. It includes internal circulation space and meeting rooms. The area occupied by partitions within the premises is considered part of the net usable area as partitions are often an occupier’s option. It excludes areas occupied by structural columns and common areas such as stairwells, lifts, lobbies, external walls, vertical ducts and common passages that are not used exclusively by the occupier.

Global Occupancy Costs - Offices
www.dtz.com Occupier Perspective 20
Other DTZ Research Reports
Other research reports can be downloaded from www.dtz.com/research. These include: Occupier Perspective Updates on occupational markets from an occupier perspective, with commentary, analysis, charts and data. Global Occupancy Costs Offices 2012 Obligations of Occupation Americas 2012 Obligations of Occupation Asia Pacific 2012 Obligations of Occupation EMEA 2012 Office Occupier Review Asia Pacific H1 2012 Office Occupier Review Europe H1 2012 The European Insurance Sector - June 2012 The TMT Sector - October 2012
Property Times Regular updates on occupational markets from a landlord perspective, with commentary, charts, data and forecasts. Coverage includes Asia Pacific, Bangkok, Beijing, Berlin, Brisbane, Bristol, Brussels, Budapest, Central London, Chengdu, Chongqing, Dalian, Edinburgh, Europe, Frankfurt, Glasgow, Guangzhou, Hangzhou, Ho Chi Minh City, Hong Kong, India, Jakarta, Japan, Kuala Lumpur, Luxembourg, Madrid, Manchester, Melbourne, Milan, Nanjing, Newcastle, Paris, Poland, Prague, Qingdao, Rome, Seoul, Shanghai, Shenyang, Shenzhen, Singapore, Stockholm, Sydney, Taipei, Tianjin, Ukraine, Warsaw, Wuhan, Xian.
Investment Market Update Regular updates on investment market activity, with commentary, significant deals, charts, data and forecasts. Coverage includes Asia Pacific, Australia, Belgium, Czech Republic, Europe, France, Germany, Italy, Japan, Mainland China, South East Asia, Spain, Sweden, UK.
Money into Property For more than 35 years, this has been DTZ's flagship research report, analysing invested stock and capital flows into real estate markets across the world. It measures the development and structure of the global investment market. Available for Global, Asia Pacific, Europe and UK.
Foresight Quarterly commentary, analysis and insight into our in-house data forecasts, including the DTZ Fair Value Index™. Available for Global, Asia Pacific, Europe and UK. In addition we publish an annual outlook report.
Insight Thematic, ad hoc, topical and thought leading reports on areas and issues of specific interest and relevance to real estate markets. India Special Economic Zones-December 2012 Singapore Executive Condominiums -December 2012 European Retail Guide- Shopping Centres-December 2012 UK Secondary market pricing-December 2012 Singapore office demand-November 2012 Ecommerce & Logistics -November 2012 Net Debt Funding Gap-November 2012 German Open Ended Funds-October 2012 London office to residential conversions-October 2012 Great Wall of Money-October 2012
DTZ Research Data Services
For more detailed data and information, the following are available for subscription. Please contact [email protected] for more information.
Property Market Indicators Time series of commercial and industrial market data in Asia Pacific and Europe.
Real Estate Forecasts, including the DTZ Fair Value IndexTM Five-year rolling forecasts of commercial and industrial markets in Asia Pacific, Europe and the US.
Investment Transaction Database Aggregated overview of investment activity in Asia Pacific and Europe.
Money into Property DTZ’s flagship research product for over 35 years providing capital markets data covering capital flows, size, structure, ownership, developments and trends, and findings of annual investor and lender intention surveys.

www.dtz.com Occupier Perspective 21
DTZ Research
DTZ Research Contacts Global Head of Research Hans Vrensen Phone: +44 (0)20 3296 2159 Email: [email protected] Head of Global Forecasting Matthew Hall Phone: +44 (0)20 3296 3011 Email: [email protected] Head of Strategy Research Nigel Almond Phone: +44 (0)20 3296 2328 Email: [email protected] Head of UK Research Ben Burston Phone: +44 (0)20 3296 2296 Email: [email protected]
DTZ Business Contacts Global Corporate Services Nick Westley Phone: +1 213 426 3059 Email: [email protected] Global Corporate Services, EMEA James Maddock Phone: +44 (0)20 3296 3353 Email: [email protected] Global Corporate Services, APAC Adam Catchpole Phone: +852 2507 0729 Email: [email protected]
Head of CEMEA Research Magali Marton Phone: + 33 1 49 64 49 54 Email: [email protected] Head of Greater China Research David Ji Phone: +852 2507 0507 Email: [email protected] Head of APAC Forecasting Kate Barrow Phone: +852 2250 8864 Email: [email protected] Head of Americas Research John Wickes Phone: +1 312 424 8087 Email: [email protected] Global Corporate Services, US Rob Cookson Phone: +1 (650) 353 3055 Email: [email protected] Global Corporate Services, UK Richard Golding Phone: +44 (0)20 3296 3347 Email: [email protected]
DISCLAIMER
This report should not be relied upon as a basis for entering into transactions without seeking specific, qualified, professional advice. Whilst facts have been rigorously checked, DTZ can take no responsibility for any damage or loss suffered as a result of any inadvertent inaccuracy within this report. Information contained herein should not, in whole or part, be published, reproduced or referred to without prior approval. Any such reproduction should be credited to DTZ.
© DTZ January 2013


![EMEA Corporate Occupier Conditions – Autumn 2015 [Infographic]](https://img.pdfslide.us/doc/110x75/58743d391a28ab0e6c8b5df9/emea-corporate-occupier-conditions-autumn-2015-infographic.jpg)