Embed Size (px)
Citation preview

ADMINISTRATIVE REPORT
Report Date: May 22, 2018 Contact: Grace Cheng Contact No.: 604.871.6654 RTS No.: 12407 VanRIMS No.: 08-2000-20 Meeting Date: June 5, 2018 TO: Vancouver City Council
FROM: Director of Finance
SUBJECT: Draft 2019-2022 Capital Plan
RECOMMENDATION
A. THAT Council receive the draft 2019-2022 Capital Plan (Appendix A) for information, and direct the Director of Finance to seek public input as outlined in the Public Engagement section of this report.
B. THAT Council approve in principle a borrowing limit totalling $495 million
supported by property tax and utility fees in the draft 2019-2022 Capital Plan:
• Plebiscite-approved General Borrowing Authority - $300 million; • Council-approved Borrowing Authority for Sewer and Neighborhood
Energy Utilities - $195 million;
FURTHER THAT the above borrowing limit guides the next phase of capital planning work and be subject to approval by Council as part of the final 2019-2022 Capital Plan in July 2018.
C. THAT the Director of Finance report back with the final 2019-2022 Capital Plan,
incorporating results of the public engagement and plebiscite borrowing questions, for Council’s consideration in July 2018.
REPORT SUMMARY The purpose of this report is two-fold:
• Seek Council approval in principle of the proposed borrowing limit to guide further work on the 2019-2022 Capital Plan, and

Draft 2019-2022 Capital Plan – RTS 12407 2
• Seek Council authority to proceed with public engagement on the draft Capital Plan, and report back with the final Capital Plan and associated plebiscite questions in July 2018.
The City owns approximately $25 billion of infrastructure and amenities (excluding land), encompassing underground water and sewer infrastructure; roadways, walkways and bikeways; affordable housing; community facilities, parks and open spaces; public safety facilities and service yards. As Vancouver continues to grow, we need to make strategic, long-term infrastructure investments to enhance the sustainability and resilience of our city. The draft 2019-2022 Capital Plan (Appendix A) contemplates $2.6 billion of capital investment priorities over the next four years to achieve the following strategic objectives:
• Maintain the City’s critical infrastructure and amenities in an appropriate state of repair; • Optimize the City’s network of infrastructure and amenities to support growth and
economic development; and • Advance Council, Board and community priorities in a financially sustainable and
resilient manner. Guided by key Council, Board and community priorities, our proposed capital investments will focus in the following areas:
• Renew critical aging water and sewer infrastructure • Renew and upgrade aging community and civic facilities to strengthen business
continuity and resilience • Renew and expand transportation infrastructure to move people and goods • Preserve and create affordable housing and childcare to attract and retain our workforce
and grow our economy • Preserve and create affordable and sustainable arts and cultural spaces through
partnerships to enhance social and economic vitality
In addition to the above, resources have been dedicated to commence research, policy and strategy work in partnership with regional and senior governments to address emerging priorities such as climate change adaptation, shoreline flood protection, seismic and resilience. This work is a long term strategy and will inform future Capital Plans. In developing the draft 2019-2022 Capital Plan, a key consideration is to address our growing portfolio of aging infrastructure and amenities in a financially sustainable and resilient manner. To support this multi-decade infrastructure renewal strategy, a gradual increase in funding allocation from the annual budget will be required for the next decade. Staff will continue to assess the outcome of the strategy and recommend any adjustment as necessary for Council consideration. The infrastructure challenge is not unique to Vancouver. As cities across Canada continue to understand more about the needs and costs associated with infrastructure renewal, many have developed long-term asset management strategies with dedicated funding for infrastructure renewal. A number of municipalities, including Toronto, Mississauga, Winnipeg, Saskatoon, North Vancouver and New Westminster all have implemented an infrastructure levy, or some form of dedicated revenue, to address the growing deficit.

Draft 2019-2022 Capital Plan – RTS 12407 3
Subject to Council approval, staff will seek public input on the draft 2019-2022 Capital Plan and bring forward the final Capital Plan in July for Council consideration, as well as the plebiscite borrowing questions to be put to the electorate in the October civic election. COUNCIL AUTHORITY/PREVIOUS DECISIONS The funding strategy for the City’s critical infrastructure and amenities is guided by a number of long-standing Council policies and/or practices. The following section summarizes the key funding/financing sources for the draft 2019-2022 Capital Plan. Debenture Borrowing – Under the Vancouver Charter, Section 242 gives Council the authority to borrow funds for the construction, installation, maintenance, replacement, repair and regulation of waterworks, sewerage & drainage, and energy utility systems without the assent of the electorate. Section 245 requires that the borrowing authority for all other purposes be established through the electorate’s approval of a borrowing plebiscite.
The requirement to borrow funds to finance capital investments is established by Council at the time of the approval of the annual capital budget. Borrowed funds are generally paid back over 10 years to ensure that a systematic borrowing program can be administered, that outstanding debt does not accumulate to unacceptable levels, and that annual debt servicing charges (principal and interest) are maintained at a level that does not put undue pressure on the operating budget. Section 247 A of the Vancouver Charter requires that full provision of annual debt servicing charges (principal and interest) be made in the annual operating budget. This ensures that debenture holders are paid the interest component at the prescribed rate and time and that sufficient funding is available to retire the obligation at maturity. Pay-as-you-go – As part of the City’s long-term financial strategy, the Capital Plan incorporates a pay-as-you-go component funded from current property taxes and fees to maintain a balance between borrowed and current funding, to manage the City’s long-term debt profile, and to limit future debt repayment obligations. Internal Financing – Internal financing of capital expenditures through the Capital Financing Fund (CFF) is appropriate in situations where the capital investment can be justified on the basis of a business case, providing a source for repayment without impacting property taxes. Developer Contributions – In 2004, Council adopted the Financing Growth Policy that sets the framework for the collection and allocation of development cost levies (DCLs) and community amenity contributions (CACs) to help deliver infrastructure and amenities to support growth. Pursuant to the Vancouver Charter and applicable DCL By-laws, DCLs may be applied towards parks, housing, engineering infrastructure, and childcare. For capital planning purposes, the proposed DCL allocation for the 2019-2022 Capital Plan is estimated to not exceed 100% of the DCL available at the beginning of the Capital Plan and what may reasonably be expected to collect in future years. The City is currently developing a substantial City-wide Utility DCL program to begin to address the tremendous growth pressures on the utilities across the city (e.g. Cambie Corridor). This new utility DCL will be reported to Council prior to the final Capital Plan. Once implemented, any additional utilities work and associated funding will be incorporated in the Capital Plan.

Draft 2019-2022 Capital Plan – RTS 12407 4
CACs are provided by property owners when Council grants development rights through rezoning. CACs typically come in two forms: in-kind onsite amenities and cash contributions. CACs may be applied to a wide range of amenities including those that are not DCL eligible such as new or expanded recreation, cultural and social facilities, libraries, and firehalls. External Partnership Funding – The City actively pursues innovative partnership and funding opportunities with senior levels of government, private and community partners to optimize the value for every tax dollar in advancing Council, Board and community priorities. CITY MANAGER'S/GENERAL MANAGER'S COMMENTS The City Manager RECOMMENDS approval of A, B and C. REPORT Background/Context The City owns approximately $25 billion of infrastructure and amenities (replacement value excluding land), encompassing underground water and sewer infrastructure; roadways, walkways and bikeways; affordable housing; community facilities, parks and open spaces; public safety facilities and service yards. Having a network of well-maintained infrastructure and amenities is essential to our quality of life and help drive economy, increase prosperity and create jobs. As Vancouver continues to grow, we need to make strategic, long-term infrastructure investments to enhance the sustainability and resilience of our city. Over the past decade, City services have grown significantly in importance and scale. The City has assumed a leading role within the region in a number of key areas, such as economic development, innovation, livability, resilience and climate change adaptation. The City has also become increasingly active in addressing needs that fall within the jurisdiction and traditional mandate of the provincial government. In this regard, significant investments have been made in public safety and emergency response, affordable housing, social services, mental health and addictions, childcare, and other core services that serve both the City and the Metro Vancouver region. Strategic Analysis The City strives to balance the need for maintaining our existing assets in an appropriate state of repair, and expanding our network of infrastructure and amenities to support growth. The growing need for affordable housing and childcare represents significant capital investments, while the costs of asset renewal are growing as our infrastructure and amenities age. As the owner of an expansive portfolio of capital assets, the City continues to evolve and enhance our asset condition assessments to inform our long-term asset planning and management strategies. The goal is to ensure that critical infrastructure such as bridges, roads, water and sewer pipes are maintained in a state of good repair; and that public amenities are well maintained to deliver the necessary services to residents and businesses.
Draft 2019-2022 Capital Plan – RTS 12407 5
I. DRAFT 2019-2022 CAPITAL PLAN As part of the City Building Framework, the key strategic objectives of the draft 2019-2022 Capital Plan are:
• Address the growing need for renewing and maintaining the City’s critical infrastructure and amenities in an appropriate state of repair.
• Optimize the City’s network of infrastructure and amenities to support economic development and growth.
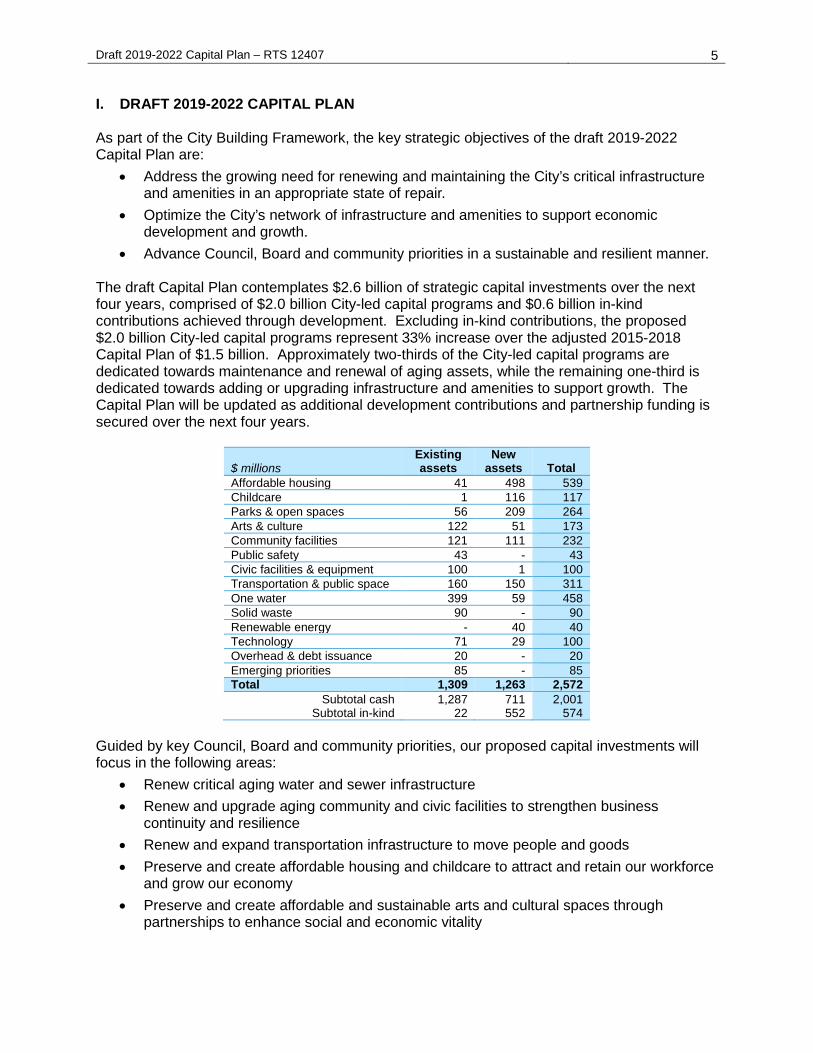
• Advance Council, Board and community priorities in a sustainable and resilient manner. The draft Capital Plan contemplates $2.6 billion of strategic capital investments over the next four years, comprised of $2.0 billion City-led capital programs and $0.6 billion in-kind contributions achieved through development. Excluding in-kind contributions, the proposed $2.0 billion City-led capital programs represent 33% increase over the adjusted 2015-2018 Capital Plan of $1.5 billion. Approximately two-thirds of the City-led capital programs are dedicated towards maintenance and renewal of aging assets, while the remaining one-third is dedicated towards adding or upgrading infrastructure and amenities to support growth. The Capital Plan will be updated as additional development contributions and partnership funding is secured over the next four years.
$ millions Existing assets
New assets Total
Affordable housing 41 498 539 Childcare 1 116 117 Parks & open spaces 56 209 264 Arts & culture 122 51 173 Community facilities 121 111 232 Public safety 43 - 43 Civic facilities & equipment 100 1 100 Transportation & public space 160 150 311 One water 399 59 458 Solid waste 90 - 90 Renewable energy - 40 40 Technology 71 29 100 Overhead & debt issuance 20 - 20 Emerging priorities 85 - 85 Total 1,309 1,263 2,572
Subtotal cash 1,287 711 2,001 Subtotal in-kind 22 552 574
Guided by key Council, Board and community priorities, our proposed capital investments will focus in the following areas:
• Renew critical aging water and sewer infrastructure • Renew and upgrade aging community and civic facilities to strengthen business
continuity and resilience • Renew and expand transportation infrastructure to move people and goods • Preserve and create affordable housing and childcare to attract and retain our workforce
and grow our economy • Preserve and create affordable and sustainable arts and cultural spaces through
partnerships to enhance social and economic vitality

Draft 2019-2022 Capital Plan – RTS 12407 6
As well, the City will continue to proactively prepare for the threats posed by climate change and major events (e.g. seismic). Flooding and severe storms witnessed in recent years in Canada and other parts of the world demonstrates the importance to be prepared to respond to such events as they happen and to quickly resume business across the city. Storm intensities have already increased in Vancouver. Learning from these events, both locally and nationally, helps inform our infrastructure investments and our focus on preparedness. Resources have been dedicated to commence research, policy and strategy work in partnership with regional and senior governments to address emerging priorities such as climate change adaptation, shoreline flood protection, seismic and resilience. This work will inform future Capital Plans. Significant funding has also been committed by the Federal and Provincial Governments to advance the Millennium Line Broadway Extension to realize the economic potential of the second largest employment centre in British Columbia and to enable efficient movement of people and access to jobs. Taken together, the above strategic investments will enable Council to achieve important public policy objectives while ensuring economic, environmental and social sustainability over the long term. Emerging needs (e.g. climate change adaptation, shoreline flood protection, seismic), evolving municipal mandate (e.g. housing, childcare), and the growing need for critical infrastructure renewal require strategic, long-term inter-government partnership and predictable long-term funding arrangement. Partnerships are particularly central to the City’s ability to deliver affordable housing and childcare:
• Affordable Housing - In recent months, both Federal and Provincial governments have introduced funding programs for creating and sustaining affordable housing. In November 2017, the Federal Government announced the National Housing Strategy, which includes a number of funding programs to support creation of new housing and preservation of existing housing. In February 2018, the Provincial Government announced “A 30-Point Plan for Housing Affordability in British Columbia”, which includes a number of new tax measures to dampen speculative demand and generate new revenues to fund affordable housing.
Having a sustainable inter-governmental partnership and funding arrangement with senior governments would substantially enable new affordable housing supply as well as the much needed building repairs for all co-op and non-market housing on City land. In the absence of senior government support, the City alone will not be able to sustain and grow the affordable housing portfolio over the long term.
• Childcare – Both Federal and Provincial governments have announced strategies to
enable new supply and enhance affordable childcare with varying degree of details. The City with its limited revenue sources will not be able to address these broad issues alone in a meaningful way without support from senior governments. Staff will continue to pursue a coordinated, sustainable intergovernmental partnership and funding arrangement to address affordable housing, childcare, critical infrastructure renewal, and emerging needs.
Draft 2019-2022 Capital Plan – RTS 12407 7
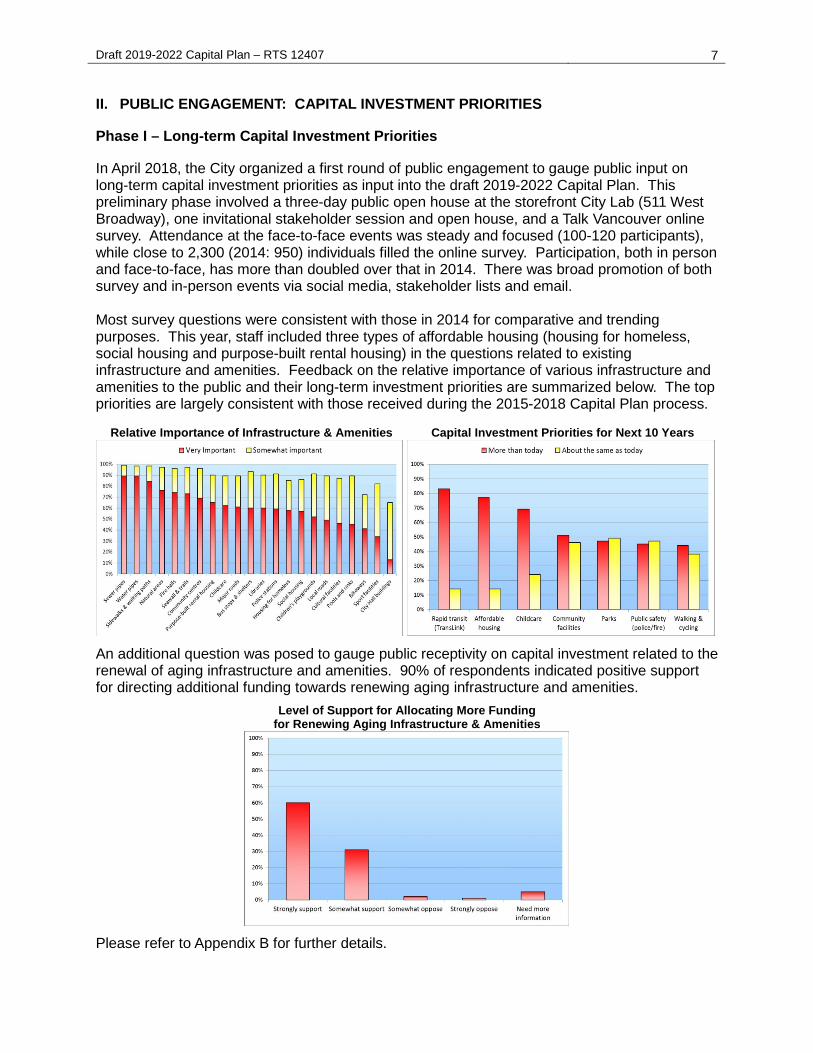
II. PUBLIC ENGAGEMENT: CAPITAL INVESTMENT PRIORITIES Phase I – Long-term Capital Investment Priorities In April 2018, the City organized a first round of public engagement to gauge public input on long-term capital investment priorities as input into the draft 2019-2022 Capital Plan. This preliminary phase involved a three-day public open house at the storefront City Lab (511 West Broadway), one invitational stakeholder session and open house, and a Talk Vancouver online survey. Attendance at the face-to-face events was steady and focused (100-120 participants), while close to 2,300 (2014: 950) individuals filled the online survey. Participation, both in person and face-to-face, has more than doubled over that in 2014. There was broad promotion of both survey and in-person events via social media, stakeholder lists and email. Most survey questions were consistent with those in 2014 for comparative and trending purposes. This year, staff included three types of affordable housing (housing for homeless, social housing and purpose-built rental housing) in the questions related to existing infrastructure and amenities. Feedback on the relative importance of various infrastructure and amenities to the public and their long-term investment priorities are summarized below. The top priorities are largely consistent with those received during the 2015-2018 Capital Plan process. Relative Importance of Infrastructure & Amenities Capital Investment Priorities for Next 10 Years
An additional question was posed to gauge public receptivity on capital investment related to the renewal of aging infrastructure and amenities. 90% of respondents indicated positive support for directing additional funding towards renewing aging infrastructure and amenities.
Level of Support for Allocating More Funding for Renewing Aging Infrastructure & Amenities
Please refer to Appendix B for further details.
Draft 2019-2022 Capital Plan – RTS 12407 8
Phase II – Draft 2019-2022 Capital Plan A second phase of public engagement will be organized in June to seek public input on the draft 2019-2022 Capital Plan. Reference will be made to the structure and input received from the first round of public engagement, so that participants will understand that Phase II is an iterative step to Phase I discussions on capital investment priorities. Phase II engagement will seek public, business and stakeholder response to the draft Capital Plan. This consultation will include more opportunities to comment via open houses at Vancouver Public Library, six to eight focused meetings with stakeholder groups ranging from BIAs and other governmental agencies, to residents associations and other organizations representing stakeholders who may experience barriers to participation due to economic, linguistic or mobility issues. Phase II engagement will also deploy quantitative and qualitative research with a third party opinion research firm that will probe responses to the draft Capital Plan among representative resident and business audiences. Staff continues to explore improvements to the engagement process. We doubled the number of touchpoints in Phase I engagement from the last Capital Plan, and will continue to improve the breadth and depth of our dialogues with the community. To communicate the consultation opportunity, all those who participated in Phase I (who have provided contact information to staff) will be actively invited. The City will also leverage our social media channels and Talk Vancouver membership in order to drive traffic online. Ads will also be posted in local papers and on the City’s website. Results of Phase II engagement will be presented to Council in July alongside the final Capital Plan. Implications/Related Issues/Risk
Financial Within the City’s financial planning framework, understanding the long-term implications arising from our capital investments is a key consideration in developing the draft 2019-2022 Capital Plan. Identifying the financial and debt capacity upfront ensures that the Capital Plan is developed in a fiscally prudent manner which considers the City’s long-term financial health, credit ratings, and future impacts on our tax and fee payers. The draft 2019-2022 Capital Plan contemplates $2.6 billion of strategic capital investments over the next four years, comprised of $2.0 billion City-led capital programs and $0.6 billion in-kind contributions achieved through development. Excluding in-kind contributions, approximately two-thirds of City-led capital programs are dedicated towards maintenance and renewal of aging assets, while the remaining one-third is dedicated towards adding or upgrading infrastructure and amenities to support growth. The 2019-2022 Capital Plan will be updated as additional development contributions and partnership funding is secured over the next four years.

Draft 2019-2022 Capital Plan – RTS 12407 9
The following table summarizes the proposed capital investments by program areas and funding sources (i.e. City taxes/fees, development contributions, partner contributions).
Existing New Devt. $ millions assets assets Total City Cont'n Partner Affordable housing 41 498 539 3 535 - Childcare 1 116 117 2 110 5 Parks & open spaces 56 209 264 31 234 - Arts & culture 122 51 173 28 131 14 Community facilities 121 111 232 72 147 13 Public safety 43 - 43 42 1 - Civic facilities & equipment 100 1 100 100 - - Transportation & public space 160 150 311 101 141 68 One water (note #1) 399 59 458 322 136 - Solid waste 90 - 90 81 - 9 Renewable energy - 40 40 36 4 - Technology 71 29 100 100 - - Overhead & debt issuance 20 - 20 20 - - Emerging priorities 85 - 85 85 Total 1,309 1,263 2,572 1,024 1,440 108
Subtotal cash 1,287 711 1,998 1,024 866 108 Subtotal in-kind 22 552 574 - 574 -
Note #1: Growth-triggered upgrades not delivered through DCLs are generally secured through conditions of development. At this time, the DCL allocation for water, sewer and drainage infrastructure only partially funds the utility upgrades to support growth (40%). The City is currently developing a City-wide Utility DCL program, and will be incorporated in the Capital Plan once implemented.
One-time Implications The funding strategy for the draft Capital Plan is developed based on historical experience, economic outlook, benchmark ratios with like organizations and rating agencies, and best practices in municipal debt management. Considering the City’s debt capacity as well as property tax and fee impact, staff recommends the following funding strategy:
Debt financing (25%) Plebiscite authority $ 300 million Council authority (Sewer, NEU) $ 195 million $ 495 million
Pay-as-you-go (21%) Property tax $ 206 million Utility fees $ 202 million $ 408 million
Capital reserve (54%)
Fleet, Solid waste & misc. special purpose $ 121 million Development contributions $ 866 million Senior government & other partner contributions $ 108 million $ 1,095 million
City-led capital programs (100%) $ 1,998 million In-kind development contributions $ 574 million Total draft 2019-2022 Capital Plan investments $ 2,572 million

Draft 2019-2022 Capital Plan – RTS 12407 10
Debt Management Strategy – Staff recommend that only 25% of City-led programs in the Capital Plan be financed through debenture borrowing, which is lower than 35% in the 2015-2018 Capital Plan. This strategy builds on the program that commenced in 2012 when the Water Utility started transitioning its infrastructure renewal program from debt financing to pay-as-you-go to save interest costs over the long term. That program is now complete. In 2015, the Sewer Utility began a similar transition, and will continue over the future Capital Plans. The following charts show the two key financial health metrics and trends. Through our proactive debt management strategy over the last decade, including transitioning the City’s water utilities from debt financing to pay-as-you-go, we have created room in our debt capacity to ramp up the asset renewal program. The projected growth in net debt per capita reflects a thoughtful, gradual increase in capital investments in renewing and upgrading our aging infrastructure and amenities. The trajectory could reverse should future Councils choose to transition more capital work from debt financing to pay-as-you-go sooner. Lowering debt financing would achieve long-term interest savings, but result in higher property tax and fee impacts during transition years. Staff will continue to monitor and adjust our financial strategy to strike a balance between debt financing and pay-as-you-go. Debt Servicing as % of Operating Revenue Net Debt per Capita
Infrastructure Renewal Strategy – To address the growing need for maintaining the City’s critical infrastructure and amenities in a state of good repair as contemplated in the draft Capital Plan, a gradual increase in funding allocation from the operating budget is required (on average approximately 1% of property tax levy and 5% utility fees for each of the next four years); the final funding allocation to be subject to the annual budget process in each year of the plan. Staff will continue to assess the outcome of the strategy and recommend any adjustment as necessary for Council consideration. Senior Government Partnership Strategy – Emerging priorities (e.g. climate change adaptation, shoreline flood protection, seismic), evolving municipal mandate (e.g. housing, childcare), and the growing need for critical infrastructure renewal require strategic, long-term inter-government partnership and predictable long-term funding arrangements. The City with its limited revenue sources will not be able to address these broad issues alone in a meaningful way without support from senior governments. Staff, in consultation with other Metro Vancouver municipalities, Union of BC Municipalities, and Federation of Canadian Municipalities, is actively engaging senior levels of government to pursue such opportunities, and will report back to Council as appropriate.

Draft 2019-2022 Capital Plan – RTS 12407 11
Value for Money – Confronted with a growing asset base, ever-increasing public expectation, and rapid escalation in land, construction and other costs, staff will undertake further work to rationalize the scope and level of service as well as service delivery models to manage future renewal and growth costs. On-going Implications – Capital investments, especially for new/upgraded infrastructure and public amenities, often involve ongoing programming, facility operation and asset lifecycle costs, which will put further pressure on the City’s budgets in future years, and will be brought forward as part of the annual budget process. Affordable housing has been one of the fastest growing public amenities in Vancouver, and the trend is expected to continue as part of the Housing Vancouver Strategy. It has been Council policy that all affordable housing projects be self-sustaining and require no further operating subsidies from the City. The affordability level would be established to ensure that rental income would be adequate to sustain the project over the life of the project. All long-term financial implications arising from the 2019-2022 Capital Plan will be considered as part of long-term financial planning process.
CONCLUSION The draft 2019-2022 Capital Plan contemplates $2.6 billion of strategic capital investments over the next four years to 1) invest in our critical infrastructure and amenities to work towards a state of good repair; 2) optimize our network of infrastructure and amenities to best serve our residents and businesses; and 3) advance Council, Board and community priorities within the City’s long-term financial capacity. The plan also lays out a long-term infrastructure renewal strategy and funding approach to address the growing need for maintaining and renewing our critical infrastructure and amenities to ensure the sustainability and resilience of our city. Subject to Council approval, staff will circulate the draft Capital Plan for public input and present Council with the recommended final Capital Plan, including plebiscite borrowing questions, in July 2018.
* * * * *

PAGE 1 OF 1
DRAFT 2019-2022 CAPITAL PLAN
FOR REVIEW AND DISCUSSION
May 2018
Appendix A
DRAFT 2019-2022 CAPITAL PLAN
PAGE 1 OF 1
TABLE OF CONTENTS
EXECUTIVE SUMMARY............................................................................................................ 1
LONG-TERM PRIORITIES: PEOPLE, PROSPERITY & ENVIRONMENT ................................ 3
CITY BUILDING GOALS ............................................................................................................ 5
STRATEGIC CAPITAL PLANNING ............................................................................................ 7
FISCAL CAPACITY – FOCUS ON THE LONG-TERM ............................................................... 8
STRATEGIC CAPITAL PLANNING GUIDING PRINCIPLES .....................................................12
OVERVIEW OF CITY INFRASTRUCTURE & AMENITIES .......................................................13
AFFORDABLE HOUSING.........................................................................................................15
CHILDCARE .............................................................................................................................21
PARKS AND OPEN SPACES ....................................................................................................25
ARTS & CULTURE AND COMMUNITY FACILITIES .................................................................31
PUBLIC SAFETY AND CIVIC FACILITIES & EQUIPMENT .......................................................40
TRANSPORTATION AND PUBLIC SPACE ...............................................................................44
ONE WATER ............................................................................................................................53
SOLID WASTE .........................................................................................................................61
RENEWABLE ENERGY FOR BUILDINGS ...............................................................................64
TECHNOLOGY .........................................................................................................................68
RESILIENCE: CLIMATE CHANGE ADAPTATION & FLOOD PROTECTION ............................70

DRAFT 2019-2022 CAPITAL PLAN
PAGE 1 OF 71
EXECUTIVE SUMMARY
The City owns approximately $25 billion of infrastructure and amenities (replacement value excluding land), encompassing underground water and sewer infrastructure; roadways, walkways and bikeways; affordable housing; community facilities, parks and open spaces; public safety facilities and service yards. Having a network of well-maintained infrastructure and amenities is essential to our quality of life and help drive economy, increase prosperity and create jobs. As Vancouver continues to grow, we need to make strategic, long-term infrastructure investments to enhance the sustainability and resilience of our city. Over the past decade, City services have grown significantly in importance and scale. The City has assumed a leading role within the region in economic development, innovation, livability, resilience and climate change adaptation. The City has also become increasingly active in addressing needs that fall within the jurisdiction and traditional mandate of the provincial government. In this regard, significant investments have been made in public safety and emergency response, affordable housing, social services, mental health and addictions, childcare, and other core services that serve both the City and the Metro Vancouver region. As part of the City Building Framework, the key strategic objectives of the draft 2019-2022 Capital Plan are:
• Address the growing need for renewing and maintaining the City’s critical infrastructure and amenities in an appropriate state of repair.
• Optimize the City’s network of infrastructure and amenities to support economic development and growth.
• Advance Council, Board (Park, Library & Police) and community priorities in a sustainable and resilient manner.
The draft 2019-2022 Capital Plan contemplates $2.6 billion of strategic capital investments over the next four years, comprised of $2.0 billion City-led capital programs and $0.6 billion in-kind contributions achieved through development. Excluding in-kind contributions, approximately two-thirds of City-led capital programs are dedicated towards maintenance and renewal of aging assets, while the remaining one-third is dedicated towards adding or upgrading infrastructure and amenities to support growth. The Capital Plan will be updated as additional development contributions and partnership funding is secured over the next four years.
$ millions Existing assets
New assets Total
Affordable housing 41 498 539 Childcare 1 116 117 Parks & open spaces 56 209 264 Arts & culture 122 51 173 Community facilities 121 111 232 Public safety 43 - 43 Civic facilities & equipment 100 1 100 Transportation & Public Space 160 150 311 One water 399 59 458 Solid waste 90 - 90 Renewable energy - 40 40 Technology 71 29 100 Overhead & debt issuance 20 - 20 Emerging priorities 85 - 85 Total 1,309 1,263 2,572
Subtotal City-led programs 1,287 711 1,998 Subtotal in-kind contributions 22 552 574

DRAFT 2019-2022 CAPITAL PLAN
PAGE 2 OF 71
Guided by key Council, Board and community priorities, our proposed capital investments will focus in the following areas:
• Renew critical aging water and sewer infrastructure • Renew and upgrade aging community and civic facilities to strengthen business
continuity and resilience • Renew and expand transportation infrastructure to move people and goods • Preserve and create affordable housing and childcare to attract and retain our workforce
and grow our economy • Preserve and create affordable and sustainable arts and cultural spaces through
partnerships to enhance social and economic vitality As well, the City will continue to proactively prepare for the threats posed by climate change and major events (e.g. seismic). Flooding and severe storms witnessed in recent years in Canada and other parts of the world demonstrate the importance to be prepared to respond to such events as they happen and to quickly resume business across the city. Storm intensities have already increased in Vancouver. Learning from these events, both locally and nationally, helps inform our infrastructure investments and our focus on preparedness. Resources have been dedicated to commence research, policy and strategy work in partnership with regional and senior governments to address emerging needs such as climate change adaptation, shoreline flood protection, seismic and resilience. This work will inform future Capital Plans. Significant funding has also been committed by the Federal and Provincial Governments to advance the Millennium Line Broadway Extension to realize the economic potential of the second largest employment centre in British Columbia and to enable efficient movement of people and access to jobs. Taken together, the above strategic investments will enable Council to achieve important public policy objectives while ensuring economic, environmental and social sustainability over the long term. In developing the draft Capital Plan, a key consideration is to address our growing portfolio of aging infrastructure and amenities in a financially sustainable and resilient manner. The infrastructure challenge is not unique to Vancouver. As cities across Canada continue to understand more about the needs and costs associated with infrastructure renewal, many have developed long-term asset management strategies with dedicated funding for infrastructure renewal. A number of municipalities, including Toronto, Mississauga, Winnipeg, Saskatoon, North Vancouver and New Westminster all have implemented an infrastructure levy, or some form of dedicated revenue, to address the growing deficit. For Vancouver, a gradual increase in funding allocation from the annual budget will be required for the next decade to support the multi-decade infrastructure renewal strategy as contemplated in the draft Capital Plan. The outcome of the strategy will be assessed and adjusted as necessary over time. Emerging needs (e.g. climate change adaptation, shoreline flood protection, seismic), evolving municipal mandate (e.g. housing, childcare), and the growing need for critical infrastructure renewal require strategic, long-term inter-government partnership and predictable long-term funding arrangements. The City with its limited revenue sources will not be able to address these broad issues alone in a meaningful way without support from senior governments. The City, in consultation with other Metro Vancouver municipalities, Union of BC Municipalities, and Federation of Canadian Municipalities, is actively engaging senior levels of government to pursue such opportunities to augment our capital program in a financially sustainable way.
DRAFT 2019-2022 CAPITAL PLAN
PAGE 3 OF 71
LONG-TERM PRIORITIES: PEOPLE, PROSPERITY & ENVIRONMENT
The City’s mission is “to create a great city of communities that cares about its people, its environment, and the opportunities to live, work, and prosper”. To accomplish this, our long-term capital investments are prioritized to support Vancouver’s three long-term priorities: People, Prosperity & Environment.
People Goal: Cultivate and sustain vibrant, creative, safe and caring communities for the wide diversity of individuals and families who live in, work in and visit Vancouver.
Vancouver is the eighth largest city in Canada. Our city is remarkable for its diverse population, with half of our residents speaking English as a second language. The health and vitality of Vancouver’s communities and the celebration of their diversity make the city a magnet for people from around the world. With 5,250 people per square kilometer, Vancouver is one of the most densely populated cities in the country. Our limited land base and growing population have given rise to unique issues related to affordability and the availability of land for housing and a full range of economic activity.
Prosperity Goal: Provide and enhance the services, infrastructure and conditions that sustain a healthy, diverse and resilient local economy.
Vancouver has one of the most diverse and resilient economies in North America. Building on the foundation of our robust natural resource sector, our growing digital media and clean technology sectors as well as our strong tourism and international education sectors also contribute to the City’s continued economic growth, prosperity, and livability. Vancouver is North America’s gateway to Asia and a major regional transportation hub. The city is home to Port Metro Vancouver—the busiest and largest port in Canada—and is in close proximity to the Vancouver International Airport, often rated as one of the world’s best. Our well-educated, highly skilled, and culturally diverse workforce further reinforces our competitive position in the global market. Council has prioritized economic development by promoting and strengthening local businesses while also making the city an attractive destination for businesses from around the world. In 2011, Vancouver Economic Commission (VEC) launched the Vancouver Economic Action Strategy, which focuses on changes that will most improve Vancouver’s business climate, support existing local businesses, facilitate new investment, and attract the people essential to our future economic success. It places particular emphasis on our global leadership in creative industries and clean technology and on opportunities for greening our local businesses.
DRAFT 2019-2022 CAPITAL PLAN
PAGE 4 OF 71
Significant funding has been committed by the Federal and Provincial Governments to advance the Regional Transportation Strategy, including the Millennium Line Broadway Extension, which will be fundamental to reaching the economic potential of the second-most important economic corridor in the Province. A Broadway subway will ensure the efficient movement of people and the ability to accommodate access to jobs.
Environment Goal: Protect and enhance Vancouver’s climate, ecology, natural resources and connections to the city’s remarkable natural setting for future generations.
Vancouver is home to world-class parks and green spaces and the wealth that stems from our abundant natural setting. The Greenest City 2020 Action Plan was launched in 2011 with measurable and ambitious targets for reducing carbon and waste and improving ecosystems. This key plan addresses goals and issues across diverse areas and has put Vancouver on the path to sustainability in most aspects of life and work in the city.

DRAFT 2019-2022 CAPITAL PLAN
PAGE 5 OF 71
CITY BUILDING GOALS
In developing the City’s long-term planning framework, the following key goals have been identified which help inform the development of the draft Capital Plan. Reconciliation – Embrace reconciliation and value the government-to-government relationship with Musqueam, Squamish and Tsleil-Waututh Indigenous Nations in shaping how the city will evolve. Align City policies and actions to support urban Indigenous people in achieving their full potential and ensure opportunity to share in prosperity. Resilience – Be ready to respond to sudden ‘shock’ events and emerging system ‘stressors’. Address climate change and sea-level rise through long-term infrastructure and land-use planning strategies. Implement energy efficient policies to enable a carbon-neutral city so that energy costs for residents are stable and affordable. Enable low-carbon transportation infrastructure and networks to provide safe, accessible and quality mobility options for all residents. Ensure residents have food security and access to diverse and sustainable food options. Integrate sustainability into all aspects of the city. Equity, Diversity & Inclusion – Develop and implement strategies, plans and policies, on topics such as housing, childcare, employment lands, and the green economy, to ensure residents of all ages, backgrounds, and incomes can live, work, and stay in the city over the long term without compromising quality of life. Develop social and cultural strategies that enable all residents to engage and connect in their daily lives. Embrace civic policies that foster a sense of belonging for all residents and universal participation in city life. Healthy City – Ensure residents of all ages, backgrounds and incomes have equitable access to recreation, public services, the natural environment, and social networks to support their optimal health and well-being. Enable residents to live healthy lifestyles and partake in civic life and activity through City plans, strategies and polices work. Sustainable – Integrate livability, health, prosperity and resilience with a fundamental carbon-neutral mandate. Be a global leader in advancing climate action through all aspects of civic activity and services, and continue to support green economy innovation while ensuring environmental protection and social equity. Complete Communities – Embrace and support the unique character of Vancouver’s communities through Community Plans. Ensure adequate and appropriate improvements to transportation, housing choice, access to facilities, parks, childcare and recreation to support growth. Commit to a diligent, thoughtful collaborative planning process to honor the spirit of each community. Economic Vitality – Enable a high-performing economy as a regional center of entrepreneurship fueled by the digital, technical, medical and education fields. Ensure the depth and breadth in economic sectors, and green jobs continue to drive growth. Integrate Vancouver regionally, advance the circular economy, and contribute to global prosperity while advancing local equity. Vibrant Society & Culture – Encourage all residents to access and participate in society and culture. Permeate the city with arts, culture, and social experience. Create opportunities for people to engage in creative social expression in a diversity of ways.
DRAFT 2019-2022 CAPITAL PLAN
PAGE 6 OF 71
City Built for People – Make Vancouver a place where people love to be. Ensure thoughtfully designed public places, beautiful and energy efficient buildings, access to multimodal transportation, people-oriented built form, equitable access to parks, views, and the natural environment. 20 Adaptable & Smart – Integrate technological advances to improve efficiencies in citizen participation, and optimize all civic facilities, services and functions while improving resident dignity and quality of life. Leverage technology to be an equitable, connected, resilient and adaptable city. Regional Leadership & Integration – Develop strategies to advance Vancouver’s position as a major city in the Cascadia Region, while maintaining strong collaborative partnerships with municipalities, institutions and industries in the Lower Mainland and across the Province. Align regional integration with the responsibility of contributing to regional prosperity and advancing equity. Fiscal Sustainability – Provide exceptional service to Vancouver residents and businesses in a fiscally prudent and financially sustainable manner through careful financial planning and data-driven decision making framework. Ensure fiscal decisions are transparent, consistent, and effective. Maximize service provision partnership opportunities.
DRAFT 2019-2022 CAPITAL PLAN
PAGE 7 OF 71
STRATEGIC CAPITAL PLANNING 10-year outlook 4-year plan Annual budget In times of rapid growth driven by market and demographic forces, we need a strategic planning framework to guide the intentional transformation of the city over the next 30 years. The City’s long-term planning framework articulates the following principles:
• Establish a long-term horizon, and nest short and mid-term plans within that • Be comprehensive, considering all aspects of community needs and municipal services • Be transformative, not simply incremental improvement or “business as usual” • Be willing to challenge status quo • Connect actions to long term vision and overarching strategies • Optimize the use of municipal toolkit and select the best approach (or mix) for
implementation: regulation, investment, advocacy/partnership • Set the right time horizon for the policy, program or investment • Consider alternative service delivery models • Be clear about life cycle cost of capital investment • Establish performance measures and ongoing monitoring and evaluation
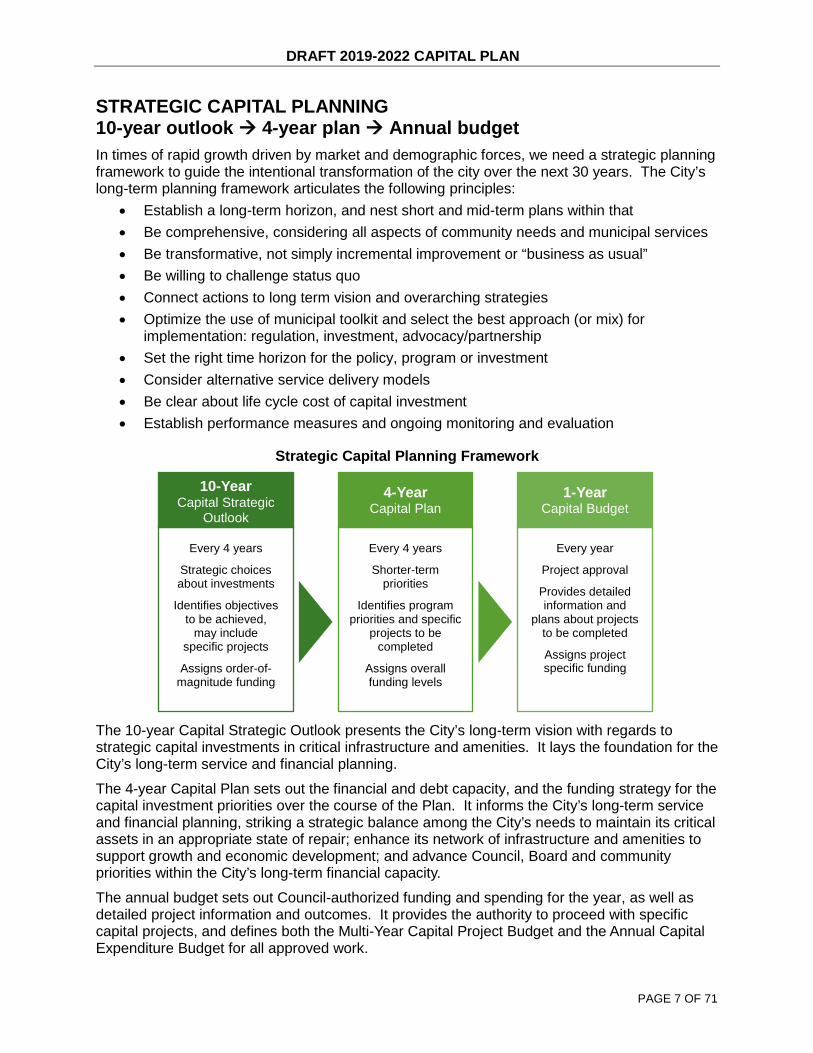
Strategic Capital Planning Framework
The 10-year Capital Strategic Outlook presents the City’s long-term vision with regards to strategic capital investments in critical infrastructure and amenities. It lays the foundation for the City’s long-term service and financial planning.
The 4-year Capital Plan sets out the financial and debt capacity, and the funding strategy for the capital investment priorities over the course of the Plan. It informs the City’s long-term service and financial planning, striking a strategic balance among the City’s needs to maintain its critical assets in an appropriate state of repair; enhance its network of infrastructure and amenities to support growth and economic development; and advance Council, Board and community priorities within the City’s long-term financial capacity.
The annual budget sets out Council-authorized funding and spending for the year, as well as detailed project information and outcomes. It provides the authority to proceed with specific capital projects, and defines both the Multi-Year Capital Project Budget and the Annual Capital Expenditure Budget for all approved work.
Every 4 years
Strategic choices about investments
Identifies objectives to be achieved,
may include specific projects
Assigns order-of-magnitude funding
10-Year Capital Strategic
Outlook
Every 4 years
Shorter-term priorities
Identifies program priorities and specific
projects to be completed
Assigns overall funding levels
4-Year Capital Plan
Every year
Project approval
Provides detailed information and
plans about projects to be completed
Assigns project specific funding
1-Year Capital Budget

DRAFT 2019-2022 CAPITAL PLAN
PAGE 8 OF 71
FISCAL CAPACITY – FOCUS ON THE LONG-TERM
Vancouver, like other Canadian cities, offers a broad range of services but has a limited revenue stream. The City adheres to prudent fiscal stewardship with careful financial planning that balances short-term operating needs with long-term public amenity and infrastructure requirements. To ensure that appropriate capital investments are made to advance Council and community priorities in a fiscally prudent and financially sustainable manner while considering external economic conditions that could have an impact on residents and businesses, the City’s capital planning process is guided by a set of financial sustainability guiding principles and financial health targets. I. Financial Sustainability Guiding Principles
Fiscal Prudence • Live within our means • Consider long-term implications in all decisions • Maintain a stable and predictable revenue stream • Keep debt at a manageable level • Build in flexibility and contingencies for emerging priorities and opportunities
Affordability & Cost Effectiveness • Deliver services that are relevant and result in desired public outcomes • Ensure value for money through productivity and innovation • Keep property tax and user fees affordable and competitive
Asset Management • Maintain assets in an appropriate state of repair • Optimize capital investments to meet public and economic needs while achieving
value for the investment II. Funding Strategy for Capital Investments The City takes a comprehensive approach to assessing the short and long-term economic indicators to inform the development of the Capital Plan. The City funds capital investments from a range of sources (who pays) using a balanced mix of payment methods (when to pay). Funding Sources (Who Pays)
• Property Tax & User Fees - Operating revenues (e.g. property tax, water & sewer fees, parking revenue) typically fund most capital work
• Development Contributions - Consistent with the City’s Financing Growth Policy (2004), new and expanded amenities and infrastructure to support growth are funded in part through development contributions (e.g. DCLs, voluntary CACs, connection charges)
CACs are voluntary public benefit contributions offered by a rezoning applicant to address the impacts of rezoning. Acceptance of CACs by the City is generally guided by Community Plans and Public Benefit Strategies, and applicable Council policies in the areas such as housing, childcare, cultural and heritage. CACs typically come in two forms: in-kind onsite amenity and cash contributions.
DRAFT 2019-2022 CAPITAL PLAN
PAGE 9 OF 71
• Partner Contributions - The City receives funding from provincial and federal governments, from TransLink for road work, and from non-profit agencies, foundations and philanthropists particularly in the area of childcare and affordable housing.
Payment Methods (When to Pay)
• Pay In Advance: Capital Reserves - Capital reserves are like savings accounts, used to accumulate funds from current revenues or other sources over time to fund future capital investments. This method is typically used when other partners are involved and the City wishes to make clear its own commitment is protected. In other cases, the commitment is made as part of a community planning process and funded through development fees, while the timing of the project may not occur for a significant period of time.
• Pay-as-you-go - Pay-as-you-go funds capital investments using current revenues, user fees and other sources. It is used for some of the City’s utility renewal – such as water infrastructure - that all taxpayers benefit from. This method enables residents and businesses to contribute on an ongoing basis to capital investments which are fundamental to the health of the City; and ensures the City’s borrowing capacity is preserved for important, one-off capital investments that are not appropriate or are too costly to be funded on a pay-as-you-go basis.
• Pay Over Time: Debt Financing - Like most major Canadian cities and senior levels of government, the City uses debt in its mix of payment methods to fund capital investments, allowing payment to be made over a longer timeframe to align with the useful life of the underlying capital assets and ensure that more residents and businesses that benefit from the capital investments participate in paying for them. When used strategically, paid back within 10 years (much shorter than a typical mortgage and the average life cycle of a capital asset), and within best practices for responsible borrowing, debt financing allows the City to continue to renew its infrastructure on a regular basis and provide new amenities when necessary to accommodate growth while maintaining its fiscal health.
The City takes a very careful approach to its use of debt, funding repayment over 10 years while ensuring a balanced operating budget and keeping property tax and fees at an affordable level. The City’s consistently strong credit ratings and favorable borrowing rates reflect this careful approach. III. Long-term Financial Plan When developing its long-term financial plan, the City maintains a commitment to strong financial discipline and continued management of debt to ensure that capital investments will not unduly burden the Operating Budget through debt servicing, operating costs and asset lifecycle costs. Both Moody’s and Standard & Poor’s credit rating agencies have acknowledged the City’s efforts by awarding it with the highest credit rating.
• Keep Debt at a Manageable Level – The City determines its long-term borrowing capacity for regular, non-utility related capital programs by limiting the ratio of annual debt servicing to operating expenditures at a maximum of 10%. This is to ensure that the City does not accumulate debt at unacceptable levels, and that annual debt servicing does not put undue pressure on the annual budget.

DRAFT 2019-2022 CAPITAL PLAN
PAGE 10 OF 71
As part of our long-term debt management strategy, the water utility has transitioned its infrastructure lifecycle replacement programs from debt financing to pay-as-you-go. This will help lower the City’s overall debt and save interest costs over the long-term. Looking ahead, we will continue to explore opportunities, where appropriate, to transition our general capital program and the sewer utility to a higher proportion of pay-as-you-go to improve the City’s long-term debt profile and enhance our credit ratings.
• Maintain Strong Credit Ratings and Access to Low Borrowing Costs – The City’s strong credit ratings (AAA) are among the best for Canadian cities, and are supported by a diverse economy and a strong and stable tax base. Continued management of debt within target levels is critical to maintaining and enhancing the City’s credit ratings. Most world class cities are managed in a fiscally prudent and financially sustainable manner and enjoy high credit ratings. Maintaining current credit ratings among the top tier cities is critical to Vancouver’s long-term competitive advantage. It is estimated that the long-term borrowing costs would increase by 5-10 basis points for each level of downgrade, or approximately $1 million in additional interest over the term of each $100 million debenture issue.
• Keep Property Tax and Fees Affordable & Competitive – Property taxes in recent years have seen a modest increase – ranging from 1.4% to 4.3% – in line with most other Metro Vancouver municipalities. During this period, the City has enhanced our network of public amenities in the areas of housing, community services and public safety, and has invested in core infrastructure, such as sewer separation and renewal and upgrading transportation infrastructure for pedestrians, bikes, and vehicles. All these were accomplished through continuous innovation, business transformation and productivity enhancement, while absorbing above-inflation wage increases.
Looking ahead, the growing need for asset renewal and new infrastructure and amenities to support growth will put further pressure on the City’s budget. Understanding the long-term impacts on our tax and fee payers arising from our capital investment decisions, including debt servicing, ongoing operating costs and asset lifecycle costs, is a key consideration in developing the 2019-2022 Capital Plan.
• Maintain Assets in an Appropriate State of Repair – Maintaining core infrastructure and amenities in an appropriate state of repair is critical to the City’s long-term financial health and resilience, and helps ensure asset management obligations are not deferred and infrastructure deficits do not accumulate to unacceptable levels – one of the key factors that credit rating agencies consider as part of the rating reviews.
• Optimize Capital Investments – Before adding new facilities, the City will consider repurposing and right-sizing existing facilities, and continue to advance on colocation and functional integration of services to enhance operational efficiency. All new facilities will be designed with flexible, adaptable and expandable spaces to accommodate changing demographics and future growth.
IV. Financial Health Indicators For long-term financial planning purposes, the City tracks a number of metrics to provide an indication of its financial health and long-term borrowing capacity, which inform the capital planning process. Below are two key financial health metrics and trends over the next decade: Debt Servicing as a % of Operating Expenditures and Net Debt per Capita.

DRAFT 2019-2022 CAPITAL PLAN
PAGE 11 OF 71
Debt Servicing as % of Operating Revenue Net Debt per Capita
In developing the draft Capital Plan, a key constraining factor is the impact on the operating budget and property tax increase arising from debt servicing and pay-as-you-go funding to support the capital program, as well as future operating costs and asset lifecycle costs. Our goal is to stabilize the debt level over the long term and minimize the year-over-year budget impact driven by our capital program, thereby maintaining our property tax and user fees at affordable and competitive levels. Through our proactive debt management strategy over the last decade, including transitioning the City’s water utilities from debt financing to pay-as-you-go, we have created room in our debt capacity to ramp up the asset renewal program. The projected growth in net debt per capita reflects a thoughtful, gradual increase in capital investments in renewing and upgrading our infrastructure and amenities. The trajectory could reverse should future Councils choose to transition more capital work from debt financing to pay-as-you-go sooner. Lowering debt financing would achieve long-term interest savings, but result in higher property tax and fee impacts during transition years. The City will continue to monitor and adjust our financial strategy to strike a balance between debt financing and pay-as-you-go.

DRAFT 2019-2022 CAPITAL PLAN
PAGE 12 OF 71
STRATEGIC CAPITAL PLANNING GUIDING PRINCIPLES
The following principles guide strategic capital planning across service categories: Vision
• Inspire a vibrant, inclusive and safe city with a resilient local economy • Advance public policy goals and strategic priorities of City Council and Boards (Park,
Library & Police) • Align with the City’s corporate strategic plan and long-term financial plan • Integrate environmental, operational and financial sustainability principles • Be adaptive to emerging priorities and changing demographics
Innovation
• Partner strategically with senior levels of government, charitable & non-profit organizations, and private sector
• Optimize service delivery through business transformation, co-location and functional integration
• Maximize value for investments through creative design and planning, and strategic procurement and resourcing
• Be opportunistic and nimble Strategic Planning
• Rationalize network of public amenities and services across agencies (City, Vancouver School Board, charitable and non-profit organizations, etc.) to enhance collaboration and synergies
• Consider repurposing, right-sizing, relocation, co-location and decommission of existing assets as part of renewal strategy
• Build flexible, adaptable and expandable spaces to accommodate changing demographics and future growth
• Phase in large-scale, high impact capital programs/projects to mitigate financial impact • Synchronize multi-project timing to maximize efficiencies and economy of scale
Financial Sustainability
• Live within our means • Consider long-term financial implications in all investment decisions • Maintain assets in appropriate state of repair
Regional and provincial governments are responsible for delivering schools, health care, and transit. Senior governments also hold mandates to deliver social housing and childcare. The City continues to encourage senior governments to uphold their responsibilities for social housing and childcare; in the meantime, the City has used its regulatory tools, strategic partnerships and capital investment to create these amenities, in recognition of their role as essential public amenities that support residents and workers in Vancouver.
DRAFT 2019-2022 CAPITAL PLAN
PAGE 13 OF 71
OVERVIEW OF CITY INFRASTRUCTURE & AMENITIES
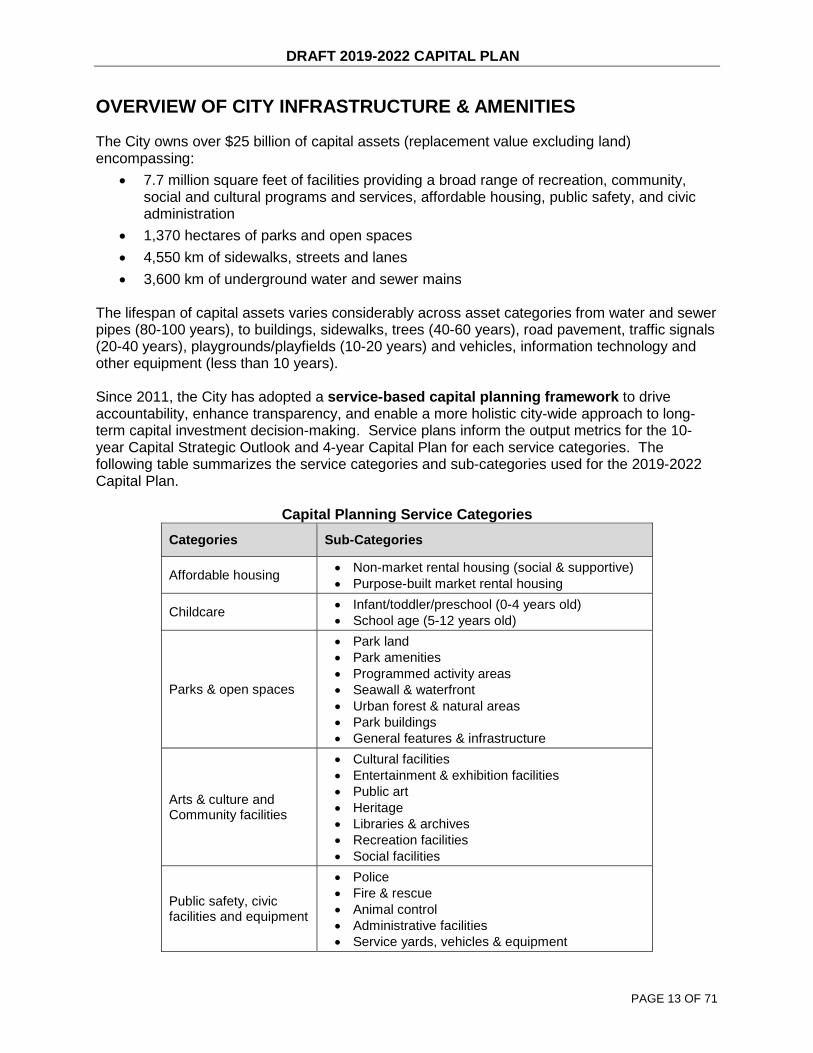
The City owns over $25 billion of capital assets (replacement value excluding land) encompassing:
• 7.7 million square feet of facilities providing a broad range of recreation, community, social and cultural programs and services, affordable housing, public safety, and civic administration
• 1,370 hectares of parks and open spaces • 4,550 km of sidewalks, streets and lanes • 3,600 km of underground water and sewer mains
The lifespan of capital assets varies considerably across asset categories from water and sewer pipes (80-100 years), to buildings, sidewalks, trees (40-60 years), road pavement, traffic signals (20-40 years), playgrounds/playfields (10-20 years) and vehicles, information technology and other equipment (less than 10 years). Since 2011, the City has adopted a service-based capital planning framework to drive accountability, enhance transparency, and enable a more holistic city-wide approach to long-term capital investment decision-making. Service plans inform the output metrics for the 10-year Capital Strategic Outlook and 4-year Capital Plan for each service categories. The following table summarizes the service categories and sub-categories used for the 2019-2022 Capital Plan.
Capital Planning Service Categories Categories Sub-Categories
Affordable housing • Non-market rental housing (social & supportive) • Purpose-built market rental housing
Childcare • Infant/toddler/preschool (0-4 years old) • School age (5-12 years old)
Parks & open spaces
• Park land • Park amenities • Programmed activity areas • Seawall & waterfront • Urban forest & natural areas • Park buildings • General features & infrastructure
Arts & culture and Community facilities
• Cultural facilities • Entertainment & exhibition facilities • Public art • Heritage • Libraries & archives • Recreation facilities • Social facilities
Public safety, civic facilities and equipment
• Police • Fire & rescue • Animal control • Administrative facilities • Service yards, vehicles & equipment

DRAFT 2019-2022 CAPITAL PLAN
PAGE 14 OF 71
Categories Sub-Categories
Transportation & public space
• Transportation network • Sustainable transportation • Public space & public realm
One water • Drinking water • Sewerage & drainage • Green infrastructure
Solid waste • Sanitation • Disposal
Renewable energy • Neighborhood energy
Technology • Hardware • Applications
Resilience • Climate change adaptation • Flood protection

DRAFT 2019-2022 CAPITAL PLAN
PAGE 15 OF 71
AFFORDABLE HOUSING
I. Overview Having an affordable and varied housing stock in Vancouver helps support the needs of a growing population and maintain the diversity, inclusivity and vibrancy of a city. As housing is becoming increasingly unaffordable in the region, more residents are facing significant and growing housing cost burden. To preserve the city’s community and economic resiliency, housing needs to be accessible, affordable, and suitable to local incomes and a variety of households including families with children, seniors, low-and moderate-income workers and those with mobility challenges. II. Inventory of Assets There are approximately 284,000 housing units in the city of Vancouver (2016 census), categorized as follow using the City’s housing continuum chart:
The following summarizes the different types of affordable housing owned by the City or located on City land:
City Assets Replacement Value
% in Good / Fair Condition Partner Assets
Shelters (year-round)
• 5 parcels of City-owned land leased to partners
- - • ~300 beds on City-owned
land • ~700 beds on non-City land
SROs (privately-owned)
• n/a - - • ~4,200 SRO rooms owned by private sector
Supportive housing & Non-market rental
• ~750 units in City buildings • ~200 parcels of City-owned
land leased to partners $190 M 65%
• ~10,200 units on City-owned land
• ~14,700 units on non-City land
Purpose-built rental • ~100 units (#1 Kingsway) $30 M 100% • ~58,000 units

DRAFT 2019-2022 CAPITAL PLAN
PAGE 16 OF 71
The following table summarizes major work completed in the last 10 years (2009-2018) with regards to asset renewal and addition/upgrades.
Renewed Assets New/Upgraded Assets
Supportive housing & Non-market rental
• Old Continental Hotel on Granville St. replaced by Kingsway Continental
• Roddan Lodge renewal & expansion (underway)
• ~2,500 additional units completed by City and partner agencies
Purpose-built rental • n/a
• ~2,500 additional units completed by the private sector
• ~100 additional units completed by the City
III. Long-term Vision Metro Vancouver’s Regional Growth Strategy (2011) provides direction to create complete communities with a range of housing choices close to employment, amenities, and transit. These directions are supported in the Regional Affordable Housing Strategy (2016), which directs the expansion of rental housing supply along the frequent transit network, recognizing the affordability benefits achieved when housing is located within easy access of high-quality public transit. Housing Vancouver Strategy (2017) highlights the need to align housing affordability to local incomes. To maintain diversity, the strategy provides updated housing targets focusing on the

DRAFT 2019-2022 CAPITAL PLAN
PAGE 17 OF 71
“right supply” by including consideration of the location, building type, tenure, and affordability of this new housing.
• Housing Diversity – Ensure that Vancouver’s housing stock can accommodate residents with a broad range of incomes and occupations, and households at all life stages to maintain a diverse population and workforce.
o Preserve and expand existing social and supportive housing for vulnerable residents.
o Require new rental projects to include a portion of larger units and enable appropriate built forms for seniors and families.
• Housing Affordability – Provide a range of affordability, from social to rental housing options, to accommodate a diversity of households, including singles, seniors, and families at a range of income levels, to live and work in neighborhoods well-served by transit, parks and other amenities.
o Existing rental housing – Older rental housing stock is generally more affordable and better meets the needs of low- to moderate-income households than new market rental housing. Prioritize retention of existing purpose-built rental housing through the Rental
Housing Stock ODP regulations, which requires replacement of existing rental units on applicable sites (e.g. CD-1 zoned sites).
Enable some redevelopment with replacement of the rental units.
o New Secured Market Rental Housing Encourage market rental housing through incentives available under the City’s
Secured Market Rental Housing Policy: Rental 100 (e.g. additional height and/or density, Development Cost Levy waivers, parking reductions).
o New Moderate Income Rental Housing – Rising rental rates are putting pressure on moderate-income households, many of which are paying more than 30% of their income on housing and are increasingly unable to afford market rental housing. Secure moderate income rental housing units as part of secured rental housing
projects, where are portion of the units are secured at rents that are affordable to households with incomes between $30,000 and $80,000 per year.
o Social Housing - Social housing is a critical source of affordable housing for low-and moderate-income households in Vancouver. Many social housing projects have rents geared to residents’ incomes, making them a truly affordable option for families, seniors, and vulnerable residents who would not otherwise be able to afford market rental units. Secure social housing on City land in partnerships involving senior government
funding, and through inclusionary zoning policies and grants to non-profit led housing developments.
o Supportive Housing – The most effective way to address homelessness is to provide sufficient homes for those on low-income and with physical, mental health and addiction challenges. Supportive Housing is recognized to be the most effective type of housing as it combines low rents with additional staffing supports and services, tailored to individual resident needs. Enable supportive housing on City and/or third party land through senior government
capital and operating investments. A recent example is the innovative provincial partnership to deliver 600 new Temporary Modular Homes with supports.

DRAFT 2019-2022 CAPITAL PLAN
PAGE 18 OF 71
Other key city-wide strategies such as the Healthy City Strategy (2014), Transportation 2040 (2012), and the Greenest City Action Plan (2011) also help guide the City’s housing strategy.
• Increase housing diversity, supply, and new affordable housing options close to transit in a pedestrian-friendly environment that is well-served by amenities.
• Locate housing options near transit to reduce the need for a car, minimize commuting times and distances, and free up overall household income.
IV. Strategy for the Next 10 Years The Housing Vancouver Strategy (2017) aims to change the future of housing in Vancouver – housing should be affordable and suitable to local incomes and a variety of households, including low- and moderate-income workers, families, seniors, while addressing the needs of our most vulnerable populations. The strategy’s three-year action plan includes over 110 actions, including priorities to advance the transformation of low-density neighborhoods, increase rental protection and affordability, provide housing for homeless residents, and develop a 10-year affordable housing delivery and financial plan to support the development of 12,000 social, supportive, and co-op homes. Providing social housing is primarily the responsibility of senior governments. In recent months, both Federal and Provincial governments have introduced funding programs for creating and sustaining affordable housing. In November 2017, the Federal Government announced the National Housing Strategy, which includes a number of funding programs to support creation of new housing and preservation of existing housing. In February 2018, the Provincial Government announced “A 30-Point Plan for Housing Affordability in British Columbia”, which includes a number of new tax measures to dampen speculative demand and generate new revenues to fund affordable housing. The City welcomes these new initiatives, since in the absence of senior government support, the City alone will not be able to sustain and grow the affordable housing portfolio over the long term. The City is actively exploring strategic partnerships with other levels of government to deliver much-needed affordable housing through various means, including funding for capital and operating costs in new affordable housing; financing to support affordable housing construction; and legislative changes to enable new municipal housing and land use initiatives. Having a sustainable partnership and funding arrangement with senior governments would substantially enable new affordable housing supply as well as the much needed building repairs for all co-op and non-market housing on City land. The City uses a variety of enabling tools to leverage affordable housing in partnership with senior governments and private and/or non-profit housing partners:
• Contributions through Development – As part of market residential and/or mixed use development, there may be opportunities to secure “turn-key” non-market housing to the City through voluntary community amenity contributions and/or inclusionary zoning polices. Non-profit housing partners can be selected to operate and maintain the housing projects at prescribed affordability over the lease term (usually 60 years).
• City Land Contributions – The City leverages long term land leases to housing partners at below market rent for 60 years or longer for the purpose of creating new affordable housing. Partners may be involved solely in operating non-market housing or may

DRAFT 2019-2022 CAPITAL PLAN
PAGE 19 OF 71
undertake the comprehensive development and long term operational responsibility, depending on the nature of the partnership with the City.
• Capital Grants – The City allocates grants to non-profit partners to enhance viability and affordability of their non-market housing projects, with additional funding available to encourage delivery of supportive housing and family-sized units.
• Development Cost Levies (DCL’s) Waivers/Exemptions – Social housing projects are exempt from DCLs. Secured market rental projects may qualify for DCL waiver if the development meets the various criteria under the applicable DCL by-law.
• Property Tax Exemptions – Supportive housing, if designated by the Province as a Class 3 property, is subject to special valuation rules that reduce the assessed value to a nominal amount and are effectively exempt from property taxes.
V. Draft 2019-2022 Capital Plan: ~$139 million (+ $400 million in-kind) The following table outlines the proposed funding envelope for various housing programs, and is subject to further refinement as part of the report back on the Housing Vancouver - Delivery and Financial Strategy in June.
Major renewal projects/programs include:
• $12 million has been earmarked for the replacement of City-operated non-market housing
• Preservation of existing non-market & co-op housing: In partnership with senior governments, $15 million has been earmarked to assist with the much needed building repairs for co-op and non-market housing on City land.
• As part of the Downtown Eastside Local Area Plan (2014), Council endorsed the creation of a capital grant program to assist with the upgrading of existing Single
Existing New$ millions Subcategory Program / Major projects assets assets Total City Devt. Partner
SROs SRO upgrade granting program ($6.0M) 6.0 - 6.0 - 6.0 -Supportive
housing Supportive housing granting program ($0.9M) 0.9 - 0.9 - 0.9 -
Replacement of City-operated residences ($12.0M)Seismic evaluation of existing facilities ($0.5M)Renovations to keep facilities functional & efficient ($1.0M)Capital maintenance program ($2.0M)
City-owned &Partner operated
New units delivered through development ($400.0M, est. 1,200-1,600 units in-kind)
- 400.0 400.0 - 400.0 -
Preservation of existing non-market & co-op housing ($15.0M)Acquisition of new land for affordable housing ($75.0M)Chinatown housing partnerships ($1.6M)Infrastructure granting program for new social housing ($20.0M)
Subtotal 32.1 495.0 527.1 3.5 523.6 -Purpose built rental & other Rental protection & relocation and other programs ($1.5M) 1.5 - 1.5 - 1.5 -
Planning & studies for non-City housing on City-owned land ($1.5M, VAHA)Planning & studies for other affordable housing ($2.0M, ACCS)
Affordable housing 40.9 498.0 538.9 3.5 535.5 -Subtotal cash 40.9 98.0 138.9 3.5 135.5 -
Subtotal in-kind - 400.0 400.0 - 400.0 -
-
Non-City housing on Non-City land
1.6 20.0
-
15.0 90.0
-21.6
Non-market rental
(Social housing& other) 75.0 90.0 -
21.6 -
15.5 3.5
Who pays
Implementation& research 0.5 3.0 3.5
-Non-City housing on City-owned land
3.5 -
City-owned &City operated 15.5 - 12.0
DRAFT 2019-2022 CAPITAL PLAN
PAGE 20 OF 71
Room Occupancy (SROs) hotels owned and/or managed by non-profit agencies. SROs play an important role among the lowest income residents in Vancouver. The program will help improve the safety, livability and health conditions of SROs. $6 million has been earmarked in the draft 2019-2022 Capital Plan to assist with SRO upgrades. The program will support emerging partnerships with senior governments and the non-profit sector, ultimately looking to replace SROs with new non-market housing units, but in the interim focusing on improving management, securing affordability, and improving livability especially the private SROs.
Major new/upgrade projects/programs include:
• 1,200 to 1,600 units secured through voluntary in-kind CACs and inclusionary zoning at an estimated value of $400 million.
• $75 million has been earmarked in the draft Capital Plan for housing site acquisition to enable senior governments and non-profit housing partners to design, build, finance, operate and maintain housing projects on City land.
• $20 million has been earmarked for capital grants to enable housing projects to be delivered through community partners.
Consistent with Council policies, affordable housing delivery will focus on the Housing Vancouver income targets. Projects are expected to be self-sustaining over the long term where rents are set at levels that will cover mortgage payments (to repay some or all of the construction costs), operating costs and capital replacement; and do not require further operating subsidies, property tax exemptions, and/or financial guarantees from the City. To fully achieve the Housing Vancouver income targets and the necessary level of affordability, the City will need partnership funding such as Provincial rent supplements, BC Housing, CMHC, and/or non-profit and partner equity contributions. The City’s Rental 100 Program as well as zoning policies relating to laneway housing and secondary suites are expected to continue to significantly increase the supply of affordable market rental units.
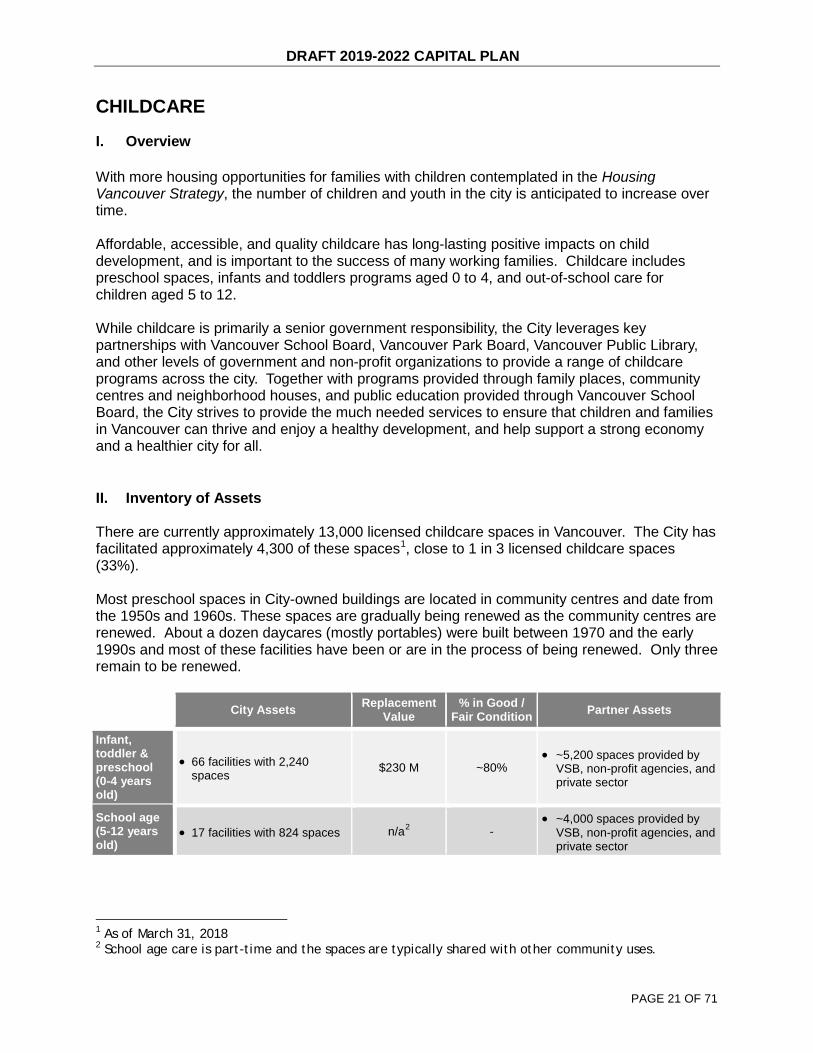
DRAFT 2019-2022 CAPITAL PLAN
PAGE 21 OF 71
CHILDCARE
I. Overview With more housing opportunities for families with children contemplated in the Housing Vancouver Strategy, the number of children and youth in the city is anticipated to increase over time. Affordable, accessible, and quality childcare has long-lasting positive impacts on child development, and is important to the success of many working families. Childcare includes preschool spaces, infants and toddlers programs aged 0 to 4, and out-of-school care for children aged 5 to 12. While childcare is primarily a senior government responsibility, the City leverages key partnerships with Vancouver School Board, Vancouver Park Board, Vancouver Public Library, and other levels of government and non-profit organizations to provide a range of childcare programs across the city. Together with programs provided through family places, community centres and neighborhood houses, and public education provided through Vancouver School Board, the City strives to provide the much needed services to ensure that children and families in Vancouver can thrive and enjoy a healthy development, and help support a strong economy and a healthier city for all. II. Inventory of Assets There are currently approximately 13,000 licensed childcare spaces in Vancouver. The City has facilitated approximately 4,300 of these spaces1, close to 1 in 3 licensed childcare spaces (33%). Most preschool spaces in City-owned buildings are located in community centres and date from the 1950s and 1960s. These spaces are gradually being renewed as the community centres are renewed. About a dozen daycares (mostly portables) were built between 1970 and the early 1990s and most of these facilities have been or are in the process of being renewed. Only three remain to be renewed.
City Assets Replacement Value
% in Good / Fair Condition Partner Assets
Infant, toddler & preschool (0-4 years old)
• 66 facilities with 2,240 spaces $230 M ~80%
• ~5,200 spaces provided by VSB, non-profit agencies, and private sector
School age (5-12 years old)
• 17 facilities with 824 spaces n/a2 - • ~4,000 spaces provided by
VSB, non-profit agencies, and private sector
1 As of March 31, 2018 2 School age care is part-time and the spaces are typically shared with other community uses.

DRAFT 2019-2022 CAPITAL PLAN
PAGE 22 OF 71
The following table summarizes major work completed in the last 10 years (2009-2018) with regards to asset renewal and addition/upgrades.
Renewed Assets New/Upgraded Assets
Infant, toddler & preschool (0-4 years old)
• 75 spaces in buildings on City land
• 2,000 licensed spaces created by the City, VSB and other providers
School age (5-12 years old)
• 105 spaces in City-owned buildings
• 1,000 licensed spaces created by the City, VSB and other providers
III. Long-term Vision Provision of quality licensed childcare is key to reducing child vulnerability and ensuring children begin school developmentally ready to learn. While childcare is primarily a senior government responsibility, the City forms partnerships, advocates, and invests in creating quality and accessible childcare spaces, which are operated by non-profit partners. The City has met its four-year target to create 1,000 new childcare spaces during the course of the 2015-2018 Capital Plan period in partnership with senior governments and other childcare providers, and this meets about half of the need for new spaces generated by growth. The City has a number of strategies that guide the planning, design and development of childcare facilities in Vancouver:
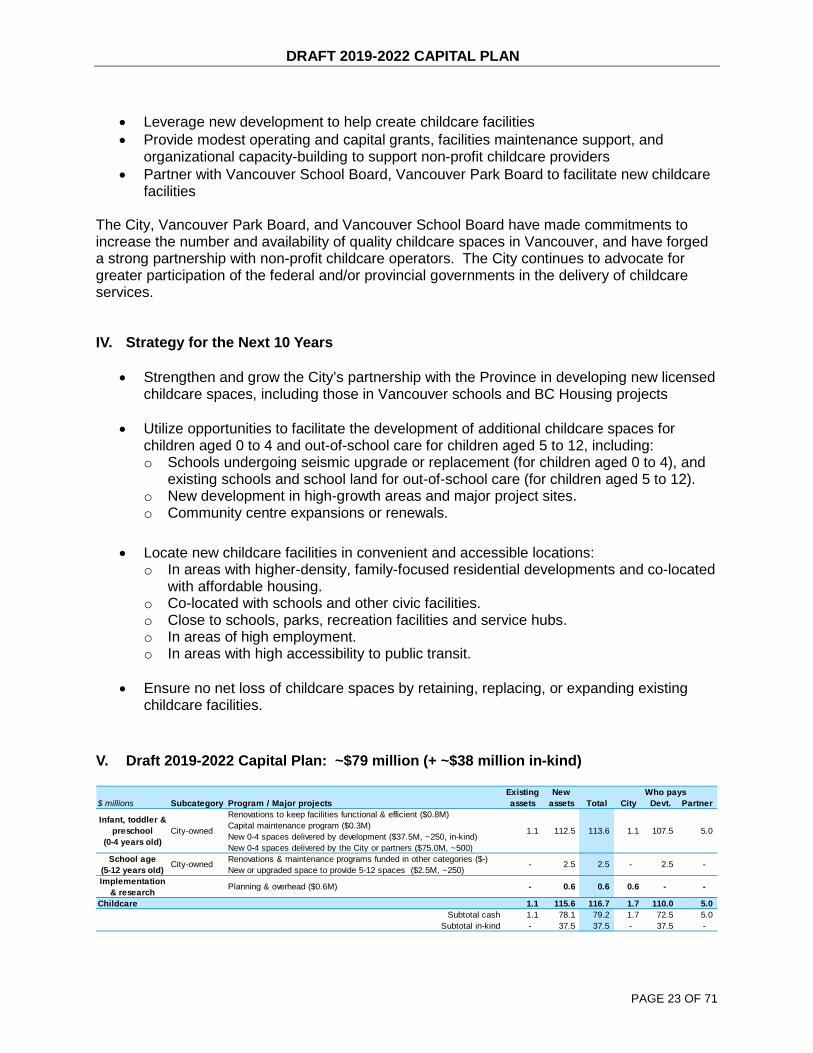
DRAFT 2019-2022 CAPITAL PLAN
PAGE 23 OF 71
• Leverage new development to help create childcare facilities • Provide modest operating and capital grants, facilities maintenance support, and
organizational capacity-building to support non-profit childcare providers • Partner with Vancouver School Board, Vancouver Park Board to facilitate new childcare
facilities The City, Vancouver Park Board, and Vancouver School Board have made commitments to increase the number and availability of quality childcare spaces in Vancouver, and have forged a strong partnership with non-profit childcare operators. The City continues to advocate for greater participation of the federal and/or provincial governments in the delivery of childcare services. IV. Strategy for the Next 10 Years
• Strengthen and grow the City’s partnership with the Province in developing new licensed childcare spaces, including those in Vancouver schools and BC Housing projects
• Utilize opportunities to facilitate the development of additional childcare spaces for
children aged 0 to 4 and out-of-school care for children aged 5 to 12, including: o Schools undergoing seismic upgrade or replacement (for children aged 0 to 4), and
existing schools and school land for out-of-school care (for children aged 5 to 12). o New development in high-growth areas and major project sites. o Community centre expansions or renewals.
• Locate new childcare facilities in convenient and accessible locations:
o In areas with higher-density, family-focused residential developments and co-located with affordable housing.
o Co-located with schools and other civic facilities. o Close to schools, parks, recreation facilities and service hubs. o In areas of high employment. o In areas with high accessibility to public transit.
• Ensure no net loss of childcare spaces by retaining, replacing, or expanding existing
childcare facilities. V. Draft 2019-2022 Capital Plan: ~$79 million (+ ~$38 million in-kind)
Existing New$ millions Subcategory Program / Major projects assets assets Total City Devt. Partner
Renovations to keep facilities functional & efficient ($0.8M)Capital maintenance program ($0.3M)New 0-4 spaces delivered by development ($37.5M, ~250, in-kind)New 0-4 spaces delivered by the City or partners ($75.0M, ~500)Renovations & maintenance programs funded in other categories ($-)New or upgraded space to provide 5-12 spaces ($2.5M, ~250)
Implementation & research Planning & overhead ($0.6M) - 0.6 0.6 0.6 - -
Childcare 1.1 115.6 116.7 1.7 110.0 5.0Subtotal cash 1.1 78.1 79.2 1.7 72.5 5.0
Subtotal in-kind - 37.5 37.5 - 37.5 -
Who pays
School age(5-12 years old)
City-ownedInfant, toddler &
preschool(0-4 years old)
1.1 112.5
2.5-City-owned
113.6 1.1
2.5
107.5 5.0
-2.5-
DRAFT 2019-2022 CAPITAL PLAN
PAGE 24 OF 71
Major renewal projects include:
• Renewal of the 45-space daycare currently located at Marpole-Oakridge Community Centre at a cost of $6-7 million (note: funding for this project is included in the recreation section of the draft Capital Plan)
Major new/upgrade projects include:
• Creation of ~750 new childcare spaces for infants, toddlers and preschoolers (0-4 years old): o ~500 spaces delivered by the City or partners o ~250 spaces delivered by development (in-kind projects)
• Creation of ~250 new childcare spaces for school age children (5-12 years old) delivered
by the City or partners

DRAFT 2019-2022 CAPITAL PLAN
PAGE 25 OF 71
PARKS AND OPEN SPACES
I. Overview The livability of a city is strongly tied to the quality of its parks, open spaces, and public places. Parks and plazas provide spaces for people to gather, play, socialize and relax. They play a crucial role in supporting public health and social connections, maintaining urban ecological systems, providing connections with nature, and fostering a sense of community. As Vancouver continues to grow over the coming decades, its parks, open spaces, and public places will become increasingly important. New and existing residents living in more compact communities will need parks that are well maintained, with amenities and features that meet their leisure and recreational needs. II. Inventory of Assets Vancouver’s network of parks and open spaces includes over 300 sites distributed across the city, accounting for 1,370 hectares (13.7 km2) or about 10% of all land within municipal boundaries. These open spaces vary in size (from small urban plazas and mini-parks to major parks like Stanley Park) and function (e.g. natural areas, sports and recreation, leisure activities and public gatherings). The vast majority of parks and open spaces are managed by Vancouver Board of Parks and Recreation. Other government agencies that provide open space in Vancouver include the Vancouver School Board (VSB), Granville Island, Canada Place, hospitals and post-secondary schools.
City Assets Replacement Value
% in Good / Fair Condition Partner Assets
Parks & Open Spaces
• 1,370 hectares of parks & open spaces
• 215,000 trees • 32 km of seawall • 180 sport fields • 229 sport courts • 160 playgrounds • 36 dog off-leash areas • 6 golf courses • 1 cemetery • 149 park buildings
$1.8 B ~65%
• Playgrounds, playfields and sport courts at VSB schools
• Open spaces on Granville Island
• Open spaces at Canada Place and Convention Centre
• Open spaces at hospitals and post-secondary schools

DRAFT 2019-2022 CAPITAL PLAN
PAGE 26 OF 71
The following table summarizes major work completed in the last 10 years (2009-2018) with regards to asset renewal and addition/upgrades.
Area Renewed Assets New/Upgraded Assets
Parks & Open Spaces
• 9 park renewal projects
• 20 playgrounds
• 7 fieldhouses & washrooms • 5 sport fields
• 57 sport court surfaces
• VanDusen Botanical Garden Visitor Centre
• Mountain View Cemetery buildings
• 9 hectares of new park • 0.6 km of new seawall
• 9 new playgrounds
• 8 new synthetic turf sport fields
• 4 new basketball courts • 4 new skateboard and bike
parks • 3 new dog off-leash areas
• 5 new fieldhouses and washrooms
III. Long-term Vision The City and Vancouver Park Board are committed to ensuring that all residents have access to high quality parks and recreation experiences. This commitment is supported through policies and strategies such as:
DRAFT 2019-2022 CAPITAL PLAN
PAGE 27 OF 71
• The Park Board’s Strategic Framework (2012) sets a vision of connecting people to green space, active living and community, with a strong focus on inclusion and accessibility for all backgrounds, genders, incomes, and abilities.
• The Greenest City 2020 Action Plan (2011, updated 2015) includes targets to: o ensure every person lives within a five-minute walk of a park, beach, greenway, or
other natural space o plant 150,000 additional trees between 2010 and 2020 o increase access to the waterfront, particularly the Fraser River
• The Biodiversity Strategy (2016), in conjunction with the Urban Forest Strategy, Environmental Education and Stewardship Action Plan, and Bird Strategy, provides a foundation for: o restoring and protecting natural areas and species o improving access to nature across the city o supporting biodiversity on public and private lands in Vancouver
• The new VanPlay - Parks and Recreation Services Master Plan (in progress 2018), will guide the long-term renewal and expansion of the parks and recreation system, as well as development of new park provision metrics and policies
• VanSplash: Vancouver Aquatic Strategy (in progress 2018) will guide the future of Vancouver’s pools and beaches, exploring innovative options to support community and personal well-being
• People, Parks and Dogs Strategy (2017) guides the planning and design of safe, engaging, and appealing parks for people with and without dogs
IV. Strategy for the Next 10 Years Key Priorities
• Targeting equity, inclusion and access for all
• Resiliency of spaces, ecosystems, amenities and facilities (climate, density, disaster)
• Reconciliation with and learning from local First Nations rights-holders
Key Outcomes
• Grow park and green spaces by ~20 hectares (~50 acres)
• Build a network of connectivity between new and existing park spaces
• Add four geographically dispersed destination parks (Northeast False Creek, East Fraser Lands, Fraser River, Oakridge)
• Continue to grow existing park spaces and amenities (~20 parks)
Trends Impacting Parks & Recreation Over the Next 10 Years
• ~60,000 new residents resulting in parks catering for more residents at once

DRAFT 2019-2022 CAPITAL PLAN
PAGE 28 OF 71
• Densification mainly in urban core and growth areas, reducing access to private recreation space and reducing tree canopy cover
• Rising inequity in service provision at a city wide scale
• Aging population requiring parks and recreation amenities to adapt to changing needs
• Increasing demand for wellness amenities
• Increased desire for access to nature and to experience nature in the city
• A changing climate which is impacting ecosystems, maintenance requirements and services required
Actions to Address Priorities and Trends
• Acquire and develop new parks, and add amenities to existing parks to improve service in areas of high need (e.g. areas with significant population growth and/or service gap), and to serve the active and passive park needs of all ages (e.g. paths and trails, skateparks, seating, drinking fountains, playgrounds, off-leash dog areas, multi-use hard surfaces and courts).
• Pursue partnerships, development and acquisition to connect park spaces together and to provide access to the waterfront (especially along the Fraser River).
• Grow the urban forest through tree planting on public lands, streets, private property, and developments sites.
• Use green infrastructure, living shorelines, daylit streams to restore natural hydrology and enhance ecological networks.
• Support thriving environmental stewardship to care for natural areas and provide opportunities for recreation through volunteerism and care of natural areas in leisure time.
• Integrating elements of Musqueam, Squamish, Tsleil-Waututh Nations and Urban Indigenous Peoples history and living culture in park design.
• Increase the capacity of parks to cater to increased demand and build resilience to a changing climate by building and upgrading parks and fields with durable surfaces and amenities.

DRAFT 2019-2022 CAPITAL PLAN
PAGE 29 OF 71
V. Draft 2019-2022 Capital Plan: ~$265 million
In the next four years, Parks is considering undertaking a number of major renewal projects, including park renewals for Oak Park and John Hendry Park. Additionally a number of major projects will expand park access and amenities, including opening a new park in Olympic Village (working name ‘East Park’), and building a new washroom facility at Columbia Park. Highlights of the draft Capital Plan for the next four years are described below and shown on the accompanying map.
Parkland Acquisition This category is for parkland acquisition across the City. The Fraser River waterfront continues to be an area of focus, as is expanding neighborhood parks and natural areas.
Park Amenities This category includes new parks and renewals as well as new and upgraded amenities in parks such as playgrounds, skateboard and bicycle parks, courts, pathways and dog off leash areas. On the horizon is the design and development of a new park in the eastern portion of South East False Creek, and a new park in the Burrard Slopes Neighborhood. Furthering plans for Andy Livingstone Park and a new and renewed Creekside Park in North East False Creek, as well as planning for increased park amenities in the West End, Downtown, and Cambie Corridor are upcoming works. Additionally, ongoing emphasis on the park renewal program,
Existing New$ millions Subcategory Program / Major projects assets assets Total City Devt. * Partner
Park land Land acquisition program ($80.0M) - 80.0 80.0 - 80.0 -Renewal & upgrades of exisitng parks ($6.0M)Renewal & upgrades of playgrounds, spraypads, etc. ($9.0M)Universal access improvements ($0.6M)New park development ($50.7M)Skate & bike facilities/tracks ($2.4M)Dog parks & amenities ($2.0M)Parks & recreations studies ($2.7M)Project management ($16.0M)
Subtotal 18.1 71.2 89.4 6.3 83.1 -Grass field renewals & upgrades ($1.5M)Synthetic field renewals & upgrades ($4.0M)Renewal & upgrades to ball diamonds & cricket program ($0.5M)Field lighting renewals & upgrades ($0.2M)New synthetic turf field ($5.4M)Renewals & upgrades of running tracks ($1.3M)New competitive track & field training facility ($10.0M)Renewal & upgrades of courts ($1.0M)Golf course improvements ($0.5M)
Subtotal 9.0 15.4 24.4 5.2 19.2 -Renewal & upgrade of bridges, boardwalks & piers ($4.5M)East Fraser Lands park development ($16.0M)Seawall maintenance & renewal ($1.7M)Seaside greenway ($2.0M, )Shoreline maintenance ($0.2M)
Subtotal 6.4 18.0 24.4 5.4 19.0 -New trees ($8.2M, ~67,000)Replacement trees ($0.5M, ~4,000)
Biodiversity Biodiversity projects ($3.7M, ) - 3.7 3.7 - 3.7 -Stanley Park cliff scaling ($0.5M)Hastings Park stream & wetland creation ($1.6M)
Subtotal 2.5 11.8 14.4 0.9 13.4 -Rehabilitation of pedestian bridges ($3.5M)New & improved pathways ($1.5M)
Vehicle access Rehabilitation of paved surfaces ($1.9M) 1.9 - 1.9 1.9 - -Rehabilitation of park infrastructure ($0.3M)Green infrastructure & drainage ($1.5M)Maintenance & upgrades to electrical systems ($0.6M)Community garden upgrades ($0.4M)Irrigation systems & water conservation ($1.3M)
Subtotal 7.3 3.7 10.9 6.6 4.4 -Renewal & upgrades of washrooms, fieldhouses & concessions ($8.3MCapital maintenance ($4.0M)New washrooms & fieldhouses ($8.7M)
Parks & open spaces 55.7 208.8 264.5 30.5 234.0 -
Programmedactivity areas
1.5 - 1.5 0.8 0.8 -
6.2 5.4 11.6 3.9 7.7 -Fields
Tracks
Other sportamenities
Who pays
15.6 50.7 66.3 3.8 62.5
4.0 4.4 0.4 4.0 -0.4
-
Other
Planning & overhead
1.1
4.5
0.5
2.1
Pedestrian access
Other features
Waterfront &marine structures
Trees
Restoration & maintenance
2.1
1.3
* Excludes assets expected to be delivered in-kind from development.
0.7 1.7 0.7 1.1 -
-
Urban forest &natural areas
1.5 5.0 3.5 1.5 -
- 2.1 0.5
General features& infrastructure
3.5
Park buildings 12.3 8.7 21.0 6.1 14.9 -
0.9 1.5 2.4 0.6 1.8 -Park infrastructure
16.6 -
10.0
1.6
8.2 8.6 0.5 8.2 -
0.6 10.8 -
16.0 20.5 3.5
16.6 18.7 2.1
11.3
Parkamenities
Seawall &waterfront Seawall
Park development
1.9 2.0 3.9 1.9 2.0 -
17.0 -

DRAFT 2019-2022 CAPITAL PLAN
PAGE 30 OF 71
playground renewal program, and providing for emerging new types of recreation facilities will be important throughout the park system, especially in areas of growth, in areas of need and adjacent to the Arbutus Greenway.
Programmed Activity Areas This category includes areas for sport use in parks including grass and synthetic play fields, tennis and basketball courts, and ball diamonds. The first competitive and training track and field facility is to be built in addition to upgrades to aging recreational tracks, a grass sport field renewal, 2 new synthetic turf fields and sport court resurfacing.
Seawall and Waterfront This category provides funds for new waterfront developments and for the repair and upkeep of shorelines and seawalls on the ocean and riverfronts. Development of the parks and foreshore east of Kerr Street in East Fraserlands, and the renewal of bridges and piers in parks, as well as the False Creek seawalls are included here.
Urban Forest and Natural Features Planting of trees in parks and through reforestation works, and furthering creek restoration projects such the Tatlow and Volunteer Park and Beaver Creek in Stanley Park are in this category and link to the Park Board’s Biodiversity Strategy.
Park Buildings Renewing park washrooms and fieldhouses and concessions, and building new washroom and fieldhouse amenities is a priority for the upcoming plan. This category also includes funds for the general maintenance and upkeep of ~150 existing park buildings.
General Features and Infrastructure Continued investment in park infrastructure will support the growing activity across the city. This includes bridges, pavements and parking lots, irrigation systems to further water conservation goals, and other general park infrastructure investments.
DRAFT 2019-2022 CAPITAL PLAN
PAGE 31 OF 71
ARTS & CULTURE AND COMMUNITY FACILITIES
I. Overview As Vancouver continues to grow, the well-being of the community is dependent on the availability, accessibility, and affordability of community facilities and programs for people of all ages, incomes, backgrounds, and abilities. The City leverages key partnerships with Vancouver Park Board, Vancouver Public Library, Vancouver School Board, Vancouver Coastal Health, other levels of government, and non-profit organizations to provide a range of facilities, services and programs across the city. II. Inventory of Assets Community facilities include arts, cultural and entertainment/exhibition facilities, libraries, recreation and social facilities. Cultural The City owns 55 cultural facilities. Arts and cultural spaces are vital to a city. With the goals of cultivating and enhancing a diverse and thriving cultural ecology that enriches the lives of residents and visitors, the City offers support for cultural facilities through the provision of space, capital grants, technical advice, and regulatory assistance. Vancouver’s vibrant cultural ecology relies on a network of accessible, affordable and secure artist creation, exhibition, performance and ancillary spaces. Entertainment/Exhibition This category includes Nat Bailey Stadium at Hillcrest Park and the following buildings managed by the Pacific National Exhibition (PNE) at Hastings Park: the Pacific Coliseum, the Forum, Rollerland, and the Livestock Building. These buildings were all built between 1930 and 1970. Also included is Playland amusement park at Hastings Park. Libraries & Archives Vancouver’s network of libraries includes a central library and 20 branch libraries. Most of the libraries were built between 1945 and 1980. Since 1980, two libraries have been added to the system and 11 have been renewed. The renewal process will continue, and the location, size and service area of libraries are determined by the Library Board and the City as part of the renewal process. The City Archives is currently located in Vanier Park (facility built in 1972). Recreation There are 55 recreation facilities across the City, comprised of 24 community centres, one satellite centre, nine indoor swimming pools, five outdoor swimming pools, nine ice rinks and seven non-profit recreation clubs (e.g. curling). The bulk of the recreation facilities were built between 1945 and 1980, and the City started renewing the portfolio in the 1990s and will continue to do so for the next 20-30 years. Significant progress has been made in the last 20 years: 11 facilities have been renewed and three new community centres have been built in high-growth area (Roundhouse, Coal Harbor and Creekside).

DRAFT 2019-2022 CAPITAL PLAN
PAGE 32 OF 71
Social The City has been involved in the provision of social facilities since the 1970s and currently owns 41 social facilities. These social facilities have a variety of program and service models, but are typically operated by non-profit organizations that enhance the lives of residents through innovative and essential social programs and services to the community. The programs and services foster resilience among populations and address marginalization and vulnerability. For example, there are 12 integrated services models (e.g. Neighborhood Houses) and 28 sites delivering specialized services (e.g. Boys & Girls Club).
City Assets Replacement Value
% in Good/ Fair Condition Partner Assets
Cultural • 55 facilities (1,310,000 sq.ft.) $880 M ~55% • Non-profit cultural facilities
Entertainment & Exhibition
• 5 facilities (380,000 sq.ft.) • Playland amusement park
$320 M >25% • B.C. Place Stadium • Rogers Arena • Convention Centre
Public Art • ~300 art installations $50 M ~75% • ~100 art installations on private land
Libraries & Archives • 22 facilities (575,000 sf) $670 M ~85% • n/a
Recreation • 55 facilities (1,680,000 sq.ft.) $1.51 B ~40% • YMCA, YWCA Social • 41 facilities (570,000 sq.ft.) $400 M ~60% • Non-profit social facilities
The following table summarizes major work completed in the last 10 years (2009-2018) with regards to asset renewal and addition/upgrades.
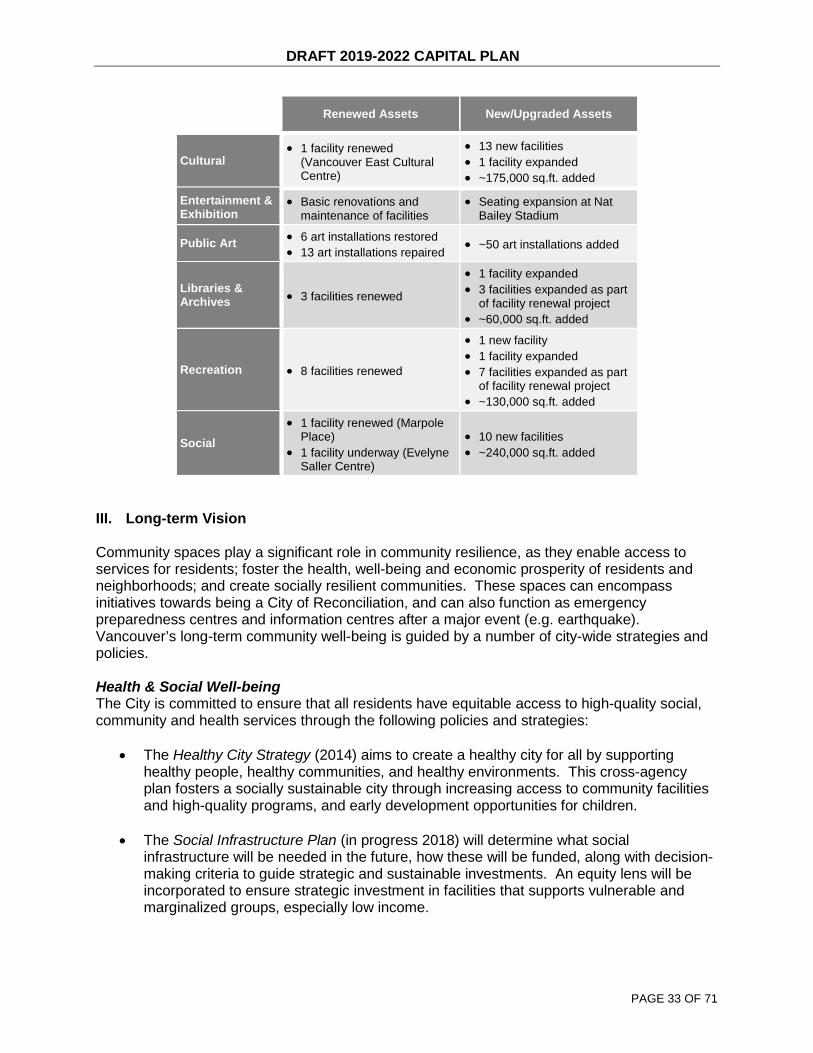
DRAFT 2019-2022 CAPITAL PLAN
PAGE 33 OF 71
Renewed Assets New/Upgraded Assets
Cultural • 1 facility renewed
(Vancouver East Cultural Centre)
• 13 new facilities • 1 facility expanded • ~175,000 sq.ft. added
Entertainment & Exhibition
• Basic renovations and maintenance of facilities
• Seating expansion at Nat Bailey Stadium
Public Art • 6 art installations restored • 13 art installations repaired
• ~50 art installations added
Libraries & Archives • 3 facilities renewed
• 1 facility expanded • 3 facilities expanded as part
of facility renewal project • ~60,000 sq.ft. added
Recreation • 8 facilities renewed
• 1 new facility • 1 facility expanded • 7 facilities expanded as part
of facility renewal project • ~130,000 sq.ft. added
Social • 1 facility renewed (Marpole
Place) • 1 facility underway (Evelyne
Saller Centre)
• 10 new facilities • ~240,000 sq.ft. added
III. Long-term Vision Community spaces play a significant role in community resilience, as they enable access to services for residents; foster the health, well-being and economic prosperity of residents and neighborhoods; and create socially resilient communities. These spaces can encompass initiatives towards being a City of Reconciliation, and can also function as emergency preparedness centres and information centres after a major event (e.g. earthquake). Vancouver’s long-term community well-being is guided by a number of city-wide strategies and policies. Health & Social Well-being The City is committed to ensure that all residents have equitable access to high-quality social, community and health services through the following policies and strategies:
• The Healthy City Strategy (2014) aims to create a healthy city for all by supporting healthy people, healthy communities, and healthy environments. This cross-agency plan fosters a socially sustainable city through increasing access to community facilities and high-quality programs, and early development opportunities for children.
• The Social Infrastructure Plan (in progress 2018) will determine what social
infrastructure will be needed in the future, how these will be funded, along with decision-making criteria to guide strategic and sustainable investments. An equity lens will be incorporated to ensure strategic investment in facilities that supports vulnerable and marginalized groups, especially low income.

DRAFT 2019-2022 CAPITAL PLAN
PAGE 34 OF 71
• The Age Friendly Action Plan (2013) includes more than 60 actions to make the city safer, more inclusive, and engaging for seniors.
Seniors The City collaborates with senior levels of government and community partners to provide a range of facilities and programs to keep seniors active, engaged, and connected to the health services they need. Youth The City collaborates with senior levels of government and community partners to facilitate the development and operations of youth services. These programs allow youth to access health, social, education and counselling services, and, in some cases, transition housing. Recreation The City and Vancouver Park Board are committed to ensuring that all residents have access to parks and public spaces and recreation facilities. This commitment is supported through the following policies and strategies.
• The Park Board’s Strategic Framework (2012) sets a vision of connecting people to green space, active living and community, with a strong focus on inclusion and accessibility for all backgrounds, genders, incomes, and abilities.
• The new VanPlay: Parks and Recreation Services Master Plan (in progress 2018), also informed by the Vancouver Sport Strategy (2008), the Youth Development Strategy (2013), and the Economic Access Policy (1992), will guide the long-term renewal and expansion of the parks and recreation system, as well as development of new park provision metrics and policies.
• VanSplash: Vancouver Aquatic Strategy (in progress 2018) will guide the future of Vancouver’s pools and beaches, exploring innovative options to support community and personal well-being.
Arts & Culture The City supports a diverse and thriving cultural ecology that enriches the lives of residents and visitors. The Creative City Strategy (in progress 2018) and the Making Space for Art and Culture: Cultural Infrastructure Plan (in progress 2018) will guide the City’s cultural infrastructure initiatives to preserve, enhance and develop arts and cultural spaces. Libraries The City and the Vancouver Public Library Board (“VPL”) are building an informed, engaged, connected city by providing free places for everyone to discover, create and share ideas and information. The City and VPL will continue to work together to offer equitable opportunities for learning, creativity and innovation through accessible and inviting spaces and digital connections Heritage Heritage conservation retains and enhances historic places and features that are significant to Vancouver for their history and have educational, aesthetic, social and/or cultural value. Historic places are often sites with other community benefits. For example, Queen Elizabeth Park is a heritage landscape that is widely enjoyed as a place for recreation, sports, and social life.

DRAFT 2019-2022 CAPITAL PLAN
PAGE 35 OF 71
IV. Strategy for the Next 10 Years Children & Families With more family housing opportunities enable through the Housing Vancouver Strategy (2017), the number of children and youth in Vancouver is anticipated to increase over time. Services such as family places, community centres, libraries, neighborhood houses, and childcare facilities are needed to ensure that families thrive and enjoy a healthy development.
• Provide support programs and facilities for families through financing growth tools and grants.
• Explore opportunities to renew or create neighborhood houses and family places. Youth Youth programs are typically offered within community centres, libraries and schools, or dedicated youth services hubs that provide a range of programs and services in one location.
• Provide youth services hubs along transit and close to schools.
• Ensure new and renewed community facilities accommodate youth programs. Seniors Given the aging population and the City’s aim to foster a healthy city for people of all ages and abilities, there is a need for the retention, expansion, and creation of seniors programs, services, and facilities to enable seniors to age in place.
• Explore opportunities for retention, renewal, and expansion of seniors centres and community care facilities.
• Ensure new and renewed community facilities accommodate seniors programs, with a focus on strong transit connectivity, siting accessibility, and affordability.
• Support seniors programs and services that foster independence, empowerment, and community connectedness for an aging population (e.g. community kitchens, peer support, and information and referral services).
Recreation Recreation facilities, including community centres, pools, and arenas are crucial to the well-being of the residents of Vancouver. Vancouver’s recreation facilities vary greatly in terms of age, size, and condition, but most are well used and popular with residents. The facility locations and sizes are rationalized as part of renewal guided by broader Vancouver Park Board strategies. Where there is sufficient concentrated population growth that is not well-served by existing facilities, Vancouver Park Board considers the development of new facilities, or the expansion of existing facilities.
• Set priorities for recreation facility renewal, development, expansion, and programming guided by the VanPlay: Parks and Recreation Services Master Plan and VanSplash: Vancouver Aquatic Strategy.
• Set priorities for development of outdoor sport facilities guided by the Vancouver Sport Strategy.
• Develop flexible, modular approaches to deliver recreation programming in parks.

DRAFT 2019-2022 CAPITAL PLAN
PAGE 36 OF 71
• Continue to collaborate with the Vancouver School Board on shared gymnasiums, multi-use spaces, and outdoor recreation amenities.
• Explore partnership opportunities for public use of non-Park Board aquatic facilities. Arts & Culture Arts and culture play an important role in contributing to quality of life as well as the social and economic vitality of cities. Participation in the arts has been linked to better health and life satisfaction, social cohesion, increased civic engagement and volunteerism, and a more robust local economy. A stronger cultural foundation also provides a basis on which to celebrate community values, identity, and aspirations.
• Explore opportunities and partnerships to preserve, enhance and develop arts and cultural space to be guided by the Creative City Strategy (in progress 2018) and the Making Space for Art and Culture: Cultural Infrastructure Plan (in progress 2018).
• Address issues of affordability, suitability, displacement, and tenure.
• Expand tools to support community initiatives to build sector capacity.
• Incorporate low-barrier, affordable spaces for cultural activities and programs in community centres, social facilities and other shared spaces.
• Maximize opportunities for cultural use of parks, green space, and plazas through provision of event infrastructure.
• Integrate cultural spaces (e.g. artist studios, artist social housing) into residential and mixed-use buildings where appropriate and feasible.
• Explore flexibility in land use regulations to enable multiple cultural uses and evolving aspects of artistic practice (e.g. producing and presenting work in the same space).
• Support Indigenous cultural spaces and explore opportunities to improve Indigenous visibility.
• Support equity and access to cultural spaces for underserved populations. Heritage The purpose of heritage conservation is to retain and enhance historic places and features that are significant to the community.
• Protects historic places (e.g. buildings, bridges, parks) and features (e.g. trees) that are officially recognized as heritage in the Vancouver Heritage Register.
• Enable zoning that supports historic building retention.
• Reveal hidden stories through public art and public realm improvements (e.g. wayfinding signage).
• Allocate community amenity contributions to support heritage conservation efforts city-wide (Heritage Amenity Reserve Fund).
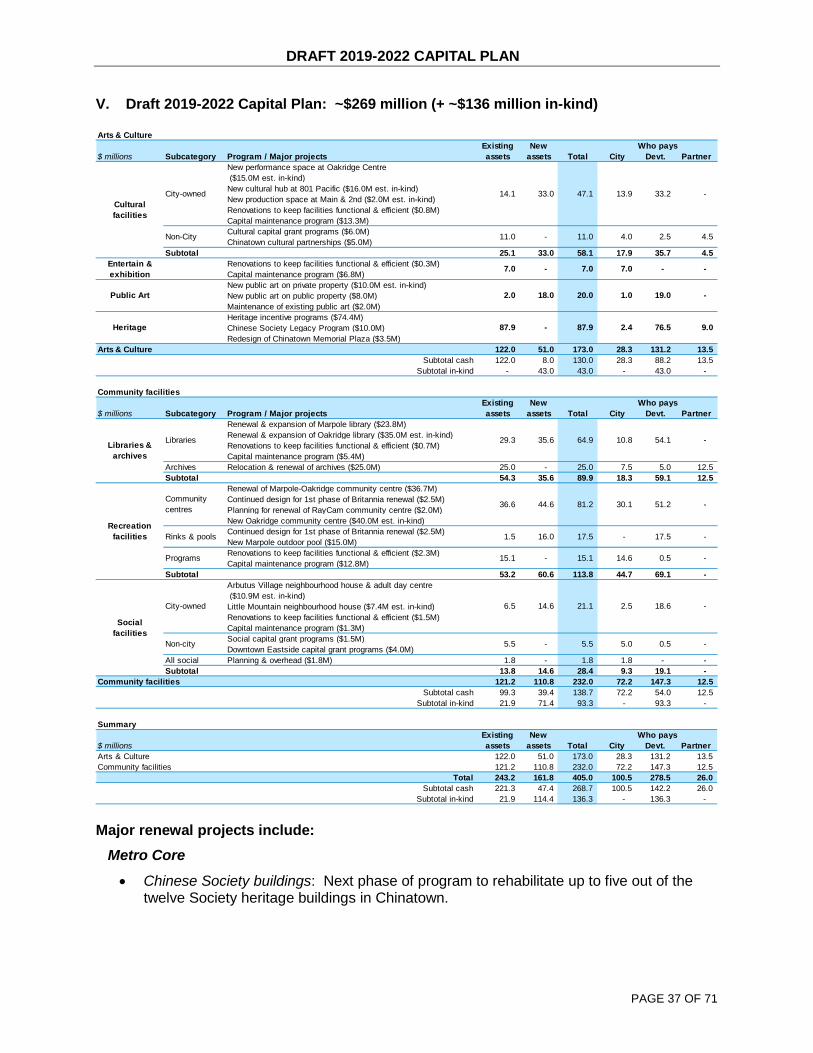
DRAFT 2019-2022 CAPITAL PLAN
PAGE 37 OF 71
V. Draft 2019-2022 Capital Plan: ~$269 million (+ ~$136 million in-kind)
Major renewal projects include:
Metro Core
• Chinese Society buildings: Next phase of program to rehabilitate up to five out of the twelve Society heritage buildings in Chinatown.
Arts & CultureExisting New
$ millions Subcategory Program / Major projects assets assets Total City Devt. PartnerNew performance space at Oakridge Centre ($15.0M est. in-kind)New cultural hub at 801 Pacific ($16.0M est. in-kind)New production space at Main & 2nd ($2.0M est. in-kind)Renovations to keep facilities functional & efficient ($0.8M)Capital maintenance program ($13.3M)Cultural capital grant programs ($6.0M)Chinatown cultural partnerships ($5.0M)
Subtotal 25.1 33.0 58.1 17.9 35.7 4.5Renovations to keep facilities functional & efficient ($0.3M)Capital maintenance program ($6.8M)New public art on private property ($10.0M est. in-kind)New public art on public property ($8.0M)Maintenance of existing public art ($2.0M)Heritage incentive programs ($74.4M)Chinese Society Legacy Program ($10.0M)Redesign of Chinatown Memorial Plaza ($3.5M)
Arts & Culture 122.0 51.0 173.0 28.3 131.2 13.5Subtotal cash 122.0 8.0 130.0 28.3 88.2 13.5
Subtotal in-kind - 43.0 43.0 - 43.0 -
Culturalfacilities
Entertain & exhibition 7.0 -
City-owned 14.1 33.0
-Public Art 2.0 18.0 20.0 1.0 19.0
Heritage 76.5 9.0
47.1 13.9
7.0
87.9 - 87.9 2.4
-
33.2 -
7.0 -
Who pays
Non-City 11.0 - 11.0 4.0 2.5 4.5
Community facilitiesExisting New
$ millions Subcategory Program / Major projects assets assets Total City Devt. PartnerRenewal & expansion of Marpole library ($23.8M)Renewal & expansion of Oakridge library ($35.0M est. in-kind)Renovations to keep facilities functional & efficient ($0.7M)Capital maintenance program ($5.4M)
Archives Relocation & renewal of archives ($25.0M) 25.0 - 25.0 7.5 5.0 12.5Subtotal 54.3 35.6 89.9 18.3 59.1 12.5
Renewal of Marpole-Oakridge community centre ($36.7M)Continued design for 1st phase of Britannia renewal ($2.5M)Planning for renewal of RayCam community centre ($2.0M)New Oakridge community centre ($40.0M est. in-kind)Continued design for 1st phase of Britannia renewal ($2.5M)New Marpole outdoor pool ($15.0M)Renovations to keep facilities functional & efficient ($2.3M)Capital maintenance program ($12.8M)
Subtotal 53.2 60.6 113.8 44.7 69.1 -Arbutus Village neighbourhood house & adult day centre ($10.9M est. in-kind)Little Mountain neighbourhood house ($7.4M est. in-kind)Renovations to keep facilities functional & efficient ($1.5M)Capital maintenance program ($1.3M)Social capital grant programs ($1.5M)Downtown Eastside capital grant programs ($4.0M)
All social Planning & overhead ($1.8M) 1.8 - 1.8 1.8 - -Subtotal 13.8 14.6 28.4 9.3 19.1 -
Community facilities 121.2 110.8 232.0 72.2 147.3 12.5Subtotal cash 99.3 39.4 138.7 72.2 54.0 12.5
Subtotal in-kind 21.9 71.4 93.3 - 93.3 -
Libraries &archives
Socialfacilities
51.2
Recreationfacilities
Communitycentres 36.6 44.6 81.2 30.1
Programs
0.5
15.1 - 15.1
18.6City-owned 6.5
14.6 0.5
Libraries 29.3 35.6 64.9 10.8
2.514.6
-
54.1 -
-
Who pays
17.5 -
Non-city 5.5 - 5.5 5.0
Rinks & pools 1.5 16.0 17.5 -
-21.1
-
SummaryExisting New
$ millions assets assets Total City Devt. PartnerArts & Culture 122.0 51.0 173.0 28.3 131.2 13.5Community facilities 121.2 110.8 232.0 72.2 147.3 12.5
Total 243.2 161.8 405.0 100.5 278.5 26.0Subtotal cash 221.3 47.4 268.7 100.5 142.2 26.0
Subtotal in-kind 21.9 114.4 136.3 - 136.3 -
Who pays

DRAFT 2019-2022 CAPITAL PLAN
PAGE 38 OF 71
• Archives: Renewal and relocation of the existing facility from its current location in Vanier Park to Level 7 of the Central Library downtown. Project will proceed after the completion of the Central Library expansion project on Levels 8 and 9.
• Cultural facilities planning:
o Vanier Park vision as a cultural hub will start by exploring the future programming and master plan options, with significant stakeholder and community engagement;
o Orpheum Theatre planning will focus on the functional improvements to the existing performance space, as well as seismic and accessibility improvements; and
o Fire Hall Theatre & Police Museum conceptual options will review functional needs of both organizations and future options for space accommodation, while addressing accessibility for these public facilities.
Cambie Corridor/Marpole
• Little Mountain Neighbourhood House: Renewal, expansion and relocation of neighbourhood house from its current location at Main & 24th to Main & 36th, co-located with social housing and a 69 space childcare. This is an in-kind CAC project and is expected to start during the 2019-2022 period.
• Marpole-Oakridge Community Centre: Renewal and expansion of community centre at Oak Park. This project includes renewal and expansion of childcare on site.
• Marpole Library: Renewal and expansion of library located near Granville & 67th. This project includes provision of a new 69-space childcare centre, social/cultural non-profit space and social housing.
• Oakridge Library: Renewal and expansion of library located at Oakridge Centre, near Cambie & 41st. Facility will be integrated within a larger civic centre that will include a community centre and 69-space childcare centre. This is an in-kind CAC project and is expected to start during the 2019-2022 Capital Plan period.
Strathcona/Grandview-Woodland
• Britannia Centre: Funding for the design of the first phase of renewal of this community complex in Grandview-Woodland. The Master Plan is nearing completion and expected to be presented to Council in July 2018. This will be followed by a rezoning application to modernize the CD-1 zoning by-law governing the site.
The Britannia Centre project will be built in several phases. The first building will include the pool, recreation centre, a childcare centre and housing, to be located west of the existing ice rink. The cost estimate for designing the first building will be between $10 and $15 million. Unused funding from the 2015-2018 Capital Plan ($25 million was allocated) will be carried forward into the 2019-2022 Capital Plan. Construction of the first building is planned for the 2023-2026 Capital Plan.
• RayCam Centre: Funding to plan/design for the renewal of this centre located at Hastings and Campbell in Strathcona. There is an opportunity to partner with BC Housing, who is exploring options to renew the Stamp’s Place, a non-market housing project located south of RayCam.

DRAFT 2019-2022 CAPITAL PLAN
PAGE 39 OF 71
Major new/upgrade projects include: Metro Core
• New cultural facility at Pacific & Howe: Construction of 21,000 sq. ft. facility containing presentation, production, community, rehearsal and programming spaces. This is an in-kind CAC project and is expected to start during the 2019-2022 Capital Plan period.
• New cultural facility at Main & 2nd: Construction of 4,000 sq. ft. of artist studio production space in Mount Pleasant, co-located with low-income housing for artists and their families. This is an in-kind CAC project and is expected to be completed during the 2019-2022 Capital Plan period.
Cambie Corridor/Marpole
• New Oakridge Civic Centre: Construction of a community facility to be located at Oakridge Centre, near Cambie & 41st. The project will include a community centre, seniors’ centre, youth centre and performance space, and be co-located with an expanded Oakridge Library and a new childcare centre. This is an in-kind CAC project and is expected to start during the 2019-2022 Capital Plan period.
• New Marpole Outdoor Pool: Provision of a new outdoor pool for the Marpole community is a priority the Vancouver Park Board unanimously supported in early 2018. Funding for design and construction is provided in this draft Capital Plan. Upcoming public engagement for the Marpole Community Centre at Oak Park will include ideas about the pool program and details for community input.
Arbutus/Kerrisdale
• New community facility at Arbutus Centre: Construction of a new neighborhood house, co-located with an adult day centre, at the Arbutus Shopping Centre site, near Arbutus & King Edward. This is an in-kind CAC project and is expected to start during the 2019-2022 Capital Plan period.

DRAFT 2019-2022 CAPITAL PLAN
PAGE 40 OF 71
PUBLIC SAFETY AND CIVIC FACILITIES & EQUIPMENT
I. Overview Civic Facilities include three core functions: Public safety (e.g. Fire, Police, Animal Control), municipal administration (e.g. City Hall and Park Board administration building), and service yards (e.g. industrial-type municipal facilities where trucks and equipment are stored and serviced). Most Civic Facilities serve a district or city-wide area, and are therefore concentrated in one or a handful of locations within Vancouver. The one exception is fire halls, which are geographically distributed within the municipality. Fire halls, Police facilities and service yards play a significant role in community resilience. Most civic buildings provide essential service in the case of emergency. II. Inventory of Assets The City owns over 60 civic facilities including public safety, administrative buildings, and service yards. The bulk of Civic Facilities were built between 1886 and 1986. Police facilities have been significantly modernized in the last decade, including new office, training and storage space. Fire halls are gradually renewed as they age. The animal control shelter was built in the 1970s, but the facility is not optimally designed for the services offered today. While some administration buildings have been substantially upgraded in the last decade, some still require significant upgrades and expansion. While three service yards were rebuilt in the last 20 years3, two major yards have buildings in the range of 50 to 90 years old are in need of being renewed4.
City Assets Replacement Value
% in Good / Fair /
Condition Partner assets
Public Safety - Police
• 3 police stations • 8 other police buildings • ~465 vehicles & equipment
$705 M ~75% • n/a
Public Safety - Fire
• 19 fire halls • 3 other fire buildings • ~110 vehicles & equipment
$340 M ~45% • n/a
Public Safety - Animal Control
• 1 animal control shelter $10-15 M 0% • n/a
City Hall Buildings
• 12 administration buildings • 21 service yards • ~830 vehicles & equipment
$875 M ~40% • n/a
3 Evans Yard, Kent Yard and National Yard 4 Manitoba Yard and Sunset Yard

DRAFT 2019-2022 CAPITAL PLAN
PAGE 41 OF 71
The following table summarizes major work completed in the last 10 years (2009-2018) with regards to asset renewal and addition/upgrades.
Renewed Assets New/Upgraded Assets
Public Safety - Police
• Police building on Graveley Street
• Police property and evidence storage facility
• Police dog squad
• Police tactical training centre
Public Safety - Fire
• Fire hall #15 at 22nd & Nootka • Fire hall #5 at 54th & Kerr • Fire hall #17 at 55th & Knight
(underway)
• Heavy Urban Search and Rescue facility
Public Safety - Animal Control • Capital maintenance of facility • n/a
City Hall Buildings
• City Hall heritage building: window replacement and exterior stone restoration.
• City Hall West Annex (Cambie & 10th Ave.): seismic upgrade of building and new service counter for permits & licenses.
• Tenant improvements of leased offices at Woodwards (Hastings & Abbott), Crossroads (Broadway & Cambie), 818 Richards and Marine Gateway (Cambie & Marine).
• n/a
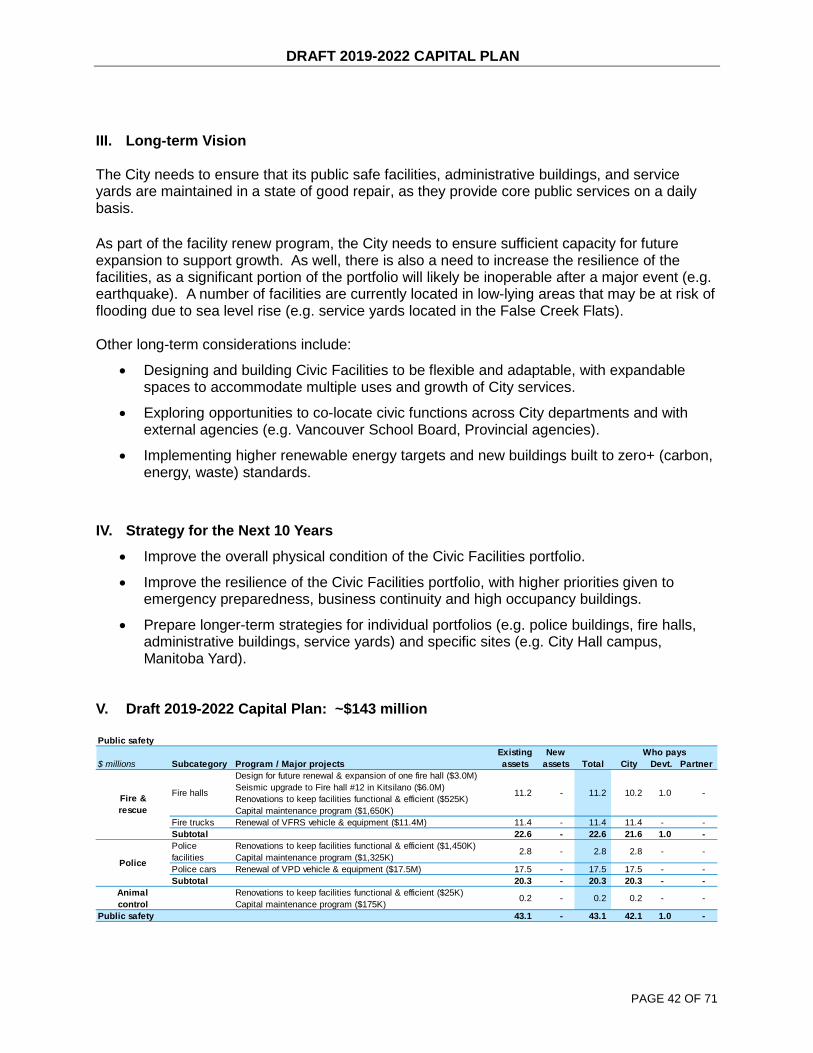
DRAFT 2019-2022 CAPITAL PLAN
PAGE 42 OF 71
III. Long-term Vision The City needs to ensure that its public safe facilities, administrative buildings, and service yards are maintained in a state of good repair, as they provide core public services on a daily basis. As part of the facility renew program, the City needs to ensure sufficient capacity for future expansion to support growth. As well, there is also a need to increase the resilience of the facilities, as a significant portion of the portfolio will likely be inoperable after a major event (e.g. earthquake). A number of facilities are currently located in low-lying areas that may be at risk of flooding due to sea level rise (e.g. service yards located in the False Creek Flats). Other long-term considerations include:
• Designing and building Civic Facilities to be flexible and adaptable, with expandable spaces to accommodate multiple uses and growth of City services.
• Exploring opportunities to co-locate civic functions across City departments and with external agencies (e.g. Vancouver School Board, Provincial agencies).
• Implementing higher renewable energy targets and new buildings built to zero+ (carbon, energy, waste) standards.
IV. Strategy for the Next 10 Years
• Improve the overall physical condition of the Civic Facilities portfolio.
• Improve the resilience of the Civic Facilities portfolio, with higher priorities given to emergency preparedness, business continuity and high occupancy buildings.
• Prepare longer-term strategies for individual portfolios (e.g. police buildings, fire halls, administrative buildings, service yards) and specific sites (e.g. City Hall campus, Manitoba Yard).
V. Draft 2019-2022 Capital Plan: ~$143 million
Public safetyExisting New
$ millions Subcategory Program / Major projects assets assets Total City Devt. PartnerDesign for future renewal & expansion of one fire hall ($3.0M)Seismic upgrade to Fire hall #12 in Kitsilano ($6.0M)Renovations to keep facilities functional & efficient ($525K)Capital maintenance program ($1,650K)
Fire trucks Renewal of VFRS vehicle & equipment ($11.4M) 11.4 - 11.4 11.4 - -Subtotal 22.6 - 22.6 21.6 1.0 -
Renovations to keep facilities functional & efficient ($1,450K)Capital maintenance program ($1,325K)
Police cars Renewal of VPD vehicle & equipment ($17.5M) 17.5 - 17.5 17.5 - -Subtotal 20.3 - 20.3 20.3 - -
Renovations to keep facilities functional & efficient ($25K)Capital maintenance program ($175K)
Public safety 43.1 - 43.1 42.1 1.0 -
- -Animalcontrol 0.2 - 0.2 0.2
- -Police
Policefacilities
2.8 - 2.8 2.8
Who pays
Fire &rescue
Fire halls 11.2 - 11.2 10.2 1.0 -
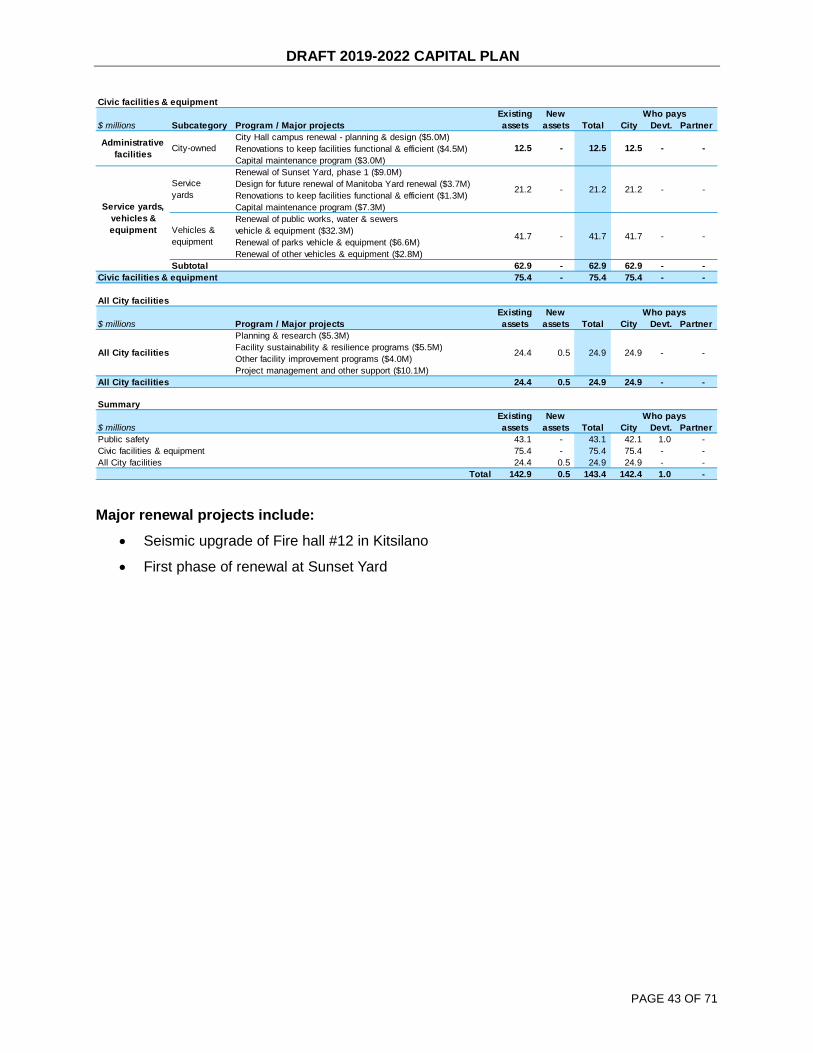
DRAFT 2019-2022 CAPITAL PLAN
PAGE 43 OF 71
Major renewal projects include:
• Seismic upgrade of Fire hall #12 in Kitsilano
• First phase of renewal at Sunset Yard
Civic facilities & equipmentExisting New
$ millions Subcategory Program / Major projects assets assets Total City Devt. PartnerCity Hall campus renewal - planning & design ($5.0M)Renovations to keep facilities functional & efficient ($4.5M)Capital maintenance program ($3.0M)Renewal of Sunset Yard, phase 1 ($9.0M)Design for future renewal of Manitoba Yard renewal ($3.7M)Renovations to keep facilities functional & efficient ($1.3M)Capital maintenance program ($7.3M)Renewal of public works, water & sewersvehicle & equipment ($32.3M)Renewal of parks vehicle & equipment ($6.6M)Renewal of other vehicles & equipment ($2.8M)
Subtotal 62.9 - 62.9 62.9 - -Civic facilities & equipment 75.4 - 75.4 75.4 - -
Service yards, vehicles & equipment
- -
Vehicles &equipment 41.7 - 41.7 41.7 - -
Serviceyards 21.2 - 21.2 21.2
Who pays
Administrativefacilities City-owned 12.5 - 12.5 12.5 - -
All City facilitiesExisting New
$ millions Program / Major projects assets assets Total City Devt. PartnerPlanning & research ($5.3M)Facility sustainability & resilience programs ($5.5M)Other facility improvement programs ($4.0M)Project management and other support ($10.1M)
All City facilities 24.4 0.5 24.9 24.9 - -
Who pays
- -All City facilities 24.4 0.5 24.9 24.9
SummaryExisting New
$ millions assets assets Total City Devt. PartnerPublic safety 43.1 - 43.1 42.1 1.0 -Civic facilities & equipment 75.4 - 75.4 75.4 - -All City facilities 24.4 0.5 24.9 24.9 - -
Total 142.9 0.5 143.4 142.4 1.0 -
Who pays
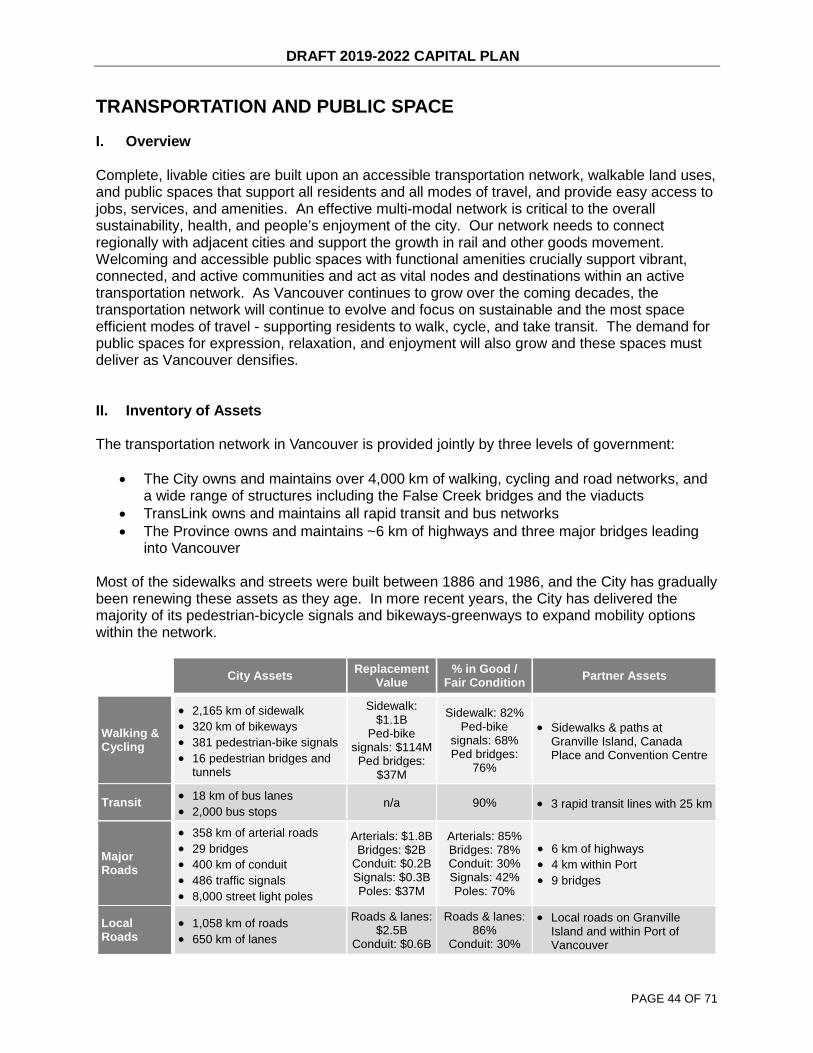
DRAFT 2019-2022 CAPITAL PLAN
PAGE 44 OF 71
TRANSPORTATION AND PUBLIC SPACE
I. Overview Complete, livable cities are built upon an accessible transportation network, walkable land uses, and public spaces that support all residents and all modes of travel, and provide easy access to jobs, services, and amenities. An effective multi-modal network is critical to the overall sustainability, health, and people’s enjoyment of the city. Our network needs to connect regionally with adjacent cities and support the growth in rail and other goods movement. Welcoming and accessible public spaces with functional amenities crucially support vibrant, connected, and active communities and act as vital nodes and destinations within an active transportation network. As Vancouver continues to grow over the coming decades, the transportation network will continue to evolve and focus on sustainable and the most space efficient modes of travel - supporting residents to walk, cycle, and take transit. The demand for public spaces for expression, relaxation, and enjoyment will also grow and these spaces must deliver as Vancouver densifies. II. Inventory of Assets The transportation network in Vancouver is provided jointly by three levels of government:
• The City owns and maintains over 4,000 km of walking, cycling and road networks, and a wide range of structures including the False Creek bridges and the viaducts
• TransLink owns and maintains all rapid transit and bus networks • The Province owns and maintains ~6 km of highways and three major bridges leading
into Vancouver Most of the sidewalks and streets were built between 1886 and 1986, and the City has gradually been renewing these assets as they age. In more recent years, the City has delivered the majority of its pedestrian-bicycle signals and bikeways-greenways to expand mobility options within the network.
City Assets Replacement Value
% in Good / Fair Condition Partner Assets
Walking & Cycling
• 2,165 km of sidewalk • 320 km of bikeways • 381 pedestrian-bike signals • 16 pedestrian bridges and
tunnels
Sidewalk: $1.1B
Ped-bike signals: $114M Ped bridges:
$37M
Sidewalk: 82% Ped-bike
signals: 68% Ped bridges:
76%
• Sidewalks & paths at Granville Island, Canada Place and Convention Centre
Transit • 18 km of bus lanes • 2,000 bus stops
n/a 90% • 3 rapid transit lines with 25 km
Major Roads
• 358 km of arterial roads • 29 bridges • 400 km of conduit • 486 traffic signals • 8,000 street light poles
Arterials: $1.8B Bridges: $2B
Conduit: $0.2B Signals: $0.3B Poles: $37M
Arterials: 85% Bridges: 78% Conduit: 30% Signals: 42% Poles: 70%
• 6 km of highways • 4 km within Port • 9 bridges
Local Roads
• 1,058 km of roads • 650 km of lanes
Roads & lanes: $2.5B
Conduit: $0.6B
Roads & lanes: 86%
Conduit: 30%
• Local roads on Granville Island and within Port of Vancouver
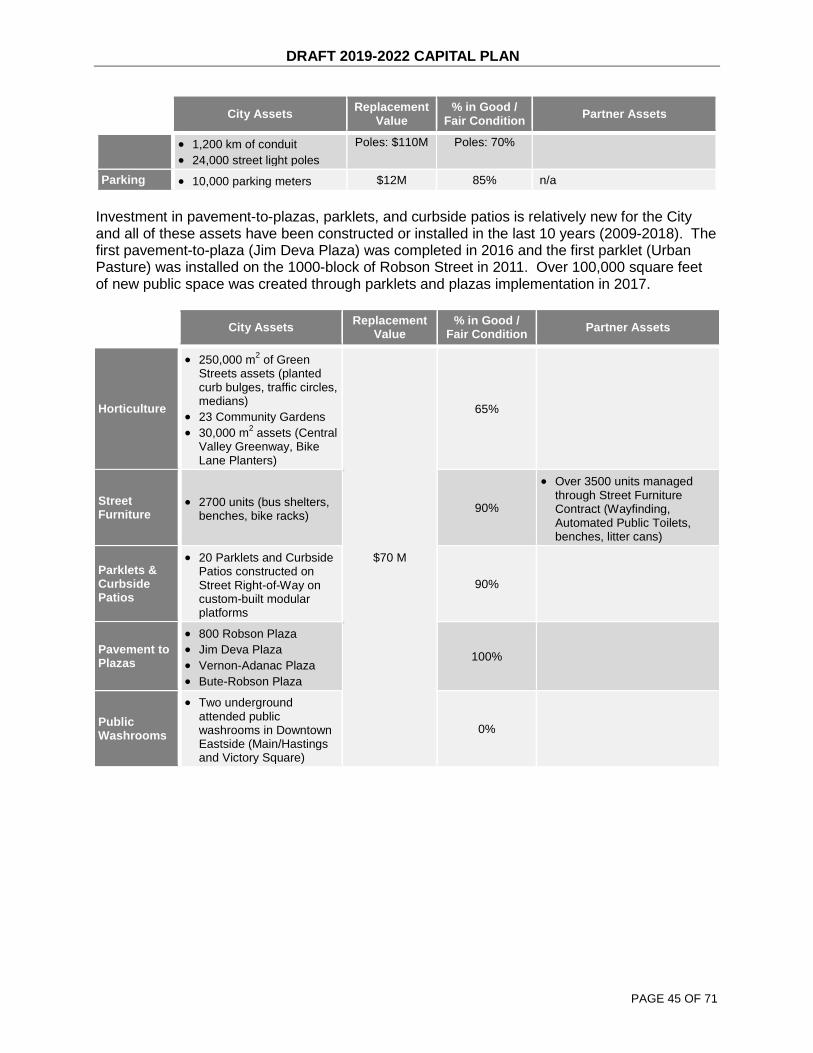
DRAFT 2019-2022 CAPITAL PLAN
PAGE 45 OF 71
City Assets Replacement Value
% in Good / Fair Condition Partner Assets
• 1,200 km of conduit • 24,000 street light poles
Poles: $110M Poles: 70%
Parking • 10,000 parking meters $12M 85% n/a
Investment in pavement-to-plazas, parklets, and curbside patios is relatively new for the City and all of these assets have been constructed or installed in the last 10 years (2009-2018). The first pavement-to-plaza (Jim Deva Plaza) was completed in 2016 and the first parklet (Urban Pasture) was installed on the 1000-block of Robson Street in 2011. Over 100,000 square feet of new public space was created through parklets and plazas implementation in 2017.
City Assets Replacement Value
% in Good / Fair Condition Partner Assets
Horticulture
• 250,000 m2 of Green Streets assets (planted curb bulges, traffic circles, medians)
• 23 Community Gardens • 30,000 m2 assets (Central
Valley Greenway, Bike Lane Planters)
$70 M
65%
Street Furniture
• 2700 units (bus shelters, benches, bike racks) 90%
• Over 3500 units managed through Street Furniture Contract (Wayfinding, Automated Public Toilets, benches, litter cans)
Parklets & Curbside Patios
• 20 Parklets and Curbside Patios constructed on Street Right-of-Way on custom-built modular platforms
90%
Pavement to Plazas
• 800 Robson Plaza • Jim Deva Plaza • Vernon-Adanac Plaza • Bute-Robson Plaza
100%
Public Washrooms
• Two underground attended public washrooms in Downtown Eastside (Main/Hastings and Victory Square)
0%

DRAFT 2019-2022 CAPITAL PLAN
PAGE 46 OF 71
Recently, the City has continued implementing Transportation 2040 Plan actions, delivering numerous plans and new or improved infrastructure. Among the year's highlights:
• Completed modifications to the Knight Street at Marine Drive intersection to significantly reduce collisions at the highest collision location in the city.
• Completed major upgrades to the Burrard Bridge and improved safety at the Burrard Street at Pacific Street intersection. These changes considerably improve cycling connections to and from the bridge and have people being able to walk on both sides.
• Launched an integrated action plan for moving toward zero transportation-related fatalities and began implementation with key partners, such as ICBC and Vancouver Police Department.
• Completed significant additions to the active transportation network, including the Arbutus Greenway temporary pathway, Point Grey Road walking upgrades, South False Creek Seaside Greenway and Southwest Marine Drive bikeway.
• Completed consultation and began implementation on upgrades for walking and cycling on 10th Avenue, 7th Avenue and Adanac bikeways. Initiated consultation on the Georgia Gateway and Gastown complete streets network.
• Continued to upgrade rail crossings at multiple locations to meet new Transport Canada regulations by 2021.
III. Long-term Vision The City continues to be a leader in sustainable transportation, having already achieved its Greenest City 2020 target to have over 50% of trips by foot, bicycle, and public transit. Transportation 2040 (2012), the City’s long-range transportation plan, introduced new targets that two-thirds of all trips are to be made by walking, cycling, and transit, and a commitment to

DRAFT 2019-2022 CAPITAL PLAN
PAGE 47 OF 71
zero traffic fatalities by 2040. It also includes direction for accessibility, all ages and abilities (AAA) cycling infrastructure, emerging technologies, and promoting sustainable choices. This plan acknowledges the connection between land use and transportation, and focuses on utilizing land use to encourage sustainable transportation modes. The Mayor’s Council Regional Transportation Investments: A vision for Metro Vancouver (2015), the Congestion Management Strategy (2017) and Complete Streets Policy Framework (2017) provide additional guidance for shaping the future of streets and mobility, and inform investment and change within our City and its connectivity within the Metro Vancouver region. Over the next 10 years, direction from the Downtown Places for People Strategy as well as new and existing Community Plans will guide the delivery of new public spaces to meet the needs of a growing and densifying population. Complete Streets A Complete Streets planning approach is a holistic approach to street network planning and design, considering the needs of people of all ages and abilities, and all modes of travel appropriate for a given context. It ensures safe, comfortable, and reliable access to services and destinations. A Complete Streets network provides communities with a wide range of transportation choices and contributes to healthy and livable neighborhoods, provides green infrastructure, and fosters vibrant public spaces. Key benefits of a Complete Streets approach include:
• Ensuring a principled multi-modal design process that thoughtfully considers broad civic objectives
• Improving public participation, understanding and support • Improving infrastructure coordination and efficiency
Active Transportation As densities increase and commercial areas expand across the city, it is important to make walking and cycling safe, comfortable, convenient and delightful for people of all ages and abilities. The City’s plan also focuses on delivering streets and sidewalks that are designed to support a vibrant public life that encourages healthy lifestyles and social connectedness for a healthy community. Improving walking and cycling infrastructure and public realm treatments can ensure people of all ages and abilities considers active transportation a more attractive and convenient option.
• Upgrade, enhance and expand pedestrian and cycling network • Provide safety improvements for walking and cycling, in particular around schools
Transit Great transit is essential to moving large numbers of people around our city in an efficient and affordable way, and seamlessly linking pedestrian-oriented neighborhoods to one another. It competes with driving for long-distance trips and supports a growing economy without contributing to congestion. Transit ridership in Vancouver continues to grow, but as it does it faces challenges:

DRAFT 2019-2022 CAPITAL PLAN
PAGE 48 OF 71
• Demand can exceed capacity at various locations across the network, resulting in pass ups at some bus stops. Demand is approaching current capacity on the SkyTrain and Canada Line at peak times.
• The City can support high ridership and improved, cost-effective service by building transit-supportive streets and protecting corridors and sites for future routes and stations.
Road Network Transportation 2040 acknowledges the continuing role of motor vehicles as a transportation option and commits to making the road network as safe and operationally efficient as possible, while supporting a gradual transition over time to a lower proportion of vehicle trips.
• Eliminate all transportation-related fatalities and serious injuries from the transportation system, with a focus on vulnerable road users and those with mobility challenges.
• Deliver on the City’s Congestion Management Strategy to make traveling on city roads more predictable and reliable, though not necessarily faster.
• Apply curbside and parking management techniques, and emerging technologies that help mitigate and manage local parking and traffic impacts associated with growth.
Public Space Welcoming and accessible public spaces with functional amenities crucially support vibrant, connected, and active communities and act as vital nodes and destinations within an active transportation network. Key City policies (Transportation 2040, Healthy City Strategy, Places for People) direct us to:
• Create and improve public spaces that invite people to sit and stay, connect, and relax, and that bring our community together and allow us to grow into a friendly and livable city.
• Provide public realm treatments and amenities (e.g. public washrooms, seating, bike racks, wayfinding signs) that make lingering in and moving through spaces enjoyable and convenient.
• Enable and encourage creative uses of the street, such as through the City’s innovative public space program, VIVA Vancouver as well as pilot initiatives (e.g. curbside seating and patios).
IV. Strategy for the Next 10 Years Guided by Transportation 2040, strategic investment will be made to work towards a mobility target of having two-thirds of all trips by walking, cycling or transit by 2040, and a safety target of zero traffic-related fatalities. The key strategy is to make the most efficient use of our limited road space to move a growing number of people who want to live or work in our city. We do this by reimagining our road space through a Complete Street lens – considering the mobility and travel mode needs for all street users. Priorities for walking are to make streets safer and more accessible while addressing gaps in the network. Priorities for cycling are to expand the network and build AAA routes for all ages and abilities. Priorities for transit are to advance new and improved rapid transit with a focus on the Broadway Corridor, improve local transit, and support a transit-friendly public
DRAFT 2019-2022 CAPITAL PLAN
PAGE 49 OF 71
realm. Priorities for goods and services are to protect and improve rail corridors, and maintain an efficient network of designated truck routes. As part of the City’s long-term asset renewal strategy, strategic investments will be prioritized to maintain and repair critical infrastructure and amenities such as bridges, roads, bikeways and sidewalks to minimize life cycle costs and ensure safe, comfortable, and effective service for all road users. Complete Streets Incorporate Complete Streets planning and design principles on strategic corridors that prioritize accessibility for users of all ages and abilities, while considering overall transportation network reliability and ensuring that core service and delivery functions can be met and sustained. Prioritization is given to projects with the greatest benefit, specifically projects that:
• Significantly improve safety or increase sustainable mode share. • Coordinate with street rehabilitation or other infrastructure projects. • Leverage opportunities from a rapid pace of redevelopment or newly constructed streets.
Active Transportation Make walking and cycling safe, comfortable, convenient and delightful for all ages and abilities. This will be achieved by focusing on the following:
• Complete the pedestrian network, prioritizing improvements along routes to transit, schools, parks, community, and healthcare facilities, with a focus on safety improvements.
• Improve pedestrian accessibility through the installation of new or replacement of sidewalks, curb ramps, tactile cues, non-slip surfaces, reduced sidewalk clutter, and accessible pedestrian signals and bus stops.
• Upgrade and expand the cycling network with more AAA cycling infrastructure and more bikeway connections on low-volume local streets.
• Support the expansion of public bike share to enable more bicycle trips to access transit stations, employment sites, commercial areas, and destination-rich streets.
Transit In June 2014, the Mayors’ Council on Regional Transportation prepared a document entitled “Regional Transportation Investments”, which contains a 30-year vision and a list of projects and investments for the next 10 years. In March 2018, the Mayors’ Council and the Province agreed on a plan to fund the regional share for Phase II of the 10-Year Vision. This regional funding is another step forward to secure an historic investment in transit and transportation in Metro Vancouver, to achieve better travel time and more reliable transit service. Key elements of the plan for both Phase I and Phase II that directly impact Vancouver include:
• Construction of the 6 km Millennium Line Broadway Extension to serve Central Broadway (VCC-Clark station west to Arbutus).
• Significant capacity upgrades to SkyTrain stations to meet latent demand and improve the customer experience, as well as an increase in capacity for the Canada Line.
• Increases in bus service to address overcrowding and reduce wait times, including a new B Line along 41st Avenue, connecting Joyce-Collingwood SkyTrain Station to UBC via Oakridge mall
DRAFT 2019-2022 CAPITAL PLAN
PAGE 50 OF 71
Road Network Manage the road network efficiently to improve safety, minimize congestion, and support a gradual reduction in car dependence. Make it easier to drive less while maintaining livability.
• Improve safety for all road users. • Ensure that emergency response truck route functions are maintained as all street
designs and networks are developed. • Support local businesses by planning for loading and deliveries and by ensuring
potential customers have access. • Review rush-hour parking restrictions on arterial streets to provide greater transit or
vehicular capacity, and use performance-based pricing to ensure turnover of parking spaces.
• Provide accessible parking for persons with disabilities in the most convenient, comfortable, and usable spaces possible.
• Develop work plans and strategies to, over time, improve the overall condition of the city’s arterial road network to match that of the Translink funded MRN road network.
• Prioritize limited funding for the rehabilitation of the local road network in an effort to minimize the deterioration of the condition of the asset.
Electrical
• Prioritize the replacement of aging electrical assets such as underground conduit, street light and traffic signal poles.
• Reduce safety risks to the public through the pro-active replacement of all street light poles assessed to be in poor condition.
• Develop and implement long-term strategies for the management of electrical assets, including establishing financial strategies to fund necessary capital expenditures.
• Modernize the street lighting networks to take advantage of new and emerging technologies such as LED lighting that provide improved functionality while also reducing energy requirements.
• Take advantage of opportunities to “electrify” the street ROW for new and expanded uses such as public events and food services.
• Leverage the renewal of underground conduit to install increased conduit capacity to meet expected future demands and build the city of tomorrow.
Major Bridges & Structures
• Focus on improving the resiliency of critical infrastructure to known hazards such as seismic events, supporting the advancement of the City’s earthquake preparedness strategy, including completing important seismic upgrades to both the Cambie Street and Granville Street bridges.
• Develop a bridge coating renewal plan and implement initial phases. • Rehabilitate aging components of the Granville Bridge. Coordinate bridge renewal with
transportation improvements where practical. • Replace Bridgeway pedestrian bridge. • Develop a comprehensive long-term asset management plan for structures assets. • Reduce percentage of structures assets in poor condition through renewal of
infrastructure funded from capital. Public Spaces
• Undertake asset review and develop asset management strategy for public spaces, and landscape and public realm amenities.
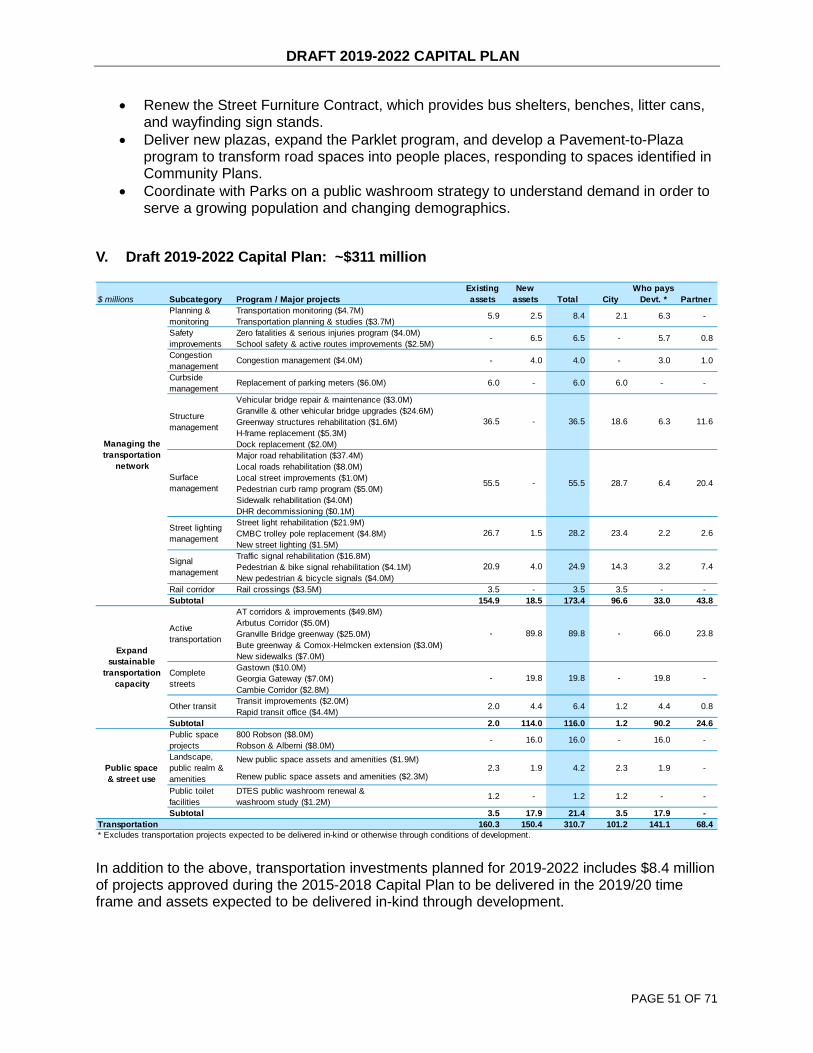
DRAFT 2019-2022 CAPITAL PLAN
PAGE 51 OF 71
• Renew the Street Furniture Contract, which provides bus shelters, benches, litter cans, and wayfinding sign stands.
• Deliver new plazas, expand the Parklet program, and develop a Pavement-to-Plaza program to transform road spaces into people places, responding to spaces identified in Community Plans.
• Coordinate with Parks on a public washroom strategy to understand demand in order to serve a growing population and changing demographics.
V. Draft 2019-2022 Capital Plan: ~$311 million
In addition to the above, transportation investments planned for 2019-2022 includes $8.4 million of projects approved during the 2015-2018 Capital Plan to be delivered in the 2019/20 time frame and assets expected to be delivered in-kind through development.
Existing New$ millions Subcategory Program / Major projects assets assets Total City Devt. * Partner
Transportation monitoring ($4.7M)Transportation planning & studies ($3.7M)Zero fatalities & serious injuries program ($4.0M)School safety & active routes improvements ($2.5M)
Congestionmanagement
Congestion management ($4.0M) - 4.0 4.0 - 3.0 1.0
Curbsidemanagement
Replacement of parking meters ($6.0M) 6.0 - 6.0 6.0 - -
Vehicular bridge repair & maintenance ($3.0M)Granville & other vehicular bridge upgrades ($24.6M)Greenway structures rehabilitation ($1.6M)H-frame replacement ($5.3M)Dock replacement ($2.0M)Major road rehabilitation ($37.4M)Local roads rehabilitation ($8.0M)Local street improvements ($1.0M)Pedestrian curb ramp program ($5.0M)Sidewalk rehabilitation ($4.0M)DHR decommissioning ($0.1M)Street light rehabilitation ($21.9M)CMBC trolley pole replacement ($4.8M)New street lighting ($1.5M)Traffic signal rehabilitation ($16.8M)Pedestrian & bike signal rehabilitation ($4.1M)New pedestrian & bicycle signals ($4.0M)
Rail corridor Rail crossings ($3.5M) 3.5 - 3.5 3.5 - -Subtotal 154.9 18.5 173.4 96.6 33.0 43.8
AT corridors & improvements ($49.8M)Arbutus Corridor ($5.0M)Granville Bridge greenway ($25.0M)Bute greenway & Comox-Helmcken extension ($3.0M)New sidewalks ($7.0M)Gastown ($10.0M)Georgia Gateway ($7.0M)Cambie Corridor ($2.8M)Transit improvements ($2.0M)Rapid transit office ($4.4M)
Subtotal 2.0 114.0 116.0 1.2 90.2 24.6800 Robson ($8.0M)Robson & Alberni ($8.0M)New public space assets and amenities ($1.9M)
Renew public space assets and amenities ($2.3M)
Public toiletfacilities
DTES public washroom renewal &washroom study ($1.2M)
1.2 - 1.2 1.2 - -
Subtotal 3.5 17.9 21.4 3.5 17.9 -Transportation 160.3 150.4 310.7 101.2 141.1 68.4
4.2 2.3 1.9 -
Public spaceprojectsLandscape, public realm & amenities
2.3 1.9
4.4 0.8
- 16.0 16.0 - 16.0 -
7.4
- 89.8 89.8 - 66.0 23.8
20.9 4.0 24.9 14.3 3.2
20.4
26.7 1.5 28.2 23.4 2.2 2.6
55.5 - 55.5 28.7 6.4
0.8
36.5 - 36.5 18.6 6.3 11.6
- 6.5 6.5 - 5.7
Who pays
5.9 2.5 8.4 2.1 6.3 -
Managing the transportation
network
Planning &monitoringSafetyimprovements
Structuremanagement
Surfacemanagement
Street lightingmanagement
Signalmanagement
Completestreets
Other transit
* Excludes transportation projects expected to be delivered in-kind or otherwise through conditions of development.
Public space& street use
Expand sustainable
transportation capacity
Activetransportation
- 19.8 19.8 - 19.8 -
2.0 4.4 6.4 1.2

DRAFT 2019-2022 CAPITAL PLAN
PAGE 52 OF 71
Major renewal projects include: • Complete the seismic upgrade and concrete repair for Granville Bridge. • Pavement rehabilitation of 23km of MRN and arterial streets. • Eliminate the backlog of poor condition street light poles through targeted replacement. • Rehabilitation of 16km of aging, underground electrical conduit. • Partnering with BC Hydro to complete the elimination of the existing H-frame
infrastructure in downtown lanes with upgraded, underground infrastructure. • Advance the replacement of communication network and controller for the City’s traffic
signal system to new industry standard. Major new/upgrade projects include
• Work with partners to complete the design and begin construction of the Millennium Line Broadway Extension.
• Complete the design and create an implementation plan for the Gastown complete streets network and the Georgia Gateway.
• Complete the implementation of transit priority and reliability improvements for B-Line services along Hastings Street and 41st Avenue.
• Complete upgrades to rail crossings at multiple locations to improve safety and meet new Transport Canada requirements.
• Continue to upgrade and expand walking and cycling networks through projects across the City.
• Complete the design and implementation of 800 Robson and Bute-Robson Plazas • Complete the design and implementation of public realm improvements on Robson and
Alberni Streets In addition to the City’s transportation investments, major investments will also be delivered through partnerships with TransLink & the Province including:
• The construction of 6 km Millennium Line Broadway Extension to serve Central Broadway (VCC-Clark station west to Arbutus).
• Upgrades to the Burrard Skytrain Station.

DRAFT 2019-2022 CAPITAL PLAN
PAGE 53 OF 71
ONE WATER
I. Overview One Water utility is responsible for all water-related services and policies in the city. Beyond the essential services of drinking water, wastewater (often referred to as sewage) and rainwater (often referred to as drainage), One Water utility services also include shoreline protection, flood management, and climate change adaptation. These services are critical to maintaining the health and well-being of our residents, supporting a growing population, enabling local economy, and improving the city’s sustainability and resilience. One Water utility services are delivered by the City in collaboration with Metro Vancouver, which operates the regional system. Vancouver’s potable water originates from the Capilano, Seymour, and Coquitlam reservoirs. On an average day, the water system delivers 300 million litres of high-quality drinking water throughout the city. Vancouver’s wastewater is collected and processed at the Iona Island treatment plant in Richmond before being discharged into the Straight of Georgia. Vancouver’s rainwater is collected predominantly through our drainage pipe system and discharged in local waters such as Burrard Inlet, English Bay, False Creek and the Fraser River. The City has begun to incorporate green infrastructure systems throughout the city that seek to divert water from the combined and separated pipe systems through a suite of tools that use both engineered systems, soils and plants to mimic the natural water cycle in our urban environment. Current green infrastructure practices capture and clean rainwater, and help return water to its natural pathways. II. Inventory of Assets The drinking water, wastewater and rainwater services in Vancouver are provided jointly by two levels of government:
• Metro Vancouver owns and maintains regional network components, such as the watersheds and reservoirs on the North Shore, the wastewater treatment plant in Richmond that serves Vancouver, and the water transmission mains, water reservoirs, and trunk sewers located within Vancouver.
• The City owns and maintains local serving components, such as water distribution
mains, collection pipes for wastewater and rainwater, and green infrastructure assets located on public land.
The vast majority of the water, wastewater and rainwater systems were built between 1886 and 1986, and Metro Vancouver and the City have been gradually renewing and upgrading these assets as they age. The bulk of Vancouver’s original wastewater and rainwater systems were built with “combined pipes”. “Separated pipes” were constructed in Still Creek starting in the 1950s and the rest of the city starting in the 1970s.
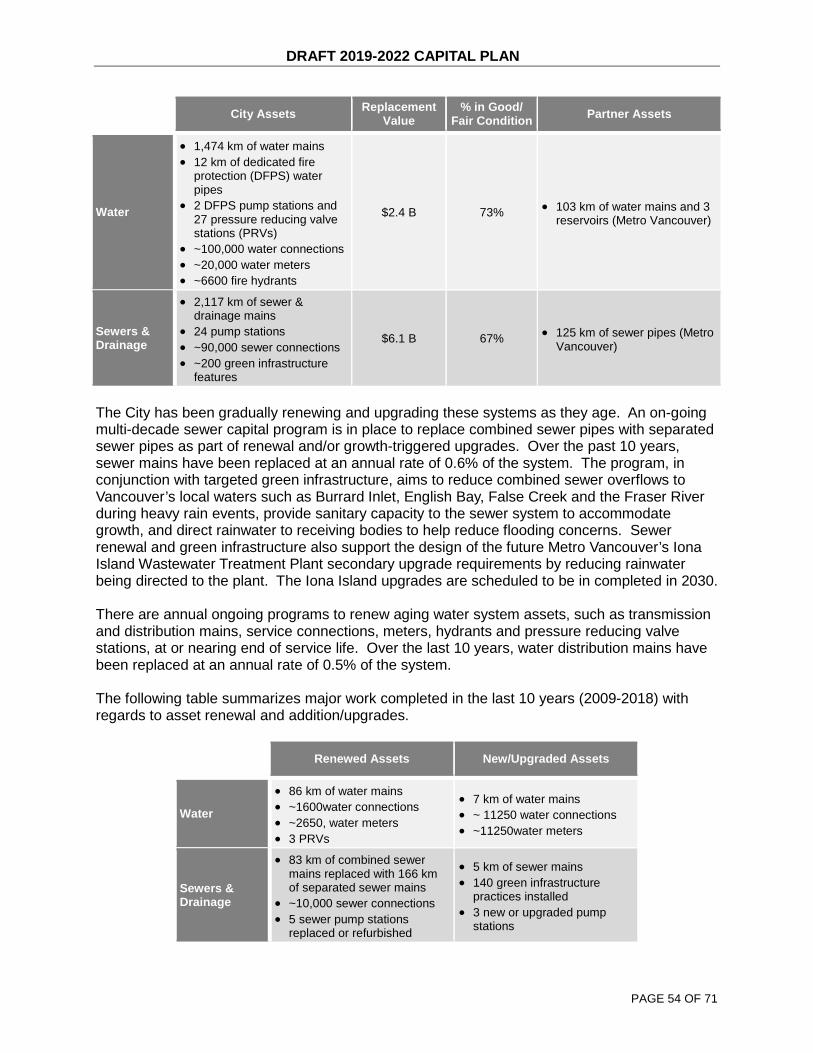
DRAFT 2019-2022 CAPITAL PLAN
PAGE 54 OF 71
City Assets Replacement Value
% in Good/ Fair Condition Partner Assets
Water
• 1,474 km of water mains • 12 km of dedicated fire
protection (DFPS) water pipes
• 2 DFPS pump stations and 27 pressure reducing valve stations (PRVs)
• ~100,000 water connections • ~20,000 water meters • ~6600 fire hydrants
$2.4 B 73% • 103 km of water mains and 3 reservoirs (Metro Vancouver)
Sewers & Drainage
• 2,117 km of sewer & drainage mains
• 24 pump stations • ~90,000 sewer connections • ~200 green infrastructure
features
$6.1 B 67% • 125 km of sewer pipes (Metro Vancouver)
The City has been gradually renewing and upgrading these systems as they age. An on-going multi-decade sewer capital program is in place to replace combined sewer pipes with separated sewer pipes as part of renewal and/or growth-triggered upgrades. Over the past 10 years, sewer mains have been replaced at an annual rate of 0.6% of the system. The program, in conjunction with targeted green infrastructure, aims to reduce combined sewer overflows to Vancouver’s local waters such as Burrard Inlet, English Bay, False Creek and the Fraser River during heavy rain events, provide sanitary capacity to the sewer system to accommodate growth, and direct rainwater to receiving bodies to help reduce flooding concerns. Sewer renewal and green infrastructure also support the design of the future Metro Vancouver’s Iona Island Wastewater Treatment Plant secondary upgrade requirements by reducing rainwater being directed to the plant. The Iona Island upgrades are scheduled to be in completed in 2030. There are annual ongoing programs to renew aging water system assets, such as transmission and distribution mains, service connections, meters, hydrants and pressure reducing valve stations, at or nearing end of service life. Over the last 10 years, water distribution mains have been replaced at an annual rate of 0.5% of the system. The following table summarizes major work completed in the last 10 years (2009-2018) with regards to asset renewal and addition/upgrades.
Renewed Assets New/Upgraded Assets
Water
• 86 km of water mains • ~1600water connections • ~2650, water meters • 3 PRVs
• 7 km of water mains • ~ 11250 water connections • ~11250water meters
Sewers & Drainage
• 83 km of combined sewer mains replaced with 166 km of separated sewer mains
• ~10,000 sewer connections • 5 sewer pump stations
replaced or refurbished
• 5 km of sewer mains • 140 green infrastructure
practices installed • 3 new or upgraded pump
stations

DRAFT 2019-2022 CAPITAL PLAN
PAGE 55 OF 71
Major renewal projects completed include: • Renewal of 83 km of sewer mains, including projects on major arterials such as Burrard,
W 4th, Alma, SW Marine, Dunbar, Nanaimo, King Edward • Renewal or refurbishment of five pump stations, including Skeena/Cornett,
Boundary/1st, Granville Island, Kitsilano, and the Cambie Pump Station (formed part of the NEU facility)
• Replacement and upgrade of major water transmission mains on Pender, and 11th Ave (5.8 km of transmission main)
• Renewal of water distribution mains at end of life, including major projects on Burrard, Beach, Cambie, Hemlock, Knight, Nanaimo
• Trial of Japanese-standard seismically resilient water pipe for Jackson renewal as part of the hardened/resilient water grid
• Replaced three water pressure reducing valve stations at end of life • Upgrade of sewer/water connections at an average rate of 1200/year for new
developments Major new/upgrade projects completed include:
• Upgraded sanitary and storm sewer trunk pipes servicing the residential area west of Oakridge Mall
• Received new sewer, water and green infrastructure as part of the East Fraserlands development and the Southeast False Creek Olympic Village
• Upgraded pump stations include Glen Pumps Station, White Pine Mill Pump Station, Kent/Kinross Pump Station
• 7 km of new or upgraded water mains to support development and increased density across the City
• New water meters for all growth and redevelopment sites, including single and dual family properties since 2012
• 63rd Ave and Yukon boulevard improvements which incorporated green infrastructure practices to manage and clean surface runoff from surrounding streets

DRAFT 2019-2022 CAPITAL PLAN
PAGE 56 OF 71
New & Renewed Sewer Mains & Pump Stations (2009-2018)
New & Renewed Water Mains (2009-2018)

DRAFT 2019-2022 CAPITAL PLAN
PAGE 57 OF 71
III. Long-term Vision A city’s waterworks and sewer infrastructure plays an important role in ensuring its overall sustainability and resiliency. Using water efficiently, being aware of what goes into the sewer, and how local waterways can be affected by sanitary and storm water are important steps in working towards the goal of becoming the greenest city in the world by 2020. Our long-term investment is guided by a number of strategies:
• The Greenest City 2020 Action Plan (2011) sets the following goals for Vancouver: o Having the best drinking water quality in the world by 2020 o Reducing potable water use by 33%
• The Climate Change Adaptation Strategy (2012) provides direction on resiliency as climate changes.
• Metro Vancouver’s Integrated Liquid Waste and Resource Management Plan (2010) mandates the elimination of combined sewer overflows, separation of combined sewer mains, and protection of water quality in local receiving waters.
• The Integrated Rainwater Management Plan (2016) focuses on rainwater management and restoring the role of urban watersheds to support urban and natural ecosystems.
• The Rain City Strategy (in progress 2018) focuses on improving and protecting Vancouver’s water quality, increasing community resilience through sustainable water management, and enhancing livability through healthy urban ecosystems.
The City’s existing utility infrastructure represents generations of investments to manage drinking water, rainwater, and wastewater to support public health, safety, community resiliency, environmental stewardship and livability. The two main drivers for utilities are:
• To ensure that our existing assets are well managed and robust to support community resiliency.
• To implement policies to manage water, in all its forms, to optimize investments to achieve city objectives for the long term.
The next 30 years will see a significant shift in how water resources are managed in the City to respond to pressures of aging infrastructure and growth, to improve water quality of our foreshore areas, and to mitigate the impacts of a changing climate. The strategic and thoughtful management of water plays a fundamental role in servicing and shaping city growth and resiliency. This is achieved through unifying the management of drinking water, ground water, surface water, rainwater and wastewater. Integrated water management will provide flexibility and efficiency for meeting water quality standards and addressing broader city goals. Integrated policies will optimize local solutions based on availability of local resources including proximity of drinking water, wastewater collection, rainwater, groundwater supply, and permeable ground conditions. Servicing solutions are expected to broaden infrastructure assets beyond conventional piped water and sewer systems to include green infrastructure, local water storage systems and local treatment systems delivered on the building scale, district scale and citywide scale.
DRAFT 2019-2022 CAPITAL PLAN
PAGE 58 OF 71
Mitigation strategies to accommodate sea-level rise and storm surge will be critical in protecting low-lying lands from the impacts of climate change and will provide co-benefit opportunities to improve public realm spaces through multi-use systems, while integrating with overall water management strategies. IV. Strategy for the Next 10 Years Like many cities around the world, Vancouver has aging infrastructure that has been deteriorating at a more rapid rate than renewal investment. Pressures of aging infrastructure combined with increased population density and development intensity, climate change and sea level rise, and increased regulations around environmental water quality are already having significant impacts on our water, sewer and drainage utility infrastructure. In conjunction with adopting an integrated “One Water” approach to utility servicing, the Water, Sewer and GI utilities must increase infrastructure renewal programs to replace existing infrastructure reaching end of life. Traditional infrastructure replacement combined with the integrated water management approach will allow for upgrading conventional underground pipe networks more cost-effectively while enhancing community resilience and livability. The integrated approach encompasses drinking water efficiency and reliability, storm water management, green infrastructure, sanitary wastewater collection and conveyance, and climate change adaptation. Replacement or expansion of existing water, sewer and drainage utility systems will be needed to support future growth in Vancouver. On private lands, storm water performance targets and ground water regulations will be introduced to increase storm water retention on site to minimize discharge to the conventional sewer infrastructure over time. On public lands, integrated grey/green infrastructure will be implemented to reduce stormwater loading, treat stormwater, and provide a suite of sustainability and livability co-benefits. The City will also engage with Metro Vancouver to assess their asset capacity to accommodate future growth. With respect to emergency preparedness, a major event (e.g. earthquake) could make the city’s conventional fire protection system unusable. Vancouver’s dedicated fire protection system is designed to pump potable water, plus salt water when needed, to supply adequate flows in the event of a disaster. Plans for a hardened grid of water mains city-wide will provide further system resiliency. Integrated ‘One Water’ Utility Planning
• In order to realize transformative change around how utility services are planned and delivered, to be more resilient, resourceful and cost-effective, and to meet changing needs over time, an investment in an integrated water planning function is required. o The first need is to integrate planning functions across water, wastewater and
rainwater management. o The second need is to integrate ‘one water’ utility planning with broader community,
transportation, energy and land use planning functions so that Vancouver can meet the needs of a growing city in a way that is resilient, cost-effective and yields benefits for a broad range of community building goals.
• The implications of a new, more integrated approach to utility planning are significant and will also be critical to inform and align with Metro Vancouver utility planning and capital investment decisions for the Vancouver Sewerage District in the coming decades.

DRAFT 2019-2022 CAPITAL PLAN
PAGE 59 OF 71
Drinking Water • Urgent need to increase infrastructure replacement rate over the next 10 years to
manage deterioration due to a significant portion of mains reaching end of service life in the next 30 years.
• Incremental strategy to increase water main renewal to average of 0.7% over the Capital Plan, to allow for resource leveling, stability, continuity, and consistent funding levels.
• Strong focus on transmission main replacement for assets in critical condition. • Scale of existing infrastructure deficit means that distribution main assets will continue to
deteriorate over next several decades as replacement program catches up with deterioration rates.
• Several other smaller programs are funded only to basic levels to respond reactively to failures (hydrants and services) and will benefit from increased renewal through distribution main replacement projects.
• New initiatives to accelerate seismic resiliency upgrades and leakage and demand management programs to support water conservation and reduce water loss to support resilience goals.
Sewers and Drainage
• Renew sewer assets that have reached the end of their service lives. • Implement system monitoring and modeling programs to support the integrated
evaluation of the needs/opportunities/relationship of grey and green infrastructure. • Continue with sewer separation efforts to meet regulatory target of eliminating combined
sewer overflows as required by Metro Vancouver’s Liquid Waste Management Plan. • Mitigate against sea level rise by constructing dikes at East Fraserlands and evaluate
mitigation options for the Fraser River, English Bay, False Creek and Coal Harbor. • Replace and renew service connections in response to the development industry and to
trouble calls related to blockages from tree roots and asset deterioration, resulting in property damage claims.
• Decrease the number of homes on the Sewer Connection Precautionary Rodding (PR) Program. (There are currently over 4,000 homes on the program.)
• Renew end of life sanitary Pump Stations with facilities that better protect the environment and maintain sewer service to residents.
• Shoreline protection due to climate change.
Green Infrastructure • Commence the 30-year green infrastructure implementation outlook currently under
development as part of the Rain City Strategy. • Develop design standards to capture, manage and treat rainwater on-site to reduce
liquid waste at their source. • Perform detailed watershed and district-scale green infrastructure planning including the
development of supportive policies, guidelines, tools, and investing in pilot programs. Learnings will direct implementation over the longer-term.
• Given that the outcome would include new classes of city and private assets in providing an important drainage function, investments are needed to closely manage green infrastructure performance and policy outcomes.

DRAFT 2019-2022 CAPITAL PLAN
PAGE 60 OF 71
V. Draft 2019-2022 Capital Plan: ~$458 million The draft 2019-2022 Capital Plan excludes assets expected to be delivered through in-kind and through conditions of development. It also does not include the total capital needed to build new infrastructure capacity to support new population growth resulting through redevelopment. Growth-triggered upgrades not delivered through DCLs are generally secured through conditions of development. At this time, the DCL allocation for water, sewer and drainage infrastructure only partially funds the utility upgrades to support growth (40%). The City is currently developing a City-wide Utility DCL program to begin to address the tremendous growth pressures on the utilities (e.g. Cambie Corridor). Once implemented, any additional utilities work and associated funding will be incorporated in the Capital Plan.
Major renewal projects include:
• Renewal of 35 - 45 km of water distribution and transmission mains • Renewal of water connection, meter and hydrant assets at end of life • Renewal of 30 - 40 km of sewer mains • Plan, design, and refurbish or replace up to 4 pump stations • Construction of diking in East Fraserlands • 30 GI practices rehabilitated to level of service “A”
Major new/upgrade projects include: • New/upgraded sewer/water connections and meters for development • New water, sewer and drainage infrastructure to serve growth areas • Drinking water loss and demand management projects • Plan, design and replace the Thornton Pump Station • 140 new GI practices to manage and treat stormwater • Downspout disconnect program
In addition to the City delivered investments, major investment by Metro Vancouver include:
• Iona Wastewater Treatment Plant upgrade to secondary treatment by 2030
Existing New$ millions Subcategory Program / Major projects assets assets Total City Devt.* Partner
Distribution main renewals & upgrades ($60.3M, renew 30-40 km)Transmission main renewal & upgrades ($15.7M, renew ~5km)Maintenance & replacement of other water components ($6.6M)Water access, quality & conservation ($1.1M)Water connections renewals & upgrades ($23.2M, renew ~1,400)Water meters, new & renewals ($5.2M)One water: integrated utility planning initiative ($6.3M)Engineering & site investigation ($1.9M)
Strategic initiatives Resilience & demand management initiatives ($13.1M) 5.4 7.7 13.1 13.1 - -Subtotal 112.8 20.5 133.3 113.0 20.3 -
Sewer main renewal & upgrades ($137.2M, renew 30-40 km)Pump station renewals & upgrades ($25.4M, renew ~4)Maintenance & replacement of other sewer components ($14.3M)
Connections Sewer connections renewal & upgrades ($98.0M, renew ~1,000) 98.0 - 98.0 8.0 90.0 -Sewer monitoring systems ($3.4M)CCTV video inspection ($2.3M)Sewer catchment planning ($4.6M)System modeling ($2.3M)
Flood management Drainage studies/outfalls ($4.4M) 4.4 - 4.4 4.4 - -Shoreline protection EFL shoreline protection design ($9.7M) - 9.7 9.7 9.7 - -Subtotal 285.1 16.5 301.6 201.4 100.3 -
GI public realm implementation ($13.1M)GI asset renewal ($1.1M)Downspout disconnect program ($0.3M)
Water quality monitoring Water quality & GI monitoring program ($1.0M) - 1.0 1.0 1.0 - -GI planning Green infrastructure planning ($7.4M) - 7.4 7.4 3.9 3.5 -Subtotal 1.1 21.8 22.9 7.4 15.5 -
Total 399.0 58.8 457.8 321.7 136.0 -* Excludes infrastructure expected to be delivered in-kind or otherwise through conditions of development.
Drinkingwater
Greeninfrastructure
1.1 13.4 14.5
Sewerage & drainage
Water network 79.1 4.5 83.6
2.5GI implementation
- 6.8 6.8 4.6 2.3
8.2 8.2 -
5.7 - 5.7 5.7 -
177.0 - 177.0 169.0 8.0
Sewer planning
1.9 6.3 -
-
26.4 2.0 28.4 12.4 16.0
Who pays
-
-
12.0 -
-
4.3 -79.3
Sewer network
Connections & meters
Water planning
Sewer monitoring& inspections
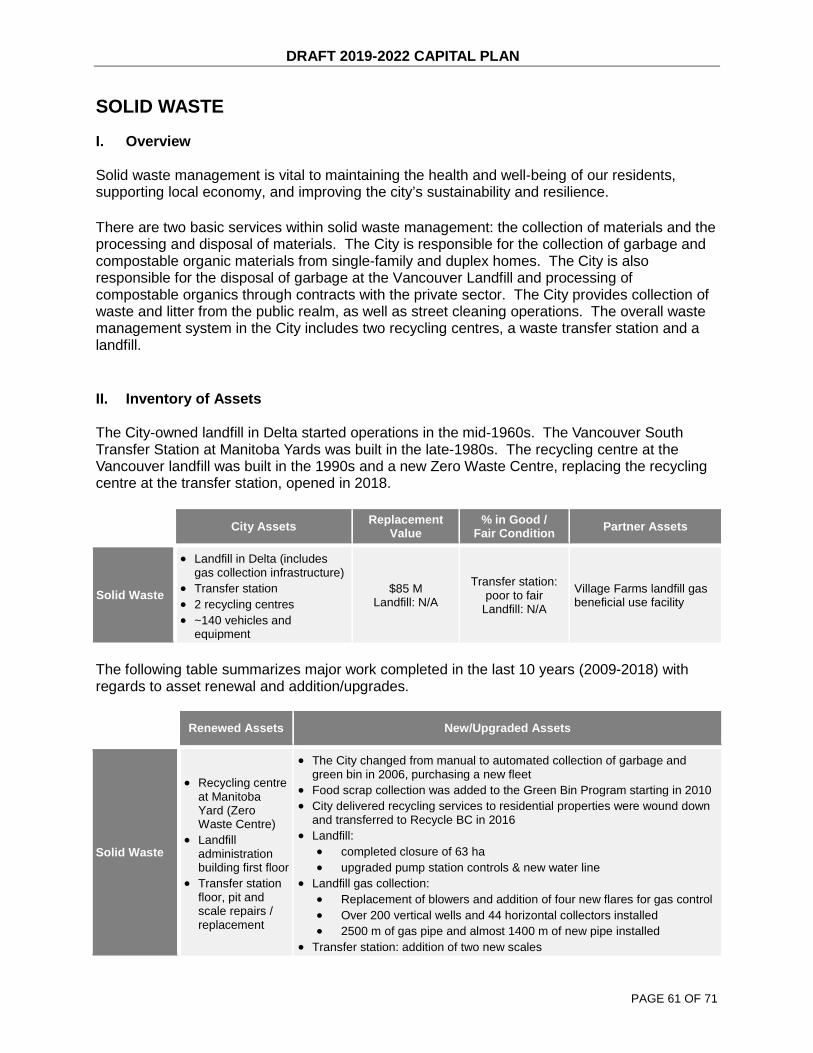
DRAFT 2019-2022 CAPITAL PLAN
PAGE 61 OF 71
SOLID WASTE
I. Overview Solid waste management is vital to maintaining the health and well-being of our residents, supporting local economy, and improving the city’s sustainability and resilience. There are two basic services within solid waste management: the collection of materials and the processing and disposal of materials. The City is responsible for the collection of garbage and compostable organic materials from single-family and duplex homes. The City is also responsible for the disposal of garbage at the Vancouver Landfill and processing of compostable organics through contracts with the private sector. The City provides collection of waste and litter from the public realm, as well as street cleaning operations. The overall waste management system in the City includes two recycling centres, a waste transfer station and a landfill. II. Inventory of Assets The City-owned landfill in Delta started operations in the mid-1960s. The Vancouver South Transfer Station at Manitoba Yards was built in the late-1980s. The recycling centre at the Vancouver landfill was built in the 1990s and a new Zero Waste Centre, replacing the recycling centre at the transfer station, opened in 2018.
City Assets Replacement Value
% in Good / Fair Condition Partner Assets
Solid Waste
• Landfill in Delta (includes gas collection infrastructure)
• Transfer station • 2 recycling centres • ~140 vehicles and
equipment
$85 M Landfill: N/A
Transfer station: poor to fair
Landfill: N/A
Village Farms landfill gas beneficial use facility
The following table summarizes major work completed in the last 10 years (2009-2018) with regards to asset renewal and addition/upgrades.
Renewed Assets New/Upgraded Assets
Solid Waste
• Recycling centre at Manitoba Yard (Zero Waste Centre)
• Landfill administration building first floor
• Transfer station floor, pit and scale repairs / replacement
• The City changed from manual to automated collection of garbage and green bin in 2006, purchasing a new fleet
• Food scrap collection was added to the Green Bin Program starting in 2010 • City delivered recycling services to residential properties were wound down
and transferred to Recycle BC in 2016 • Landfill:
• completed closure of 63 ha • upgraded pump station controls & new water line
• Landfill gas collection: • Replacement of blowers and addition of four new flares for gas control • Over 200 vertical wells and 44 horizontal collectors installed • 2500 m of gas pipe and almost 1400 m of new pipe installed
• Transfer station: addition of two new scales

DRAFT 2019-2022 CAPITAL PLAN
PAGE 62 OF 71
III. Long-term Vision
Societal and regulatory pressures will continue to focus on reducing the amount of waste we dispose and recovering the value from materials in the waste stream. Our long-term investment is guided by a number of strategies:
• The Greenest City 2020 Action Plan (2011) sets a goal of reducing the amount of solid waste going to landfill or incinerator by 50% from 2008 levels by 2020.
o Organic Wastes – Food scraps and food-soiled paper from Vancouver represent ~40% of garbage disposed to landfills or incinerators. To maximize diversion of compostable organic waste, as part of the Green Bin Program, the City collects yard trimmings, food scraps and food soiled paper from single-family and duplex homes. Multi-family residential buildings, businesses and institutional buildings are required to have programs in place and work with private sector haulers to divert compostable organics. This area will require additional focus in order to further maximize diversion in the future. Alternative approaches to recovering and managing organic materials will be required.
o Construction & Demolition Wastes – To significantly reduce the volume of construction, renovation, and demolition wastes disposed in the landfill or incinerator, the City implemented a program in 2014 requiring a minimum 75% reuse and recycling of demolition waste from pre-1940 homes, and 90% from pre-1940 homes with identified character features. Future focus will be on increasing the number of homes and buildings covered under green demolition and deconstruction requirements, supporting market development in the industry and recovering construction and demolition materials at the landfill for beneficial use.
• Zero Waste 2040 (in progress 2018) is a long-term strategy that guides future waste management investments to achieve the City’s zero waste goal. It provides a framework for Vancouver to reduce and ultimately eliminate waste disposed to landfill and incinerator by 2040.
IV. Strategy for the Next 10 Years Reduce the disposal of organics, and construction, and demolition materials:
• Installing a system to convert landfill gas to renewable natural gas. • Increase overall diversion of organics by promoting greater participation in food scraps
recycling programs covering all sectors. • Increase diversion at the landfill with a soil blending and aggregate processing facility
and other initiatives. • Divert waste from demolition, land clearing, and construction. • Support building deconstruction through permitting to ensure reuse and recycling • Support expansions to the City’s green demolition and deconstruction program through
by-law updates to ensure reuse and recycling. • Convene, collaborate, educate and support Vancouver as a community to focus on
waste prevention, reduction and material reuse.
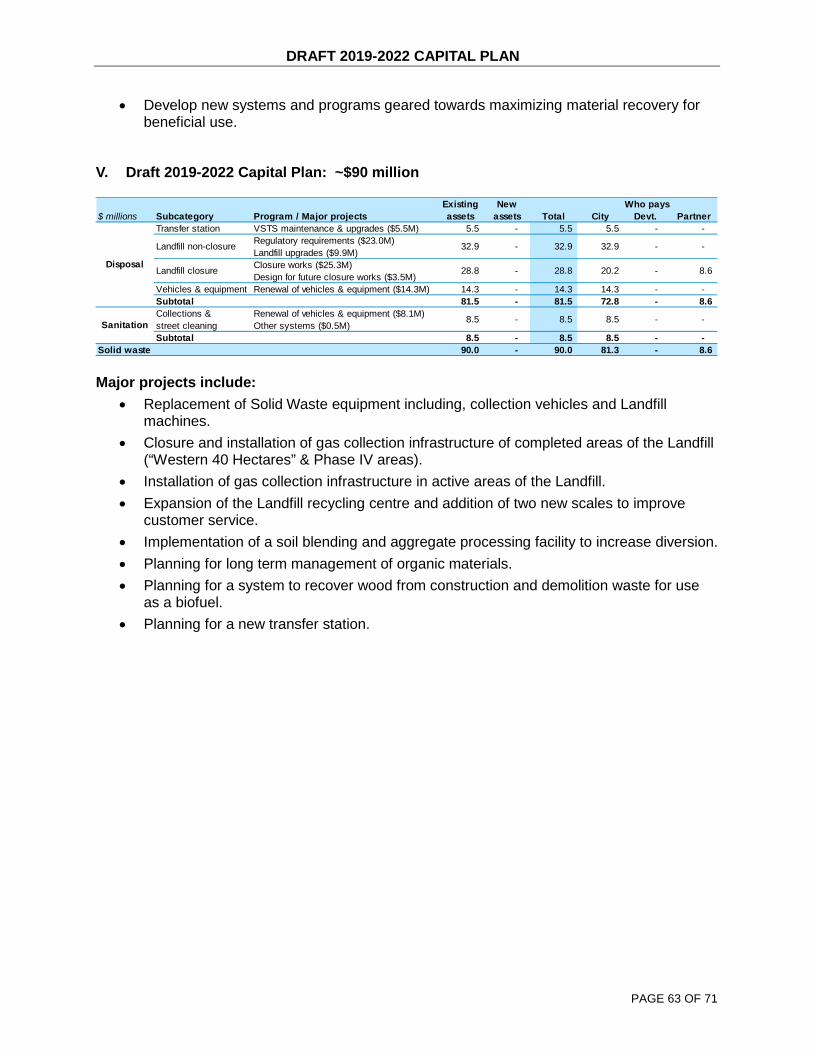
DRAFT 2019-2022 CAPITAL PLAN
PAGE 63 OF 71
• Develop new systems and programs geared towards maximizing material recovery for beneficial use.
V. Draft 2019-2022 Capital Plan: ~$90 million
Major projects include: • Replacement of Solid Waste equipment including, collection vehicles and Landfill
machines. • Closure and installation of gas collection infrastructure of completed areas of the Landfill
(“Western 40 Hectares” & Phase IV areas). • Installation of gas collection infrastructure in active areas of the Landfill. • Expansion of the Landfill recycling centre and addition of two new scales to improve
customer service. • Implementation of a soil blending and aggregate processing facility to increase diversion. • Planning for long term management of organic materials. • Planning for a system to recover wood from construction and demolition waste for use
as a biofuel. • Planning for a new transfer station.
Existing New$ millions Subcategory Program / Major projects assets assets Total City Devt. Partner
Transfer station VSTS maintenance & upgrades ($5.5M) 5.5 - 5.5 5.5 - -Regulatory requirements ($23.0M)Landfill upgrades ($9.9M)Closure works ($25.3M)Design for future closure works ($3.5M)
Vehicles & equipment Renewal of vehicles & equipment ($14.3M) 14.3 - 14.3 14.3 - -Subtotal 81.5 - 81.5 72.8 - 8.6
Renewal of vehicles & equipment ($8.1M)Other systems ($0.5M)
Subtotal 8.5 - 8.5 8.5 - -Solid waste 90.0 - 90.0 81.3 - 8.6
-8.5 - 8.5 8.5 -
28.8 - 28.8 20.2 - 8.6
Who pays
Disposal
Sanitation
32.9
Collections &street cleaning
Landfill closure
Landfill non-closure - 32.9 32.9 --

DRAFT 2019-2022 CAPITAL PLAN
PAGE 64 OF 71
RENEWABLE ENERGY FOR BUILDINGS
I. Overview The City has the aspirational goal of being the greenest city in the world by 2020 and achieving 100% renewable energy city-wide by 2050. This requires actions to improve energy efficiency and reduce energy consumption, along with actions to increase the supply and use of renewable energy. Actions are largely focused on the building energy use and transportation sectors, which are the major sources of carbon pollution. In Vancouver, 56% of all GHG emissions come from buildings, with the majority of emissions associated with heat and hot water use. Renewable energy technologies (e.g. geo-exchange systems, waste heat recovery, bio-fuels, solar energy) provide a means to supplement or replace conventional energy sources and thereby reduce GHG emissions. Renewable energy technologies can be implemented for individual homes and buildings, for clusters of buildings, or at the larger district or neighborhood scale. II. Inventory of Assets The City owns and operates the False Creek Neighbourhood Energy Utility (“NEU”), which has been operating since 2010 and utilizes waste heat recovered from sewage and bio-methane. There are also two fossil-fuel based neighbourhood energy systems owned by Provincial governmental agencies, and two systems owned by private utility operators.
City Assets Replacement Value
% in Good / Fair Condition Partner Assets
Neighborhood Energy
• 1 energy centre • 6 km of pipes • 33 transfer stations
$45M 100% • 2 systems owned by other
governments • 2 systems owned by private
utility providers The following table summarizes major work completed in the last 10 years (2009-2018) with regards to asset renewal and addition/upgrades.
Renewed Assets New/Upgraded Assets
Neighborhood Energy
• n/a (note: system started in 2010)
• 1 energy centre • 6 km of pipes • 33 transfer stations
III. Long-term Vision City Council has approved a number of policies and strategies to reduce energy consumption, increase the use of renewable energy, and greenhouse gas emissions:
• The Greenest City 2020 Action Plan (2011) aims at reducing carbon, reducing waste, and supporting healthy ecosystems.

DRAFT 2019-2022 CAPITAL PLAN
PAGE 65 OF 71
• The Renewable City Strategy (2015) sets a target of 100% reliance on renewable energy by 2050 and for new construction to be zero emissions by 2030.
• The Zero Emissions Building Plan (2016) outlines two pathways to achieve low-carbon new construction: through high performance buildings and low-carbon energy systems.
• The Strategic Approach to Neighbourhood Energy (2012) targets the conversion of existing fossil fuel based steam heat systems to renewable energy and the deployment of new renewable energy systems for high-density neighborhoods.
• Other policies include the Green Buildings Policy for Rezoning, the Rezoning Policy for Large Developments (2010), zoning relaxations for the Passive House standard, and green demolition practices.
• The Vancouver Building By-law is regularly updated to require more efficient and sustainable construction. As sustainability regulations and policies develop city-wide, more stringent requirements will apply as we transition buildings to no longer be dependent on fossil fuels.
IV. Strategy for the Next 10 Years In accordance with the Renewable City Strategy, key requirements include reducing demand for energy and increasing the supply and use of renewable energy. Low Carbon Energy System Recognizing that compact mixed-use communities provide an ideal context for neighborhood energy systems, the City will take the following actions:
• Continue to expand the City-owned False Creek NEU to areas of Mount Pleasant, the False Creek Flats and NE False Creek, and transition the utility towards 100% renewable energy supply.
• Continue policy support for the conversion of existing fossil-fuel based district energy systems that are owned by other parties to renewable fuel sources.
• Continue policy support to encourage investments by other parties in low carbon energy systems to serve areas of the Cambie Corridor, the Downtown, River District and other high density development sites.
Low- & Zero Emission Buildings Designing and constructing buildings to use less energy, less water, healthier materials, and improved indoor environmental quality help maximize energy efficiency and the health performance of buildings.
• Maximize energy efficiency and low-GHG performance of all buildings. • Subject all new buildings to the green building requirements in the Vancouver Building
Bylaw. • Subject all rezoning projects to the Green Buildings Policy for Rezoning.
Building Retrofits Due to poor energy efficiency performance and reliance on fossil fuels, older buildings consume more energy and have greater GHG emissions than newer buildings. Energy retrofit upgrades to homes and businesses can enable the city to reduce its total carbon footprint over time as it grows and evolves. Key actions include:
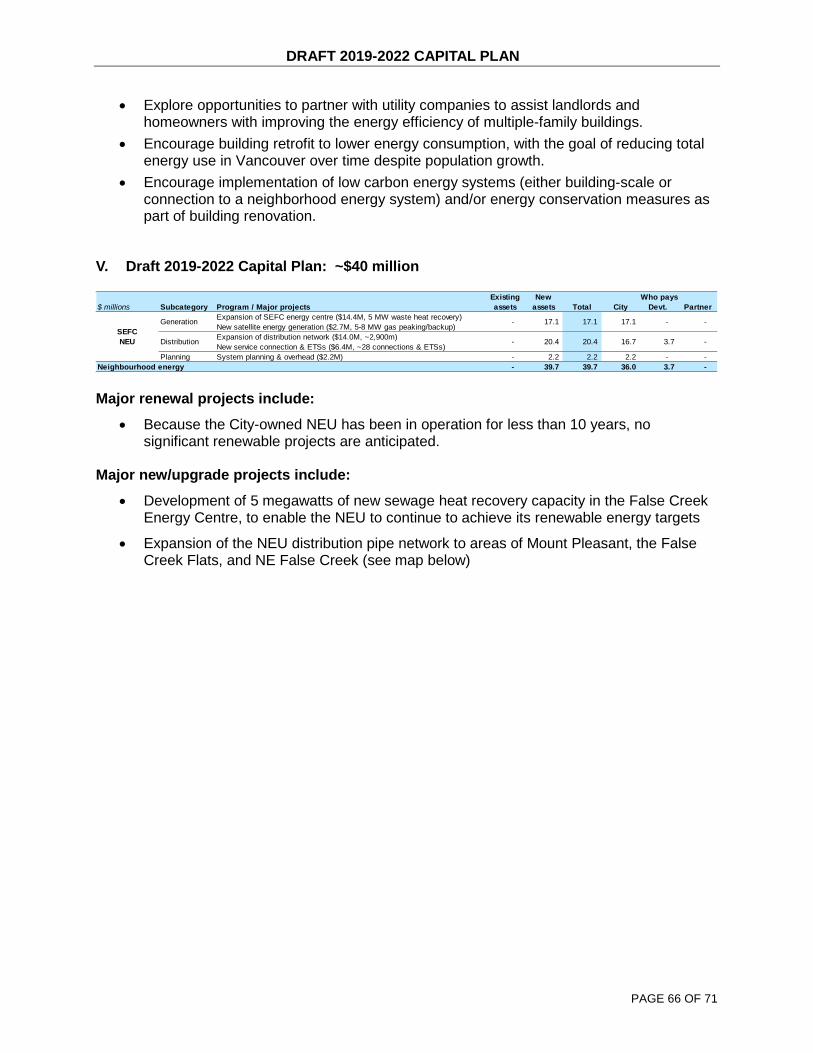
DRAFT 2019-2022 CAPITAL PLAN
PAGE 66 OF 71
• Explore opportunities to partner with utility companies to assist landlords and homeowners with improving the energy efficiency of multiple-family buildings.
• Encourage building retrofit to lower energy consumption, with the goal of reducing total energy use in Vancouver over time despite population growth.
• Encourage implementation of low carbon energy systems (either building-scale or connection to a neighborhood energy system) and/or energy conservation measures as part of building renovation.
V. Draft 2019-2022 Capital Plan: ~$40 million
Major renewal projects include:
• Because the City-owned NEU has been in operation for less than 10 years, no significant renewable projects are anticipated.
Major new/upgrade projects include:
• Development of 5 megawatts of new sewage heat recovery capacity in the False Creek Energy Centre, to enable the NEU to continue to achieve its renewable energy targets
• Expansion of the NEU distribution pipe network to areas of Mount Pleasant, the False Creek Flats, and NE False Creek (see map below)
Existing New$ millions Subcategory Program / Major projects assets assets Total City Devt. Partner
Expansion of SEFC energy centre ($14.4M, 5 MW waste heat recovery)New satellite energy generation ($2.7M, 5-8 MW gas peaking/backup)Expansion of distribution network ($14.0M, ~2,900m)New service connection & ETSs ($6.4M, ~28 connections & ETSs)
Planning System planning & overhead ($2.2M) - 2.2 2.2 2.2 - -Neighbourhood energy - 39.7 39.7 36.0 3.7 -
-Distribution
Who pays
SEFCNEU
Generation - 17.1 17.1 17.1 - -
- 20.4 20.4 16.7 3.7

DRAFT 2019-2022 CAPITAL PLAN
PAGE 67 OF 71
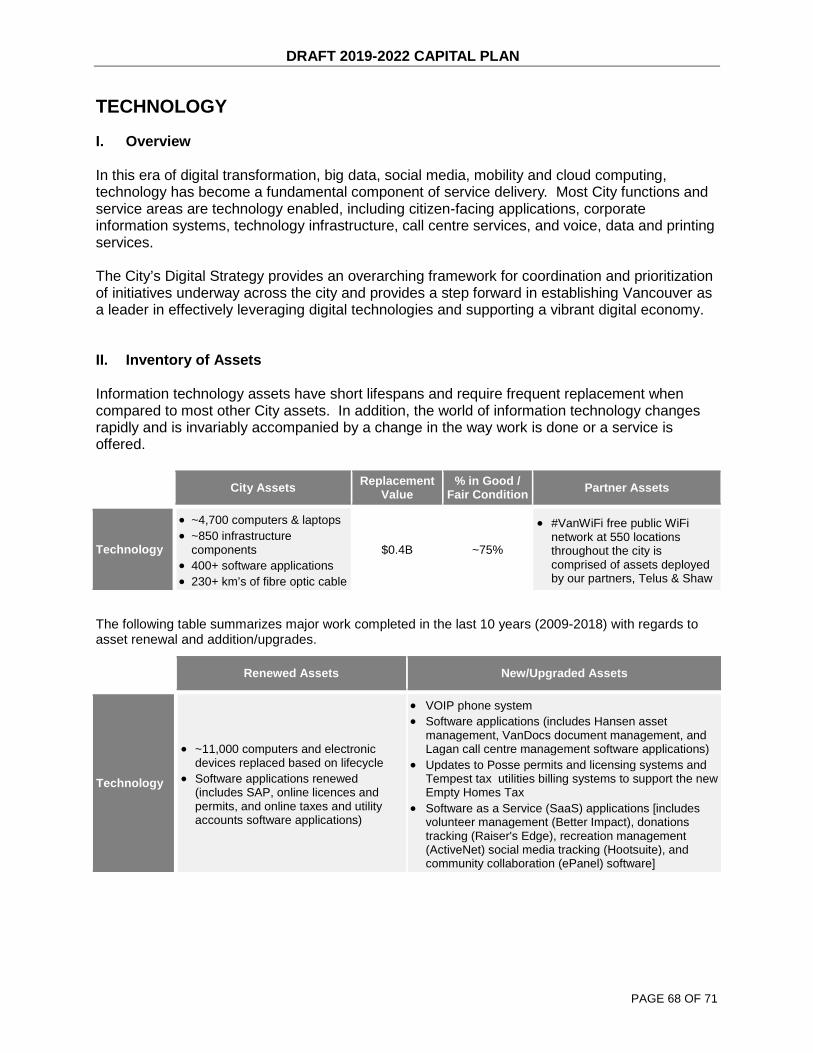
DRAFT 2019-2022 CAPITAL PLAN
PAGE 68 OF 71
TECHNOLOGY
I. Overview In this era of digital transformation, big data, social media, mobility and cloud computing, technology has become a fundamental component of service delivery. Most City functions and service areas are technology enabled, including citizen-facing applications, corporate information systems, technology infrastructure, call centre services, and voice, data and printing services. The City’s Digital Strategy provides an overarching framework for coordination and prioritization of initiatives underway across the city and provides a step forward in establishing Vancouver as a leader in effectively leveraging digital technologies and supporting a vibrant digital economy. II. Inventory of Assets Information technology assets have short lifespans and require frequent replacement when compared to most other City assets. In addition, the world of information technology changes rapidly and is invariably accompanied by a change in the way work is done or a service is offered.
City Assets Replacement Value
% in Good / Fair Condition Partner Assets
Technology
• ~4,700 computers & laptops • ~850 infrastructure
components • 400+ software applications • 230+ km’s of fibre optic cable
$0.4B ~75%
• #VanWiFi free public WiFi network at 550 locations throughout the city is comprised of assets deployed by our partners, Telus & Shaw
The following table summarizes major work completed in the last 10 years (2009-2018) with regards to asset renewal and addition/upgrades.
Renewed Assets New/Upgraded Assets
Technology
• ~11,000 computers and electronic devices replaced based on lifecycle
• Software applications renewed (includes SAP, online licences and permits, and online taxes and utility accounts software applications)
• VOIP phone system • Software applications (includes Hansen asset
management, VanDocs document management, and Lagan call centre management software applications)
• Updates to Posse permits and licensing systems and Tempest tax utilities billing systems to support the new Empty Homes Tax
• Software as a Service (SaaS) applications [includes volunteer management (Better Impact), donations tracking (Raiser's Edge), recreation management (ActiveNet) social media tracking (Hootsuite), and community collaboration (ePanel) software]

DRAFT 2019-2022 CAPITAL PLAN
PAGE 69 OF 71
III. Long-term Vision As technology continues to become a key enabler for City departments, the shared services model will continue to develop and evolve to ensure the smooth running and maintenance of critical infrastructure coupled with flexible business models to enable the timely delivery of new technologies. Technology Services will proactively partner with the City’s business units to deliver strategic initiatives that support business objectives, identifying solutions to increase operational efficiency, increase the availability of data for decision making and improve the user experience for members of the public when interacting with the City over digital channels. IV. Strategy for the Next 10 Years The City’s digital strategy laid the foundation to increase the technology maturity of the city. The 2015-2018 Capital Plan focussed on foundational capabilities and the introduction of an enterprise culture. Future Capital Plans will ensure that the technology core of the city is maintained, and that transformation in the back office and multichannel service delivery models continues. It is also a key goal to enhance the City’s data and analytics capabilities with a corporate enterprise data strategy. As data and connectivity improvements are delivered in the near term, the City will be enabled to adapt to the multiple emerging technologies on the horizon for the next decade such as the Internet of Things, Smart Mobility, Augmented and Virtual Reality, Machine Learning and Artificial Intelligence. V. Draft 2019-2022 Capital Plan: ~$100 million
Major renewal projects include:
• Major Microsoft Upgrade from Office 2010 as well as upgrade to Windows 10 • Upgrades to key support systems such as Lagan, Amanda, Tempest, Fairfax, Posse, • Modernization of software development tools that support the city’s ~400 custom built
applications • End of Life infrastructure replacement for City of Vancouver, Vancouver Public Library
and Vancouver Police Department • GIS Renewal • Content Management System
Major new/upgrade projects include:
• Data centre resilience and relocation project • Cybersecurity and network investment • Enterprise Data and Analytics • Operating Technologies and Critical Infrastructure Improvements
Existing New$ millions Subcategory Program / Major projects assets assets Total City Devt. Partner
Maintenance & upgrades of IT systems & infrastructure ($75.0M)Technology transformation ($25.0M)
Technology 71.0 29.0 100.0 100.0 - -
-
Who pays
Digital 71.0 29.0 100.0 100.0 -
DRAFT 2019-2022 CAPITAL PLAN
PAGE 70 OF 71
RESILIENCE: CLIMATE CHANGE ADAPTATION & FLOOD PROTECTION
I. Overview Increased flooding from heavy rainfall, health impacts from hotter and drier summers, and coastal flooding from sea level rise are some of the anticipated impacts of climate change. Building resilience requires new approaches to designing and maintaining infrastructure, and enhancing people connections in the community to respond to and recover from climate-related events. II. Long-term Vision The City is preparing for the impacts of climate change that Vancouver is likely to experience: increased frequency and intensity of rain and wind storms; hotter, drier summers; and more frequent and severe flooding as a result of sea level rise. Pursuing flood resilience creates opportunities to enhance livability and recreation, enhance our ecological assets, improve business operations, and build a long-lasting community.
• The Climate Change Adaptation Strategy (2012) details actions that will increase the resilience of city-wide programs, services, and infrastructure to existing and anticipated climate extremes. Primary actions focus on incorporating adaptation as a consideration in existing and planned projects.
• The Integrated Rainwater Management Plan (2016) aims to treat Vancouver’s abundant rainwater as a resource. The plan seeks to reduce the demand for potable water by encouraging beneficial reuse, and to restore the role of urban watersheds to support urban and natural ecosystems and provide clean water.
• The Rain City Strategy (in progress 2018) focuses on valuing rainwater as a resource and goals around water quality, resilience and livability. The plan, with an outlook to 2050, will define a long-term plan for Green Infrastructure to guide the application of sustainable urban rainwater management in future community and infrastructure planning.
According to the Coastal Flood Risk Assessment, there are several areas in Vancouver that are vulnerable now or in the near future to flooding and sea level rise. These areas include the Fraser River shoreline, the Waterfront Road area, and low-lying areas near Jericho and Locarno beach. These lower floodplain areas are vulnerable to flooding from major coastal storms under current and future sea level rise projections over the coming decades. To address this, flood resilience will need to be integrated into the fabric of the waterfront and nearby developments.
• Integrate engineered flood management solutions into the road, park, and public spaces in the floodplain area and along the shoreline
• Build new flood management solutions to meet City standards that incorporate sea level rise projections
In addition, green space, vegetation, and permeable surfaces can be used to detain and infiltrate stormwater during heavy rainfall, thereby decreasing the stress on our stormwater system. They can also help keep the city cooler in the summer by providing shade refuge, a healthier environment, and lowering the need for air conditioning.
DRAFT 2019-2022 CAPITAL PLAN
PAGE 71 OF 71
III. Strategy for the Next 10 Years Strategies to support climate change adaptation and flood protection:
• Complete a flood management strategy for the shoreline, including engaging with diverse stakeholders across the city and specifically in flood-vulnerable areas and developing innovative design solutions to enhance resilience
• Meet flood construction levels and implement flood-resilient design in flood-prone areas
o Ensure all new developments meet or exceed the 4.6 m (Greater Vancouver Regional District datum) Flood Construction Levels specified by the Vancouver Building By-law
o Ensure no residential levels or critical infrastructure is placed below the Flood Construction Level
o Encourage buildings in a designated floodplain area to consider additional flood defense design approaches
o Ensure flood protection is designed to such that it could be raised or adapted to accommodate an additional metre in the future
o Build flood management infrastructure (e.g. seawall) to the appropriate structural standards
o Design flood management infrastructure to enhance public realm and improve shoreline habitats
• Integrate increased canopy cover, green spaces, potable water conservation, and green
stormwater infrastructure measures (e.g. rain gardens) in public and private realms o Plant shade trees where appropriate o Provide generous tree canopy o Encourage a diversity of tree species for resiliency o Use species that are hardy to changing climate conditions o Design landscapes to be drought tolerant and resilient to climate variability with
minimal irrigation needs • Ensure generous public access to drinking water to aid in cooling during dry, hot
summer conditions
Long-Term Capital Planning Consultation Summary
May 2018
BUILDING THE CITY OF TODAY & TOMORROW
APPENDIX B

2
Capital planning process
Long-term strategies & plans
Public Engagement
10 Year Capital
Strategic Outlook
4 Year Draft
Capital Plan
4 Year Final
Capital Plan
1 Year Capital Budget
Public Engagement
ROUND 2
Public Engagement
ROUND 1
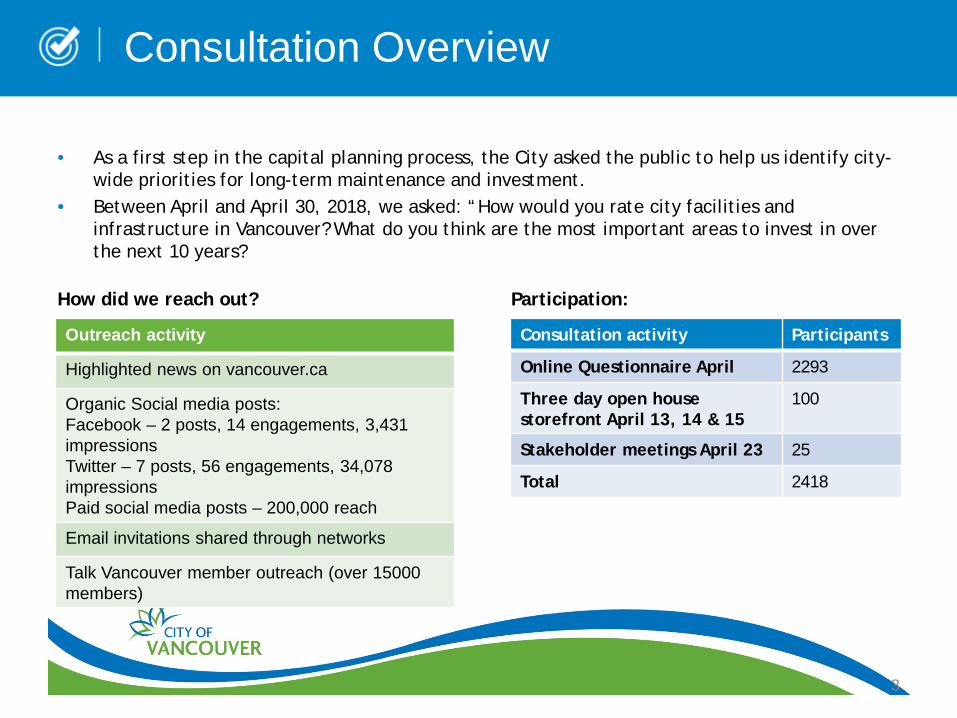
3
Consultation Overview
• As a first step in the capital planning process, the City asked the public to help us identify city-wide priorities for long-term maintenance and investment.
• Between April and April 30, 2018, we asked: “How would you rate city facilities and infrastructure in Vancouver? What do you think are the most important areas to invest in over the next 10 years?
How did we reach out? Participation:
Consultation activity Participants
Online Questionnaire April 2293
Three day open house storefront April 13, 14 & 15
100
Stakeholder meetings April 23 25
Total 2418
Outreach activity
Highlighted news on vancouver.ca
Organic Social media posts: Facebook – 2 posts, 14 engagements, 3,431 impressions Twitter – 7 posts, 56 engagements, 34,078 impressions Paid social media posts – 200,000 reach
Email invitations shared through networks
Talk Vancouver member outreach (over 15000 members)
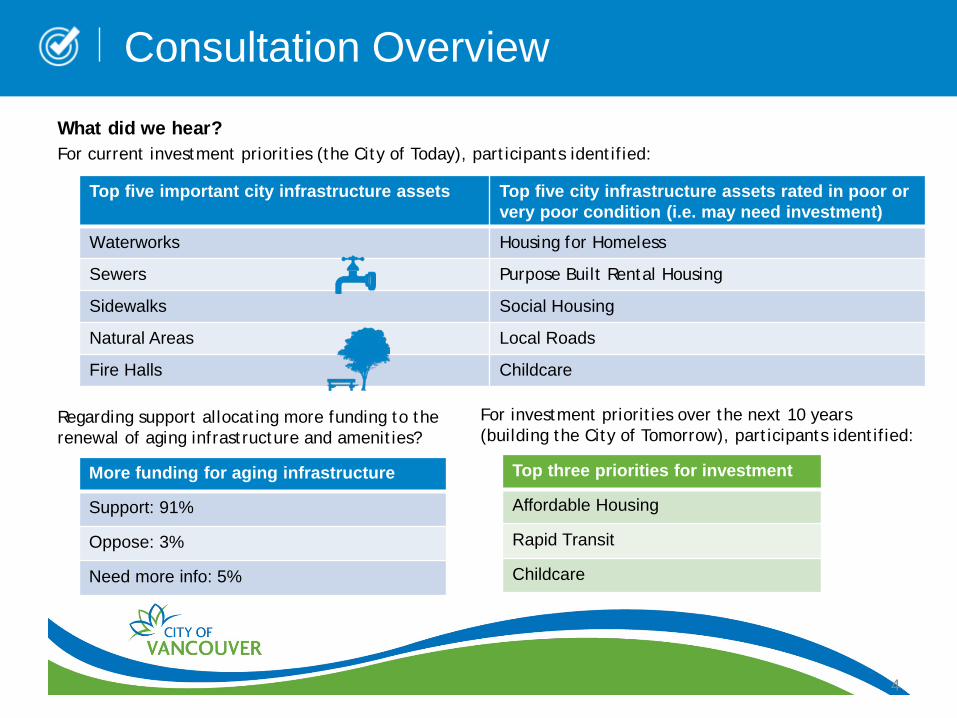
4
Consultation Overview
What did we hear? For current investment priorities (the City of Today), participants identified:
Top five important city infrastructure assets Top five city infrastructure assets rated in poor or very poor condition (i.e. may need investment)
Waterworks Housing for Homeless
Sewers Purpose Built Rental Housing
Sidewalks Social Housing
Natural Areas Local Roads
Fire Halls Childcare
Top three priorities for investment
Affordable Housing
Rapid Transit
Childcare
For investment priorities over the next 10 years (building the City of Tomorrow), participants identified:
More funding for aging infrastructure
Support: 91%
Oppose: 3%
Need more info: 5%
Regarding support allocating more funding to the renewal of aging infrastructure and amenities?
Summary of Feedback at Events
6
Consultation Approach
APPROACH • The first phase of consultation is intended to identify public and stakeholder priorities now and
in future. City staff are in regular conversation with residents and stakeholders about capital investments – both for new and existing infrastructure - through a variety of processes.
• These processes can include community planning, Park Board park and facilities planning, and ongoing engineering initiatives including transportation, streets and parking.
• The focused Capital Plan process offers a number of opportunities for staff to take a temperature check on community experiences of infrastructure / facilities and stakeholder knowledge of current and future community needs.
• Public input is one form of data, alongside technical, economic and policy direction that help forge the quarterly Capital Plan.

7
Consultation Approach
PHASES OF CONSULTATION • The first phase of consultation, which ran throughout April 2018, sought to broadly identify
priorities and to probe into specific areas of interest by stakeholder groups. A survey coupled with a three-day storefront open house and an invitational stakeholder meeting surfaced high-level themes, and emerging priorities. This information was used to help shape a draft capital plan.
• The second phase of consultation, which will run from mid- May until June 2018, will test
public, business and stakeholder responses to the draft capital plan. This consultation will include more opportunities to comment via open houses at Vancouver Public Library, 6-8 focused meetings with stakeholder groups, particularly those who may experience barriers to participation. It will also involve quantitative and qualitative research with a third party opinion research firm that will probe responses to the draft plan among representative resident and business audiences.
SHIFT FROM LAST CAPITAL PLAN • The team continues to explore improvements to the engagement process. We doubled the
number of touchpoints in this first phase from the last plan, and will continue to improve the breadth and depth of our dialogues with community.
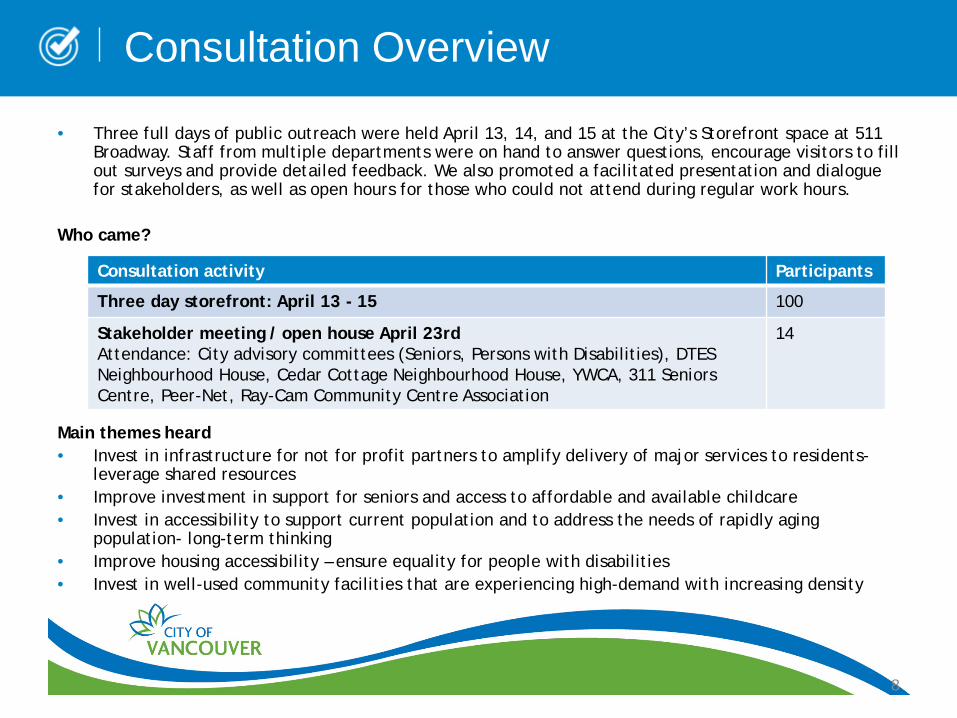
8
Consultation Overview
• Three full days of public outreach were held April 13, 14, and 15 at the City’s Storefront space at 511Broadway. Staff from multiple departments were on hand to answer questions, encourage visitors to fillout surveys and provide detailed feedback. We also promoted a facilitated presentation and dialoguefor stakeholders, as well as open hours for those who could not attend during regular work hours.
Who came?
Main themes heard • Invest in infrastructure for not for profit partners to amplify delivery of major services to residents-
leverage shared resources• Improve investment in support for seniors and access to affordable and available childcare• Invest in accessibility to support current population and to address the needs of rapidly aging
population- long-term thinking• Improve housing accessibility – ensure equality for people with disabilities• Invest in well-used community facilities that are experiencing high-demand with increasing density
Consultation activity Participants
Three day storefront: April 13 - 15 100
Stakeholder meeting / open house April 23rd Attendance: City advisory committees (Seniors, Persons with Disabilities), DTES Neighbourhood House, Cedar Cottage Neighbourhood House, YWCA, 311 Seniors Centre, Peer-Net, Ray-Cam Community Centre Association
14

Questionnaire Topline Results

10
• The questionnaire ran from April 12 to April 30, 2018.• A total of 2293 respondents completed the questionnaire. The questionnaire was accessed in
the following ways:• Direct invitation to Talk Vancouver panel members.• Open invitation to non-members via the Capital Planning project page on the City of
Vancouver website.
Who did we hear from? • Almost three-quarters (71%) of respondents were between the ages of 30 and 64 (an almost equal
split of 33% aged 30-44 and 38% aged 45-64).
• There is a fairly even gender split – 47% male and 46% female (with other identities or non-disclosure making up the remainder).
• One-third of respondents (27%) have children in their household.
• More than half of respondents (55%) are homeowners, while 38% rent.
Is the questionnaire sample representative of Vancouver’s population? • The table on the following slide illustrates how the demographic characteristics compare to those
of the population of Vancouver according to the most recent Statistics Canada data available.
Questionnaire overview
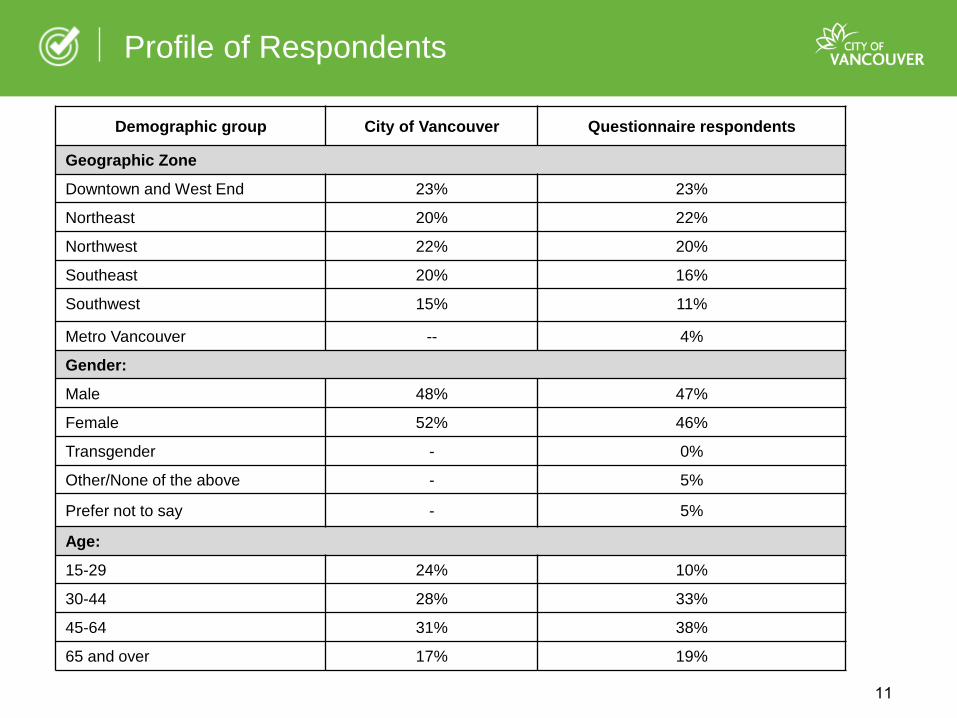
Profile of Respondents
Demographic group City of Vancouver Questionnaire respondents
Geographic Zone
Downtown and West End 23% 23%
Northeast 20% 22%
Northwest 22% 20%
Southeast 20% 16%
Southwest 15% 11%
Metro Vancouver -- 4%
Gender:
Male 48% 47%
Female 52% 46%
Transgender - 0%
Other/None of the above - 5%
Prefer not to say - 5%
Age:
15-29 24% 10%
30-44 28% 33%
45-64 31% 38%
65 and over 17% 19%
11

12
Profile of Respondents Cont.
Demographic group City of Vancouver Questionnaire respondents
Children:
Children in household 33% 27%
Home ownership:
Homeowners 57% 55%
Renters 43% 38%
Other - 8%
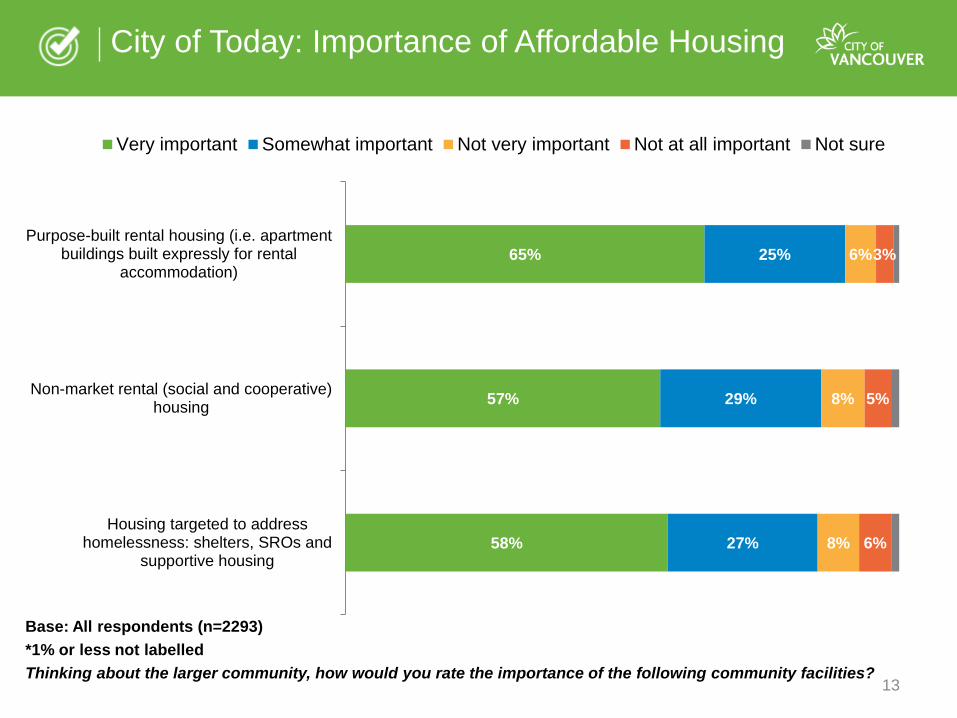
13
City of Today: Importance of Affordable Housing
65%
57%
58%
25%
29%
27%
6%
8%
8%
3%
5%
6%
Purpose-built rental housing (i.e. apartmentbuildings built expressly for rental
accommodation)
Non-market rental (social and cooperative)housing
Housing targeted to addresshomelessness: shelters, SROs and
supportive housing
Very important Somewhat important Not very important Not at all important Not sure
Base: All respondents (n=2293) *1% or less not labelledThinking about the larger community, how would you rate the importance of the following community facilities?
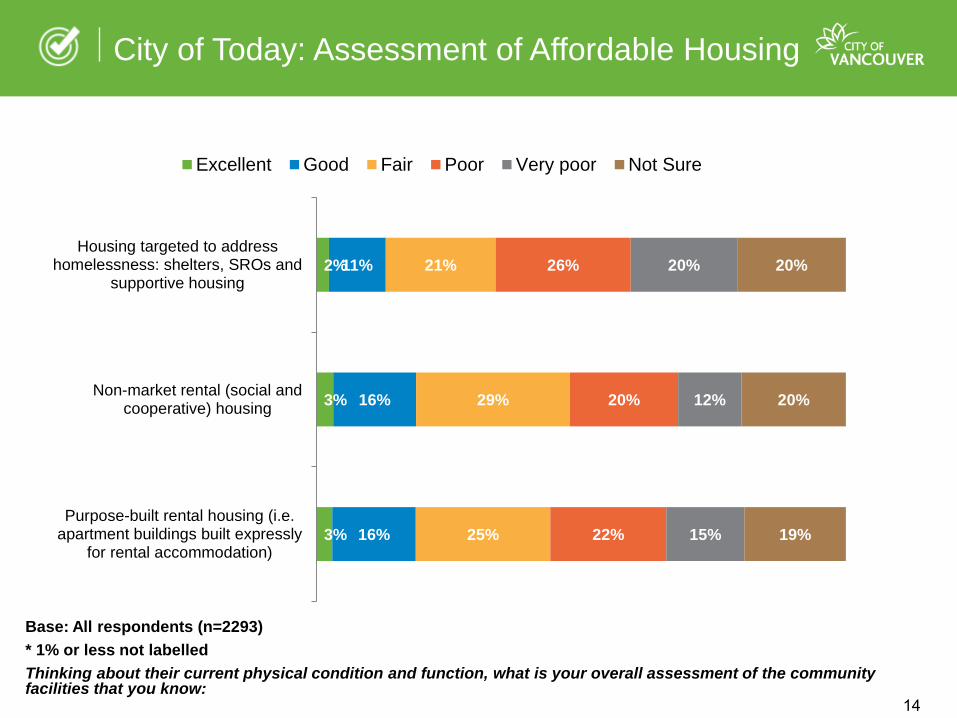
City of Today: Assessment of Affordable Housing
Base: All respondents (n=2293) * 1% or less not labelledThinking about their current physical condition and function, what is your overall assessment of the community facilities that you know:
3%
3%
2%
16%
16%
11%
25%
29%
21%
22%
20%
26%
15%
12%
20%
19%
20%
20%
Purpose-built rental housing (i.e.apartment buildings built expressly
for rental accommodation)
Non-market rental (social andcooperative) housing
Housing targeted to addresshomelessness: shelters, SROs and
supportive housing
Excellent Good Fair Poor Very poor Not Sure
14

15
City of Today: Importance of Community Facilities
69%
60%
62%
45%
46%
27%
30%
27%
44%
41%
3%
7%
5%
10%
9%
2%
3%
2%
3%
Community centres
Libraries
Childcare facilities
Pools and rinks
Cultural facilities, e.g. theatres andmuseums
Very important Somewhat important Not very important Not at all important Not sure
Base: All respondents (n=2293) * 1% or less not labelledThinking about the larger community, how would you rate the importance of the following community facilities?

10%
8%
4%
18%
12%
46%
39%
18%
52%
51%
27%
29%
23%
24%
26%
7%
7%
11%
3%
5%
2%
3%
4%
1%
1%
8%
14%
41%
3%
4%
Cultural facilities, e.g. theatres andmuseums
Pools and rinks
Childcare facilities
Libraries
Community Centres
Excellent Good Fair Poor Very poor Not Sure
City of Today: Assessment of Community Facilities
Base: All respondents (n=2293) * 1% or less not labelledThinking about their current physical condition and function, what is your overall assessment of the community facilities that you know:
16

73%
76%
52%
34%
24%
21%
39%
48%
2%
2%
6%
14%
2%
3%
Seawall and trails
Natural areas, e.g. forest and ponds
Children’s playgrounds
Sport facilities, e.g. soccer and basketball
Very important Somewhat important Not very important Not at all important Not sure
City of Today: Importance of Park Facilities
Base: All respondents (n=2293) * 1% or less not labelledThinking about the larger community, how would you rate the importance of the following park facilities?
17

City of Today: Assessment of Park Facilities
Base: All respondents (n=2293) * 1% or less not labelledThinking about their current physical condition and function, what is your overall assessment of the park features that you know:
33%
20%
13%
11%
53%
52%
42%
42%
11%
20%
23%
22%
4%
5%
4%
3%
16%
20%
Seawall and trails
Natural areas, e.g. forest andponds
Children’s playgrounds
Sport facilities, e.g. soccerand basketball
Excellent Good Fair Poor Very poor Not Sure
18

84%
60%
49%
61%
41%
14%
33%
40%
28%
31%
6%
8%
7%
17%
2%
2%
10%
Sidewalks and walking paths
Bus stops & shelters ** Buses andSkyTrain are managed by TransLink
Local roads
Major roads
Bikeways
Very important Somewhat important Not very important Not at all important Not sure
City of Today: Importance of Transportation Facilities
Base: All respondents (n=2293) * 1% or less not labelledThinking about the larger community, how would you rate the importance of the following transportation networks managed by the City?
19

City of Today: Assessment of Transportation Facilities
Base: All respondents (n=2293) * 1% or less not labelledThinking about their current physical condition and function, what is your overall assessment of the transportation networks that you know:
14%
6%
6%
10%
32%
50%
42%
34%
48%
42%
27%
37%
37%
27%
16%
7%
9%
14%
7%
3%
2%
3%
7%
5%
3%
3%
4%
6%
Sidewalks and walking paths
Bus stops & shelters ** Buses andSkyTrain are managed by
TransLink
Local roads
Major roads
Bikeways
Excellent Good Fair Poor Very poor Not Sure
20
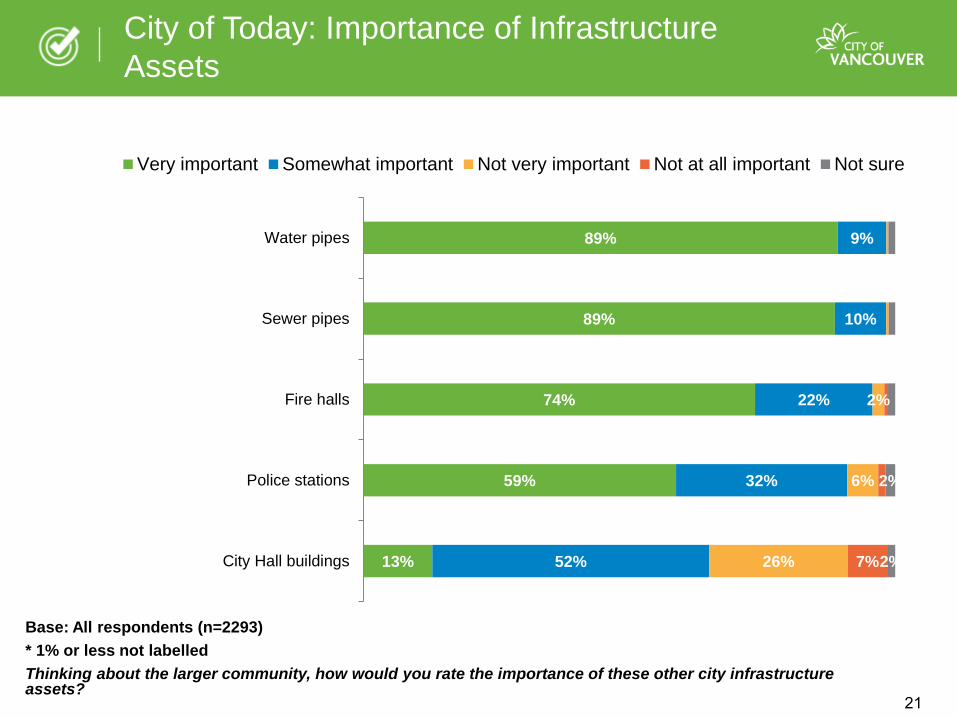
89%
89%
74%
59%
13%
9%
10%
22%
32%
52%
2%
6%
26% 7%
2%
2%
Water pipes
Sewer pipes
Fire halls
Police stations
City Hall buildings
Very important Somewhat important Not very important Not at all important Not sure
City of Today: Importance of Infrastructure Assets
Base: All respondents (n=2293) * 1% or less not labelledThinking about the larger community, how would you rate the importance of these other city infrastructure assets?
21
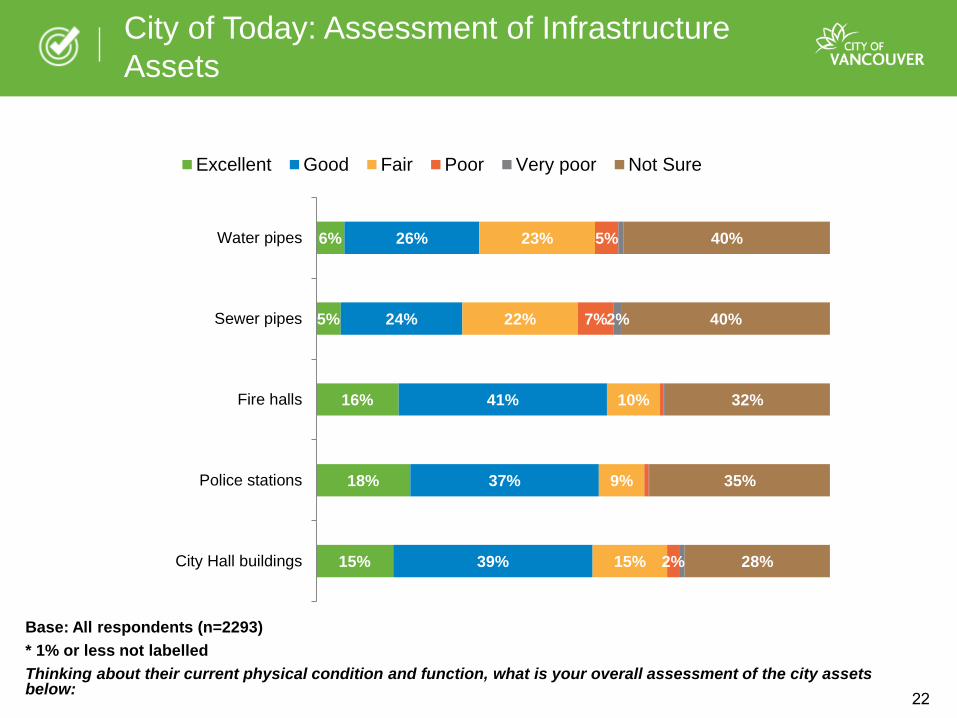
City of Today: Assessment of Infrastructure Assets
Base: All respondents (n=2293) * 1% or less not labelledThinking about their current physical condition and function, what is your overall assessment of the city assets below:
6%
5%
16%
18%
15%
26%
24%
41%
37%
39%
23%
22%
10%
9%
15%
5%
7%
2%
2%
40%
40%
32%
35%
28%
Water pipes
Sewer pipes
Fire halls
Police stations
City Hall buildings
Excellent Good Fair Poor Very poor Not Sure
22

60%
31%
2%
2%
5%
Strongly support
Somewhat support
Somewhat oppose
Strongly oppose
Need more information
23
City of Today: Support Allocation of More Funding to Aging Infrastructure and Amenities
Base: All respondents (n=2293) To what extent do you support allocating more funding to the renewal of aging infrastructure and amenities?
91% Support

54%
58%
35%
16%
15%
15%
17%
29%
19%
34%
35%
32%
30%
27%
14%
14%
24%
46%
49%
47%
38%
3%
4%
3%
3%
5%
10%
5%
3%
2%
8%
Rapid Transit
Affordable Housing
Childcare
Community Facilities
Parks
Public Safety
Walking & Cycling
Substantially more than today Somewhat more than today About the same as todaySomewhat less than today Substantially less than today
City of Tomorrow: Investment in Infrastructure
Base: All respondents (n=2293) * 1% or less not labelledThinking about Vancouver’s needs in 10 years, how would you invest in the areas below? Would you invest more, less or about the same when compared to today:
24
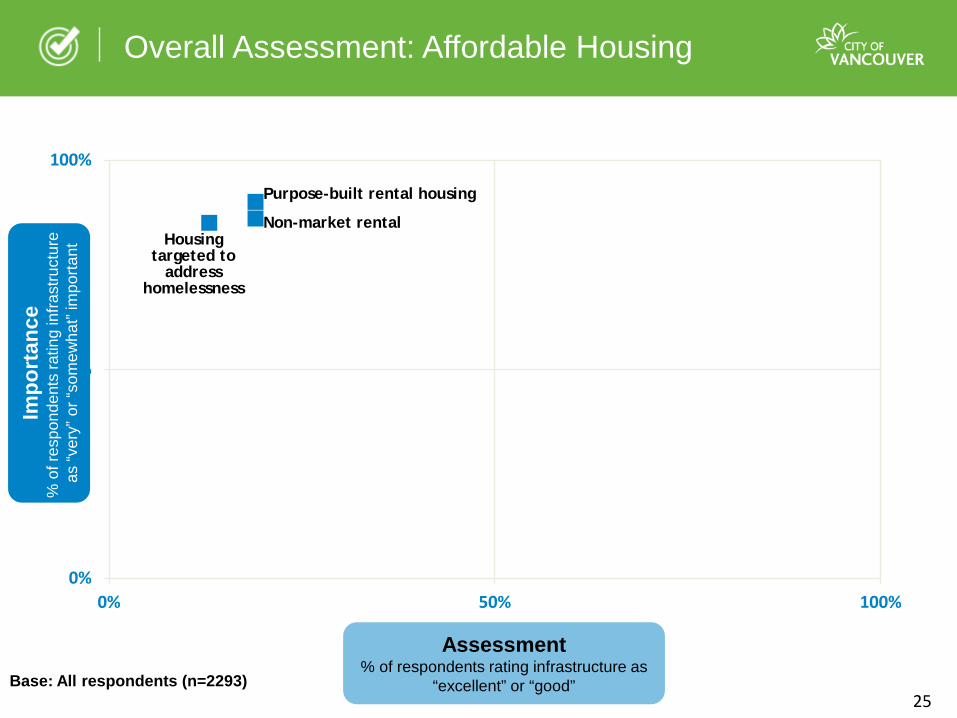
0%
50%
100%
0% 50% 100%
Housing targeted to
address homelessness
Overall Assessment: Affordable Housing
Purpose-built rental housing
Non-market rental
Base: All respondents (n=2293)
Assessment % of respondents rating infrastructure as
“excellent” or “good”
Impo
rtan
ce
% o
f res
pond
ents
ratin
g in
frast
ruct
ure
as “v
ery”
or “
som
ewha
t” im
porta
nt
25

0%
50%
100%
0% 50% 100%
Pools and rinks
Overall Assessment: Community Facilities
Base: All respondents (n=2293)
Assessment % of respondents rating infrastructure as
“excellent” or “good”
Impo
rtan
ce
% o
f res
pond
ents
ratin
g in
frast
ruct
ure
as “v
ery”
or “
som
ewha
t” im
porta
nt
Childcare facilities
Cultural facilities
Community centres
Libraries
26

0%
50%
100%
0% 50% 100%
Overall Assessment: Parks
Seawall and trails Natural
areas Children’s playgrounds
Sport facilities
Base: All respondents (n=2293)
Assessment % of respondents rating infrastructure
as “excellent” or “good”
Impo
rtan
ce
% o
f res
pond
ents
ratin
g in
frast
ruct
ure
as “v
ery”
or “
som
ewha
t” im
porta
nt
27

0%
50%
100%
0% 50% 100%
Overall Assessment: Transportation
Sidewalks and walking paths Bus stops
and shelters
Major roads
Bikeways
Local roads
Base: All respondents (n=2293)
Assessment % of respondents rating infrastructure
as “excellent” or “good”
Impo
rtan
ce
% o
f res
pond
ents
ratin
g in
frast
ruct
ure
as “ v
ery”
or “
som
ewha
t” im
porta
nt
28

0%
50%
100%
0% 50% 100%
Overall Assessment: Infrastructure
Water pipes Sewer pipes Fire halls
City Hall buildings
Police stations
Base: All respondents (n=2293)
Assessment % of respondents rating infrastructure
as “excellent” or “good”
Impo
rtan
ce
% o
f res
pond
ents
ratin
g in
frast
ruct
ure
as “v
ery”
or “
som
ewha
t” im
porta
nt
29
Long-term Capital Planning
#VanCap2018
BUILDING THE CITY OF TODAY
AND TOMORROW
PRESENTATION BOARDS DISPLAYED AT
PUBLIC OPEN HOUSES

Help us build the City of Today and Tomorrow…
Infrastructure renewal (City of Today):
What’s your assessment of the current condition of the City’s facilities and infrastructure?
New facilities & infrastructure (City of Tomorrow):
What do you think are the most important areas to invest in over the next 10 years?
?
?
A lot of the capital planning work for the next 10 years has been informed
by long-term plans like the Greenest City Action Plan, Healthy City Strategy,
Housing Strategy, and Transportation 2040, to name a few.
… but we’d like to check in with you
There are two parts you can help us with:
31

People: Ensuring affordable and sustainable housing; and a safe, inclusive and creative community
Prosperity: Sustaining a thriving, diverse economy
Environment: Protecting and enhancing Vancouver’s natural resources
What is Capital Planning?
What’s important in long-term planning?In building the City of Today we need to sustain core services that are valued and relied on by citizens and businesses, such as:
• clean water
• an efficient transportation network
• proactive emergency and social services
• access to nature and recreation
We are building the City of Tomorrow by advancing long-term priorities so that Vancouver remains one of the best places in the world to live. These include:
Capital planning is about ensuring we keep our facilities and infrastructure functional so that they are available when you need them.
Long-term capital planning is looking to see what our needs will be in 10 years. Which of our existing facilities and infrastructure need special attention? What new facilities and infrastructure do we need to build to serve us well in 10 years?
The City offers many of the basic services that you use on a regular basis – parks, community facilities, streets and sidewalks. Some you use every day (e.g. water from your faucet) and some you hope never to use but are glad they are available when you need them (e.g. fire department).
All these services require ‘bricks & mortar’ in order to function (buildings, underground pipes, asphalt and concrete).
To successfully build the City of Today and Tomorrow, we must sustain financial health by:
• providing good value for property taxes and user fees, while meetingthe priority needs of the community over the long term
• maintaining a long track record of good fiscal management
• developing strategic partnerships
32

THE CITY OF TODAY
Affordable HousingThe City’s goals are to end street homelessness and provide more affordable housing choices for all residents across communities.
Shelters1,000 beds
SROs4,400 rooms
SupportiveHousing
4,600 units
Non-marketRental
(Social Housing)
21,000 units
Purpose-built Rental
58,000 units
Suites &LanewayHouses
33,400 units
RentedCondos
34,500 units
Condos58,700 units
OtherOwnership
68,600 units
ENDING HOMELESSNESS10,000 beds/rooms/units3% of housing inventory
RENTAL HOUSING147,000 units
52% of housing inventory
OWNERSHIP127,000 units
45% of housing inventory
HOUSING CONTINUUM: TOTAL OF 284,000 UNITS
NUMBER OF HOMELESS IN THE CITY
AGE PROFILE OF NON-MARKET RENTAL HOUSING
INCOMES AND RENTS
AGE PROFILE OF PURPOSE-BUILT RENTAL HOUSING
Vancouver homeless population trends 2005 to 2016 Incomes have not kept pace with rents
33
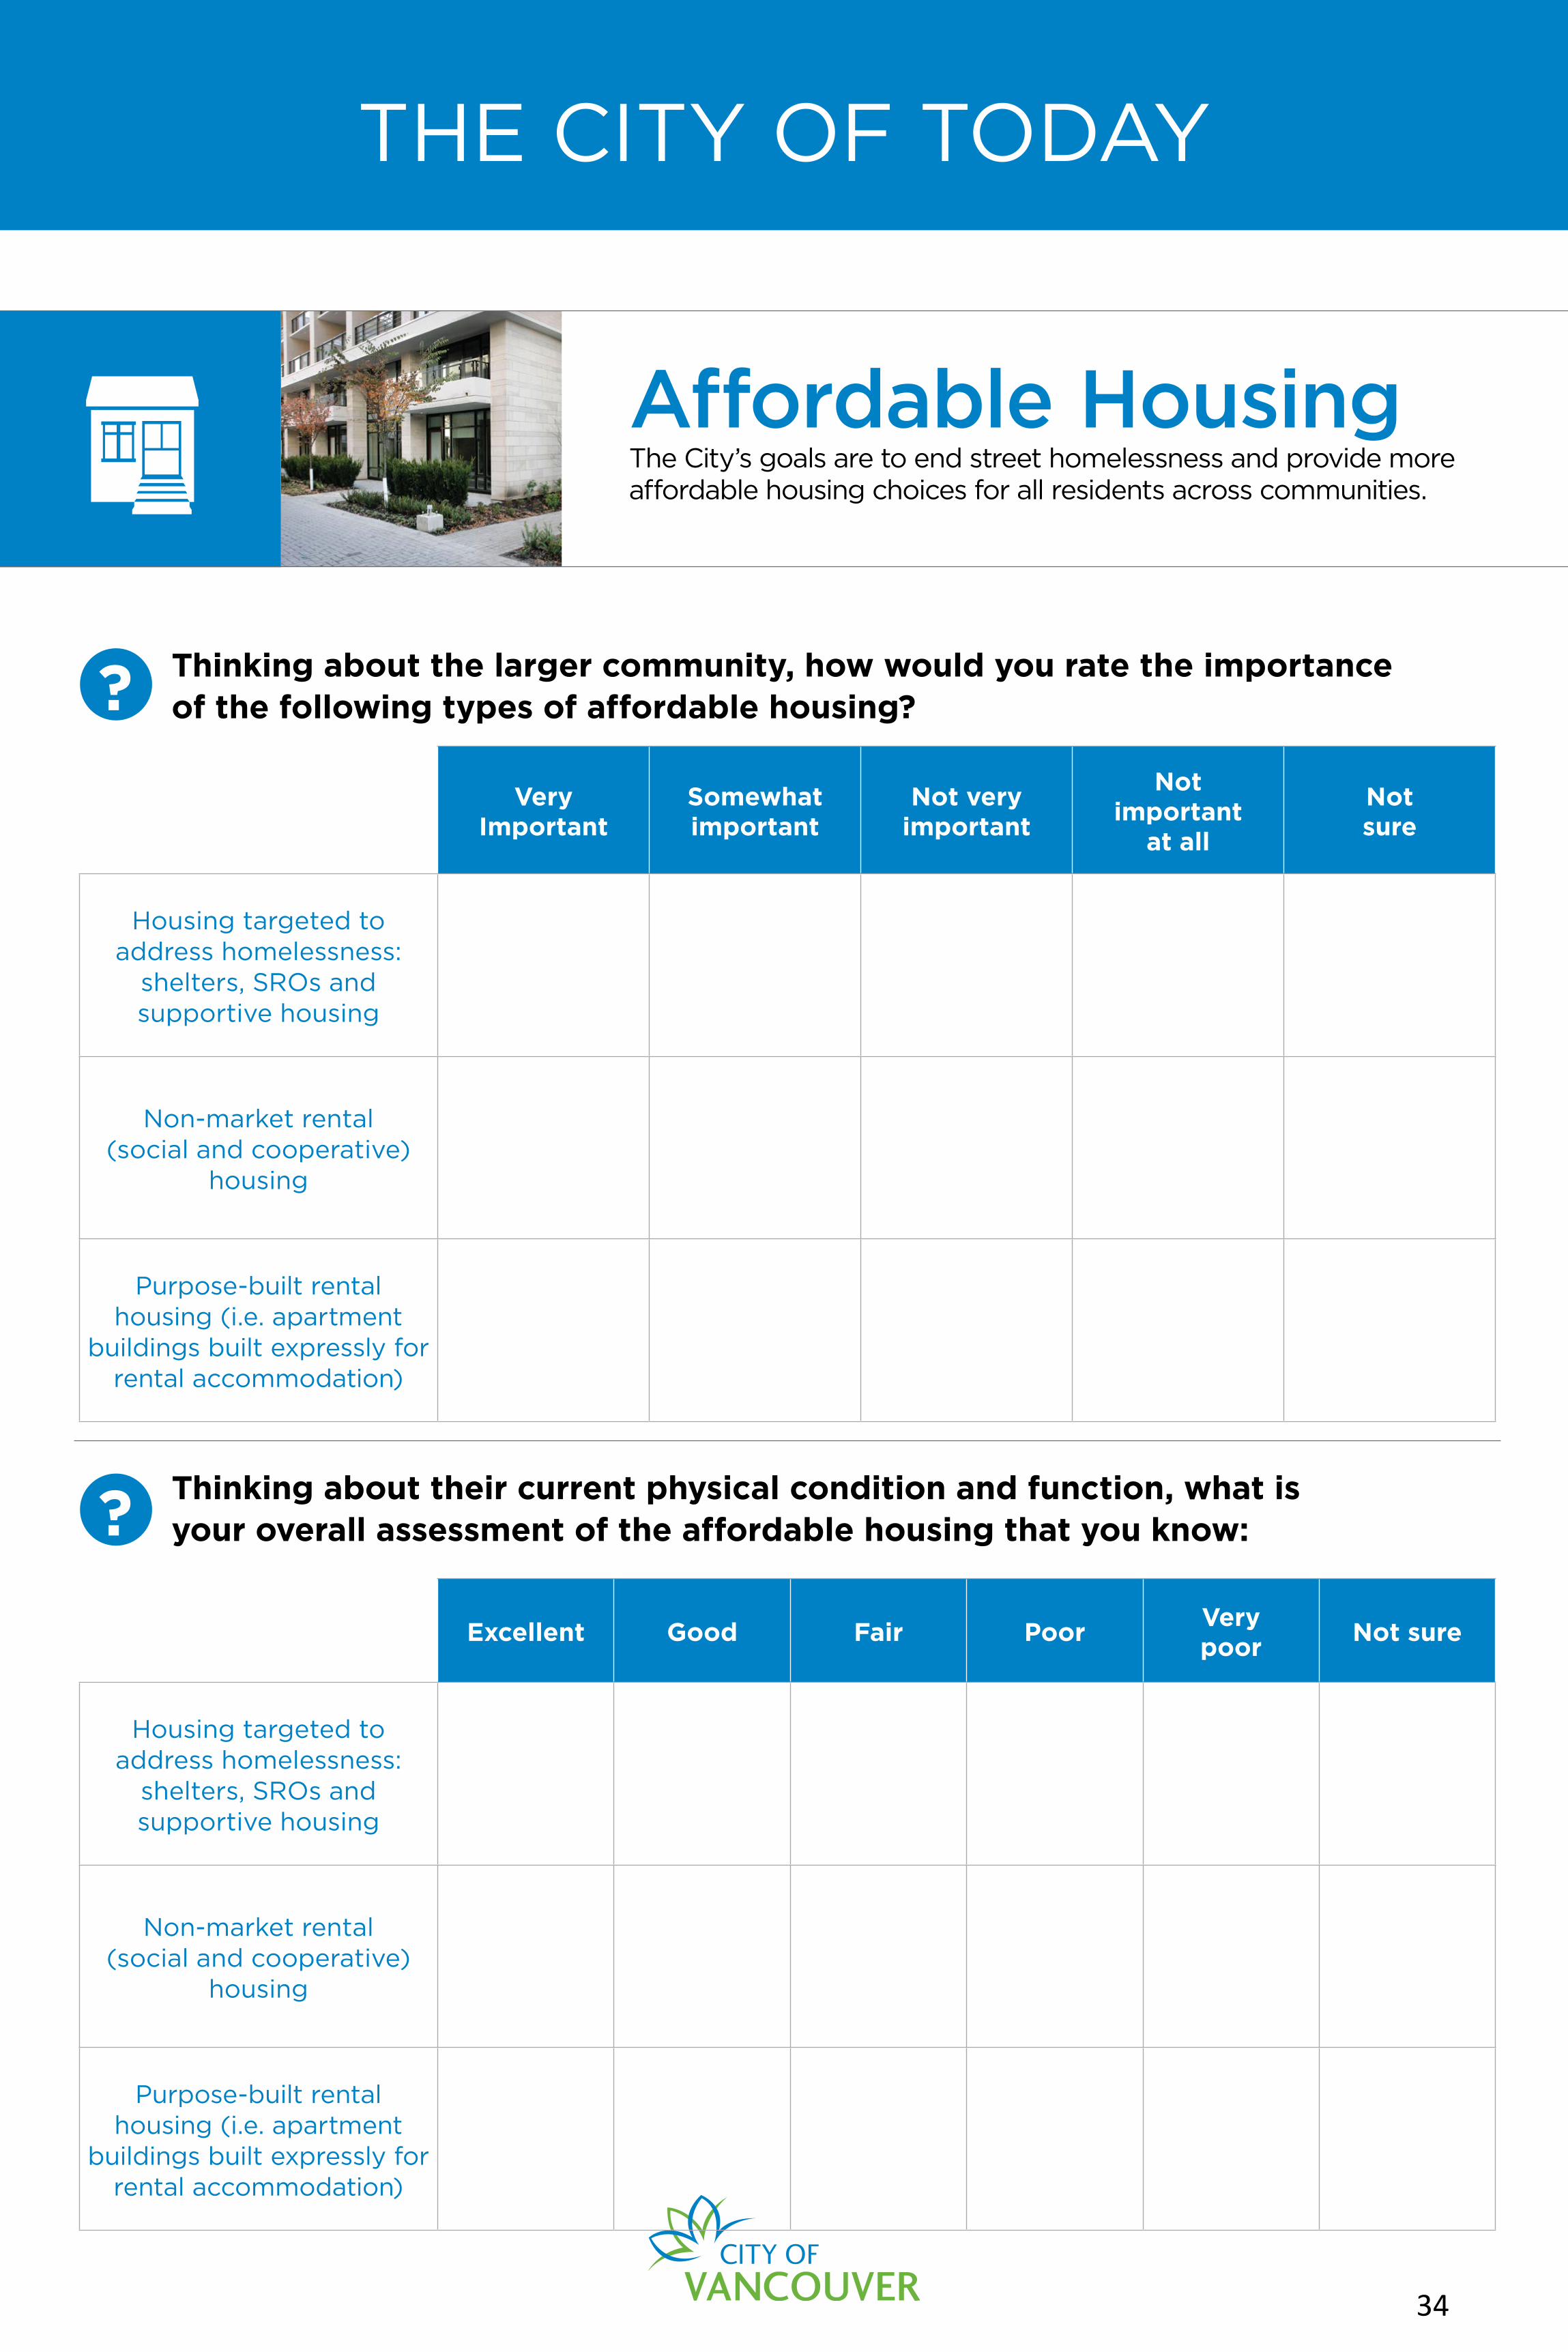
THE CITY OF TODAY
?
?
Thinking about the larger community, how would you rate the importance of the following types of affordable housing?
Thinking about their current physical condition and function, what is your overall assessment of the affordable housing that you know:
Very Important
Somewhat important
Not very important
Notimportant
at all
Not sure
Housing targeted to address homelessness:
shelters, SROs and supportive housing
Non-market rental (social and cooperative)
housing
Purpose-built rental housing (i.e. apartment
buildings built expressly for rental accommodation)
Excellent Good Fair PoorVerypoor
Not sure
Housing targeted to address homelessness:
shelters, SROs and supportive housing
Non-market rental (social and cooperative)
housing
Purpose-built rental housing (i.e. apartment
buildings built expressly for rental accommodation)
Affordable HousingThe City’s goals are to end street homelessness and provide more affordable housing choices for all residents across communities.
34

THE CITY OF TODAY
MAP
Community FacilitiesCommunity facilities offer a wide range of services and programs to Vancouver’s diverse population. Their service mandates range from neighbourhood-wide to city-wide. They are operated by both City and partner organizations.
22
66 CHILD CARE FACILITIES
55 RECREATION
FACILITIES
41SOCIAL
FACILITIES
LIBRARIES & ARCHIVES
CULTURAL & ENTERTAINMENT
FACILITIES
59
WHAT WE HAVE TODAY...
35
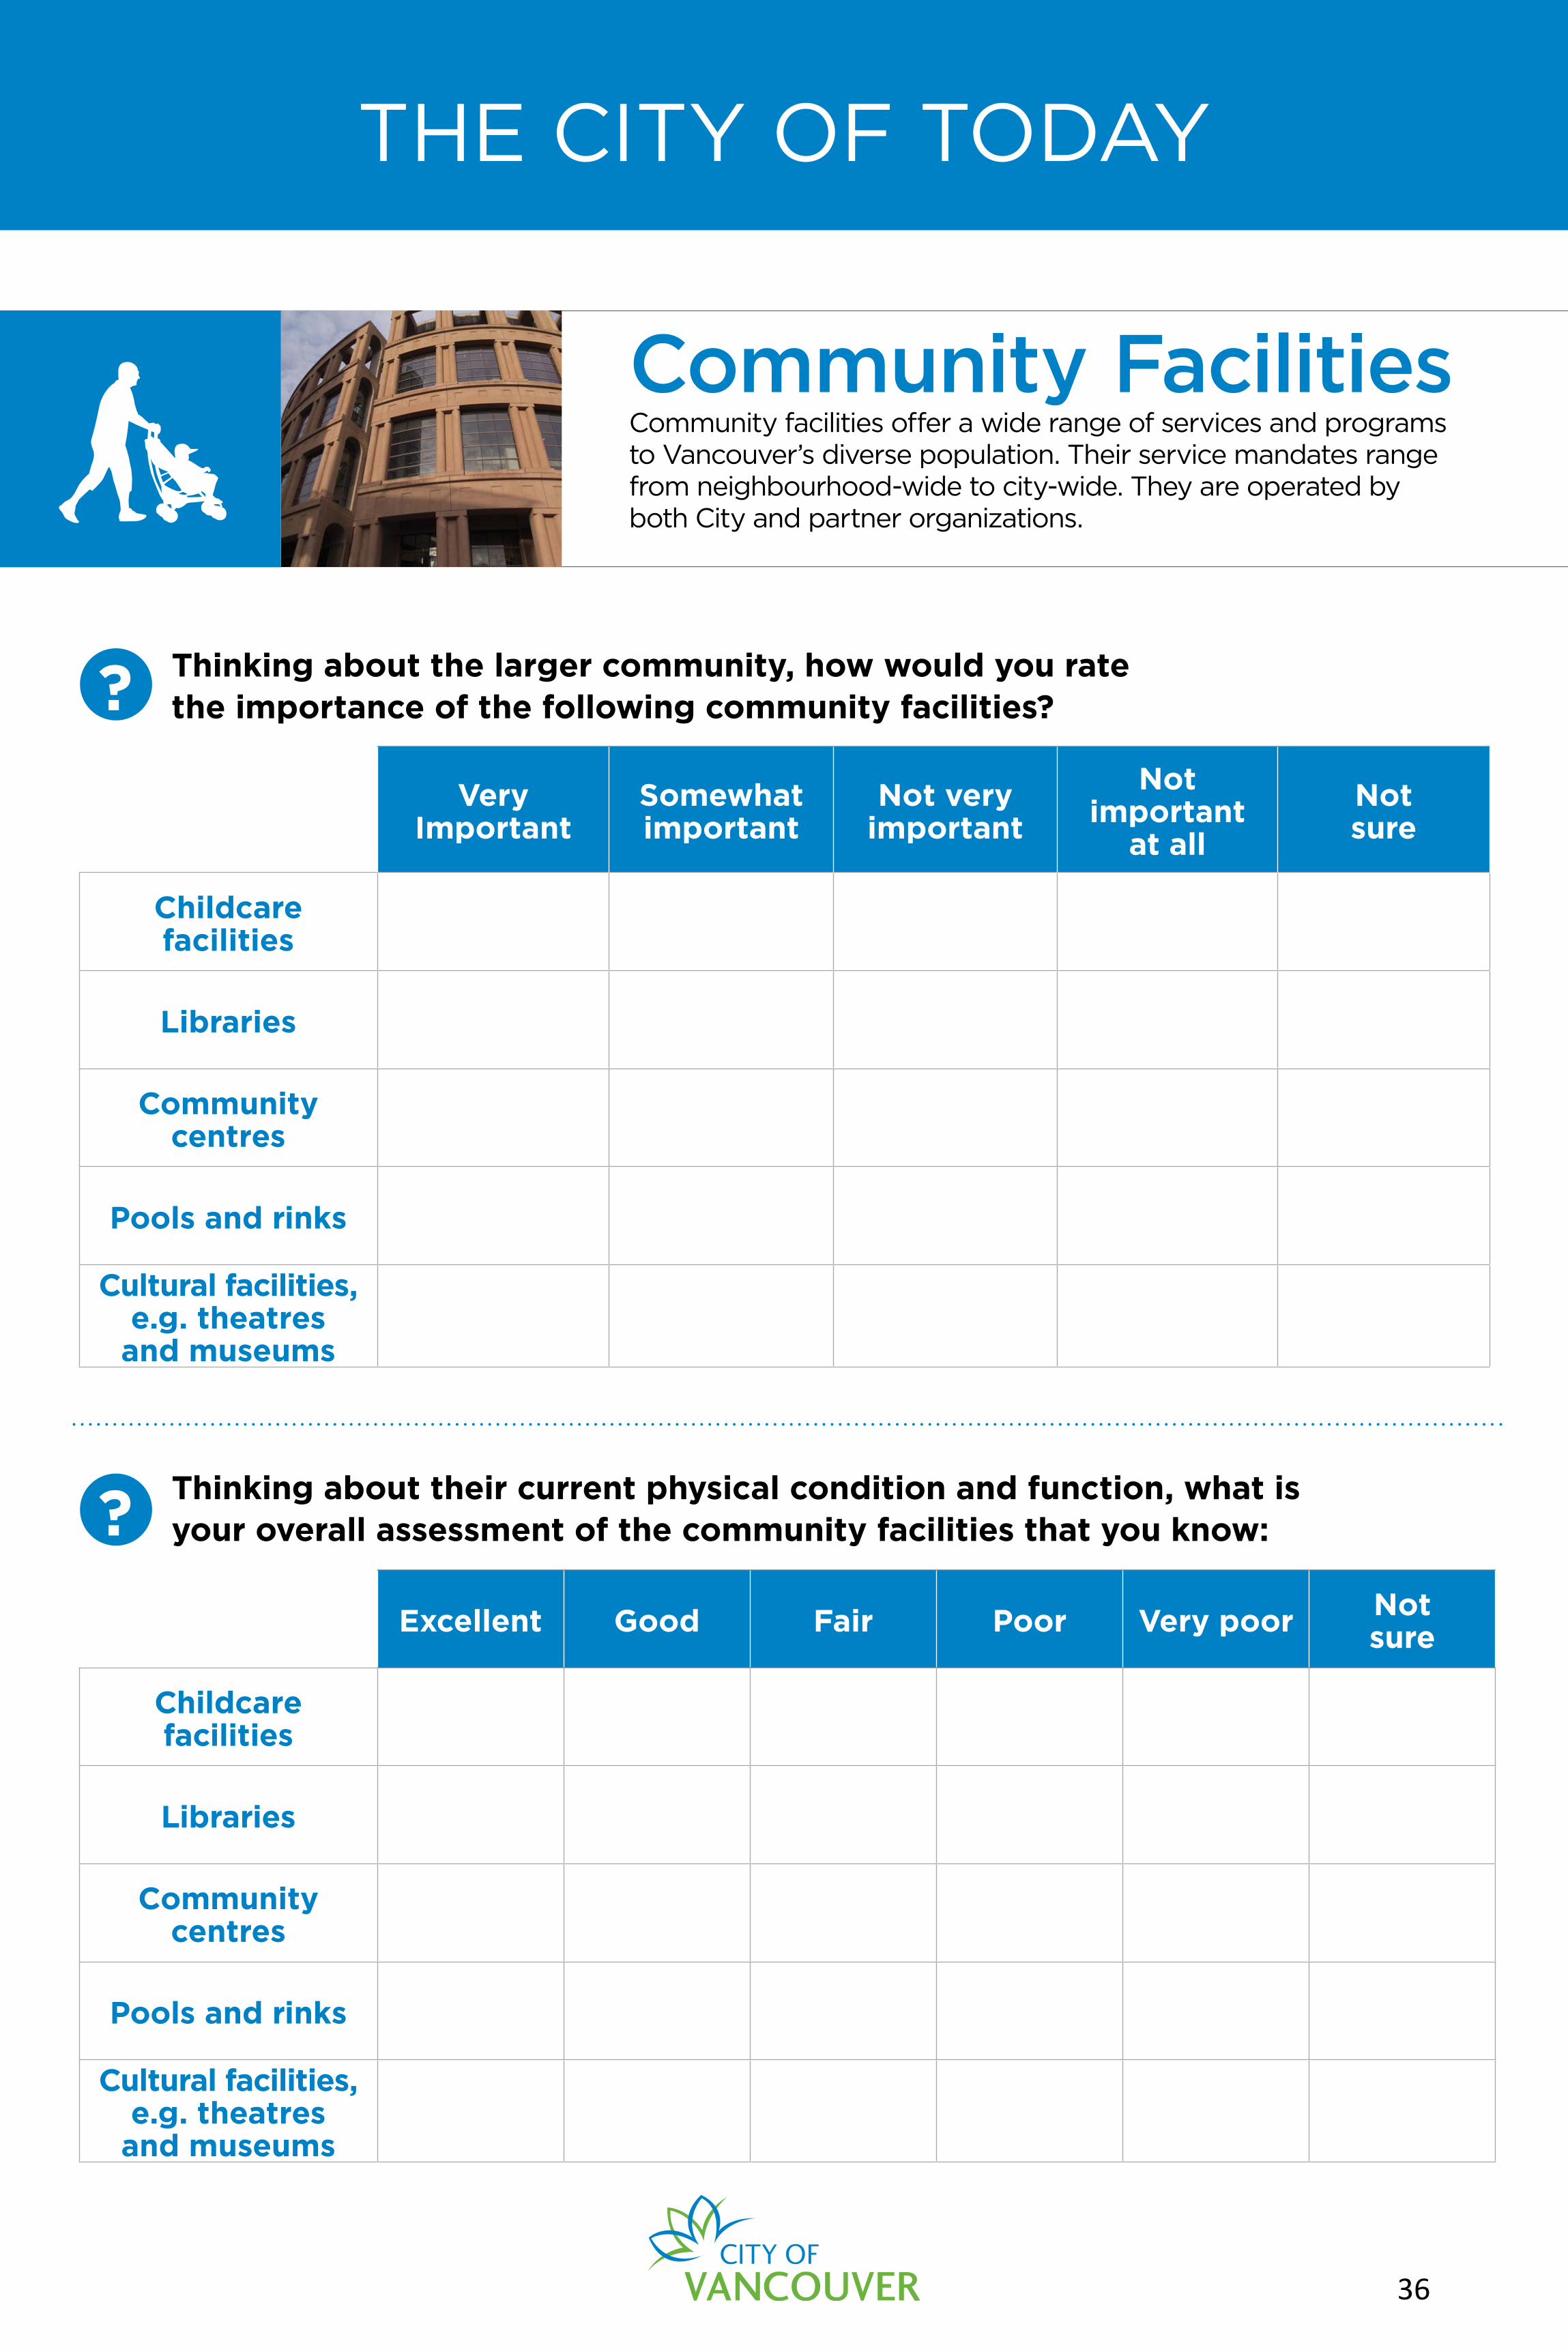
THE CITY OF TODAY
?
?
Thinking about the larger community, how would you rate the importance of the following community facilities?
Thinking about their current physical condition and function, what is your overall assessment of the community facilities that you know:
Very Important
Somewhat important
Not very important
Notimportant
at all
Not sure
Childcare facilities
Libraries
Community centres
Pools and rinks
Cultural facilities, e.g. theatres
and museums
Excellent Good Fair Poor Very poor Not sure
Childcare facilities
Libraries
Community centres
Pools and rinks
Cultural facilities, e.g. theatres
and museums
Community FacilitiesCommunity facilities offer a wide range of services and programs to Vancouver’s diverse population. Their service mandates range from neighbourhood-wide to city-wide. They are operated by both City and partner organizations.
36

THE CITY OF TODAY
MAP
215,000 TREES
240 PARKS
REPRESENTING
1,370HECTARES
CEMETERY
32 KM OF SEAWALL
1
WHAT WE HAVE TODAY...
ParksParks and open spaces provide opportunities for residents and visitors to interact with nature, participate in leisure or recreational activities and celebrate community and civic life.
37

THE CITY OF TODAY
Thinking about the larger community, how would you rate the importance of the following features in parks?
Thinking about their current physical condition and function, what is your overall assessment of the park features that you know:
Very Important
Somewhat important
Not very important
Notimportant
at all
Not sure
Seawall and trails
Natural areas, e.g. forest and pond
Sport facilities, e.g. soccer and
basketball
Children’s playgrounds
Excellent Good Fair Poor Very poor Not sure
Seawall and trails
Natural areas, e.g. forest and pond
Sport facilities, e.g. soccer and
basketball
Children’s playgrounds
?
?
ParksParks and open spaces provide opportunities for residents and visitors to interact with nature, participate in leisure or recreational activities and celebrate community and civic life.
38
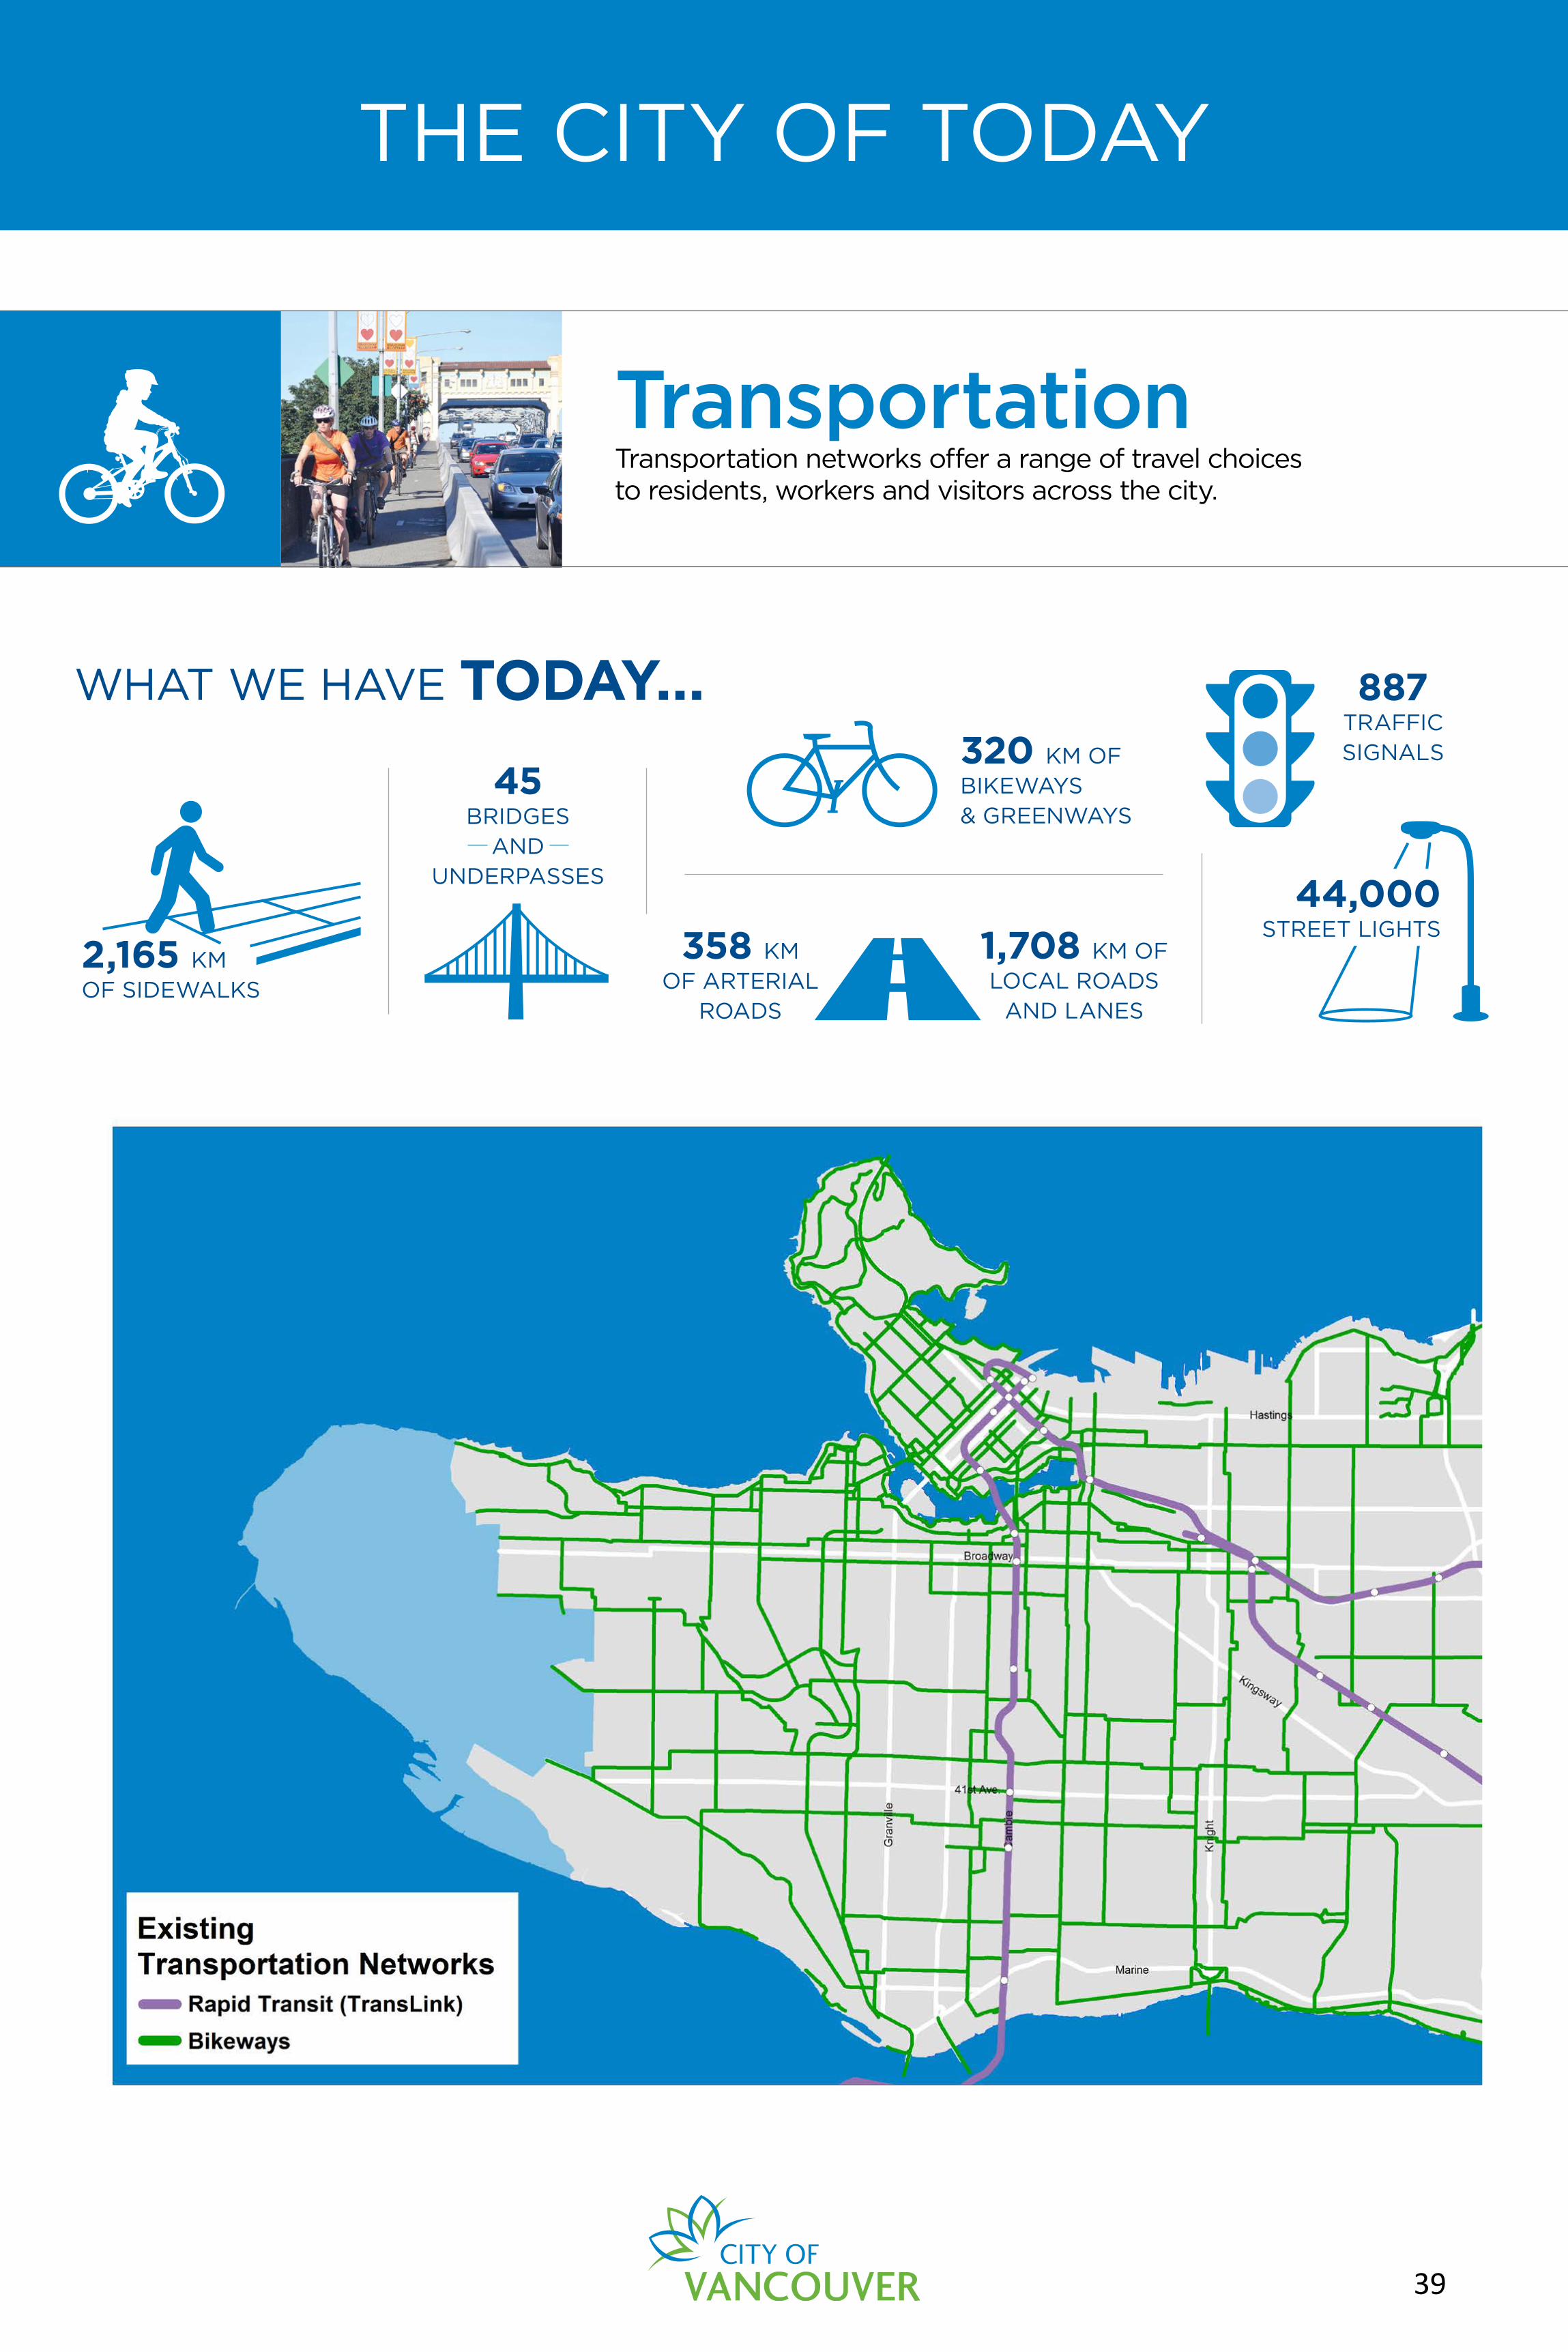
THE CITY OF TODAY
2,165 KMOF SIDEWALKS
320 KM OFBIKEWAYS & GREENWAYS
1,708 KM OFLOCAL ROADS
AND LANES
887TRAFFIC SIGNALS
44,000STREET LIGHTS
45 BRIDGES
AND UNDERPASSES
WHAT WE HAVE TODAY...
358 KMOF ARTERIAL
ROADS
TransportationTransportation networks offer a range of travel choices to residents, workers and visitors across the city.
39

THE CITY OF TODAY
?
?
Thinking about the larger community, how would you rate the importance of the following transportation networks managed by the City?
Thinking about their current physical condition and function, what is your overall assessment of the transportation networks that you know:
Very Important
Somewhat important
Not very important
Notimportant
at all
Not sure
Sidewalks and walking paths
Bikeways
Bus stops and shelters*
Major roads
Local roads
Excellent Good Fair Poor Very poor Not sure
Sidewalks and walking paths
Bikeways
Bus stops and shelters*
Major roads
Local roads
* Buses and SkyTrain are managed by TransLink
* Buses and SkyTrain are managed by TransLink
TransportationTransportation networks offer a range of travel choices to residents, workers and visitors across the city.
40
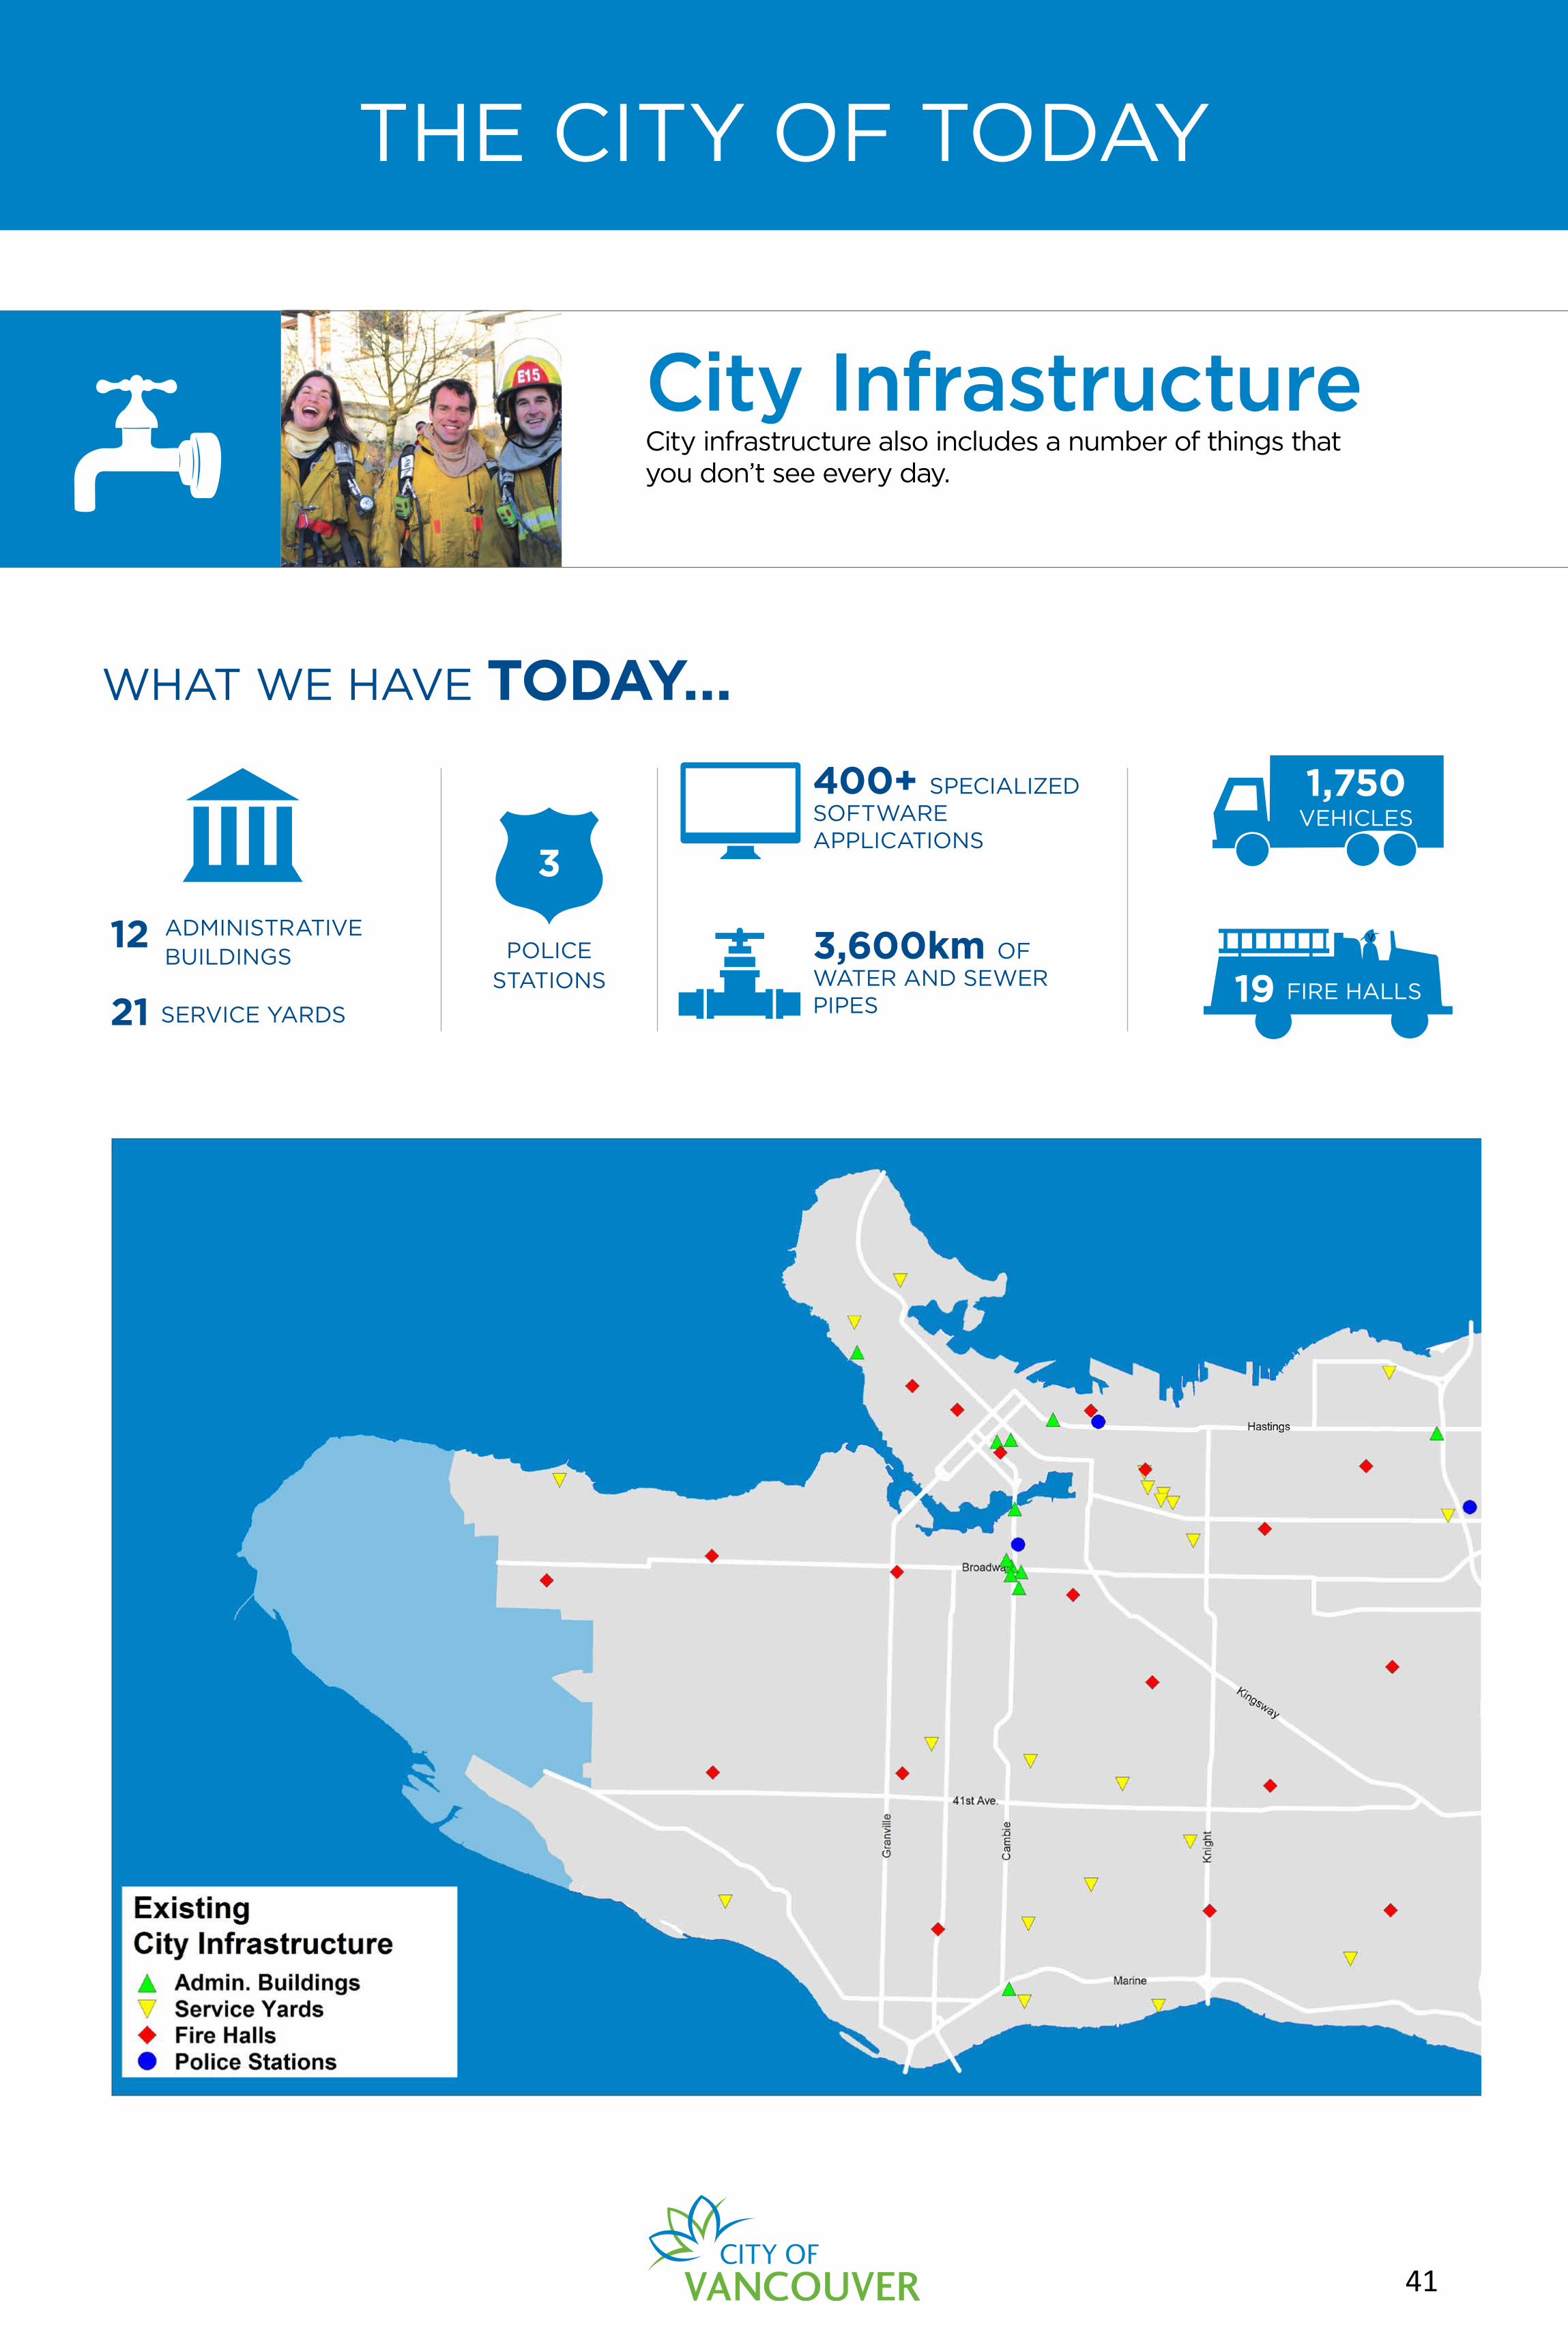
THE CITY OF TODAY
12 ADMINISTRATIVE BUILDINGS
21 SERVICE YARDS
400+ SPECIALIZEDSOFTWARE APPLICATIONS
3,600km OFWATER AND SEWER PIPES
1,750VEHICLES
WHAT WE HAVE TODAY...
V
3
POLICE STATIONS 19 FIRE HALLS
City InfrastructureCity infrastructure also includes a number of things that you don’t see every day.
41

THE CITY OF TODAY
?
?
Thinking about the larger community, how would you rate the importance of these other city infrastructure assets?
Thinking about their current physical condition and function, what is your overall assessment of the city assets below:
Very Important
Somewhat important
Not very important
Notimportant
at all
Not sure
Police stations
Fire halls
Water pipes
Sewer pipes
City Hall buildings
Excellent Good Fair Poor Very poor Not sure
Police stations
Fire halls
Water pipes
Sewer pipes
City Hall buildings
City InfrastructureCity infrastructure also includes a number of things that you don’t see every day.
42
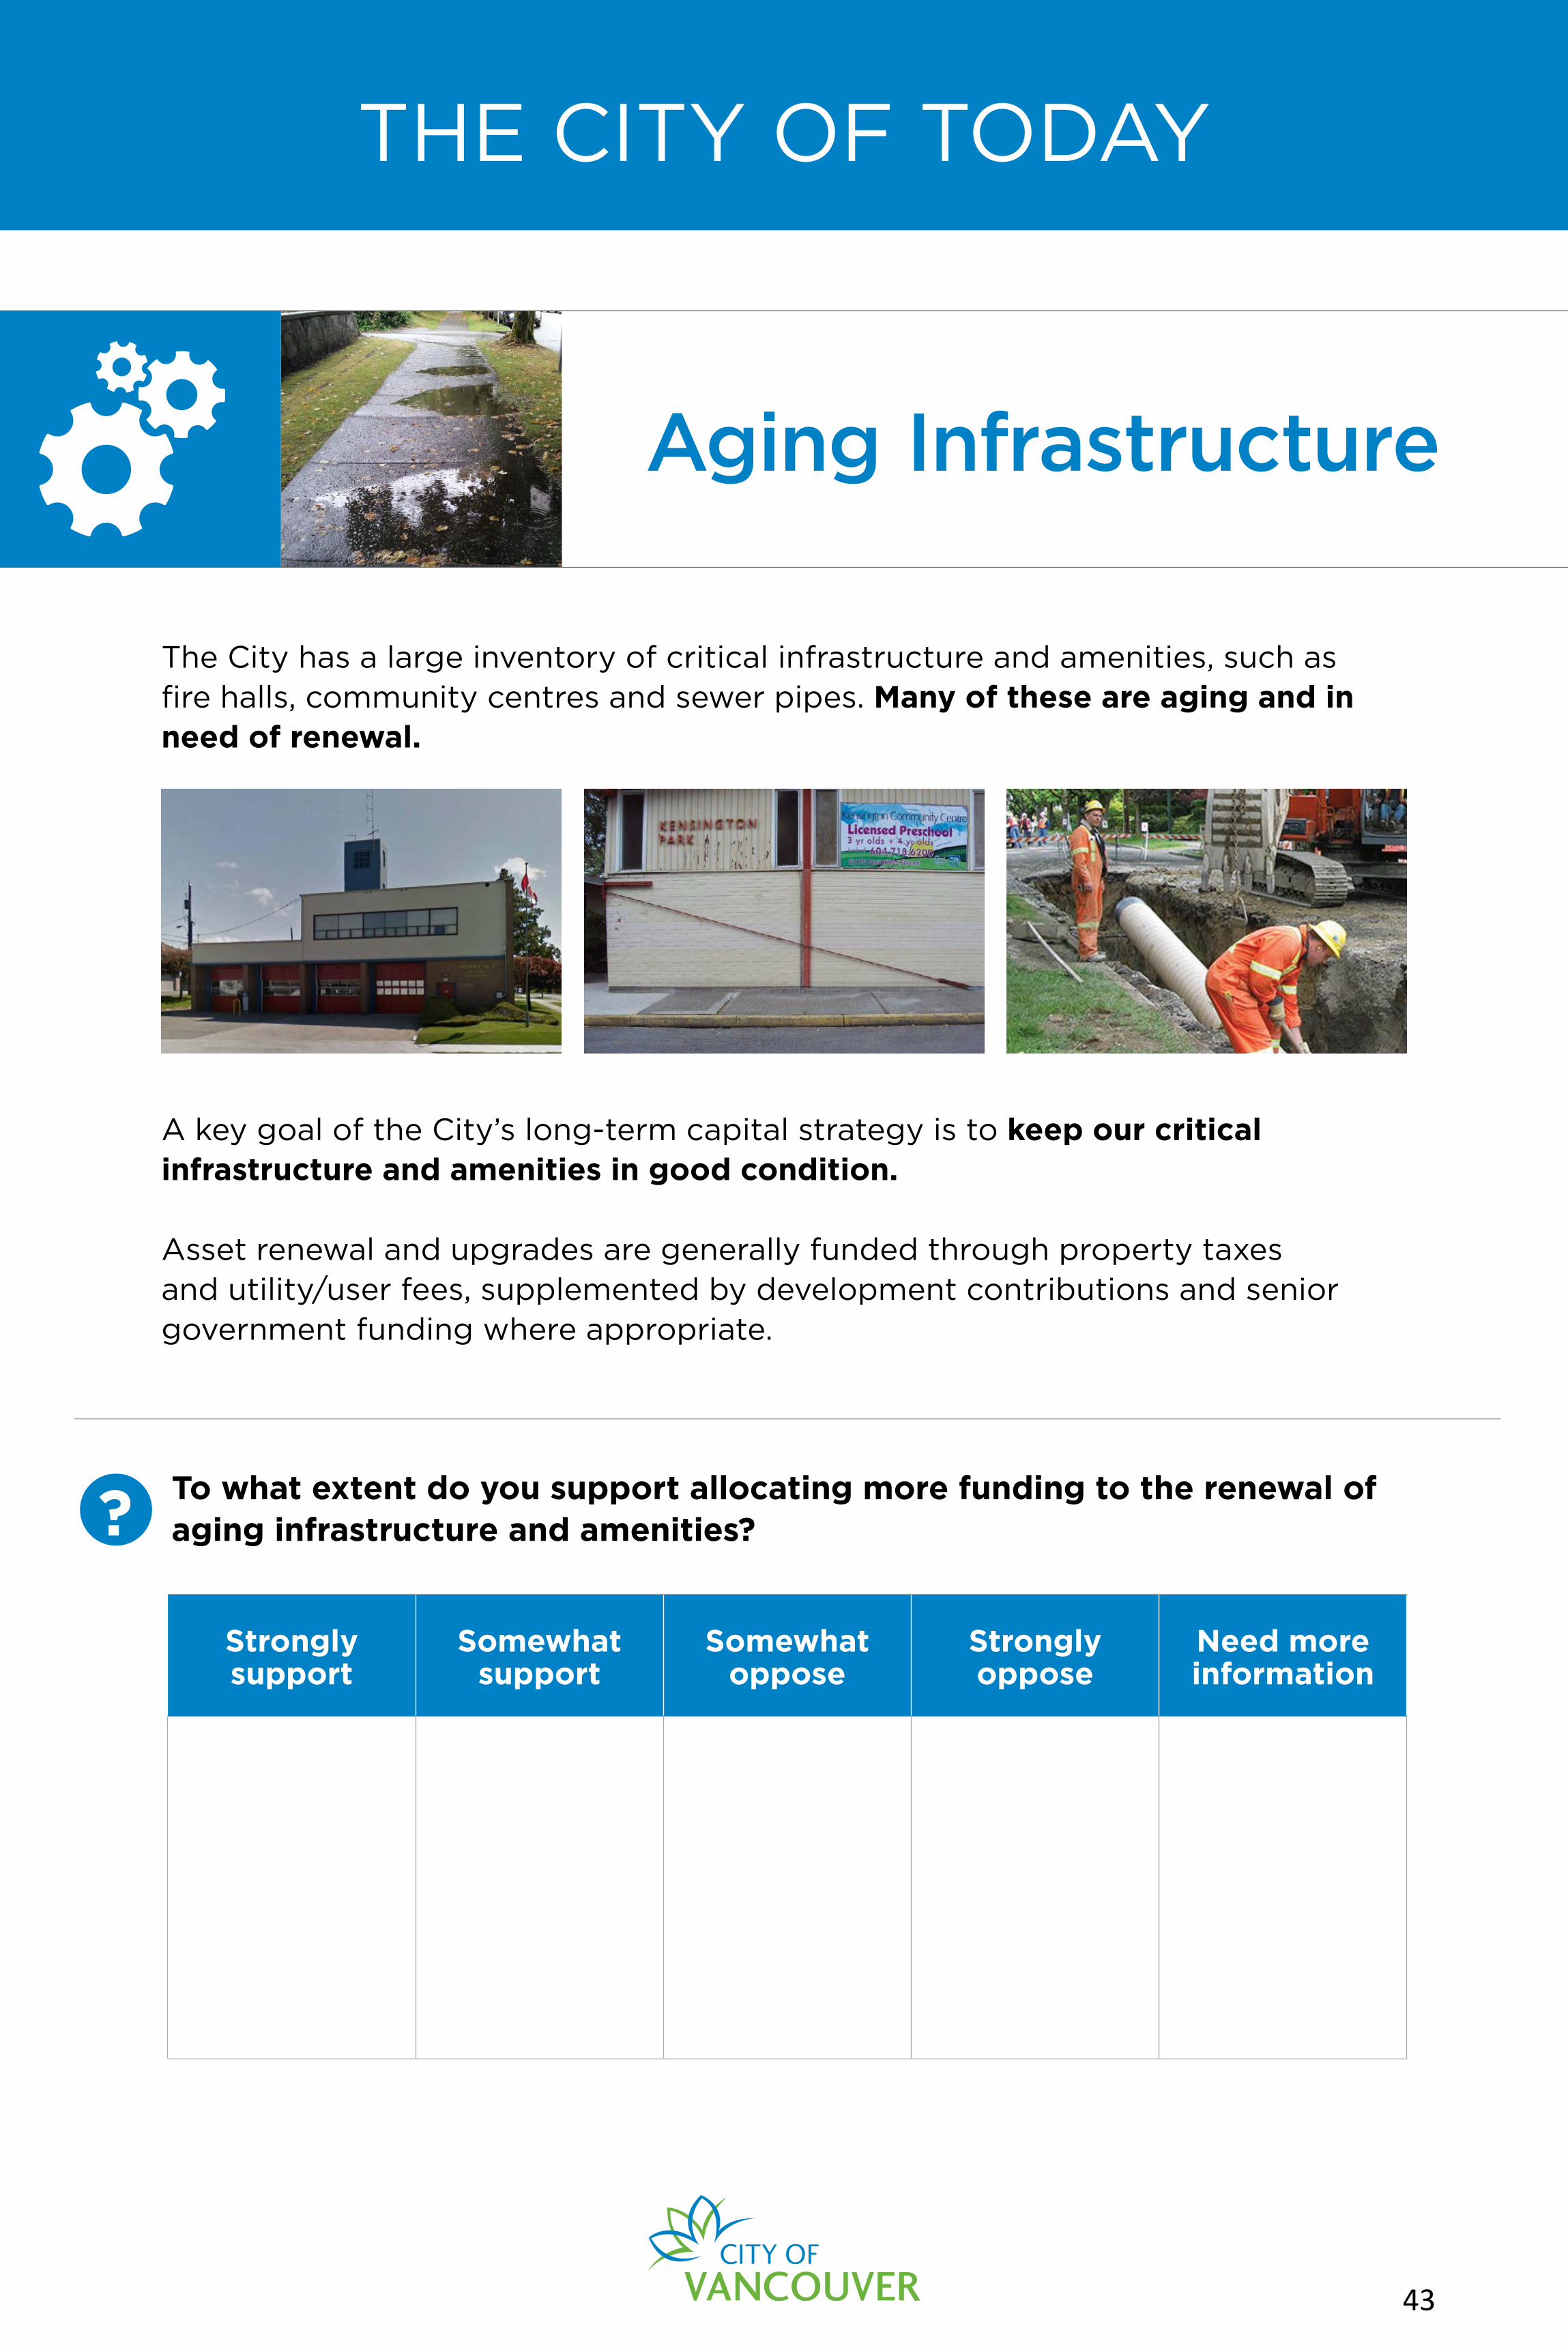
THE CITY OF TODAY
?To what extent do you support allocating more funding to the renewal ofaging infrastructure and amenities?
Strongly support
Somewhat support
Somewhat oppose
Strongly oppose
Need more information
The City has a large inventory of critical infrastructure and amenities, such as fire halls, community centres and sewer pipes. Many of these are aging and in need of renewal.
A key goal of the City’s long-term capital strategy is to keep our critical infrastructure and amenities in good condition.
Asset renewal and upgrades are generally funded through property taxes and utility/user fees, supplemented by development contributions and senior government funding where appropriate.
Aging Infrastructure
43
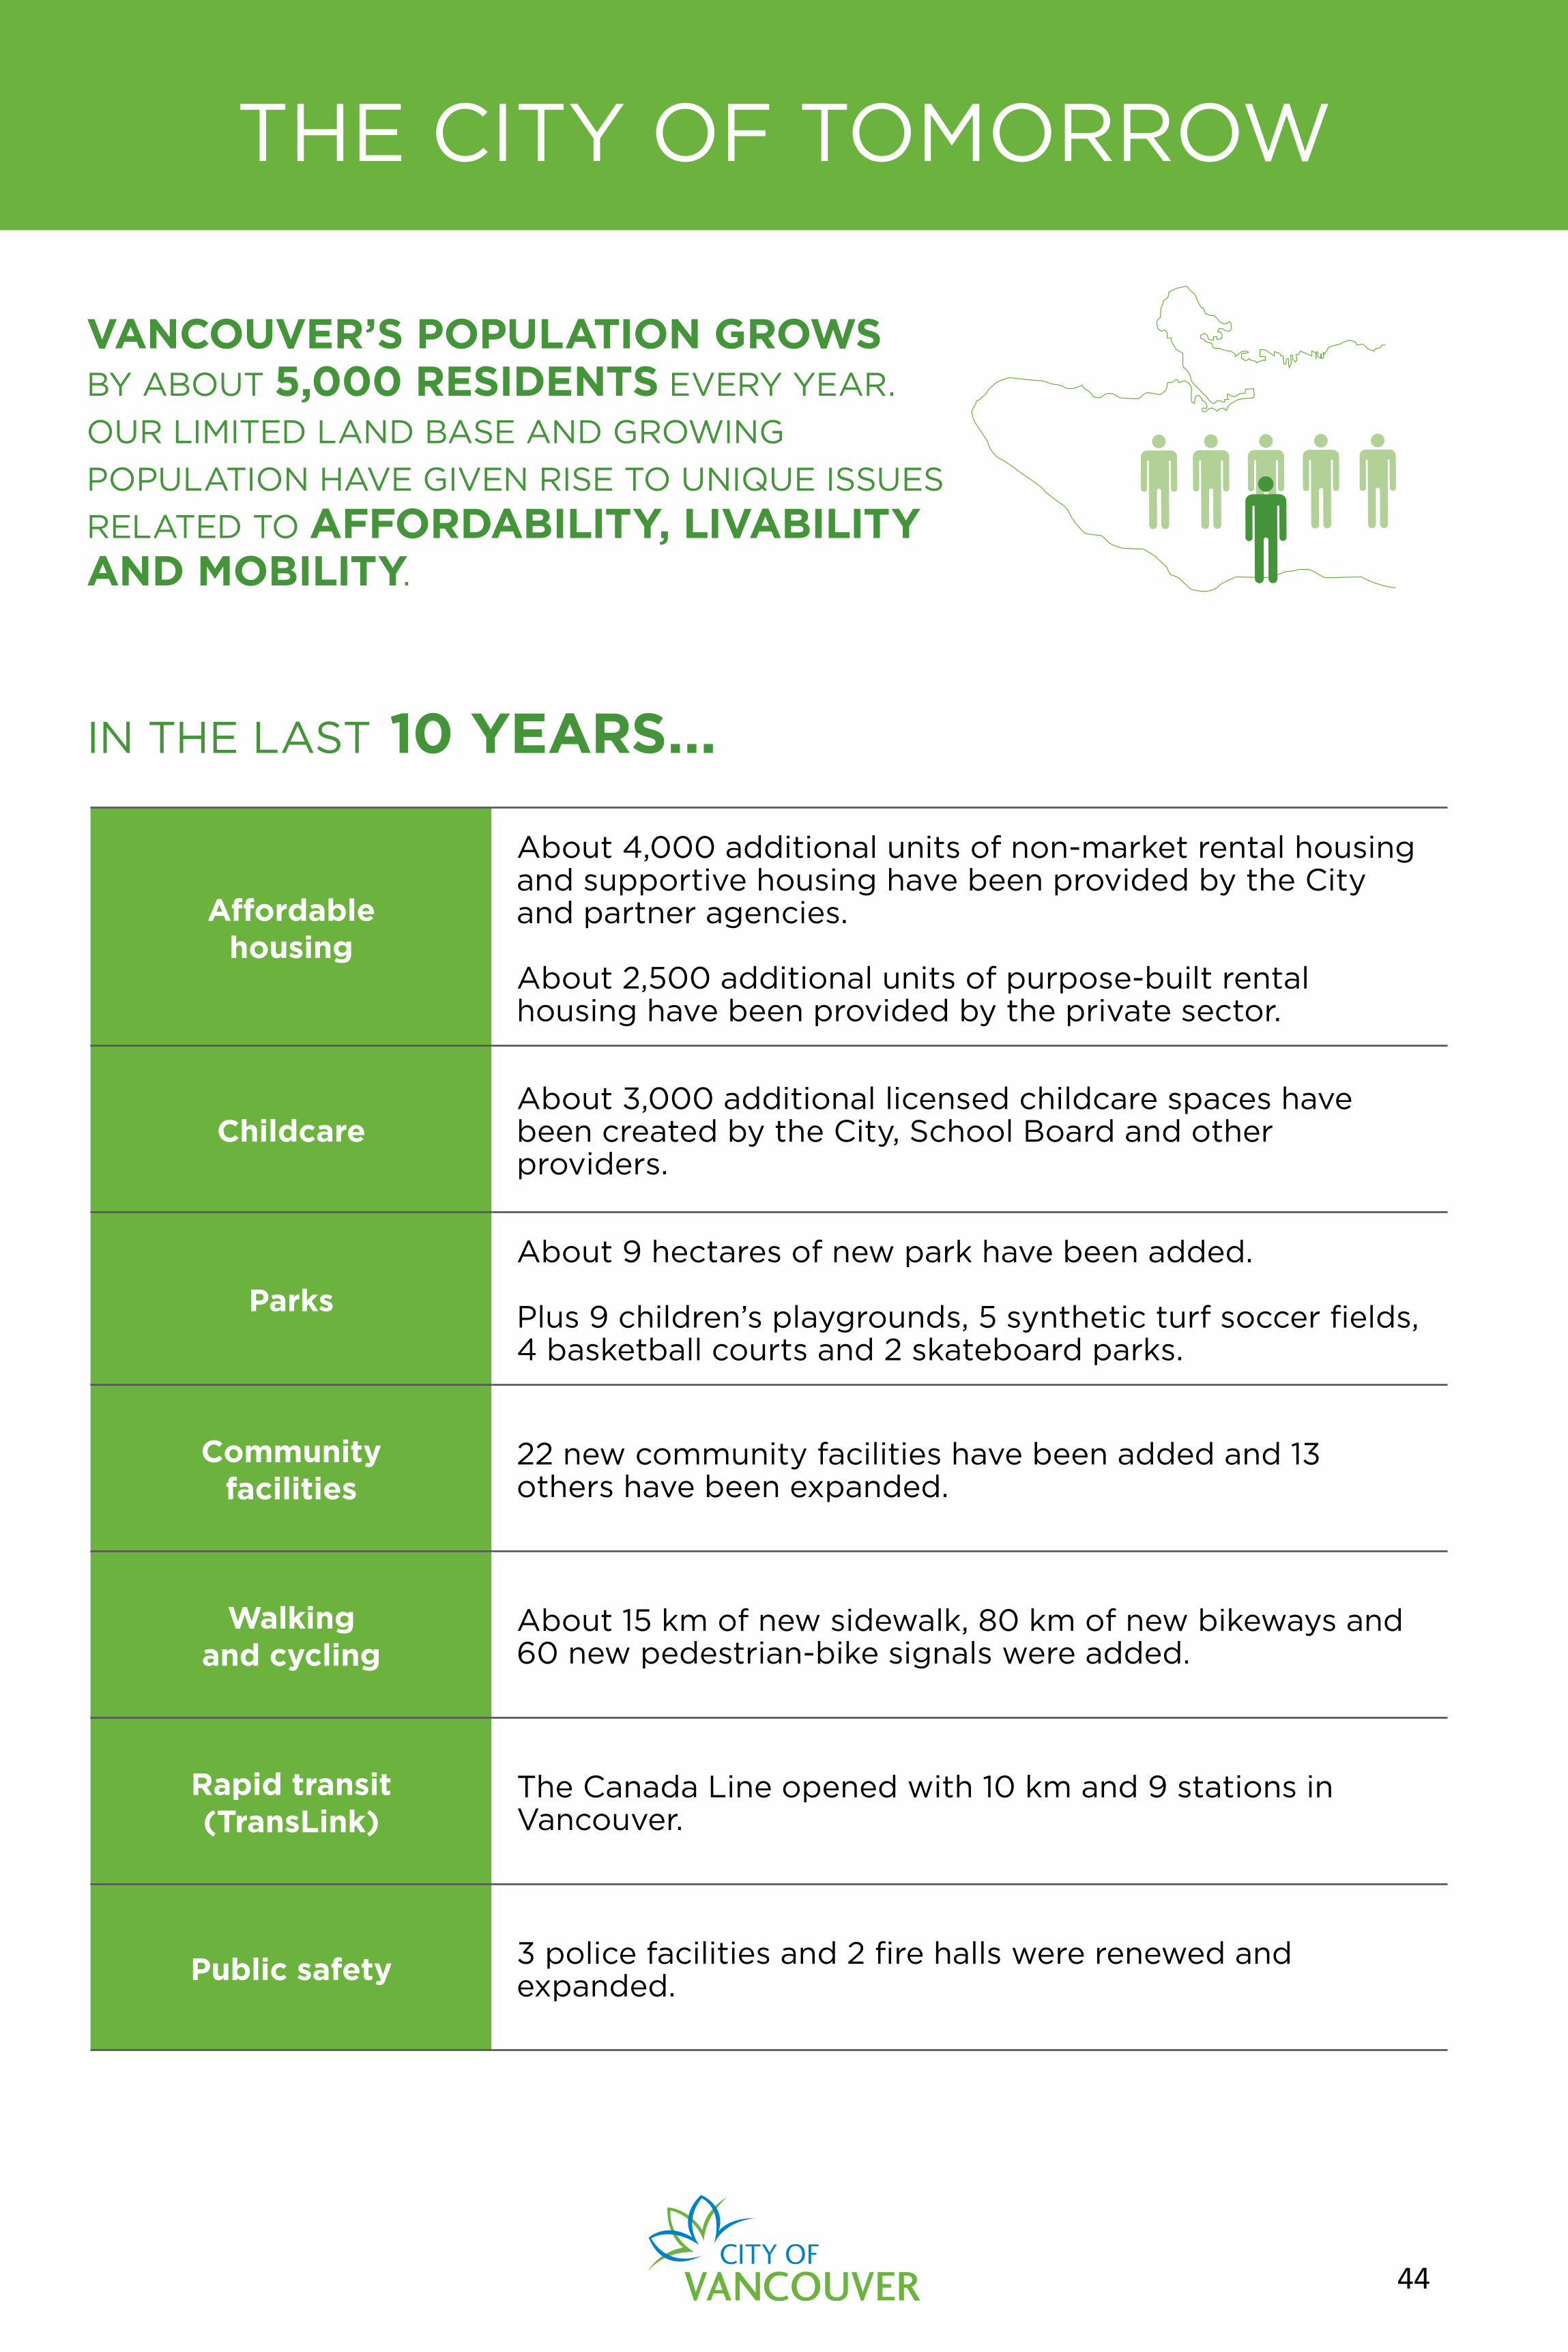
THE CITY OF TOMORROW
IN THE LAST 10 YEARS...
3 POLICE FACILITIES AND 2 FIRE HALLSWERE RENEWED AND EXPANDED.
VANCOUVER’S POPULATION GROWS BY ABOUT 5,000 RESIDENTS EVERY YEAR.
OUR LIMITED LAND BASE AND GROWING
POPULATION HAVE GIVEN RISE TO UNIQUE ISSUES
RELATED TO AFFORDABILITY, LIVABILITY AND MOBILITY.
Affordable housing
About 4,000 additional units of non-market rental housing and supportive housing have been provided by the City and partner agencies.
About 2,500 additional units of purpose-built rental housing have been provided by the private sector.
ChildcareAbout 3,000 additional licensed childcare spaces have been created by the City, School Board and other providers.
Parks
About 9 hectares of new park have been added.
Plus 9 children’s playgrounds, 5 synthetic turf soccer fields, 4 basketball courts and 2 skateboard parks.
Community facilities
22 new community facilities have been added and 13 others have been expanded.
Walking and cycling
About 15 km of new sidewalk, 80 km of new bikeways and 60 new pedestrian-bike signals were added.
Rapid transit (TransLink)
The Canada Line opened with 10 km and 9 stations in Vancouver.
Public safety 3 police facilities and 2 fire halls were renewed and expanded.
44
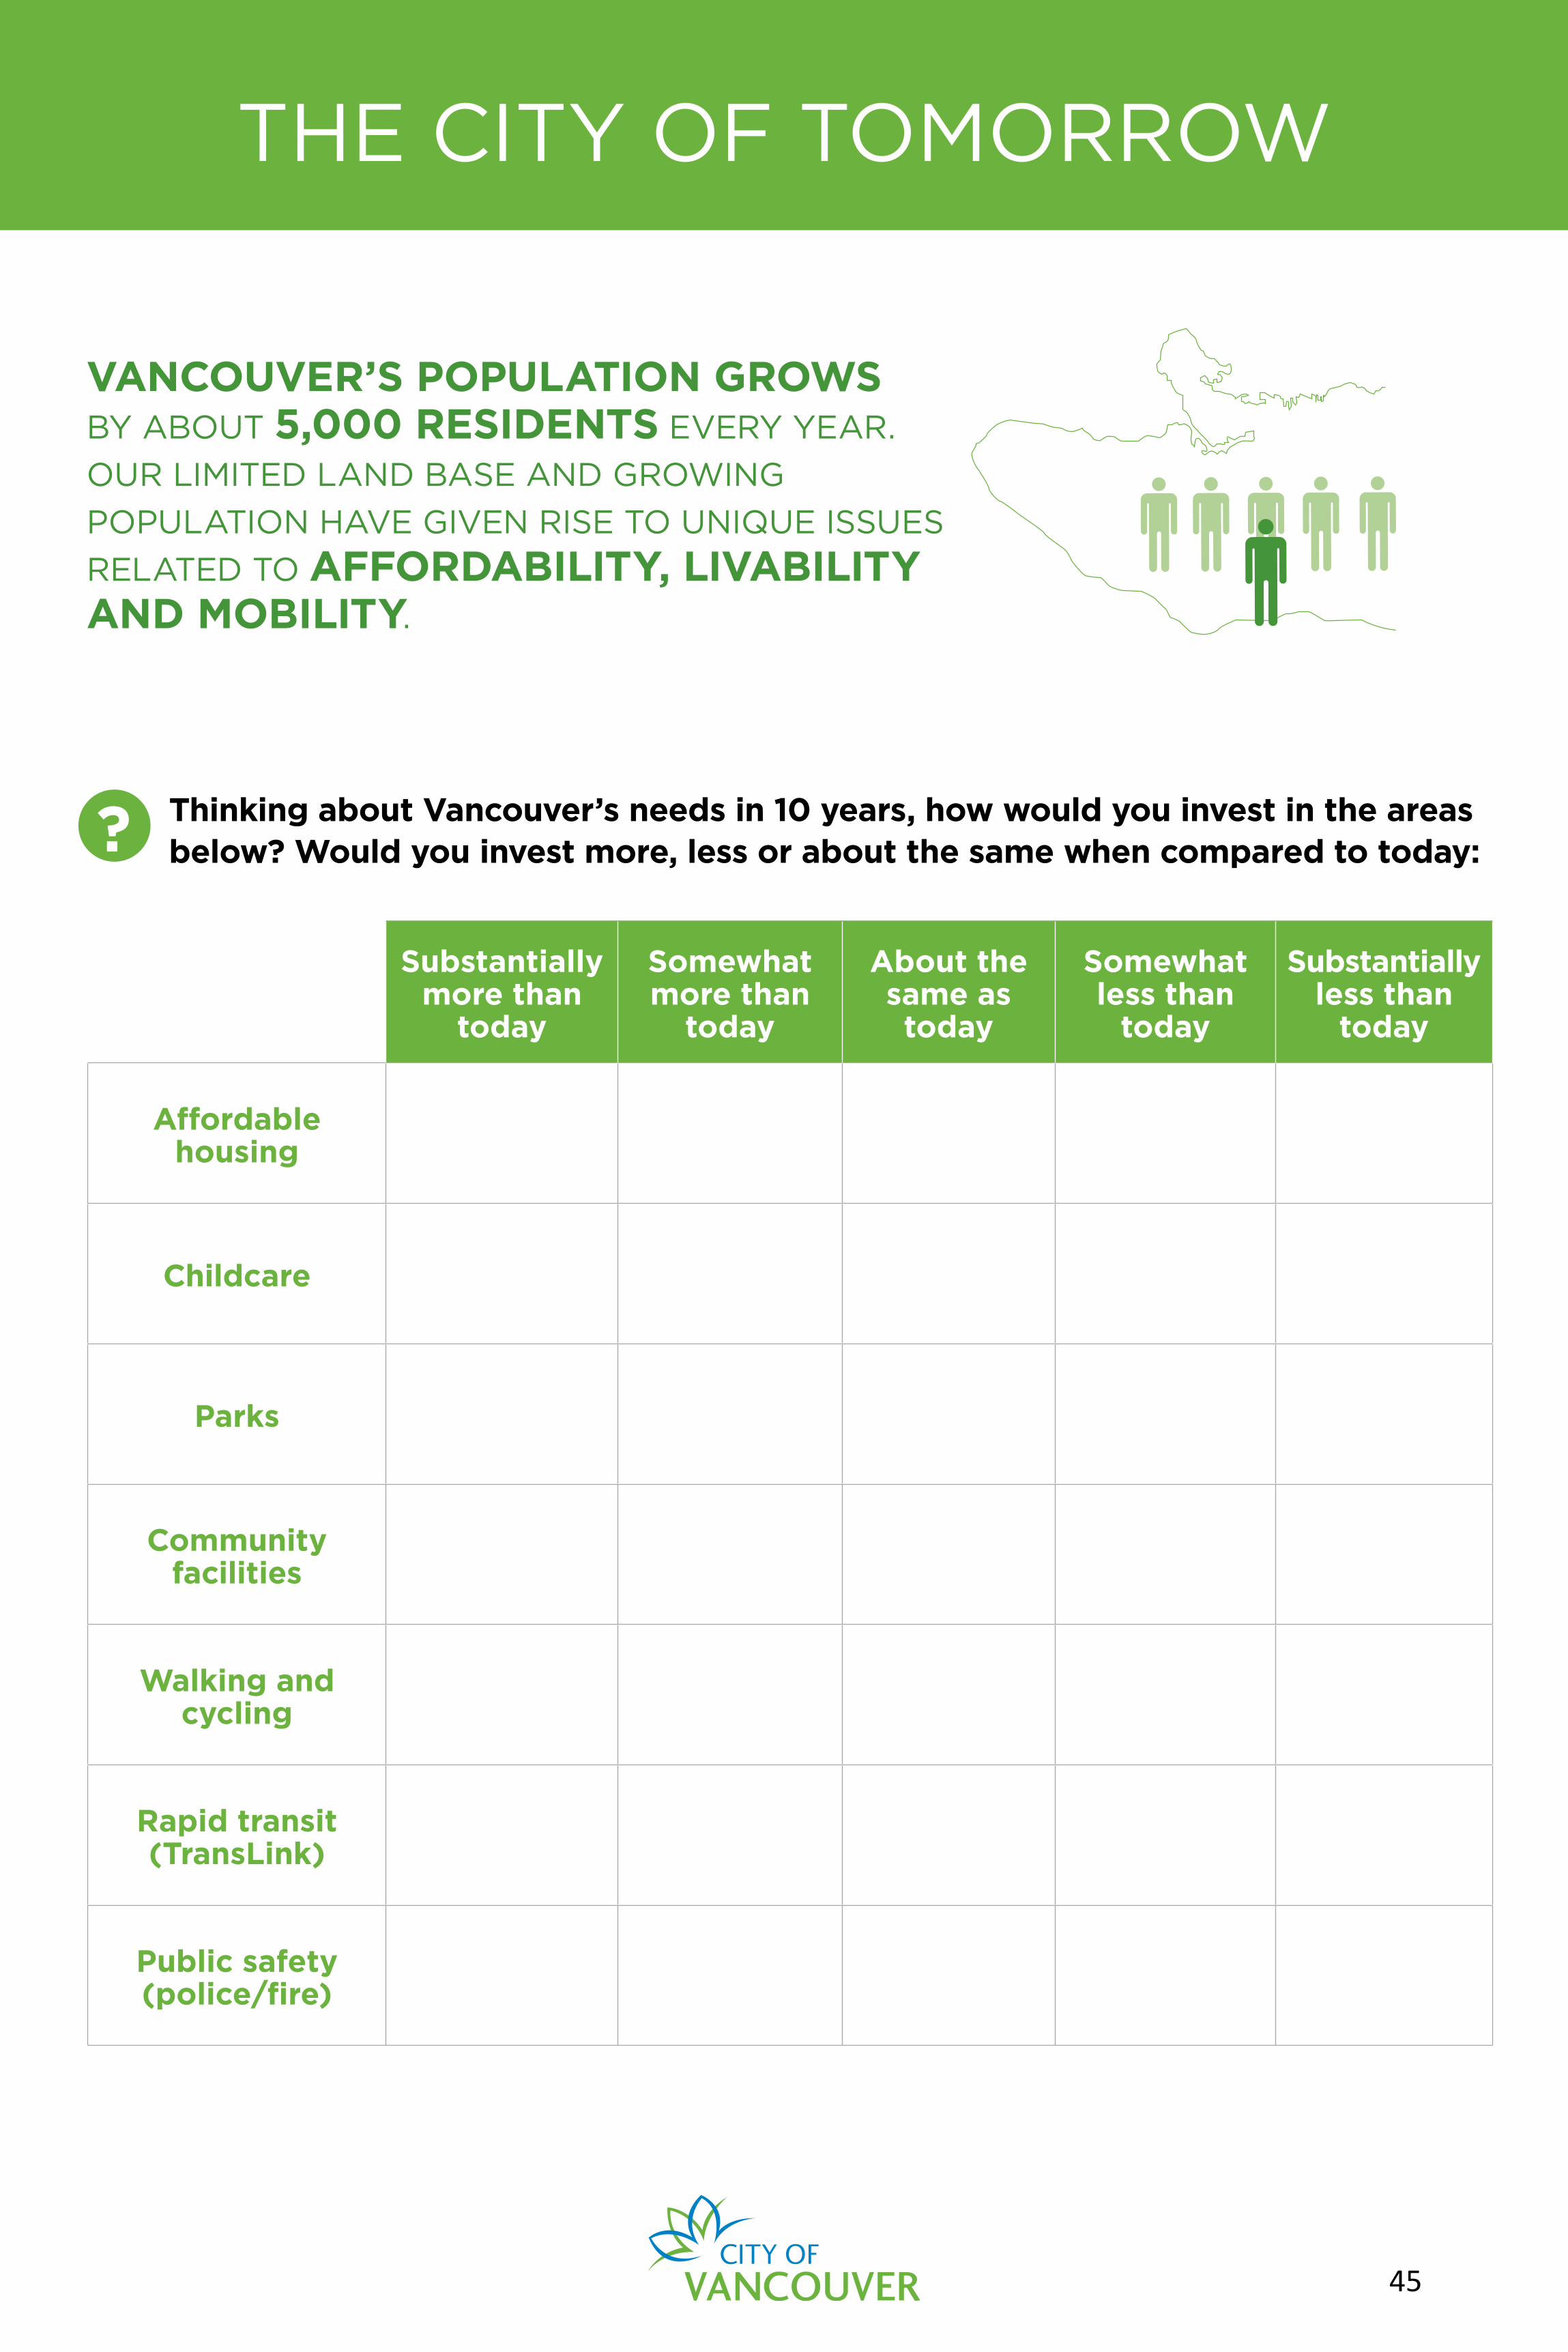
THE CITY OF TOMORROW
VANCOUVER’S POPULATION GROWS BY ABOUT 5,000 RESIDENTS EVERY YEAR.
OUR LIMITED LAND BASE AND GROWING
POPULATION HAVE GIVEN RISE TO UNIQUE ISSUES
RELATED TO AFFORDABILITY, LIVABILITY AND MOBILITY.
Substantially more than
today
Somewhat more than
today
About the same as today
Somewhat less than
today
Substantially less than
today
Affordable housing
Childcare
Parks
Community facilities
Walking and cycling
Rapid transit (TransLink)
Public safety (police/fire)
Thinking about Vancouver’s needs in 10 years, how would you invest in the areas below? Would you invest more, less or about the same when compared to today:?
45
If there is anything else you wanted to make sure we heard and didn’t get a chance to note, please use the comment form below.
WE LOVE TO HEAR YOUR IDEAS!
Thanks for your feedback today!It will help us as we put together the City of Vancouver’s 10-year Capital Strategic Outlook and the Draft 4-year Capital Plan.
A follow-up round of public consultation will be organized to gather feedback on the Draft Capital Plan this spring.
STAY TUNED!
What else do you want to tell us?
46