Embed Size (px)
Citation preview

REPORT DOCUMENTATION PAGE
Form Approved
OMB NO. 0704-0188
Public Reporting burden for this collection of information is estimated to average 1 hour per response, including the time for reviewing instructions, searching existing data sources, gathering and maintaining the data needed, and completing and reviewing the collection of information. Send comment regarding this burden estimates or any other aspect of this collection of information, including suggestions for reducing this burden, to Washington Headquarters Services, Directorate for information Operations and Reports, 1215 Jefferson Davis Highway, Suite 1204, Arlington, VA 22202-4302, and to the Office of Management and Budget, Paperwork Reduction Project (0704-0188,) Washington, DC 20503. 1. AGENCY USE ONLY ( Leave Blank)
2. REPORT DATE: 14 March 2005
3. REPORT TYPE AND DATES COVERED Final Report 18 August 2003 – 30 September 2004
4. TITLE AND SUBTITLE Retrodirective Noise-Correlating Radar in X-Band
5. FUNDING NUMBERS MDA972-03-C-0099
6. AUTHOR(S) Elayne Brown
7. PERFORMING ORGANIZATION NAME(S) AND ADDRESS(ES) Physical Domains
8. PERFORMING ORGANIZATION REPORT NUMBER 6 Final
9. SPONSORING / MONITORING AGENCY NAME(S) AND ADDRESS(ES) Defense Advanced Research Projects Agency Advanced Technology Office/ATO Program: Retrodirective Noise-Correlating Radar in X-Band ARPA Order No. Q354/00, Program Code: 3E20 Contract No. MDA972-03-C-0099 through DARPA CMO
10. SPONSORING / MONITORING AGENCY REPORT NUMBER Project Start Date 18 August 2003
11. SUPPLEMENTARY NOTES The views and conclusions contained in this document are those of the authors and should not be interpreted as representing the official policies, either expressly or implied, of the Defense Advanced Research Projects Agency or the U.S. Government 12 a. DISTRIBUTION / AVAILABILITY STATEMENT Approved for public release; distribution unlimited.
12 b. DISTRIBUTION CODE Unclassified
13. ABSTRACT (Maximum 200 words) This project entails the design, construction, and demonstration of a X-band noise correlating radar with a retrodirective antenna. Preliminary simulations of this system indicate that it should provide the following benefits: (1) approximately 5-times reduction in acquisition time compared to traditional electronically-steered search-mode radar, and an even greater reduction in comparison to mechanically scanned radar, (2) a significant reduction in probability-of-intercept compared to traditional search radars based on coherent transmitters, and (3) a significantly reduced cost and greater simplicity since several of the most expensive components in traditional radar - coherent oscillators, T/R modules, and precision phase shifters – are completely avoided by the proposed approach. The prototype RNC radar will have four channels, each channel having a complementary transmit/receive antenna pair. The antenna type is a printed-circuit patch. The electronic gain connecting the receive and transmit antennas will be roughly 100 dB, all derived from commercial-off-the-shelf (COTS) components. 14. SUBJECT TERMS Noise correlating radar, retrodirective antennas, X band, acquisition time
15. NUMBER OF PAGES 28
16. PRICE CODE
17. SECURITY CLASSIFICATION OR REPORT
UNCLASSIFIED
18. SECURITY CLASSIFICATION ON THIS PAGE
UNCLASSIFIED
19. SECURITY CLASSIFICATION OF ABSTRACT
UNCLASSIFIED
20. LIMITATION OF ABSTRACT
UL NSN 7540-01-280-5500 Standard Form 298 (Rev.2-89) Prescribed by ANSI Std. 239-18 298-102

2
Continuation Sheet for SF298 Final Report: Retrodirective Noise Correlating Radar in X Band
Table of Contents
Task Background and Objectives ................................................................................... 3
Technical Issues................................................................................................................. 4
General Methodology ....................................................................................................... 8
Specific Hardware Development ................................................................................... 10
Technical Results ............................................................................................................ 17
A. Experimental...................................................................................................... 17
B. Simulation .......................................................................................................... 20
Important Findings and Conclusions............................................................................ 25
Implications for Further Research................................................................................ 26

3
Task Background and Objectives
Historically, radar has been designed and implemented for medium to long-range
applications such as air defense, air traffic control, and collision avoidance. In these
applications the response times are long enough that the radar design need not be
emphasized for fast detection and acquisition, but instead long range and high resolution
(i.e, spatial and/or Doppler). As such, when applied to short-range applications such as
battlefield and urban protection, conventional radars must usually be “cued” by another
system, such as an ultrasonic sensor.
With the present emphasis worldwide on Counter-Terrorism and Homeland
Security, a need exists in the radar field for improved transmit and receive apparatus and
techniques that can automatically detect and track a target without the need for a separate
sensor to provide cueing. For example, there is a great need for sensors that can detect
and acquire mid-to-short-range threats such as shells and rocket-propelled grenades. The
response time must be well below 1 sec, so it is imperative that the radar have short
detection and acquisition times, and should preferably be “auto-cued”. A need also exists
for sensors that can detect very small targets, such as ballistic projectiles, moving very
fast and at close range. The detection and acquisition times of the radar should then be
short compared to the time-of-flight of such projectiles, which means an acquisition time
measured in milliseconds.
The present effort addressed a new RF sensor concept - the retrodirective (array)
noise-correlating (RNC) radar. It was originally proposed in basic research to have very
short detection and acquisition times compared to conventional, pencil-beam, scanned
radar systems.1 Prior to this development the primary application to retrodirective arrays
was communications.2,3 The present work developed the RNC radar in X band for the
same reasons that other radars have followed: (1) atmospheric propagation is very good,
even in rain, (2) antennas are small but highly efficient, and (3) electronics is readily
1 S. Gupta and E.R. Brown, “Retro-directive Noise Correlation Radar with Extremely Low Acquisition Time,” S. Gupta and E. R. Brown, 2003 IEEE MTT-S Digest (IEEE, New York, 2003), pp. 599-603. 2 R. Y. Miyamoto, Y. Qian, and T. Itoh, “A Retrodirective Array Using Balanced Quasi-Optical FET Mixers with Conversion Gain,” IEEE MTT-S International Microwave Symposium Digest, 1999, pp. 655-658. 3 L. D. DiDomenico, G. M. Rebeiz, “Digital communications using self-phased arrays”, IEEE Transactions on Microwave Theory & Techniques, vol.49, no.4, pt.1, April 2001, pp.677-84

4
Technical Issues
available, including MMICs and RFICs. The simplicity of the RNC approach has
allowed the demonstration in X band to occur in less than one year.
RNC radar provides a new modality that combines three elegant RF techniques:
(1) retrodirective array antenna architecture in the transmitter and receiver4; (2) noise-
correlative signal processing5; and (3) high-gain, band-limited feedback between each
receive antenna element and its conjugate transmit element. In “rest mode” the RNC
radar transmits in a broad pattern dictated by a single element in the array. When a target
appears it creates a strong cross-correlation in the reflected noise power between adjacent
elements in the receiver. The receive signal is then amplified in each channel and
coupled back to the transmit array where it is re-radiated towards the target but now with
antenna array gain because of the cross-correlation. The transmitted power reflects off
the target again and is received with even greater cross-correlation and the process
repeats, similar to the start-up phase of a cavity oscillator. The RNC radar is thus
“autocuing” and can detect targets in just a few radiative round-trips through free space. 4 L. C. Van Atta, “Electromagnetic Reflector,” U. S. Patent No. 2,908,002; October 6, 1959. 5 J. Kraus, Radio Astronomy (McGraw Hill, New York, 1966), Chap. 7.
Transmit ArrayReceive Array
G, ∆f
IsolationLayer
Equal TimeDelay in allChannels
FromTarget
ToTarget
G, ∆f
G, ∆f
G, ∆f
Equal Gainin all Channels
Transmit ArrayReceive Array
G, ∆f
IsolationLayer
Equal TimeDelay in allChannels
FromTarget
ToTarget
G, ∆f
G, ∆f
G, ∆f
Equal Gainin all Channels
Fig.1. van Atta retrodirective architecture

5
The RNC radar noise cross-correlation and rapid target acquisition were first
studied theoretically1, and then demonstrated experimentally in S band on large targets
with two-element transmit and receive arrays6. Detection times less than 100 ns were
demonstrated out to target ranges of about 10 m. This detection time was found to be
limited primarily by the group delay through the transceiver electronics and a single
round-trip time through free space. Target acquisition (location in range and angle) was
achieved in only two to three round-trips - still much faster than any known radar or
acoustic sensor.
As depicted notionally in Fig. 1, the RNC radar in the present demonstration has
the classic van-Atta architecture with separate transmit and receive arrays and a
complementary RF interconnect between the two. The RF interconnect consists
essentially of a band-limited amplifier chain with in-phase and quadrature cross- 6E.R. Brown, A.C. Cotler, S. Gupta, and A. Umali,” First Demonstration of a Retrodirective Noise-Correlating Radar in S Band”, Proc. 2004 Int.Microwave Symp., Ft. Worth, TX.
(b)(a) (b)
target target
(b)(a) (b)(b)(a) (b)
target target
Fig. 2. Comparison of (a) conventional pencil-beam search radar to (b) RNC radar.

6
correlation between channels to detect targets and determine their location in space. Short
detection time is achieved by broadcasting a high level of additive white Gaussian noise
(AWGN) from the transmit array so that any target within the beam solid angle of a
single element will reflect a measurable signal back to the receive array.
The RNC radar is perhaps best explained in comparison to a conventional, pencil-
beam search radar as in Fig. 2(a). To find a target a pencil-beam radar must scan across a
solid angle of space, ΩS, either electronically or mechanically. The evolution of time for
the pencil-beam radar is depicted in Fig. 2(a) by successive transmission passes. Each
pulse is separated from the previous by the round-trip time of the radiation tRT. And each
is separated from the previous one in space by the angular resolution ΩB. In this mode
the minimum detection time of a (high RCS) target is roughly ΩS/ΩB (tRT). For a typical
pencil beam width of ΩB = 2o and a range of 20 m searching over an angle of 90o, this
becomes a minimum target detection time of ~0.3 ms.
In its simplest form the RNC radar has separate transmit (Tx) and receive (Rx)
antenna apertures, each consisting of one- or two-dim arrays of elemental antennas
arranged in the retrodirective configuration [L.C. Van Atta, U.S. Patent No. 2908002,
1959]. The RNC radar starts in “rest mode” by radiating uncorrelated additive white
Gaussian noise (AWGN) from each antenna element in the Tx array, as represented by
the first-pass output of Fig. 2(b). The correlation between elements required for
constructive interference, and thus array gain, is lacking. So the radiation is spread over
the (broad) beam pattern of each individual element and the total power striking the target
depends linearly on the number of elements N in the Tx array.

7
If a small target suddenly appears to the RNC radar within the angular-field-of-
view of each element, the target will intercept a power from all the Tx antennas in
proportion to its radar cross section, and scatters this power back to the Rx array. A key
attribute of the RNC radar phenomenology is that this initial received radiation is
correlated between adjacent elements of the Rx array, as shown in the conceptual
diagram of Fig. 3. Although the scattered radiation is stochastic in time, it is
deterministic in space, being constant on any small spherical surface. This is a
consequence of the Van-Cittert and Zernike theorem of statistical optics [Principles of
Optics 5th Ed., M. Born and E. Wolf (Pergamon, New York, 1975)].
The second key attribute of the RNC radar is that the cross-correlated component
in the Rx elements is greatly amplified by the radar electronics and fed back to the Tx
array in a retrodirective fashion – i.e., each Rx element is interconnected to one and only
one (“conjugate”) Tx element such that the time delay between all element pairs is equal.
Under this condition, the cross-correlated signal component is re-radiated into space from
the transmit elements with strong constructive interference and array gain between
elements, and is directed primarily toward the target, as shown for the 2nd transmit pass
of Fig. 2(b). The process repeats with a rapid growth of each subsequent transmitted pass
in Fig. 2(b), creating the “RNC feedback loop” and an inherent ability to detect and
acquire targets very fast.
Ri
Ri+1
Ri
Ri+1
LargeDiffuseTarget
uncorrelated AWGN
correlated AWGN(a)
(b)
Small Target
Ri
Ri+1
Ri
Ri+1
LargeDiffuseTarget
uncorrelated AWGN
correlated AWGN(a)
(b)
Small Target
Fig. 3. Correlated and uncorrelated AWGN between adjacent elements of the receive array.

8
General Methodology
The X-Band RNC radar in the present experiments consists of four identical
transceiver chains as shown in Fig. 4. The transmit and receive antennas are both patch
antennas designed to have a broadside pattern with a directivity of just over 5 dB. They
are both matched to 50 ohms and have a minimum |S11| at the center frequency of –20
dB. Each chain contains three gain elements, the first one being an low-noise amplifier
(LNA) having a noise figure of 2.0 dB and a small-signal gain of 32 dB. The next
element is variable gain amplifier (VGA) that is very useful in the overall gain in each
channel. The last element is a solid-state power amplifier having a gain of ~30 dB and
power maximum power handling of ~30 dBm.
A key passive component in each channel is the fast solid-state switch. The
insertion loss is at least 30 dB in the “off” state, and 1.6 dB in the “on” state. The 10-90
risetime was found to be about 6 ns. And the maximum pulse-repetition frequency was
about 15 MHz, limited by the TTL-logic drive circuitry in the switches. A second key
passive component is the cross correlator. This RNC design uses double-balanced
mixers to carry out the cross correlation between adjacent channels. A sample from one
channel is coupled to the RF port and a sample from the neighboring channel is coupled
to the LO port either in-phase with the RF port (I cross-correlation) or in-quadrature
with the RF port (Q cross correlation). When used in this way, the dc current from the
IF port (or voltage if this port is terminated in a high impedance) is given by I = A [P-
RFPLO]1/2cos(φrf - θlo), where φrf and φlo are the phases of the signals in the two adjacent
channels.
A third key passive component is the phase shifter. It was decided to use a
mechanically-adjustable coaxial line stretcher to do the equalization between channels
necessary to achieve retrodirectivity in the antenna function. Mechanical line stretchers
provide true time delay, so a precise adjustment at one frequency provides good
equalization across the entire passband. The fourth and final key passive component was
the bandpass filter. A custom 5th-order coupled-microstrip filter was designed and
fabricated. The center frequency is about 9.9 GHz and the –3 dB full bandwidth is about
0.70 GHz. The in-band insertion loss is no worse than 2.0 dB, and the filters displays a
minimum of about 20 dB of rejection either well below or well above the passband.

9
After assembling all components, the gain and phase of the channels between the
input and output antennas was measured with a vector network analyzer. Adjustment of
VGA and line stretcher resulted in equalization in each channel such that the overall gain
to spectrumanalyzer
Envelope de
to spectrumanalyzer
Envelope deEnvelopeDetector
PhaseShifter
PhaseShifter
PhaseShifter
PhaseShifter
BandpassFilter
Fig. 4. Block diagram of four-channel X-band RNC radar

10
was 80 +/- 0.5 dB in amplitude across the passband, and the phase was constant +/- 5o.
The group delay through each channel was measured to be ≈7.2 ns.
As shown in Fig. 4 the signal processing is carried out by sampling a small but
equal portion of the power in each channel and doing in-phase (I) and quadrature (Q)
cross correlation. In addition to the double balanced mixers described above, 3-dB
hybrids and a 90-degree phase shifter are required.
Several targets were tested, starting with short lengths of copper pipe and
culminating in the 30-caliber hollow-tip bullet shown in Fig. 5. All targets were
suspended in front of the RNC radar by kite string anchored to the ceiling of the
laboratory. The kite string was confirmed to have immeasurably low RCS at X-band
frequencies.
Specific Hardware Development
(1) Each component in the block diagram of Fig. 4 was purchased and characterized
independently. There are three amplifiers in each RNC channel: (1) the Miteq
low-noise amplifier (LNA), (2) the Miteq variable gain amplifier (VGA), and (3)
the JCA solid-state power amplifier (SSPA). The combined gain of all three
amplifiers is around 90 dB. When combined with the small losses of the passive
components discussed below, the overall channel gain was just over 80 dB. To
equalize the gain in the three channels, a dc control box was designed and
Fig 5. 30-caliber bullet under test.

11
constructed to slave three of the channels with respect to the one with the lowest
gain. This procedure was carried out with the leased 8720ES Vector Network
Analyzer, and the gains were equalized to an accuracy of approximately 0.5 dB.
(2) As previously mentioned a key passive component in each channel of the RNC
radar is the fast solid-state switch. The switches were procured from Miteq and
were quickly tested on the VNA and with a fast pulse-generator set-up. The VNA
data for all five switches is plotted in Fig. 6 and shows two distinct states of the
switches: (a) positive bias (~+2 V) where the switches are “off” and have an
insertion loss of at least 17 dB, and (b) zero or slightly negative bias where the
switches are “on” and have an insertion loss of no worse than about –1.6 dB.
The 10-90 risetime of all was found to be about 6 ns consistent with our
specification. But the maximum pulse-repetition frequency was only about 15
MHz, limited by the TTL-logic drive circuitry in the switches.
(3) A second key passive component is the cross correlator. As discussed at length in
the proposal, this RNC design uses double-balanced mixers to carry out the cross
correlation between adjacent channels. A sample from one channel is coupled to
the RF port and a sample from the neighboring channel is coupled to the LO port
either in-phase with the RF port (I cross-correlation) or in-quadrature with the RF
port (Q cross correlation). When used in this way, the dc current from the IF port
(or voltage if this port is terminated in a high impedance) is given by I = A [P-
RFPLO]1/2cos(φrf - θlo), where φrf and φlo are the phases of the two signals feeding
the RF and LO ports, respectively. This is the same transfer function provided by
double-balanced mixers used as phase detectors. To confirm and calibrate this
behavior, we measured every mixer with a coherent X-band signal split equally
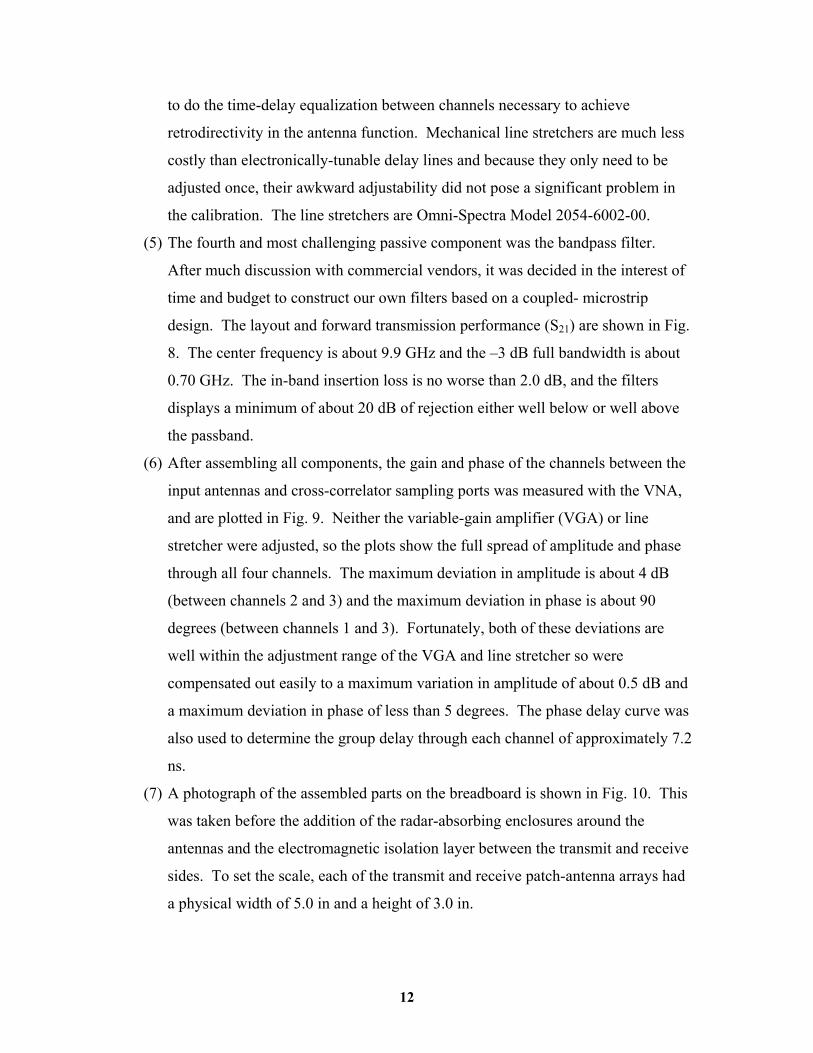
between the RF and LO ports. As shown in Fig. 7, the plot of log(Vdc) vs
log(PRF ) displays linear behavior up to an power level of roughly –20 dBm.
Saturation then occurs. In the baseline RNC radar architecture, the sampling of
each channel occurs through a –20-dB directional coupler, so the RMS power
levels are expected to be well below –20 dB.
(4) A third key passive component is the phase shifter. After considerable
investigation it was decided to use a mechanically-adjustable coaxial line stretcher
12
to do the time-delay equalization between channels necessary to achieve
retrodirectivity in the antenna function. Mechanical line stretchers are much less
costly than electronically-tunable delay lines and because they only need to be
adjusted once, their awkward adjustability did not pose a significant problem in
the calibration. The line stretchers are Omni-Spectra Model 2054-6002-00.
(5) The fourth and most challenging passive component was the bandpass filter.
After much discussion with commercial vendors, it was decided in the interest of
time and budget to construct our own filters based on a coupled- microstrip
design. The layout and forward transmission performance (S21) are shown in Fig.
8. The center frequency is about 9.9 GHz and the –3 dB full bandwidth is about
0.70 GHz. The in-band insertion loss is no worse than 2.0 dB, and the filters
displays a minimum of about 20 dB of rejection either well below or well above
the passband.
(6) After assembling all components, the gain and phase of the channels between the
input antennas and cross-correlator sampling ports was measured with the VNA,
and are plotted in Fig. 9. Neither the variable-gain amplifier (VGA) or line
stretcher were adjusted, so the plots show the full spread of amplitude and phase
through all four channels. The maximum deviation in amplitude is about 4 dB
(between channels 2 and 3) and the maximum deviation in phase is about 90
degrees (between channels 1 and 3). Fortunately, both of these deviations are
well within the adjustment range of the VGA and line stretcher so were
compensated out easily to a maximum variation in amplitude of about 0.5 dB and
a maximum deviation in phase of less than 5 degrees. The phase delay curve was
also used to determine the group delay through each channel of approximately 7.2
ns.
(7) A photograph of the assembled parts on the breadboard is shown in Fig. 10. This
was taken before the addition of the radar-absorbing enclosures around the
antennas and the electromagnetic isolation layer between the transmit and receive
sides. To set the scale, each of the transmit and receive patch-antenna arrays had
a physical width of 5.0 in and a height of 3.0 in.

13
S21 Amplitude, Bias = +2
-35
-30
-25
-20
-15
8.8E+09 9E+09 9.2E+09 9.4E+09 9.6E+09 9.8E+09 1E+10 1E+10
Frequency (Hz)
Mag
nitu
de S
21 (d
B)
971818971820
971822
971819
971821
971820
971822971819
971818
971821
S21 Magnitude, Bias = 0
-1.8
-1.6
-1.4
-1.2
-1
-0.8
8.8E+09 9E+09 9.2E+09 9.4E+09 9.6E+09 9.8E+09 1E+10 1E+10
Frequency (Hz)
Mag
nitu
de S
21 (d
B)
971820
971822971819
971818
971821
S21 Magnitude, Bias = -2
-1.8
-1.6
-1.4
-1.2
-1
-0.8
8.8E+09 9E+09 9.2E+09 9.4E+09 9.6E+09 9.8E+09 1E+10 1.02E+10
Frequency (Hz)
Mag
nitu
de S
21 (d
B)
971820971822971819
971818
971821
Fig. 6 VNA data for all five switches
14
0
5
10
15
20
25
-65 -60 -55 -50 -45 -40 -35 -30
Pin [dBm]
log
Vout
[mV]
Fig. 7. Square-law detector transfer curve

15
-60
-50
-40
-30
-20
-10
0
0.0 5.0 10.0 15.0
Frequency [GHz]
Rel
ativ
e G
ain
3-dB BW~0.7 GHz
Port 1
Port 2
-60
-50
-40
-30
-20
-10
0
0.0 5.0 10.0 15.0
Frequency [GHz]
Rel
ativ
e G
ain
3-dB BW~0.7 GHz
-60
-50
-40
-30
-20
-10
0
0.0 5.0 10.0 15.0
Frequency [GHz]
Rel
ativ
e G
ain
3-dB BW~0.7 GHz
Port 1
Port 2
Fig. 8 Layout and forward transmission performance (S21) for the bandpass filter

16
-40
-38
-36
-34
-32
Am
plitu
de (d
B)
Channel 2
Channel 4
Channel 1
Channel 3
-200
-150
-100
-50
0
50
100
150
200
8.8 9 9.2 9.4 9.6 9.8 10 10.2Frequency (GHz)
Phas
e (d
eg)
Channel 1
Channel 2Channel 3
Channel 4
-40
-38
-36
-34
-32
Am
plitu
de (d
B)
Channel 2
Channel 4
Channel 1
Channel 3
-200
-150
-100
-50
0
50
100
150
200
8.8 9 9.2 9.4 9.6 9.8 10 10.2Frequency (GHz)
Phas
e (d
eg)
Channel 1
Channel 2Channel 3
Channel 4
Fig. 9. VNA-measured S21 (amplitude and phase) of each channel between the input antennas and cross-correlator sampling ports

17
Technical Results
A. Experimental
After the assembly the X-Band RNC radar was completed the operational
characteristics (with and without targets) were measured, and the time-domain pulsing
methods were established. The fast RF switches in each channel were driven with square
pulses from a 50-Ω generator having a risetime of ≈10 ns and a controllable pulse
repetition frequency (PRF). The PRF and pulsewidth were tailored to the detection of
targets at close range. The PRF was set to a relatively high value of 15 MHz consistent
with an unambiguous range RU = c/(2*PRF) = 10 m. The pulse width tp was set to 20 ns
to allow for a range resolution of ∆R = ctp /2 = 3 m.
The RNC radar was then put through a sequence of tests, the first one to examine
the power spectrum by tapping off a portion of the RF power to a spectrum analyzer. In
the absence of any target, the spectrum is dominated by the additive white Gaussian noise
(AWGN) within the passband between 9.6 and 10.3 GHz. With any metallic target
Fig. 10. Photograph of assembled X-Band RNC radar breadboard.

18
present, the RF power spectrum was modified significantly, displaying enhancement
signatures at a small number of frequencies in the passband.
The RF power spectrum associated with the stationary 30-caliber bullet of Fig. 5
is shown in of Fig. 11. The spectrum displays several resonant “signatures” related to
longitudinal modes created in free space between the transmit antenna, the target and the
receive antenna, consistent with achieving a modulo [2π] phase shift around the RNC
loop (free space plus electronics).
The next test was taken on the same stationary bullet in the time domain through
the envelope detector of channel 1 in the block diagram of Fig. 4. The target was located
at the broadside position at a range of 1 m, and the PRF and pulsewidth applied to the
switch in each channel of the transceiver (Fig. 4) were ≈15 MHz and 20 ns, respectively.
Fig 11. Power spectrum for 30-caliber bullet at range of 1 m. Start Frequency is 9.3 GHz, the Stop Frequency is 10.3 GHz, the Horizontal Scale is 100 MHz/div, the Vertical Scale is 5 dB/div, the RF bandwidth is 3MHz .

19
The resulting time-domain envelope waveform is shown in Fig. 12. The 10-90%
transition time is seen to be ≈48 ns. The bullet was then moved to various other
stationary positions away from the broadside point but close to the same 1-m range. The
detection waveform remained very similar to that shown. Finally the target was screened
from the RNC transceiver by radar-absorbing foam and the envelope detector output
disappeared except for the AWGN component. This proved that the pulse shown in Fig.
12 was associated with the target and, furthermore, that target detection was occurring
with a single pulse.
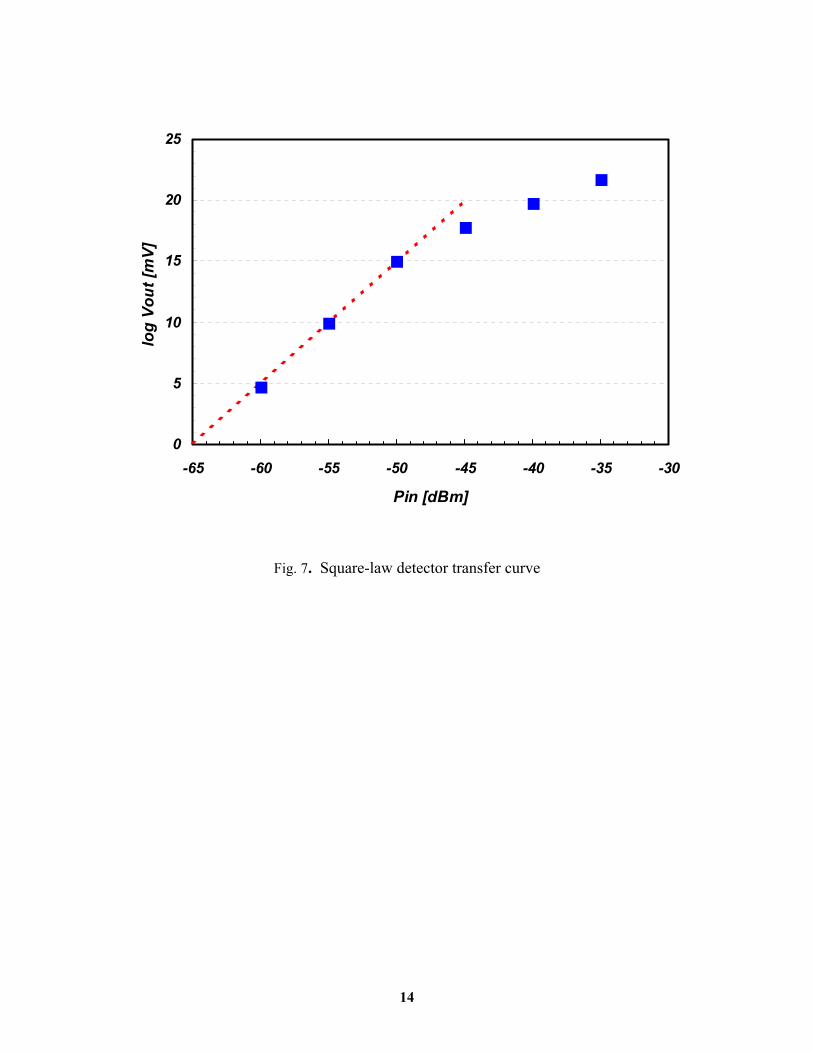
Finally the radar was characterized on a target in motion: the same 30-caliber
bullet pendulating on the kite string in front of the RNC transceiver. The pendulating
amplitude was roughly 4 inches and the pendulating axis was about 45o relative to the
broadside direction of the radar. While in motion, the output signals from the I and Q
cross correlators of Channel 2 in Fig. 4 were low-pass filtered using the integrating
amplifiers, and then observed on the X-Y display of a digital oscilloscope. The target
10-90% risetime ≈ 48 ns
PulsedGain
Waveform
Cross-Correlated
Signal
Time-base = 20 ns/div
10-90% risetime ≈ 48 ns
PulsedGain
Waveform
Cross-Correlated
Signal
Time-base = 20 ns/div
Fig. 12. Single-pulse waveform for 30-caliber bullet.
20
motion is shown as a sequence of still pictures in Fig. 13. This represents the first target
track obtained by the RNC radar.
B. Simulation
Like any electrical feedback effect, the RNC radar in the presence of a target must
be analyzed with fields in space, and related current or voltage quantities X in the
transceiver channel. A block diagram of the analytic technique is shown in Fig. 14
assuming four Tx and four Rx antenna elements arranged in the retrodirective
architecture. Each antenna is modeled according to its far-field pattern, and the target is
modeled with a scalar radar cross section, σ. Radiation reflected from a target can be
t1
t3 t4
t6t5
t2t1
t3 t4
t6t5
t2
Q
I
Q
I
Fig.13. Target track of 30-caliber bullet at six successive times of pendulating motion.
21
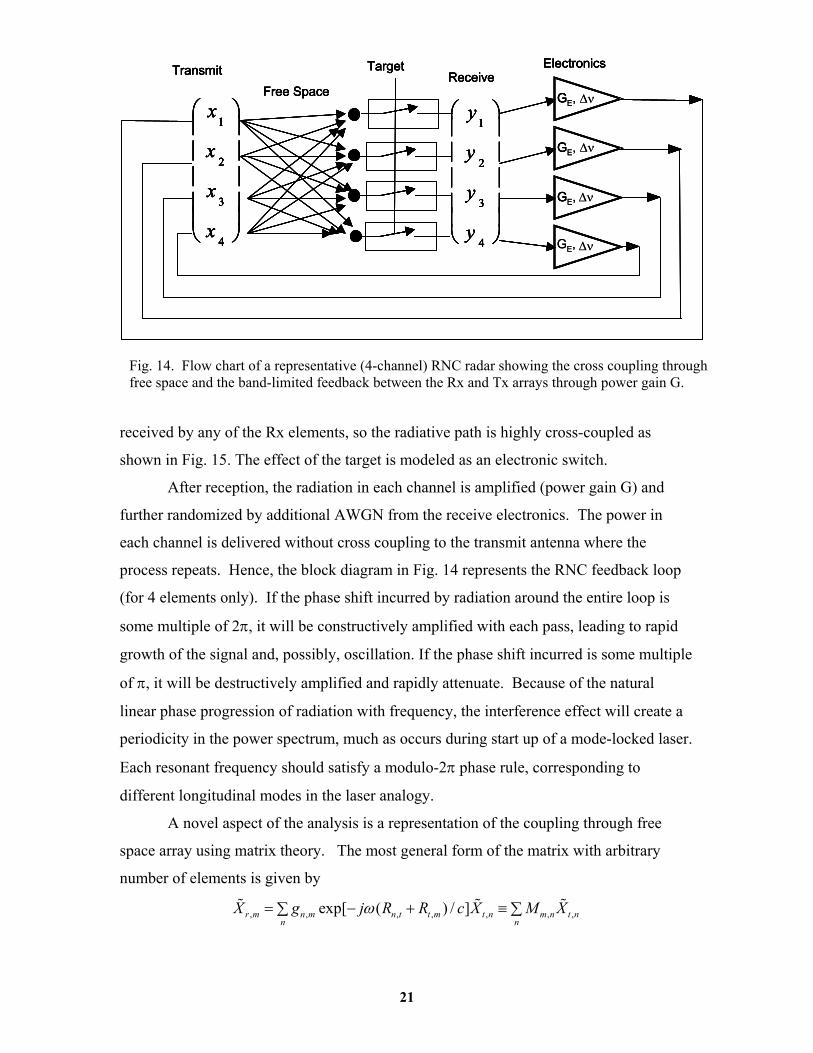
received by any of the Rx elements, so the radiative path is highly cross-coupled as
shown in Fig. 15. The effect of the target is modeled as an electronic switch.
After reception, the radiation in each channel is amplified (power gain G) and
further randomized by additional AWGN from the receive electronics. The power in
each channel is delivered without cross coupling to the transmit antenna where the
process repeats. Hence, the block diagram in Fig. 14 represents the RNC feedback loop
(for 4 elements only). If the phase shift incurred by radiation around the entire loop is
some multiple of 2π, it will be constructively amplified with each pass, leading to rapid
growth of the signal and, possibly, oscillation. If the phase shift incurred is some multiple
of π, it will be destructively amplified and rapidly attenuate. Because of the natural
linear phase progression of radiation with frequency, the interference effect will create a
periodicity in the power spectrum, much as occurs during start up of a mode-locked laser.
Each resonant frequency should satisfy a modulo-2π phase rule, corresponding to
different longitudinal modes in the laser analogy.
A novel aspect of the analysis is a representation of the coupling through free
space array using matrix theory. The most general form of the matrix with arbitrary
number of elements is given by
, , , , , , ,exp[ ( ) / ]r m n m n t t m t n m n t nn n
X g j R R c X M Xω= − + ≡∑ ∑
4
3
2
1
x
x
x
x
4
3
2
1
y
y
y
y
TargetTransmit ReceiveFree Space
Electronics
GGE, ∆ν
4
3
2
1
x
x
x
x
4
3
2
1
y
y
y
y
TargetTransmit ReceiveFree Space
GE,G
GGE,
GE,
Electronics
∆ν
∆ν
∆ν
4
3
2
1
x
x
x
x
4
3
2
1
x
x
x
x
4
3
2
1
y
y
y
y
4
3
2
1
y
y
y
y
TargetTransmit ReceiveFree Space
Electronics
GGE, ∆ν
4
3
2
1
x
x
x
x
4
3
2
1
x
x
x
x
4
3
2
1
y
y
y
y
4
3
2
1
y
y
y
y
TargetTransmit ReceiveFree Space
GE,G
GGE,
GE,
Electronics
∆ν
∆ν
∆ν
Fig. 14. Flow chart of a representative (4-channel) RNC radar showing the cross coupling through free space and the band-limited feedback between the Rx and Tx arrays through power gain G.

22
where Xr,m is the (phasor) electrical signal at the mth Rx element, Xt,n is the (phasor)
electrical signal at the nth Tx element, and gnm is the free-space coupling gain between
the nth Tx and mth Rx elements, and Mm,n is the retrodirective matrix element. The
quantities Rnt and Rtm are the range factors between the nth Tx element and the target, and
between the target and the mth Rx element, respectively. From the trigonometry of Fig.
15, (Rnt)2 = (R0cosθ0)2 + [R0sinθ0 – w - (n - 1)d]2 , and (Rtm)2 = (R0cosθ0)2 + [R0sinθ0 + w
+ (m - 1)d]2 , where R0 is the range to target from the geometric center of the arrays, w is
half the gap width between the Tx and Rx arrays, and d is the inter-element spacing.
If the target is in the far-field of both arrays, the free-space coupling gain can be
estimated from the Friis transmission formula, 1/ 22 1/ 2
, 3 4 3/ 2 20 0
( )( , )(4 ) (4 )
n m n mn m F
G G F F GFg v gR R
σλ θ λσθπ π
≈ → ≡
where the last step follows from having identical Tx and Rx elements and defines a free-
space gain amplitude, gF. Note that when the Tx and Rx arrays have the retrodirective
architecture with uniform element spacing, this matrix has special properties, including
exact symmetry about the diagonal. The RNC loop is completed by interconnection
between the conjugate elements of the Rx and Tx arrays:
N-ElementTransmit Array
M-ElementReceive Array GE, ∆ν
GE, ∆ν
......
Targetθ0
R0 RN,tR1,tRt,1
Rt,M
h = R0cosθ0
N-ElementTransmit Array
M-ElementReceive Array GE, ∆ν
GE, ∆ν
......
Targetθ0
R0 RN,tR1,tRt,1
Rt,M
h = R0cosθ0
Fig. 15. Geometrical layout of retrodirective antenna arrays relative to the target location.

23
, ,exp( )t m E g r mX g j t Xω= ⋅ −
where gE is the electronic gain [= (GE)1/2], assumed to be band-limited and identical in
amplitude and phase in each channel.
The detection stage of the RNC radar operation was evaluated as follows. The
initial signal from each Tx element Xt,n was assumed to be AWGN, fully uncorrelated
between the channels, Xt,n = Nt,n. The target was assumed to appear suddenly at time t =
0, and the signal at each Tx port was computed after successive passes around the loop,
each time adding more AWGN:
, , , ,1
( ) [( ) (1) ( 1)]p
kt m m n t n t n
k nX p M N N k
== + >∑ ∑
where Xt,m(p) denotes the signal at the mth transmit element after p passes through loop,
and Nt,n(k > 1) denotes new AWGN injected in each channel on the kth pass for k > 1).
The power spectrum for Xt,m(p) is computed in Fig. 16 at t = 0 and for three
successive passes around the loop of an RNC radar having 16 linear Tx and Rx elements,
and an electronic gain in each channel of 60 dB. The target was assumed to be located at
a range of 20 m and to have an isotropic σ of 1 cm2. After just one pass through free
space, the power spectrum in each channel shows a signature characteristic of quasi-
coherence in the form a comb of frequencies each separated by ≈7 MHz. On the second
and third passes, the coherent component continues building up in a steady background of
AWGN. Separate analysis using statistical detection theory showed that the probability
of detection exceeded 90% upon completion of the third pass at 420 ns.

24
1
10
100
1000
0 10 20 30 40 50 60 70
Number of Elements
Ran
ge [m
], Td
[ns] Range
Detection time
1
10
100
1000
0 10 20 30 40 50 60 70
Number of Elements
Ran
ge [m
], Td
[ns] Range
Detection time
Fig. 17 Simulation results for range and detection time vs. number of elements in the radar. The
target RCS was assumed to be σ = 1x10⁻⁴ m2.
Fig. 16. Sequence of power spectra for a single channel of a 1-dim, 16-element array in X band (9.7 to 10.1 GHz). The target is at a range of 20 m and has an RCS of 1.0 cm2. The time increment is 140 ns corresponding to one round trip time (133 ns) plus the group delay (7 ns) through the electronics.

25
Important Findings and Conclusions
A great deal was learned in this one-year effort, most of which falls into the
categories of phenomenology and system capability. Under phenomenology, it was
discovered that very small targets can be detected at close range by the RNC radar, down
to the size of bullets. By its nature, the RNC radar detects such targets in just a few
round-trip times through free space. At the same it was noted that a very small level of
cross-coupling between the transmitter and receiver can cause false detection and lead to
oscillation and saturation of the transceiver. So electromagnetic decoupling between the
transmit and receive antennas is essential.
Our approach to the decoupling is shown in Fig. 18. It consisted of an aluminum
housing surrounding the Tx and Rx arrays. The aluminum housing was thoroughly
coated with radar-absorbing paint. The housing was found to reduce the cross-coupling
by roughly 10 dB. Our approach also involved a metal wall between the Tx and Rx sides
that was lined with a radar-absorbing elastic silicone sheet. The elastic sheet, a
Transmit Array
IsolationLayer
Receive Array
Magnetic-loadedsheet
(silicone rubber)Brass plate
Coaxial Lines
Aluminum plate
RF absorbingpaint
Coaxial Lines
Transmit Array
IsolationLayer
Receive Array
Magnetic-loadedsheet
(silicone rubber)Brass plate
Coaxial Lines
Aluminum plate
RF absorbingpaint
Coaxial Lines
Fig. 18. Techniques applied to electromagnetically isolate the transmit antenna array from the receive array

26
commercial product from Emerson Cuming (GDS), was found to reduce the coupling
between Tx and Rx sides by roughly another 10 dB.
An important finding on the capability of the RNC radar is that its detection,
acquisition, and tracking are all automatic. In other words, the experimental detection in
Fig. 12 and the subsequent tracking shown in Fig. 13 occur without any electronic
controls or logic decisions required by the receiver. The information needed to establish
the presence of a target is provided “for free” by the spatial coherence in the backscatter
of white noise by a small target (as described by the van-Cittert Zernike theorem of
statistical optics). The RNC radar is merely “hard-wired” to process this information.
Implications for Further Research
All of the experiments on this project were conducted at very short range out to ~
2 m. From the simulation results presented in Fig. 17, the RNC radar should be capable
of operating out to a much longer range, 100 m and beyond. To detect targets out further,
the radar needs more antenna elements, higher loop gain, or both. While straightforward,
this will require further consideration of the electromagnetic isolation between the Tx and
Rx sides. As the total broadcast power level in “rest mode” increases further, it will
become necessary to physically separate the Tx and Rx sides and provide even more
sophisticated electromagnetic isolation than shown in Fig. 18. But the precise
engineering relationships are not understood yet.
Another implication is that detecting large targets or multiple targets
simultaneously will be challenging. Large targets do not provide the spatial coherence
guaranteed by small targets. This is not to say that there will be zero signal from a large
target. On the contrary, it will be backscatter far more power than a small target. But the
cross-correlations between channels in Fig. 4 may not be useful. However, the total
power, or autocorrelation, in each channel should be useful, at least in establishing the
presence and range of large targets. The fast envelope detector shown in Fig. 4 has
already been used for this purpose, and should be included in future RNC development.
Equally challenging but more tractable is the problem of multiple targets. The
RNC radars can search broadly, and detect two or more targets automatically up to the
point where one of the signals approaches the oscillation point. The oscillations would

27
be evident by much larger signatures than shown in Fig. 16. In that case, the dominant
oscillation would likely preclude any other signals from passing through the channels –
this is a well-known effect in oscillator phenomenology sometimes called “gain
hogging”. To prevent this effect and allow for multiple target detection, it is important
that the duty cycle established by the fast solid-state switches in Fig. 4 be kept low
enough to keep the electronic behavior in each channel linear. An RF limiter has already
been considered as an addition to each channel, and should be added to any future RNC
radar development.