Embed Size (px)
DESCRIPTION
Designed to give you the facts & trends overview of the most relevant market activities as they unfold in the South Bay real estate market. This report covers Manhattan Beach, Hermosa Beach, Redondo Beach, El Segundo, Torrance, Hawthorne, Gardena, Lawndale & Lomita.
Citation preview

TheSouth BayMarket Intelligence Report
Designed to give you the facts & trends overview of the most relevant market activities as they unfold in the South Bay real estate community. This report covers Manhattan Beach, Hermosa
Beach, Redondo Beach, El Segundo, Torrance, Hawthorne, Gardena, Lawndale and Lomita.
ESTATE PROPERTIES
ESTATE PRO
PERTIES
ESTATE PROPERTIES
Junly 2016
BEVERLY HILLS9454 Wilshire Blvd. Suite 600
Beverly Hills, CA 90212Phone: 310.205.0050
WEST LOS ANGELES10931 W. Pico Blvd.
Los Angeles, CA 90064Phone: 310.202.8141
SANTA MONICA620 Santa Monica Blvd. Suite B
Santa Monica, CA 90401Phone: 310.264.2225
MARINA DEL REY / VENICE124 & 155 Washington Blvd.
Marina Del Rey, CA 90292Phone: 310.577.5300
ABBOT KINNEY1413 Abbot Kinney Blvd.
Venice, CA 90291Phone: 310.396.2600
EL SEGUNDO402 Main Street
El Segundo, CA 90245Phone: 310.322.1425
MANHATTAN BEACH DOWNTOWN
1401 Highland AvenueManhattan Beach, CA 90266
Phone: 310.937.5700
MANHATTAN BEACH BLVD1040 Manhattan Beach Blvd.Manhattan Beach, CA 90266
Phone: 310.376.2225
ESTATE PROPERTIESESTATE PROPERTIES
HERMOSA BEACH2601 Pacific Coast Hwy. #101
Hermosa Beach, CA 90254Phone: 310.937.3200
REDONDO BEACH1720 S. Elena Avenue
Redondo Beach, CA 90277Phone: 310.378.7747
SOUTH BAY23740 Hawthorne Blvd.
2nd FloorTorrance, CA 90505
Phone: 310.378.9889
MALAGA COVE63 Malaga Cove PlazaPalos Verdes Estates,
CA 90274Phone: 310.378.9494
SILVER SPUR450 Silver Spur RoadRancho Palos Verdes,
CA 90275Phone: 310.544.9999
MIRALESTE5 Miraleste Plaza
Rancho Palos Verdes, CA 90275
Phone: 310.831.0222
SAN PEDRO COASTLINE1416 W 25th Street
San Pedro, CA 90732Phone: 310.831.0150
Photography courtesy ofBrian Holm, AvenueEye.com
ESTATE PROPERTIESESTATE PROPERTIES
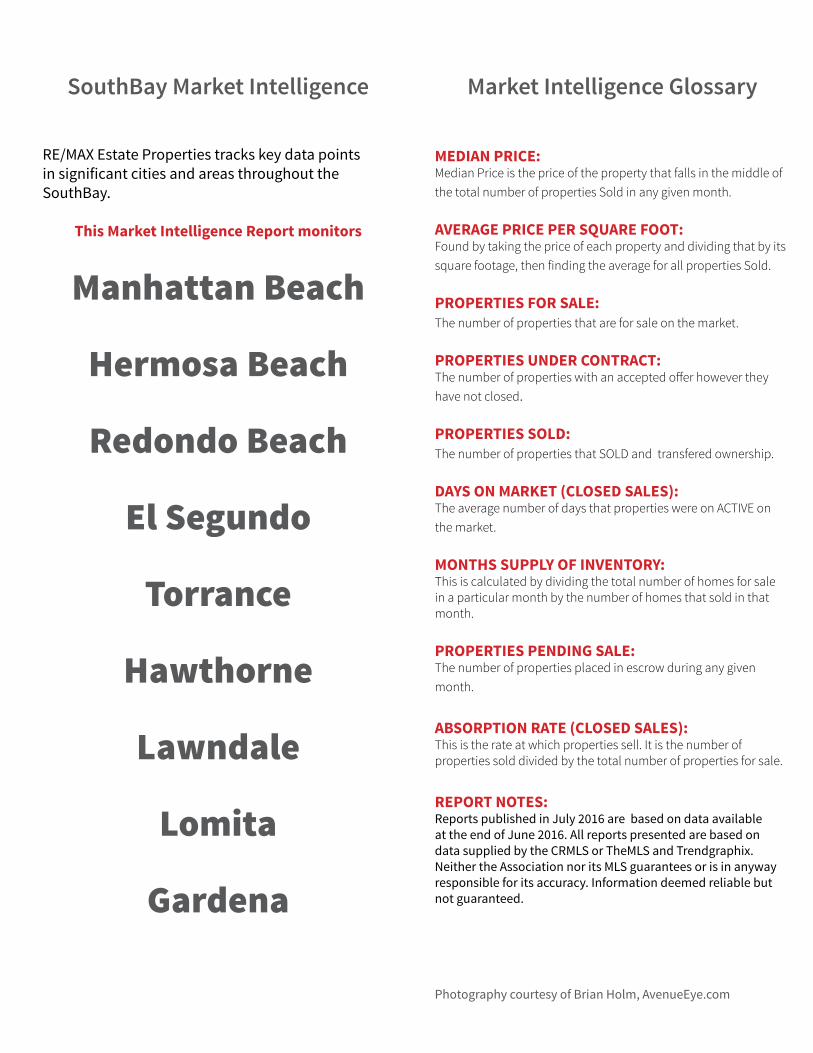
SouthBay Market Intelligence
RE/MAX Estate Properties tracks key data points in significant cities and areas throughout the SouthBay.
This Market Intelligence Report monitors
Manhattan Beach
Hermosa Beach
Redondo Beach
El Segundo
Torrance
Hawthorne
Lawndale
Lomita
Gardena
Market Intelligence Glossary
MEDIAN PRICE:Median Price is the price of the property that falls in the middle of the total number of properties Sold in any given month.
AVERAGE PRICE PER SQUARE FOOT:Found by taking the price of each property and dividing that by its square footage, then finding the average for all properties Sold.
PROPERTIES FOR SALE:The number of properties that are for sale on the market.
PROPERTIES UNDER CONTRACT:The number of properties with an accepted offer however they have not closed.
PROPERTIES SOLD:The number of properties that SOLD and transfered ownership.
DAYS ON MARKET (CLOSED SALES):The average number of days that properties were on ACTIVE on the market.
MONTHS SUPPLY OF INVENTORY:This is calculated by dividing the total number of homes for sale in a particular month by the number of homes that sold in that month.
PROPERTIES PENDING SALE:The number of properties placed in escrow during any given month.
ABSORPTION RATE (CLOSED SALES):This is the rate at which properties sell. It is the number of properties sold divided by the total number of properties for sale.
REPORT NOTES:Reports published in July 2016 are based on data available at the end of June 2016. All reports presented are based on data supplied by the CRMLS or TheMLS and Trendgraphix. Neither the Association nor its MLS guarantees or is in anyway responsible for its accuracy. Information deemed reliable but not guaranteed.
Photography courtesy of Brian Holm, AvenueEye.com
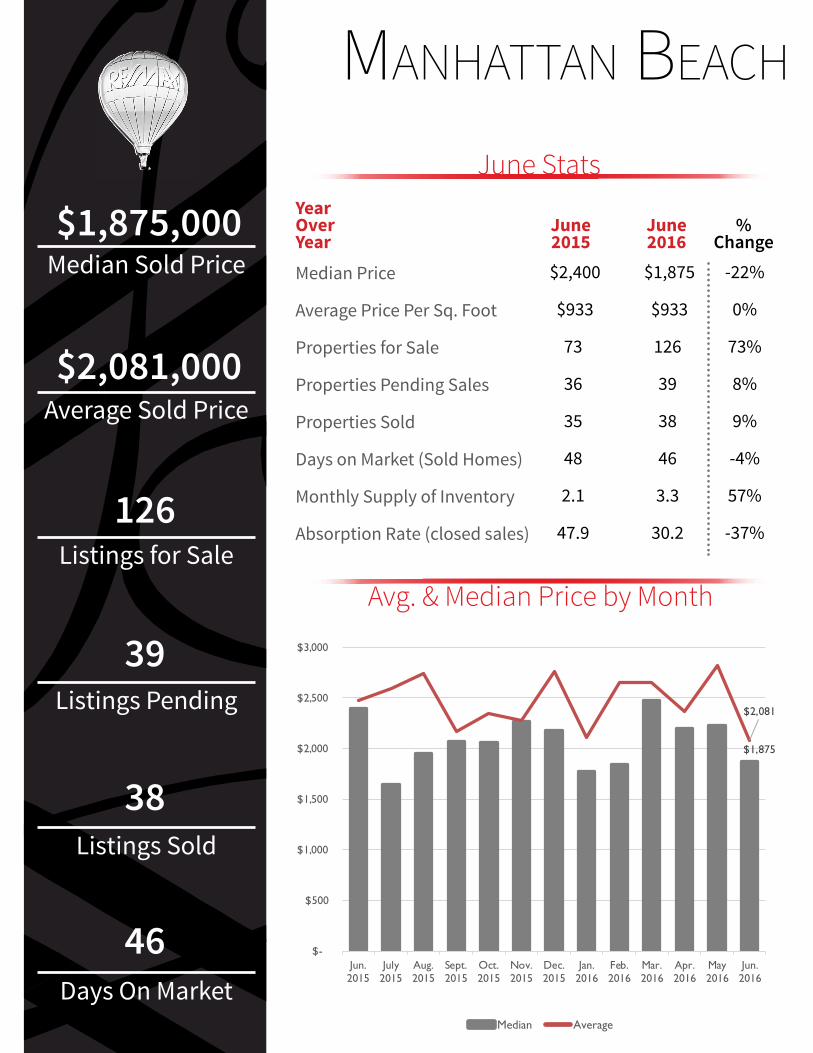
June Stats
Avg. & Median Price by Month
YearOver June June % Year 2015 2016 Change
Median Sold Price
Average Sold Price
Listings for Sale
Listings Pending
Listings Sold
Days On Market
$1,655
$2,593
$-
$500
$1,000
$1,500
$2,000
$2,500
$3,000
$3,500
Median Average
Median Price
Average Price Per Sq. Foot
Properties for Sale
Properties Pending Sales
Properties Sold
Days on Market (Sold Homes)
Monthly Supply of Inventory
Absorption Rate (closed sales)
$2,400 $1,875 -22%
$933 $933 0%
73 126 73%
36 39 8%
35 38 9%
48 46 -4%
2.1 3.3 57%
47.9 30.2 -37%
$1,875,000
$2,081,000
126
39
38
46
Manhattan Beach
$1,875
$2,081
$-
$500
$1,000
$1,500
$2,000
$2,500
$3,000
Jun.2015
July2015
Aug.2015
Sept.2015
Oct.2015
Nov.2015
Dec.2015
Jan.2016
Feb.2016
Mar.2016
Apr.2016
May2016
Jun.2016
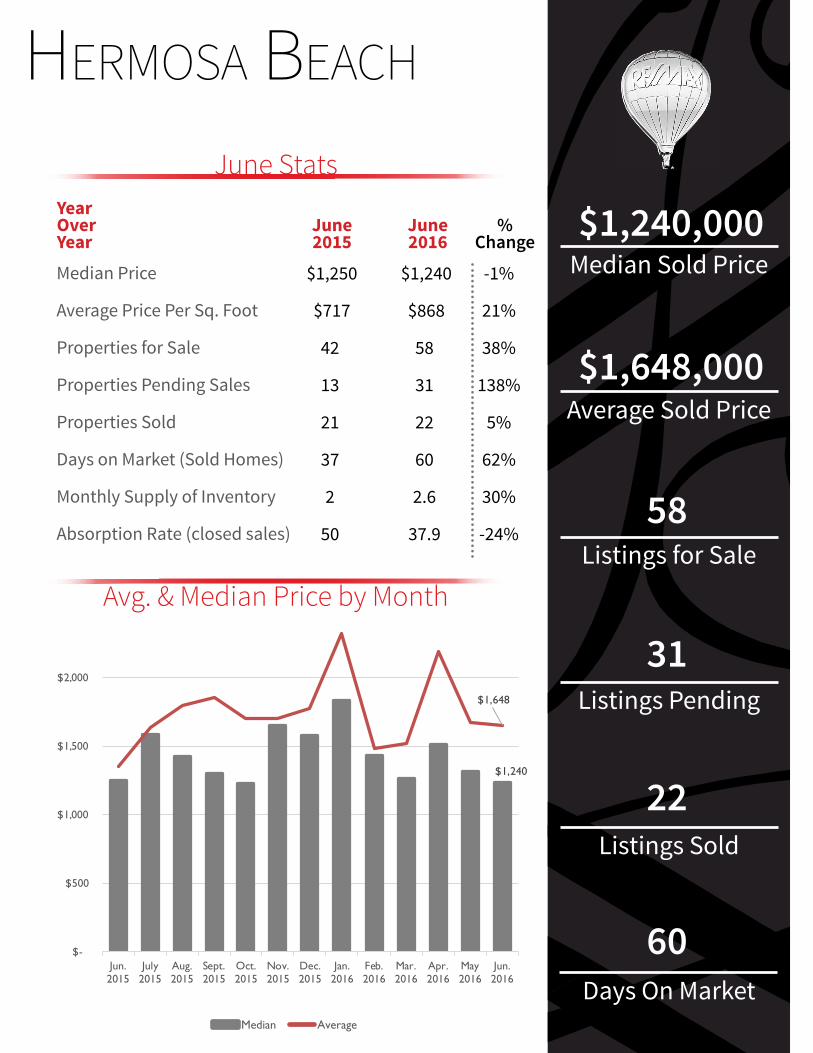
Avg. & Median Price by Month
June StatsYearOver June June % Year 2015 2016 Change
$1,655
$2,593
$-
$500
$1,000
$1,500
$2,000
$2,500
$3,000
$3,500
Median Average
Median Sold Price
Average Sold Price
Listings for Sale
Listings Pending
Listings Sold
Days On Market
Median Price
Average Price Per Sq. Foot
Properties for Sale
Properties Pending Sales
Properties Sold
Days on Market (Sold Homes)
Monthly Supply of Inventory
Absorption Rate (closed sales)
$1,250 $1,240 -1%
$717 $868 21%
42 58 38%
13 31 138%
21 22 5%
37 60 62%
2 2.6 30%
50 37.9 -24%
herMosa Beach
$1,240,000
$1,648,000
58
31
22
60
$1,240
$1,648
$-
$500
$1,000
$1,500
$2,000
$2,500
Jun.2015
July2015
Aug.2015
Sept.2015
Oct.2015
Nov.2015
Dec.2015
Jan.2016
Feb.2016
Mar.2016
Apr.2016
May2016
Jun.2016
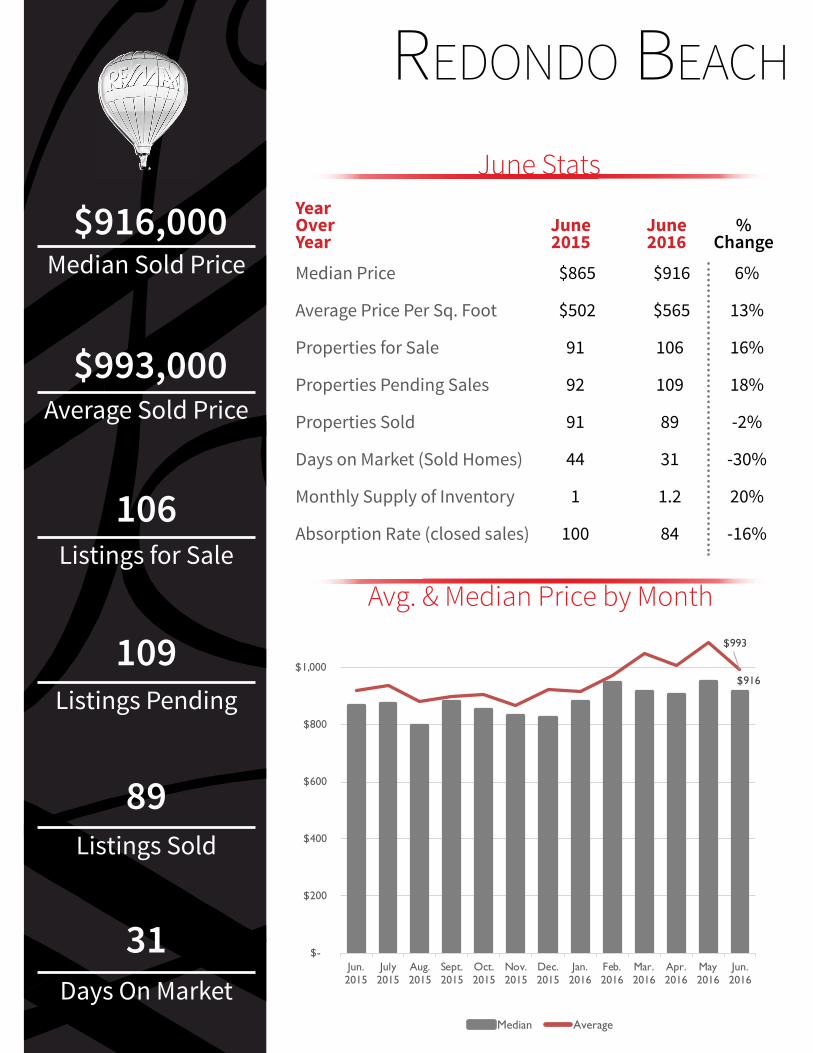
June Stats
Avg. & Median Price by Month
YearOver June June % Year 2015 2016 Change
Median Sold Price
Average Sold Price
Listings for Sale
Listings Pending
Listings Sold
Days On Market
$1,655
$2,593
$-
$500
$1,000
$1,500
$2,000
$2,500
$3,000
$3,500
Median Average
Median Price
Average Price Per Sq. Foot
Properties for Sale
Properties Pending Sales
Properties Sold
Days on Market (Sold Homes)
Monthly Supply of Inventory
Absorption Rate (closed sales)
redondo Beach
$865 $916 6%
$502 $565 13%
91 106 16%
92 109 18%
91 89 -2%
44 31 -30%
1 1.2 20%
100 84 -16%
$916,000
$993,000
106
109
89
31
$916
$993
$-
$200
$400
$600
$800
$1,000
$1,200
Jun.2015
July2015
Aug.2015
Sept.2015
Oct.2015
Nov.2015
Dec.2015
Jan.2016
Feb.2016
Mar.2016
Apr.2016
May2016
Jun.2016
Avg. & Median Price by Month
June StatsYearOver June June % Year 2015 2016 Change
$1,655
$2,593
$-
$500
$1,000
$1,500
$2,000
$2,500
$3,000
$3,500
Median Average
Median Sold Price
Average Sold Price
Listings for Sale
Listings Pending
Listings Sold
Days On Market
Median Price
Average Price Per Sq. Foot
Properties for Sale
Properties Pending Sales
Properties Sold
Days on Market (Sold Homes)
Monthly Supply of Inventory
Absorption Rate (closed sales)
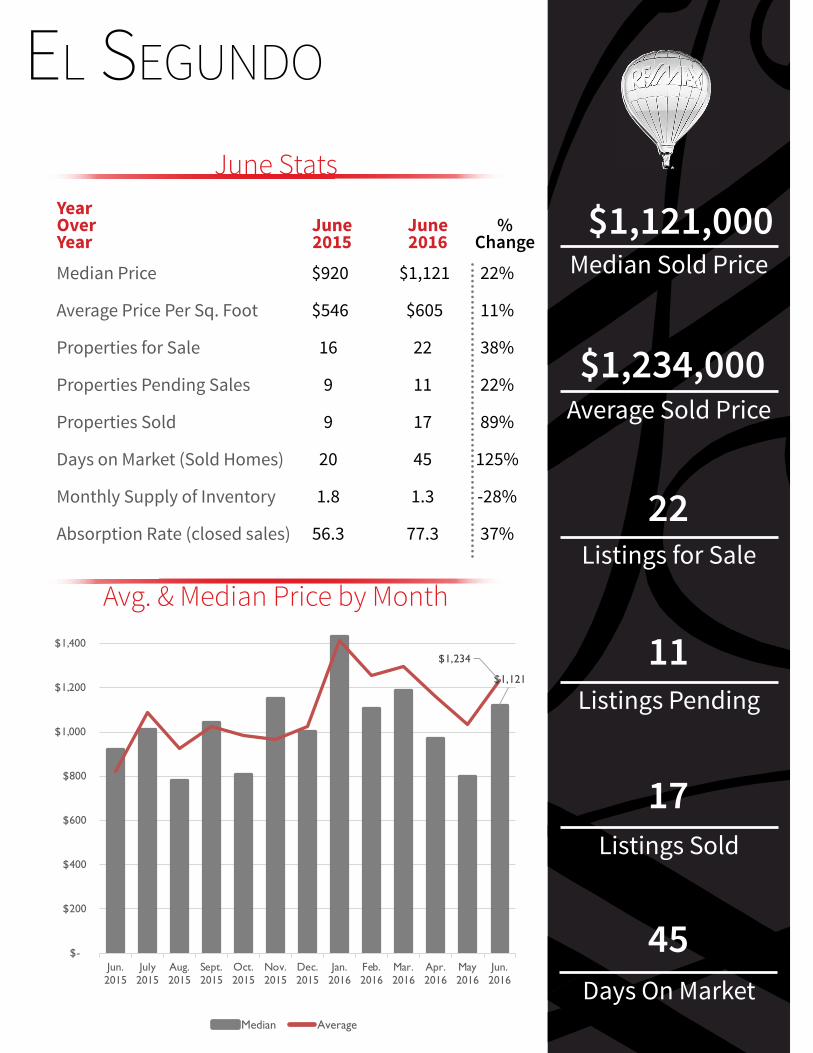
el segundo
$920 $1,121 22%
$546 $605 11%
16 22 38%
9 11 22%
9 17 89%
20 45 125%
1.8 1.3 -28%
56.3 77.3 37%
$1,121,000
$1,234,000
22
11
17
45
$1,121
$1,234
$-
$200
$400
$600
$800
$1,000
$1,200
$1,400
$1,600
Jun.2015
July2015
Aug.2015
Sept.2015
Oct.2015
Nov.2015
Dec.2015
Jan.2016
Feb.2016
Mar.2016
Apr.2016
May2016
Jun.2016
June Stats
Avg. & Median Price by Month
YearOver June June % Year 2015 2016 Change
Median Sold Price
Average Sold Price
Listings for Sale
Listings Pending
Listings Sold
Days On Market
$1,655
$2,593
$-
$500
$1,000
$1,500
$2,000
$2,500
$3,000
$3,500
Median Average
Median Price
Average Price Per Sq. Foot
Properties for Sale
Properties Pending Sales
Properties Sold
Days on Market (Sold Homes)
Monthly Supply of Inventory
Absorption Rate (closed sales)
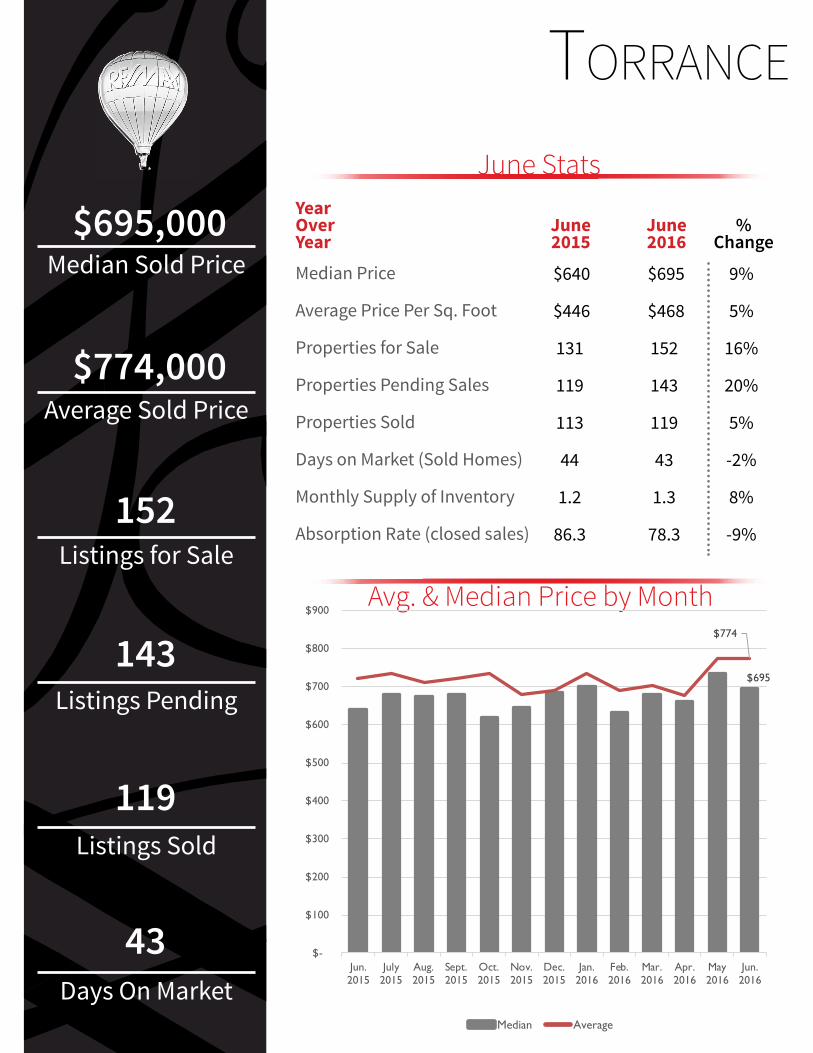
torrance
$640 $695 9%
$446 $468 5%
131 152 16%
119 143 20%
113 119 5%
44 43 -2%
1.2 1.3 8%
86.3 78.3 -9%
$695,000
$774,000
152
143
119
43
$695
$774
$-
$100
$200
$300
$400
$500
$600
$700
$800
$900
Jun.2015
July2015
Aug.2015
Sept.2015
Oct.2015
Nov.2015
Dec.2015
Jan.2016
Feb.2016
Mar.2016
Apr.2016
May2016
Jun.2016
Avg. & Median Price by Month
June StatsYearOver June June % Year 2015 2016 Change
$1,655
$2,593
$-
$500
$1,000
$1,500
$2,000
$2,500
$3,000
$3,500
Median Average
Median Sold Price
Average Sold Price
Listings for Sale
Listings Pending
Listings Sold
Days On Market
Median Price
Average Price Per Sq. Foot
Properties for Sale
Properties Pending Sales
Properties Sold
Days on Market (Sold Homes)
Monthly Supply of Inventory
Absorption Rate (closed sales)
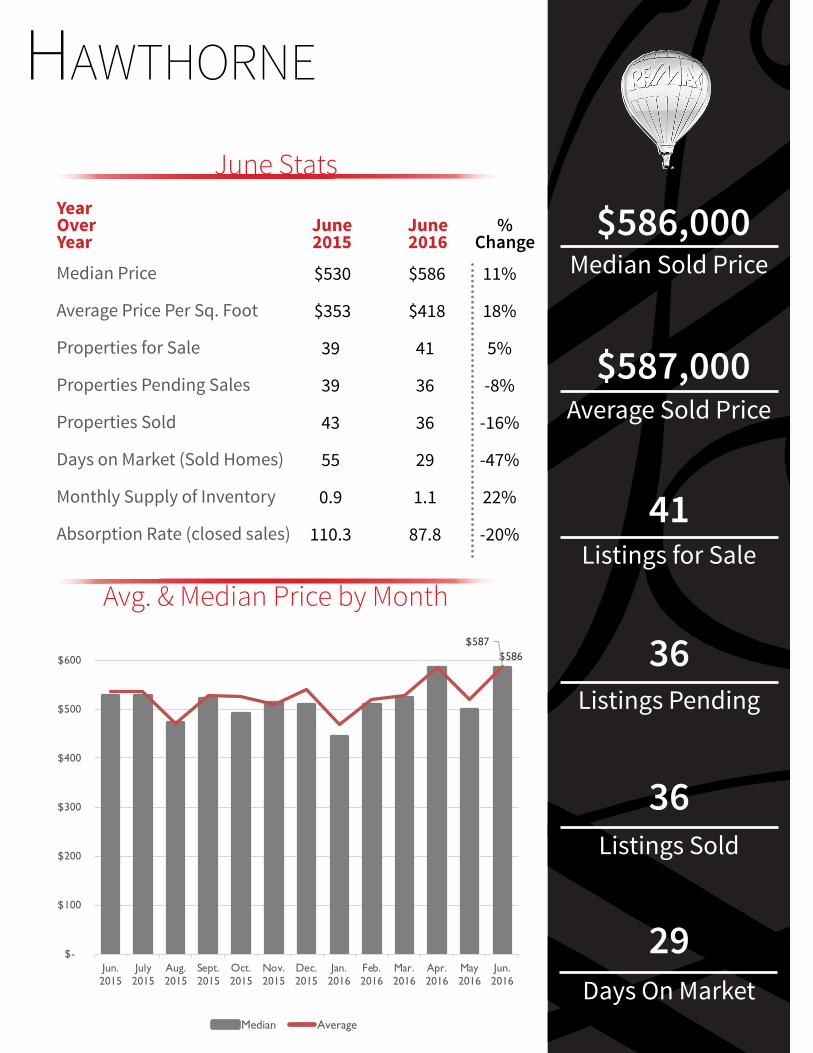
hawthorne
$530 $586 11%
$353 $418 18%
39 41 5%
39 36 -8%
43 36 -16%
55 29 -47%
0.9 1.1 22%
110.3 87.8 -20%
$586,000
$587,000
41
36
36
29
$586 $587
$-
$100
$200
$300
$400
$500
$600
$700
Jun.2015
July2015
Aug.2015
Sept.2015
Oct.2015
Nov.2015
Dec.2015
Jan.2016
Feb.2016
Mar.2016
Apr.2016
May2016
Jun.2016
June Stats
Avg. & Median Price by Month
YearOver June June % Year 2015 2016 Change
Median Sold Price
Average Sold Price
Listings for Sale
Listings Pending
Listings Sold
Days On Market
$1,655
$2,593
$-
$500
$1,000
$1,500
$2,000
$2,500
$3,000
$3,500
Median Average
Median Price
Average Price Per Sq. Foot
Properties for Sale
Properties Pending Sales
Properties Sold
Days on Market (Sold Homes)
Monthly Supply of Inventory
Absorption Rate (closed sales)
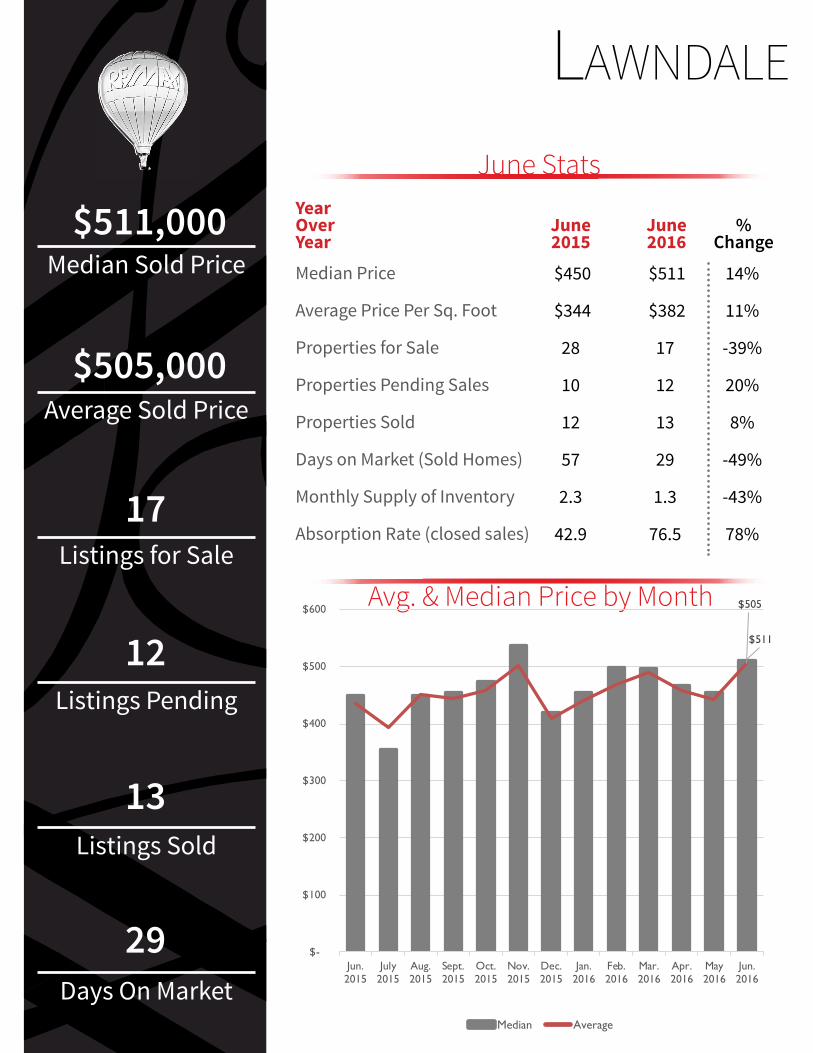
lawndale
$450 $511 14%
$344 $382 11%
28 17 -39%
10 12 20%
12 13 8%
57 29 -49%
2.3 1.3 -43%
42.9 76.5 78%
$511,000
$505,000
17
12
13
29
$511
$505
$-
$100
$200
$300
$400
$500
$600
Jun.2015
July2015
Aug.2015
Sept.2015
Oct.2015
Nov.2015
Dec.2015
Jan.2016
Feb.2016
Mar.2016
Apr.2016
May2016
Jun.2016

Avg. & Median Price by Month
June StatsYearOver June June % Year 2015 2016 Change
$1,655
$2,593
$-
$500
$1,000
$1,500
$2,000
$2,500
$3,000
$3,500
Median Average
Median Sold Price
Average Sold Price
Listings for Sale
Listings Pending
Listings Sold
Days On Market
Median Price
Average Price Per Sq. Foot
Properties for Sale
Properties Pending Sales
Properties Sold
Days on Market (Sold Homes)
Monthly Supply of Inventory
Absorption Rate (closed sales)
loMita
$551 $602 9%
$377 $350 -7%
27 24 -11%
19 22 16%
18 18 0%
45 45 0%
1.5 1.3 -13%
66.7 75 12%
$602,000
$594,000
24
22
18
45
$602 $594
$-
$100
$200
$300
$400
$500
$600
$700
Jun.2015
July2015
Aug.2015
Sept.2015
Oct.2015
Nov.2015
Dec.2015
Jan.2016
Feb.2016
Mar.2016
Apr.2016
May2016
Jun.2016
June Stats
Avg. & Median Price by Month
YearOver June June % Year 2015 2016 Change
Median Sold Price
Average Sold Price
Listings for Sale
Listings Pending
Listings Sold
Days On Market
$1,655
$2,593
$-
$500
$1,000
$1,500
$2,000
$2,500
$3,000
$3,500
Median Average
Median Price
Average Price Per Sq. Foot
Properties for Sale
Properties Pending Sales
Properties Sold
Days on Market (Sold Homes)
Monthly Supply of Inventory
Absorption Rate (closed sales)
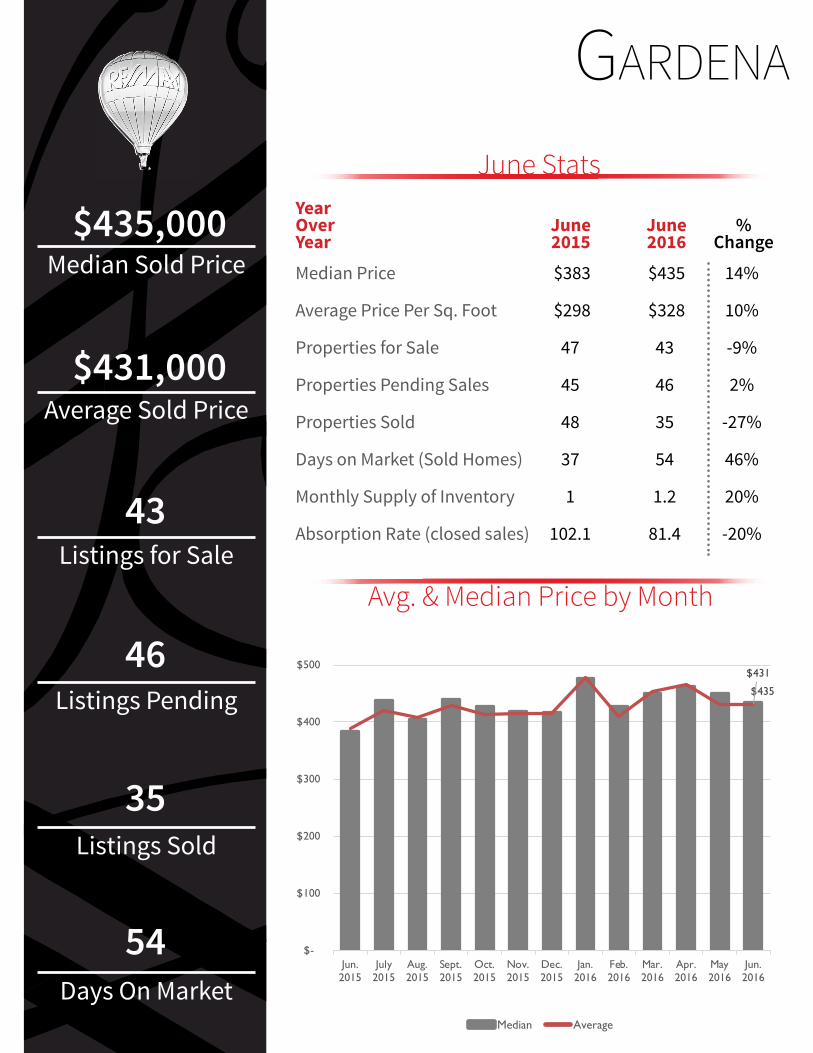
gardena
$383 $435 14%
$298 $328 10%
47 43 -9%
45 46 2%
48 35 -27%
37 54 46%
1 1.2 20%
102.1 81.4 -20%
$435,000
$431,000
43
46
35
54
$435
$431
$-
$100
$200
$300
$400
$500
$600
Jun.2015
July2015
Aug.2015
Sept.2015
Oct.2015
Nov.2015
Dec.2015
Jan.2016
Feb.2016
Mar.2016
Apr.2016
May2016
Jun.2016

CONNECT WITH US
f www.facebook.com/REMAXEstateProperties
z www.youtube.com/EPLAHomes
t@remaxepla
i www.linkedin.com/in/remaxestateproperties
c @REMAXEPLA
+ www.googleplus.com/REMAXEstateProperties
pwww.pinterest.com/remaxepla
© 2016 RE/MAX Estate Properties
ESTATE PROPERTIESESTATE PROPERTIES