Embed Size (px)
Citation preview

DECOMMISSIONING OF SOUTHBAY
PHOSPHATE ROCK/BRUSH APPLICATION INBOOMERANG LAKE
EM34 BACKGROUND MUD LAKE SURVEY
SEEPAGE CANYON DEFINITION
1995 FINAL REPORT
Submitted to:
Mr. David PorterTalisman Energy Inc.
March, 1997

Boojum Research Limited 1995 South Bay ReportFebruary 28, 1997 Talisman Energy Inc.i
TABLE OF CONTENTSTABLE OF CONTENTS
1.0 OVERVIEW AND INTRODUCTION . . . . . . . . . . . . . . . . . . . . . . . . . . . . . . . . . . . . . . . . . 1
2.0 HYDROGEOLOGICAL CONDITIONS OF THE TAILINGS SEEPAGE
PATH BETWEEN THE TAILINGS AND MUD LAKE AND THE
BEDROCK TOPOGRAPHY OF THE TAILINGS BASIN. . . . . . . . . . . . . . . . . . . . . . . . . . 7
3.0 EM INTERPRETATION OF MUD LAKE AREA and WEST OF TAILINGS. . . . . . . . . . . 18
4.0 TEMPORAL VARIATIONS IN WATER QUALITY IN SOUTH BAY . . . . . . . . . . . . . . . . 27
4.1 Summary of Piezometer Water Quality . . . . . . . . . . . . . . . . . . . . . . . . . . . . . . 27
4.2 Temporal Variations in Metal Concentrations in Surface Waters . . . . . . . . . 33
5.0 MUD LAKE: EXISTING CONDITIONS AND THE APPLICATION OF ARUM . . . . . . . . 43
5.1 Mud Lake Water Quality . . . . . . . . . . . . . . . . . . . . . . . . . . . . . . . . . . . . . . . . . 43
5.2 Receiving Water (C11) Water Quality . . . . . . . . . . . . . . . . . . . . . . . . . . . . . . . 49
5.3 Mud Lake mass balances . . . . . . . . . . . . . . . . . . . . . . . . . . . . . . . . . . . . . . . . . 51
5.4 Sedimentation in Mud Lake and Sediment Composition . . . . . . . . . . . . . . . 54
5.4.1 Sedimentation Rates . . . . . . . . . . . . . . . . . . . . . . . . . . . . . . . . . . . . . . 54
5.4.2 Settling Particles and Sediment Composition . . . . . . . . . . . . . . . . . . 56
5.5 Application of ARUM in Mud Lake . . . . . . . . . . . . . . . . . . . . . . . . . . . . . . . . . 60
5.5.1 Summary of Laboratory ARUM Treatability Experiment . . . . . . . . . . 62
5.5.2 Installation of ARUM Enclosure . . . . . . . . . . . . . . . . . . . . . . . . . . . . . . 64
5.5.3 Water Quality in the ARUM Enclosure . . . . . . . . . . . . . . . . . . . . . . . . 66
5.5.4 Pore Water Quality . . . . . . . . . . . . . . . . . . . . . . . . . . . . . . . . . . . . . . . . 70
5.5.5 Possible Modifications to ARUM Enclosure . . . . . . . . . . . . . . . . . . . . 72

Boojum Research Limited 1995 South Bay ReportFebruary 28, 1997 Talisman Energy Inc.ii
6.0 BOOMERANG LAKE: EXISTING CONDITIONS AND THE APPLICATION
OF PHOSPHATE ROCK . . . . . . . . . . . . . . . . . . . . . . . . . . . . . . . . . . . . . . . . . . . . . . . . . 73
6.1 A Brief History of the Boomerang Lake Drainage Basin . . . . . . . . . . . . . . . . 73
6.2 Water Balance for Boomerang Lake Drainage Basin . . . . . . . . . . . . . . . . . . . 74
6.3 Contaminant Sources in the Boomerang Lake Drainage Basin . . . . . . . . . . 77
6.4 Contaminant Loads To Boomerang Lake . . . . . . . . . . . . . . . . . . . . . . . . . . . . 84
6.5 Sedimentation in Boomerang Lake . . . . . . . . . . . . . . . . . . . . . . . . . . . . . . . . . 87
6.6 Boomerang Lake Particle and Sediment Composition . . . . . . . . . . . . . . . . . . 90
6.7 Biological Polishing Capacity of Boomerang Lake . . . . . . . . . . . . . . . . . . . . . 92
6.8 Phosphate Rock Additions to Boomerang Lake . . . . . . . . . . . . . . . . . . . . . . . 95
7.0 INTERPRETATION OF EM SURVEY DATA FOR MINE SITE AND SOUTH
OF TAILINGS / TOWN SITE . . . . . . . . . . . . . . . . . . . . . . . . . . . . . . . . . . . . . . . . . . . . 100
7.1 Mine Site . . . . . . . . . . . . . . . . . . . . . . . . . . . . . . . . . . . . . . . . . . . . . . . . . . . . 100
7.2 South of the Tailings/ Town Site . . . . . . . . . . . . . . . . . . . . . . . . . . . . . . . . . . 105
8.0 CONCLUSIONS AND RECOMMENDATIONS . . . . . . . . . . . . . . . . . . . . . . . . . . . . . . 107
8.1 Conclusions . . . . . . . . . . . . . . . . . . . . . . . . . . . . . . . . . . . . . . . . . . . . . . . . . . . 108
8.2 Acidic Drainage Remediation Options . . . . . . . . . . . . . . . . . . . . . . . . . . . . . 110

Boojum Research Limited 1995 South Bay ReportFebruary 28, 1997 Talisman Energy Inc.iii
LIST OF TABLESLIST OF TABLES
Table 1: Temporal variations in chemical composition of the water in
piezometers M10 and M47 . . . . . . . . . . . . . . . . . . . . . . . . . . . . . . . . . . . . . . . 31
Table 2: Mud Lake - Water Chemistry, 1986-1995 . . . . . . . . . . . . . . . . . . . . . . . . . . . 45
Table 3: Confederation Lake at C11 - Water Chemistry, 1986-1995 . . . . . . . . . . . . . 50
Table 4a: Water Balance for Mud Lake Drainage Basin, 1994-1995 . . . . . . . . . . . . . . 52
Table 4b: Mud Lake Outflow Volumes . . . . . . . . . . . . . . . . . . . . . . . . . . . . . . . . . . . . . . . 52
Table 5: Mud Lake Area Water Chemistry and Flows . . . . . . . . . . . . . . . . . . . . . . . . . 52
Table 6: Mud Lake Area Contaminant Loadings, May 12, 1995,
adjusted to balanced sodium mass . . . . . . . . . . . . . . . . . . . . . . . . . . . . . . . . . 53
Table 7: Mud Lake Sediment Trap Data for 1994 and 1995 . . . . . . . . . . . . . . . . . . . . 55
Table 8: Mud Lake 1994, 1995 Sediment Trap Solids,
1995 Sediments Elemental Composition . . . . . . . . . . . . . . . . . . . . . . . . . . . . 57
Table 9: Comparison of 1986, 1994 and 1995 Mud Lake Sediment
Composition . . . . . . . . . . . . . . . . . . . . . . . . . . . . . . . . . . . . . . . . . . . . . . . . . . . 59
Table 10: ARUM Field System Dimensions, Operating Parameters and
Overall Performance . . . . . . . . . . . . . . . . . . . . . . . . . . . . . . . . . . . . . . . . . . . . . 61
Table 11: Acidity, Sulphate and Metal Removal in Reactors . . . . . . . . . . . . . . . . . . . . . 63

Boojum Research Limited 1995 South Bay ReportFebruary 28, 1997 Talisman Energy Inc.iv
Table 12: Mud Lake Outflow (ML18), Centre (MML) and Enclosure (ML27
after May, 1995) Chemistry, 1986-1995 . . . . . . . . . . . . . . . . . . . . . . . . . . . . 67
Table 13: Enclosure pore water composition, compared to enclosure surface
water, October 21, 1995 . . . . . . . . . . . . . . . . . . . . . . . . . . . . . . . . . . . . . . . . . 71
Table 14: Water Balance for Boomerang Lake Drainage Basin, 1992-1995 . . . . . . . . 76
Table 15: East Dam Seepage, M8 and M47 Long Term Water Chemistry,
1985-1995 . . . . . . . . . . . . . . . . . . . . . . . . . . . . . . . . . . . . . . . . . . . . . . . . . . . . 78
Table 16: West Dam M47 Long Term Water Chemistry, 1987-1995 . . . . . . . . . . . . . . 78
Table 17: Tailings Diversion Ditch (TDD) Long Term Water Chemistry,
1987-1995 . . . . . . . . . . . . . . . . . . . . . . . . . . . . . . . . . . . . . . . . . . . . . . . . . . . . 79
Table 18: Backfill Raise Ditch (BR2.5) Long Term Water Chemistry,
1987-1995 . . . . . . . . . . . . . . . . . . . . . . . . . . . . . . . . . . . . . . . . . . . . . . . . . . . . 81
Table 19: Mill Pond Outflow (MPO) Long Term Water Chemistry,
1987-1995 . . . . . . . . . . . . . . . . . . . . . . . . . . . . . . . . . . . . . . . . . . . . . . . . . . . . 81
Table 20: Chemistry of Sampling Location PRS, Mine Site . . . . . . . . . . . . . . . . . . . . . . 82
Table 21: Boomerang Lake Long Term Water Chemistry, 1971-1995 . . . . . . . . . . . . . 83
Table 22a: Iron loadings to, and removal by Boomerang Lake, 1987-1995 . . . . . . . . . . 85
Table 22b: Zinc loadings to, and removal by Boomerang Lake, 1987-1995 . . . . . . . . . 85

Boojum Research Limited 1995 South Bay ReportFebruary 28, 1997 Talisman Energy Inc.v
T
able 22c: Sulphate loadings to, and removal by Boomerang Lake,
1987-1995 . . . . . . . . . . . . . . . . . . . . . . . . . . . . . . . . . . . . . . . . . . . . . . . . . . . . 85
Table 23: Boomerang Lake Sediment Trap Data for 1991 to 1995 . . . . . . . . . . . . . . . . 88
Table 24: Boomerang Lake Sedimentation Solids Elemental Composition,
1994 - 1995 . . . . . . . . . . . . . . . . . . . . . . . . . . . . . . . . . . . . . . . . . . . . . . . . . . . 91
Table 25: Boomerang Lake 1995 periphyton population biomass, elemental
composition and contaminant removal capacity . . . . . . . . . . . . . . . . . . . . . . 92
Table 26: Boomerang Lake Phytoplankton Phyla Cell Density and Biomass,
1995 . . . . . . . . . . . . . . . . . . . . . . . . . . . . . . . . . . . . . . . . . . . . . . . . . . . . . . . . . . 94
Table 27: Contaminant concentrations in Boomerang Lake in 1994 and in
the first and second halves of 1995 . . . . . . . . . . . . . . . . . . . . . . . . . . . . . . . . 99
Table 28: South Bay 1995 Activities List . . . . . . . . . . . . . . . . . . . . . . . . . . . . . . . . . . . . 107

Boojum Research Limited 1995 South Bay ReportFebruary 28, 1997 Talisman Energy Inc.vi
LIST OF FIGURESLIST OF FIGURES
Figure 1a: Mine Site, Backfill Raise, MPRO, Confederation Lake,
Piezometer Sampling Frequency, 1986-1995 . . . . . . . . . . . . . . . . . . . . . . . . 29
Figure 1b: Decant Pond, Gravel Pit, Town Site, Mud Lake
Piezometer Sampling Frequency, 1986-1995 . . . . . . . . . . . . . . . . . . . . . . . . 29
Figure 1c: Tailings Area included Boomerang Lake Dams
Piezometer Sampling Frequency, 1986-1995 . . . . . . . . . . . . . . . . . . . . . . . . 30
Figure 2: Warehouse Seep (WHS), Metal concentration versus time . . . . . . . . . . . . . 37
Figure 3: Backfill Raise Cap (BRC), Metal concentration versus time . . . . . . . . . . . . . 37
Figure 4: Backfill Raise, BR4-BR2.5-BB, Metal concentration versus time . . . . . . . . . 38
Figure 5: Mill Pond Outflow, Metal concentration versus time . . . . . . . . . . . . . . . . . . 38
Figure 6: Boomerang Lake, B1, Metal concentration versus time . . . . . . . . . . . . . . . . 39
Figure 7: Confederation Lake, C1, Metal concentration versus time . . . . . . . . . . . . . . 39
Figure 8: Backfill Raise, BR13,13B&13C, Metal concentration versus time . . . . . . . . 40
Figure 9: Portal Raise Cap (PRC), Metal concentration versus time . . . . . . . . . . . . . . . 40
Figure 10: Portal Raise Seep (PRS), Metal concentration versus time . . . . . . . . . . . . . . 41

Boojum Research Limited 1995 South Bay ReportFebruary 28, 1997 Talisman Energy Inc.vii
Figure 11: Confederation Lake Shore, CS13, Metal concentration versus time . . . . . . . 41
Figure 12: Decant Pond Outflow (DPO), Metal concentration versus time . . . . . . . . . . 42
Figure 13: Mud Lake Outflow (ML18), Metal concentration versus time . . . . . . . . . . . 42
Figure 14a: Middle Mud Lake (MML), Long Term [Zn] and pH . . . . . . . . . . . . . . . . . . . . 48
Figure 14b: Mud Lake Outflow (ML18), Long Term [Zn] and pH . . . . . . . . . . . . . . . . . . . 48
Figure 15: Mud Lake Seasonal Sedimentation Rates . . . . . . . . . . . . . . . . . . . . . . . . . . . 56
Figure 16: Mud Lake, Middle (MML), Outflow (ML18), Enclosure (ML27)
Zinc concentration versus time . . . . . . . . . . . . . . . . . . . . . . . . . . . . . . . . . . . . 69
Figure 17: Mud Lake ARUM Enclosure, Measured [Zn] versus Expected [Zn] . . . . . . . 69
Figure 18: Boomerang Lake, Historical Annual Average pH, [Zn], [Acidity] . . . . . . . . . 73
Figure 19: Boomerang Lake Sedimentation Rates according to Sedimentation
Trap Data . . . . . . . . . . . . . . . . . . . . . . . . . . . . . . . . . . . . . . . . . . . . . . . . . . . . . . 90

Boojum Research Limited 1995 South Bay ReportFebruary 28, 1997 Talisman Energy Inc.viii
LIST OF MAPSLIST OF MAPS
Map 1: Stratigraphic Cross-Section and Piezometer Location . . . . . . . . . . . . . . . . . . . 9
Map 2: Hydrological Balances of Tailings Basin, 1987-1995 . . . . . . . . . . . . . . . . . . 17
Map 3a: EM34 Electromagnetic Survey, Mud Lake Area and Mine Site
Quad-Phase Component, Coil Separation 10m, March 1995 . . . . . . . . . . . . 19
Map 3b: EM34 Electromagnetic Survey, Mud Lake Area and Mine Site
Quad-Phase Component, Coil Separation 20m, March 1995 . . . . . . . . . . . . 20
Map 3c: EM34 Electromagnetic Survey, Mud Lake Area and Mine Site
Quad-Phase Component, Coil Separation 40m, March 1995 . . . . . . . . . . . . 21
Map 3d: EM34 Electromagnetic Survey, Mud Lake Area and Mine Site
Quad-Phase Component, Reduced Overburden Response,
Coil Separation 20 & 10m, March 1995 . . . . . . . . . . . . . . . . . . . . . . . . . . . . . 22
Map 3e: EM34 Electromagnetic Survey, Mud Lake Area and Mine Site
Quad-Phase Component, Reduced Overburden Response,
Coil Separation 40 & 20m, March 1995 . . . . . . . . . . . . . . . . . . . . . . . . . . . . . 23
Map 4: Sampling of South Bay Tailings Area Piezometers, 1986-1995 . . . . . . . . . . 28
Map 5: Mill Site Surface Water Sampling Locations . . . . . . . . . . . . . . . . . . . . . . . . . 34
Map 6: Mud Lake Drainage Basin, Surface Water Sampling Locations . . . . . . . . . . 44
Map 7: Distribution of Phosphate Rock in Boomerang Lake, 1992-1995 . . . . . . . . . 96

Boojum Research Limited 1995 South Bay ReportFebruary 28, 1997 Talisman Energy Inc.ix
Map 8a: EM34 Electromagnetic Survey, Mine Site, Quad-Phase Component,
Coil Separation 10m, Difference between 1995 and 1992
Surveys . . . . . . . . . . . . . . . . . . . . . . . . . . . . . . . . . . . . . . . . . . . . . . . . . . . . . . 101
Map 8b: EM34 Electromagnetic Survey, Mine Site, Quad-Phase Component,
Coil Separation 20m, Difference between 1995 and 1992
Surveys . . . . . . . . . . . . . . . . . . . . . . . . . . . . . . . . . . . . . . . . . . . . . . . . . . . . . . 102

Boojum Research Limited 1995 South Bay ReportFebruary 28, 1997 Talisman Energy Inc.x
LIST OF SCHEMATICSLIST OF SCHEMATICS
Schematic 1: South Bay Piezometer Stratigraphic and Hydrological Section
A-A’ Cross-Section (South-North) . . . . . . . . . . . . . . . . . . . . . . . . . . . . 11
Schematic 2: South Bay Piezometer Stratigraphic and Hydrological Section
B-B’ Cross-Section (West-East) . . . . . . . . . . . . . . . . . . . . . . . . . . . . . . 12
Schematic 3: Pore Water Peeper Design . . . . . . . . . . . . . . . . . . . . . . . . . . . . . . . . . . . . . . . . 70
LIST OF PLATESLIST OF PLATES
Plate 1: Curtain of Enclosure in Mud Lake being lifted by high winds . . . . . . . . . . . 65
Plate 2: Initial construction of cattail rafts for Mud Lake Enclosure . . . . . . . . . . . . . . 65
Plate 3: Planted rafts installed in the Mud Lake Enclosure . . . . . . . . . . . . . . . . . . . . . 66
Plate 4: An example of the size of brush distributed in Boomerang Lake . . . . . . . . . 93
Plate 5: Algal growth in 1995 in Boomerang Lake . . . . . . . . . . . . . . . . . . . . . . . . . . . 93
Plate 6: Barge used for phosphate rock distribution in Boomerang Lake . . . . . . . . . 97
Plate 7: Barge used for phosphate rock distribution in Boomerang Lake . . . . . . . . . 97

Boojum Research Limited 1995 South Bay ReportFebruary 28, 1997 Talisman Energy Inc.1
1.01.0 OVERVIEW AND INTRODUCTIONOVERVIEW AND INTRODUCTION
In 1994, the decommissioning activities for the South Bay mine site focused on two main
areas. For the overall site the measures taken in 1993 were evaluated (trial phosphate rock
application to tailings and Boomerang Lake sediment and ARUM beach installation on Decant
Pond). The biological polishing process used in Boomerang Lake was summarized, focussing
on contaminant fate. The mine/mill site was surveyed using EM to determine changes brought
about by the diversion of the seepage from the Backfill Raise area to Boomerang Lake. A report
was issued in December 1994 which concluded that the measures for Decant Pond had been
successfully curtailing the deterioration of the water quality. The seepage from the mine/mill
site have been diverted away from Confederation Lake. However, the contaminant load to
Boomerang lake has increased. It was recommended that application of phosphate rock to the
lake sediments is required to curtail acidification due to iron oxidation. Due to logistics
problems encountered in 1993, the phosphate rock application to Boomerang lake was carried
out in 1994. Eighty tonnes of phosphate rock were made into a slurry and applied via barge
to the lake sediment in 1994.
The tailings have given rise to a deterioration of the water quality in Mud Lake, which was
predicted based on the reevaluation of the hydrological conditions in the tailings basin in
1993. Insufficient quantities of water were reporting to the ground water diversion ditch at the
southern end of the tailings deposits. In early 1994, the deterioration of Mud lake was
documented. Subsequently, activities in 1995 centred around the hydrology of the tailings
and drainage basin.
The hydrology of the tailings basin was originally defined in 1987, excluding the area around
Mud Lake. During 1994, the sampling efforts in and around Mud Lake were intensive in order
to define the origin and the pathways of the contaminants moving towards Mud Lake. A report
was issued summarizing the historic and current status of the area. Based on a preliminary
hydrological investigation focusing on the area between the tailings and Mud Lake, a deep
bedrock valley was described, which appeared to define the seepage path underneath Mud

Boojum Research Limited 1995 South Bay ReportFebruary 28, 1997 Talisman Energy Inc.2
Lake, leading to the discharge of the seepage at the north end of Mud Lake. Many hydrological
questions were raised by the investigations of 1994, the first year when Mud Lake was
contaminated. Thus, to answer key questions, extensive EM surveys were carried out in 1995
to define the contaminant pathway and bedrock conditions.
This information was considered essential to any remedial action plan. After completion of the
1994 investigation, it was possible to estimate, utilizing elemental concentrations of surface
water in the drainage basin along with flows and precipitation data, a contaminated ground
water discharge volume of 0.6 to 1.0 L/s. This volume of contaminated seepage was
considered significant, leading to potential contamination of lakes further north. The 1995
work therefore concentrated on defining possible pathways of contaminants to lakes further
north of Mud Lake. The hydrological balance (precipitation/ infiltration/ evaporation) produced
an expected surface water flow volume for the drainage basin containing the tailings and Mud
lake. These estimates agreed very well with the measured flow volumes leaving Mud Lake,
the ground water seepage discharge and flows leaving Decant Pond. These results suggested
that it might be possible to contain the contaminants in Mud Lake, if the drainage basin
provides a solid containment structure.
Extensive coverage of the site by EM measurements in the areas surrounding Mud Lake was
implemented in early 1995, followed by a hydrogeological investigation where piezometers
were installed to define the seepage characteristics. The bedrock topography of the tailings
needed to be refined, as containment of the contaminants within the drainage basin could also
be assisted through identification of the location where the ground water seepage was leaving
the tailings deposit. If such a location could be defined, many alternatives would arise in
selecting options to contain contaminants.
Therefore, the activities in 1995 focused heavily on collecting hydrological information
addressing the spatial distribution of the seepage path and locating the origin of the seepage
from within the tailings basin. A summary of the key findings of the hydrology and bedrock

Boojum Research Limited 1995 South Bay ReportFebruary 28, 1997 Talisman Energy Inc.3
definitions is given in Section 2.
Although water balance calculations for the Mud Lake/tailings drainage basin agreed with the
relatively sporadic flow measurements and the mass balance using conservative elements of
in the surface water, the aerial extent of a plume which would be moving below ground out
of the drainage basin was not known. In Section 3, electromagnetic survey data are presented
which are used to define the extent of the plume in the Mud Lake drainage basin. The EM
survey can also be used as a monitoring tool to determine movement of the plume through
repeat surveys in subsequent years.
From the hydrological understanding, based on the data collected in 1987, it was expected
that surface and ground water would leave the tailings basin via Decant Pond outflow and
passing through the muskeg between the tailings and Mud Lake. Zinc removal was effective
to date with extensive algal growth. Surface water leaving Decant Pond could only improve
further upon passage through the muskeg. Contaminants leaving the tailings basin via the
ground water was evaluated in 1987 and 1988. Piezometer water quality was used, together
with modelling of natural contaminant attenuation, to determine potential problem areas of
Confederation lake. The assessment indicated that sufficient attenuation will take place and
contaminants would not reach Confederation Lake. At the time this assessment of a reasonable
evaluation had to be reconsidered, given the findings in 1994.
The 1994 hydrological investigation found the depth of the seepage path at 16 m, discharging
directly into the north end of Mud Lake with a water quality which suggested no natural
attenuation of contaminants. A reassessment of the status of the ground water chemistry,
collected sporadically since 1987, was carried out along with an evaluation of seasonal
changes in the surface waters, monitored on a more regular basis. The objective of these
evaluations, presented in Section 4, was to determine if the ground water and surface water
conditions of the entire drainage basin had undergone significant changes which warranted
attention.

Boojum Research Limited 1995 South Bay ReportFebruary 28, 1997 Talisman Energy Inc.4
Passive treatment of acid mine drainage utilizes sediment microbial activity. These approaches
have been developed over the past decade and have proven effective on an experimental and
field trial basis. A review of microbial-driven treatment processes by Kalin et al. 1995a test
work on Mud Lake sediments carried out in 1995, suggested that this process would be
applicable to the remediation of Mud Lake (Appendix 3). The scale up of this process, at this
stage only developed on an experimental basis, requires a stepwise approach. The
development of floating cattail rafts, representing one task, and quantities of carbon additions,
to activate the sediment, had to be determined. The physical and chemical conditions of Mud
Lake were described in 1994. A location was selected for an enclosure which could contain
potato waste and the floating cattail rafts, the corner stones of the process. These activities are
described in Section 5. Based on results of the organic matter requirements determined from
the test work with the sediments, an enclosure around the ground water seepage discharge
was designed and constructed. The first application of organic matter to the sediments was
carried out. The first set of floating vegetation cover was installed, which is needed to promote
the development of reducing conditions in the enclosure.
Boomerang Lake receives seepage from the mine site via Backfill Raise and the Mill site as well
as diffuse seepage through the tailings dams. Since 1992, deterioration of the lake water
quality was evident. Experimentation with different phosphate rock types in the laboratory
and the field has been carried out in 1992 and 1993 to curtail the deterioration.
With the reduction in iron cycling, the co-precipitation of zinc by iron will be reduced. The
Biological Polishing capacity, i.e., zinc removal due to algal adsorption, was quantified
previously for Boomerang Lake. Cut brush was added to the lake to provide surfaces for algal
growth. Further brush was added to the lake in 1995. In Section 6, the work on Boomerang
Lake is summarized, providing the background to the application of 80 tonnes of phosphate
rock to the lake.
Phosphate additions to the sediment are counteracting. The acidification has been taking

Boojum Research Limited 1995 South Bay ReportFebruary 28, 1997 Talisman Energy Inc.5
place due to the iron cycling and the oxidation of iron in seepage entering the lake. The
oxidation of ferrous iron, released from the sediments by microbial activity, generates hydrogen
ions when iron (II) hydrolyses.
A literature review was carried out in 1994 under joint contract with CANMET, examining iron
cycling in sediments. Although iron (III) hydroxides have large specific surface areas and
therefore assist in metal removal from the water column, iron cycling also contributes to
increased hydrogen ion concentrations and decreases in pH. Phosphate additions to the
sediment are expected to form iron (III) phosphates and reduce the mass of available iron or
the oxidation-reduction cycle between sediment and water.
In 1995, the logistics involved in applying the appropriate fine rock formulation were
addressed and 80 tonnes of rock were applied. Test work leading to the application procedure
was carried out examining means by which the rock could be applied in such a manner that
a fine layer is deposited over the sediment after slowly settling through the water column.
Monitoring data were collected after the application, along with quantification of primary
productivity in the form of phytoplankton.
The surface and ground water diversions to reduce seepage from the underground workings
on the mill and mine site to Confederation Lake were re-evaluated in 1995. Seepage appeared
in 1993 from the old mine portal and the Backfill Raise area, as well as the warehouse area.
An electromagnetic survey identified the depth of the seepage in 1992 at about 4 to 6 metres,
entering Confederation Lake through the sediment.
A diversion ditch was constructed, directing the flow of Backfill Raise drainage area away from
Confederation Lake and towards Boomerang Lake. The ground water table in the mine/mill
site was lowered appreciably and small seepage flows remained. Further curtailment of
seepage flow was achieved by additional ditching below the Portal Raise in order to divert
fresh water draining from Antenna Hill away from waste rock on the mine site beach. The
electromagnetic survey was repeated to compare the conditions to those prior to the diversion

Boojum Research Limited 1995 South Bay ReportFebruary 28, 1997 Talisman Energy Inc.6
of the seepage. These findings are presented in Section 7 of this report.
In Section 8, the last section of the report, conclusions are drawn based on the findings and
options for evaluation of remedial actions are identified.

Boojum Research Limited 1995 South Bay ReportFebruary 28, 1997 Talisman Energy Inc.7
2.02.0 HYDROGEOLOGICALHYDROGEOLOGICAL CONDITIONSCONDITIONS OFOF THETHE TAILINGSTAILINGS
SEEPAGE PATH BETWEEN THE TAILINGS AND MUD LAKESEEPAGE PATH BETWEEN THE TAILINGS AND MUD LAKE
ANDAND THETHE BEDROCKBEDROCK TOTOPOGRAPHY OF THE TAILINGSPOGRAPHY OF THE TAILINGS
BASIN.BASIN.
In 1991 Albert Vonhof Consulting Ltd of Calgary, Alberta was retained to address precipitation
processes taking place in the South Bay tailings deposit. These studies and his involvement
in other Ecological Engineering projects at Boojum Research familiarized him with the South
Bay site. He was retained to carry out the preliminary investigations in late 1994 and,
subsequently, the test drilling program and piezometer installations for the seepage in 1995.
A brief summary of the key findings is presented below.
Paddock Drilling Ltd. from Brandon, Manitoba was engaged to conduct the test drilling and
piezometer installation program at South Bay, Ontario. A Mobil S61 track-mounted drilling rig
was used to ensure maximum mobility. Similarly, the accompanying water truck was also
track-mounted. This equipment is highly versatile because auguring, (solid and hollow stem)
mud rotary drilling and diamond coring can be performed with the same rig. Despite the
utilization of mobile and versatile equipment, the weather conditions did not allow access to
the northern part of Mud Lake. Hence no data could be obtained from the northern part of Mud
Lake and the investigation focused on accessible areas.
BedrockBedrock topography:topography: Bedrock conditions covering the tailings basin and the seepage
path to Mud Lake were determined. The bedrock topography is, as expected, quite irregular
which is typical for the Canadian Shield. The surface was modified by glacial erosion and very
rapid lateral changes in the elevation can and do occur. This is illustrated by the outcrops in
the area of the deep valley carrying the seepage from the tailings between elevation 395 m
and 400 m, compared to the surface elevation of 415 m. The present situation represents the
best approximation based on the available information.
The bedrock topography is characterized by a southward trend bedrock valley. This bedrock

Boojum Research Limited 1995 South Bay ReportFebruary 28, 1997 Talisman Energy Inc.8
valley skirts the western side of Mud Lake and runs under the gravel pit towards the
northwestern corner of the tailings basin. In this area, it appears to split into two arms. One
arm follows the western tailings basin towards the south, exits the tailings basin in its
southwest corner and appears to run under the eastern part of the old town site towards
Confederation Lake. The other arm of the valley appears to run toward Confederation Lake
under the western part of the town site. The north-south trending buried valley, in all
likelihood, follows a major fault zone. it was also determined that the arm of the bedrock valley
under the tailing basin is joined by another tributary originating in the northeastern part of the
tailings basin underneath Decant Pond.
The portion of the buried valley which is clearly defined is located under the gravel pit. It is
bounded on the west side by a bedrock outcrop and on the east side by a bedrock high. Three
locations (M79, M80, M81), more or less equally spaced, were drilled across this valley (Map
1). It appears that the valley has relatively steep walls and a flat bottom (the “Kalin Canyon”).
Hole M81 appears to be close to the western edge of the valley as is suggested by the
presence of a considerable boulder lag just above the bedrock surface. Both the northern extent
of the buried valley under Mud Lake and the southern extent of the two arms under the town
site are not well defined.
South of the northern edge of the tailings basin the buried valleys split into two arms and
becomes diffuse south of the southern edge of the tailings basin.
The bedrock topography indicates that the tailings impoundment is situated on a topographic
bedrock low which, in the shallow subsurface, is connected to the surrounding area by a
number of buried valleys. These buried valleys, south and west of the tailings basin, in all
likelihood, are directly connected to Confederation Lake. The main seepage path, however,
appears to be through the "Kalin Canyon" as all the water in the drainage basin is reporting to
Mud Lake and leaves through its outflow.


Boojum Research Limited 1995 South Bay ReportFebruary 28, 1997 Talisman Energy Inc.10
The stratigraphy of the boreholes is used to derive the south-north cross section (Schematic 1)
and west-east cross section (Schematic 2). General observations on the stratigraphy are as
follows, almost all boreholes show that the coarsest sediments (boulders, gravel, granules)
overlie the bedrock surface which then grade into subsequent finer sediments in ascending
order. In many boreholes the finest sediment is clay or silt. Furthermore, the overall grain size
of the sedimentary section decreases from north to south, and becomes more interbedded and
variable towards the south.
Stratigraphic information with respect to the underlying material at the interface of the tailings
was examined. The majority of the stratigraphic section indicates that most tailings are
underlain by a sandy material.
The hydraulic head distribution in the drainage basin, derived from the water level
measurements, leads to the conclusion that the tailings seepage (in Kalin Canyon) originates
from the areas around the northwestern corner of the tailings impoundment where sand is in
direct contact with the tailings. Thus, essentially the tailings seepage spills from the tailings
pond over into Kalin Canyon at the northwestern portion of the tailings impoundment. At this
point no information is available on the bedrock below Decant Pond.
Stratigraphy and water level information from the 1987 hydrogeological work was to be
interpreted with the new piezometer locations to obtain a complete new hydrogeological
evaluation. A survey was carried out after completion of the drilling program in June 1995
with Total Survey Equipment. A detailed map for the site was derived in 1987 through aerial
photographs, where the piezometers drilled in 1987 were marked on the ground. Contours of
this site were based on this aerial map and elevations of the piezometers were determined
manually with a theodolite. Unfortunately, the total survey results produced in 1995 and those
produced in 1987 did not agree, both in locations and in elevations at some locations. Rather
large differences were reported for some locations. This severely hinders the development of
hydraulic head calculations, which determine the direction of water flow.


Boojum Research Limited 1995 South Bay ReportFebruary 28, 1997 Talisman Energy Inc.13
In order to address the differences and resolve all potential errors, a GPS Total Station survey
system was used in 1995. It was found that distortions were introduced through the
interpretation of the airborne information, in addition to errors which were made in the Total
Survey of the year 1995. With the results of the GPS Total Station survey system, obtained in
October 1995, two errors were noted, one due to distortion in the original Airquest Map and
the second due to errors made in the 1995 survey. This information will be assessed in 1996
to determine the consequences of the errors for the hydrology. Unfortunately due to a severe
winter storm it was not possible to complete the GPS survey for the site.
The new piezometers installed in 1995 are located in their approximate position, using the
1987 topographic map as a basis and site knowledge of where the holes were drilled, until the
mapping problem is resolved.
The elevations obtained from the 1995 survey were used to calculate the elevation of various
geological contacts. It is realized that a potential error may be introduced by using the 1995
survey data but it is felt that such an error is not significant considering the degree of
variability of this geological environment.
Accurate elevation measurements are much more critical when water levels between
piezometers are compared, especially in this area where the sediments have very high
permeability. The data discussed in this report utilizes the information without resolution of
the errors associated with the differences in elevation, as an interpretation was needed for the
progress of the project.
GroundGround waterwater flow:flow: Precipitation falling on the tailings basin, once infiltrated, will
flow vertically downward through the tailings. Upon reaching the underlying aquifer it moves
laterally and predominantly towards Mud Lake. The actual path taken by the ground water
in the tailings will depend on the permeability distribution within the tailings. Both the
presence of compacted muskeg and clay layers under the tailings will affect the ground water
flow path.

Boojum Research Limited 1995 South Bay ReportFebruary 28, 1997 Talisman Energy Inc.14
The hydraulic head distribution is based on water levels measured in piezometers completed
immediately above the bedrock surface on July 29, 1995. It is assumed that the contrast in
hydraulic conductivity between the bedrock and the overlying permeable sand and gravel
deposits is sufficiently large that, for all practical purposes, the bedrock surface can be
considered impermeable. Ground water will, therefore, flow laterally along this surface. The
tailings basin is partially surrounded by ground water recharge areas. These areas correspond
to topographic highs which are predominantly bedrock hills. Pine trees grow characteristically
in those areas. Fresh ground water flows from this recharge area towards the tailings basin
and is, in places, conveyed for a considerable distance under the tailings basin.
Piezometer M26B, located more or less in the middle of the tailings basin, was completed near
the bedrock surface contact in a NE-SW trending tributary of the main buried valley. The
chemical analysis shows that the water from this piezometer is uncontaminated. Clean ground
water is also present in the arm of the main buried valley west of the tailings basin near M28.
This uncontaminated water flows northerly in the direction of M83 (Map 1).
All piezometers near the edge of the northeastern part of the tailings basin (M1, M61, M68)
show uncontaminated water, although a steep hydraulic gradient from the tailings basin
towards M61 appears to be present. The north-south trending buried valley on the western
edge of the tailings is the main ground water discharge path for the tailings basin.
Contaminated ground water in the tailings basin flows along the buried valley towards Mud
Lake and discharges into Mud Lake. The water levels in all piezometers completed in the
immediate vicinity of Mud Lake (M58, M59, M60A & B, M62 and M63) are above the water
level of Mud Lake.
It is known that active discharge (springs) of contaminated ground water occur in the northern
part of Mud Lake near M62 and M63. No piezometers have, as yet, been installed in the
deeper part of the aquifer in this area. The configuration of the buried valley and its extent in
this area are unknown at the present time. However, the evidence of ground water discharge
in this area indicates that there is a major change in stratigraphy along the path of the buried
valley, due to the ground water that is upwelling in Mud Lake.

Boojum Research Limited 1995 South Bay ReportFebruary 28, 1997 Talisman Energy Inc.15
This change could be due to a facies change in the sediment of the buried valley resulting in
a sharp reduction of the permeability of the aquifer and/or a significant change in the physical
continuity of the buried valley. In other words, the northern part of Mud Lake may be the start
of the main buried valley aquifer. Additional subsurface data will be required to resolve this.
The dams constructed in the southeastern part of the tailings basin to prevent major discharge
of contaminated ground water into Boomerang Lake have achieved, in principle, their objective
of creating a low to very low permeability wall (boundary) as is manifested by the steep
hydraulic gradients between the tailings basin and Boomerang Lake. However, in at least
three places, seepage is occurring.
Another area which warrants discussion is the southwest corner of the tailings basin (i.e. old
town site, situated south of the tailings basin). The bedrock topography, southwest of M78,
and the water chemistry of the piezometer, indicate that the ground water immediately
above the bedrock in location M78, is contaminated. This indicates that contaminated ground
water is flowing towards the south from the tailings basin, possibly at a depth deeper than the
ground water diversion ditch.
The EM survey for this area shows the presence of a well defined but relatively small anomaly.
However, it is known from the stratigraphic information in boreholes M78 and M82 that
significant clay deposits are present in the shallow subsurface which will mask the effect of
the contaminated ground water in the EM surveys. The water chemistry indicates that
contaminated water has travelled southward to the location of M82. The hydraulic head in
M78A confirms that movement is taking place from the tailings basin towards the south.
On the other hand, water level measurements in piezometers M50 and M77A show that the
hydraulic head in these piezometers is at least 150 cm lower than in M78. This difference
cannot be accounted for by survey errors only. This strongly suggests that ground water flow
from the tailings basin towards the south is likely to occur. This significant difference in
hydraulic head implies a relatively steep gradient towards the south. Steep gradients between
two measuring points generally signal a drastic reduction in the permeability of the sediments.

Boojum Research Limited 1995 South Bay ReportFebruary 28, 1997 Talisman Energy Inc.16
The existence of much greater variability in the stratigraphy in this area was confirmed by
boreholes M78 and M82. In summary, although the elevation differences may shed a different
light on the situation, it is possible that the ground water diversion ditch intercepts only a part
of the seepage as it might not have been constructed sufficiently deep to catch the entire
plume.
SeepageSeepage flowflow toto MudMud Lake:Lake: The main pathway for contaminant transport towards
Mud Lake is a buried valley which narrows to a canyon in part of the area between the tailings
basin. Utilizing the water level data collected between June and September 1995 and
considering hydraulic conductivities in the ranges of 0.157 cm/sec and 0.26 cm/sec, a volume
of water can be estimated to pass from the tailings to Mud Lake ranging from 10,100 m3/yr to
16,800 m3/yr (June) and 7,700 m3/yr to 12,800 m3/yr (September). These estimates will be
revised after the elevation data have been corrected with the GPS data. Every cm of error in
the elevation of the water levels between M39A and M80 introduces a change of 7.5 - 10 %
in the above listed values.
The contribution of ground water flow to the contaminant loading of Mud Lake is somewhat
lower than the estimate arrived at in 1994 with 0.6 l/sec, based on water balance of the
drainage basin, compared to the range determined based on hydraulic gradients 0.2 L/sec to
0.5 L/sec. In summary, the changes in the flow volume estimates, evaluated over the last 10
years, are depicted schematically in Map 2.

Boojum Research Limited 1995 South Bay ReportFebruary 28, 1997 Talisman Energy Inc.17
Boojum Research Limited 1995 South Bay ReportFebruary 28, 1997 Talisman Energy Inc.18
3.03.0 EMEM INTERPRETATIONINTERPRETATION OFOF MUDMUD LAKE AREA and WESTLAKE AREA and WEST OFOF
TAILINGSTAILINGS
Electromagnetic surveys carried out in the South Bay Mine area have been used since 1992
to detect and monitor effectively AMD occurrences and their migration. This can be achieved
together with detailed site knowledge. To guide the hydrogeological investigations around
Mud Lake and the seepage path, the same methods have been employed for the following
areas of the South Bay site in 1995:
(1) Mud Lake to determine the extent of the AMD contamination;
(2) West of the Tailings to delineate other potential pathways of contamination leaving the
tailings impoundment;
(3) South of the Tailings/Town site to delineate the extent potential AMD sources in the
ground water not intercepted by the diversion ditch;
(4) Mine Site to evaluate the effects of the Backfill raise diversion ditch on the seepage
from the underground workings.
This section presents the key findings based on the EM survey and presents a discussion of
the Mud Lake area with the results of the water quality data obtained from the piezometers
that were installed to test geophysical anomalies. All of the EM surveys in this area are
"exploratory" in nature and where carried out in progression, focussing on the objectives, to
support the hydrological investigations and to delineate possible other contamination
pathways in the drainage basin.
The Mud Lake area grid covers an area roughly 1 kilometre square immediately north of the
Tailings, including all of Mud Lake, the area north of Decant Pond Outflow, and a portion of
the Mud Lake Outflow. The response of the coil separations of 10 m , 20 and 40 m were
examined, representing progressively deeper penetrations (Maps 3a, 3b, 3c). The overburden
response can also be subtracted from the deeper portions in order to focus on these layers'
responses without those of overburden, reflecting a more realistic picture of the conditions to
a depth of about 15 m (Maps 3d and 3e).

NOTE
Map 1 to Map 5 as well as Map 8a and 8b are Geomar Maps 1995, which are paper copied only. They are gone to Laurantian Sudbury Library.

Boojum Research Limited 1995 South Bay ReportFebruary 28, 1997 Talisman Energy Inc.19
MAP S1

Boojum Research Limited 1995 South Bay ReportFebruary 28, 1997 Talisman Energy Inc.20
MAP S2

Boojum Research Limited 1995 South Bay ReportFebruary 28, 1997 Talisman Energy Inc.21
MAP S3

Boojum Research Limited 1995 South Bay ReportFebruary 28, 1997 Talisman Energy Inc.22
MAP S4

Boojum Research Limited 1995 South Bay ReportFebruary 28, 1997 Talisman Energy Inc.23
MAP S5

Boojum Research Limited 1995 South Bay ReportFebruary 28, 1997 Talisman Energy Inc.24
In the Mud Lake area there are two main anomalous features, namely the MUD LAKE
ANOMALY and the EAST OF MUD LAKE GROUP OF ANOMALIES). The Mud Lake anomaly has
three sources contributing to the conductivity; that of the sediment, that of clay and that of the
contaminated water. The seepage ground water discharge zone is located along the north
shore of Mud Lake. Readings taken at 10 m and 20 m coil separations indicate that the Mud
Lake Anomaly currently extends for about 100 m beyond the north shore at depths of probably
less than 12-15 m.
One interpretation of the geophysical results suggest that an upward migration of
contaminated ground water from a deeper to a shallower aquifer occurs somewhere between
L600mN and L700mN, and lateral flow continues at shallower depths for another 100 m to the
north. If contaminated ground water is indeed at least in part the source of the anomalous
readings, it would suggest that not all of the seepage is discharging into Mud Lake and that
the plume continues to travel. However, taking the hydrological data into account, essentially
only a small fraction can be expected to leave the drainage basin, since all the water can be
accounted for in the drainage basin at large. However the cause of the upwelling is to date
not clarified. The temperature of this area with the floating muskeg did not allow the
installation of piezometers in this area. The only information about the north end of Mud Lake
is therefore that which is derived from the EM-Survey.
Two well defined anomalies which originate in the NW corner of the Tailings merge into the
Mud Lake Anomaly in between lines 100N and 100S. This anomaly is referred to as the
CHARA PONDS ANOMALY, algae named after a small pond in which Chara grows. This alga
is indicative of alkaline water. The anomaly trends north from the tailings dam and links up
with the Mud Lake Anomaly at the south end of Mud Lake.
The CHARA POND ANOMALY extends from about 50mE on L50mN originating from the NW
corner of the tailings impoundment and merges into the Mud Lake Anomaly at approximately
150mE on L230mN. It has been tested by piezometers M66A and M74. Electrical
conductivities in water from M66A and M74 were recorded as high as 1465 :S/cm and 1604
Boojum Research Limited 1995 South Bay ReportFebruary 28, 1997 Talisman Energy Inc.25
:S/cm respectively in the ground water. Zinc concentrations were 60 mg/L in M66A which is
located very close to the tailings impoundment, but outside the dam. In M74 the zinc
concentration had dropped to 1.27 mg/L in M74, located further north in the anomaly.
The second anomaly is referred to as the GRAVEL PIT ANOMALY and originates along the
western margin of the NW corner of the tailings impoundment. It also connects with the Mud
Lake Anomaly at approximately 50mE on L400mN along the western margin of Mud Lake. This
anomaly was previously identified in 1994 in piezometers M39A and M60A as a major plume
of contaminated ground water originating from the tailings impoundment. This area is very
important possibly representing the major portal for tailings seepage to leave the tailings 16
additional piezometers along 5 sections were installed along the EM anomaly in 1995.
Piezometers installed along both these anomalies indicate the conductivity response is the
source of contaminated ground water as no clay is present in this area. It could therefore be
confirmed that the anomaly represents the beginning of that section of the tailings where
seepage is leaving the pond and entering into the deep valley seepage areas, referred to as
Kalin Canyon.
The EM survey results, together with the hydrology, suggest an ridge of outcropping bedrock
trends parallel to the shore of Confederation Lake. The Kalin Canyon is likely the major barrier
for ground water flow into Confederation Lake. The presence of a bedrock outcrop hill situated
immediately southwest of the tailings would further supports this conclusion.
The EAST OF MUD LAKE GROUP OF ANOMALIES produce a much lower response than those
of the Mud Lake areas. They extend northward from the Decant Pond Outflow and appear to
tend towards the northern part of the drainage basin which contains Lena Lake between 600E
and 900E.
The anomalies were tested with 6 piezometers in 1995 (M68, M70A, M70B, M70C and M71).
In all cases, the source of the anomalous responses was clay. This indicates that no seepage

Boojum Research Limited 1995 South Bay ReportFebruary 28, 1997 Talisman Energy Inc.26
are leaving in this direction the tailings impoundment. Electrical conductivities of the ground
water from these holes were in the range of 152 to 329 :S/cm and the highest zinc
concentration was 0.29 mg/L in M68, which is close to background in this area.
Boojum Research Limited 1995 South Bay ReportFebruary 28, 1997 Talisman Energy Inc.27
4.04.0 TEMPORALTEMPORAL VARIATIONSVARIATIONS ININ WATEWATER QUALITY IN SOUTHR QUALITY IN SOUTH
BAYBAY
4.14.1 Summary of Piezometer Water QualitySummary of Piezometer Water Quality
With the deterioration of Mud Lake water quality and the ongoing deterioration of Boomerang
Lake water quality, it is essential to assess if the geochemical/ hydrological conditions of the
site have changed. When there is a significant change in the results from year to year,
previous evaluations and decisions carried out during the project must be reassessed.
Predictions of seepage pathways had been made and contaminant loadings from these sources
to Confederation Lake were evaluated, based on one piezometer sampling campaign.
Subsequent sampling of piezometers was sporadic, addressing mainly the areas of concern
which were determined by unusually high concentrations of metals in the piezometer water.
In Map 4, the spacial distribution is plotted for the sampling events of the most important area,
the tailings, for the years 1986 to 1995. Sampling frequencies for the piezometers are plotted
in Figures 1a to 1c. It can be noted, that sampling, which was accompanied by chemical water
analysis for the piezometers, was generally focused on the areas where potential problems
appeared (M38 and M18 on the mine site Figure 1a). On the other hand, the standpipes M55
and M56 , which are regulatory points, have been sampled to assure that all is in order.
Discharges in these areas would represent a major problem. However to assess changes,
either with time or in a certain location, the data set has to first be evaluated in more detail.
It was also noticed, that some data, preceding the first complete round of sampling of water
in 1987 was not included in the database, established in 1992. It was found necessary to
update and complete the database both with samples collected at the very beginning of the
p r o j e c t a n d m o r e r e c e n t l y , w i t h t h e n e w p i e z o m e t e r s


Boojum Research Limited 1995 South Bay ReportFebruary 28, 1997 Talisman Energy Inc.31
Table 1: Temporal variations in chemical composition of the water in piezometers M10 and M47
Assayer DATE Location Al Cu Mn Zn F*pH F*Cond L*pH L*Cond
# [mg/L] [mg/L] [mg/L] [mg/L] [mg/L] [mg/L] [mg/L] [mg/L]
P i e z o m e t e r M 1 0
345 08-Apr-88 surface,before bail. 505 64 25 274 2.29 2.14 7000
346 08-Apr-88 surface,after bail. 340 54 18 35 2.26 2.11 6000
1467 14-Oct-89 surface,before bail. 520 45 23 168
1468 14-Oct-89 surface,after bail. 502 51 22 164
2255 13-Oct-90 surface,before bail. 196 27 6.3 75 2.14 7000 1.99 6500
2256 13-Oct-90 surface,after bail. 208 30 7.1 76 2.08 5000 1.89 7000
2257 13-Oct-90 bottom,before bail. 212 34 7.7 88 2.20 7000 2.10 7000
P i e z o m e t e r M 4 7
341 08-Apr-88 surface 0.6 0.05 45 219 6.05 5.57 3150
2263 12-Oct-90 bottom <0.01 <0.01 29 73 5.23 3300 5.30 3500
2262 13-Oct-90 top <0.01 <0.01 24 61 3.83 4000 5.12 3750
3673 25-Mar-92 surface <1 <1 82 174 5.34 3900
In addition to the long time lapses between sampling intervals, the effects of water taken from
the piezometer before or after bailing is evident. For M10, the Zn concentrations in April
1988, before bailing and after bailing, varied from 274 mg/L to 35 mg/L, respectively.
Comparing October 1989 and October 1990 data, when the sampling campaigns were
performed, repeated in subsequent years and in the same month, a large difference in Zn
concentrations was noted. Similar Zn concentrations were determined in samples collected
before and after bailing in both the October 1989 and October 1990 samples.
When surface and bottom water of piezometer M47 was sampled in October 1990 before
bailing and after bailing, Zn concentrations were low, compared to samples collected in April
1988 (219 mg/L). In March 1992, the M47 sample again contained a high zinc concentration.
These examples from this small set of data suggest that seasonal variations exist in the
porewater chemistry.

Boojum Research Limited 1995 South Bay ReportFebruary 28, 1997 Talisman Energy Inc.32
Water chemistry data for the new piezometers installed in 1995, which were received at the
time of data analysis (therefore not included in report 1995), suggested very large seasonal
variations. Although the results are not reported here, an example can be given using the
water quality data for piezometer M72C located in Kalin Canyon. In May, a concentration of
1,430 mg/L of zinc was reported along with 7,690 mg/L of iron. However, in October, these
concentrations had decreased to 523 mg/L and 192 mg/L respectively. The calculation of
contaminant loads, given these seasonal trends, would generate very different assessments
regarding the magnitude of the problem. On the other hand, these large differences indicate
the possibility of retardation, which could be due to the precipitation processes taking place
over the seepage path. When concentrations are very high, the solution could potentially be
brought to saturation, which in turn would facilitate precipitation of the contaminants
underground.
If this is possible, it would represent an avenue for in-situ treatment. A detailed evaluation of
the long-term geochemical changes in the tailings should be carried out. However, this brief
evaluation indicates, that the estimates of loads of contaminants from the tailings to the
receiving environment can potentially vary by orders of magnitude, when seasonal variations
in piezometer water quality are included in estimates of the potential range. Seasonal
variation in the piezometers' water quality of such a magnitude was not previously reported
in the literature. All data have to be evaluated from this perspective in order to address
potential contaminant loads. Given the volume of data available from this site, a further update
of the Paradox database, completed up to 1993, is absolutely necessary since the efficiency
with which this assessment can be done can greatly be increased.

Boojum Research Limited 1995 South Bay ReportFebruary 28, 1997 Talisman Energy Inc.33
4.24.2 TemporalTemporal VariationsVariations inin MetalMetal ConcentrationsConcentrations iin Surfacen Surface
WatersWaters
Given that the large differences in chemical composition was evident in the piezometers, it was
considered useful to assess the seasonal variation in the surface waters associated with the
South Bay site. Available analyses for samples collected from a number of selected points at
the South Bay site, between October 1986 and September 1994, have been plotted to
determine where heavy-metal concentrations are increasing or decreasing with time.
It should be kept in mind that the detection limits for the heavy metals has changed over the
years, as analytical laboratories have become more advanced. Thus for some of the pre-1994
analysis, where the detection limit was apparently set at 1.0 or 0.1 mg/L, rather than 0.01
mg/L or lower, it may appear erroneous that very low metal concentrations existed, which in
fact is not the case in the early 1990 samples.
A brief evaluation of the data set available is given for each area of the site below, starting with
the mine site. This site was sampled quite frequently due to the diversions required to prevent
seepage into Confederation Lake. The sampling stations are given in Map 5.
Warehouse Seep (WHS) (Figure 2) was sampled since 1992 and shows increases in the
values for [Al], [Cu], and [Fe], but no clear trend for [Mn] and [Zn]. Some seasonal variations
may be apparent. For Backfill Raise Cap (BRC) the data in Figure 3 shows an increase in the
values for [Al] and [Fe], and a decrease in the values for [Cu], [Mn], and [Zn]. Seasonal
variations appear stronger for metal concentrations determined in BRC water samples than
in WHS. Both WHS and BRC are draining into the larger ditch, leading to Boomerang Lake,
where sampling locations have been established since 1992 (Figure 4). The 1994 analyses for
location BR2.5 show increases in the values for all metals compared to samples collected from
location BR4 in 1992. Apparent seasonal variation is strongest in [Fe].


Boojum Research Limited 1995 South Bay ReportFebruary 28, 1997 Talisman Energy Inc.35
Mill Pond Outflow (MPO), the sampling location where water is leaving Decant Pond, also
drains toward Boomerang Lake. Seasonal variations are evident both in 1992 and 1994, but
the concentrations are overall lower in 1994 (Figure 5).
Boomerang Lake Outflow (B1) (Figure 6) displays an increase in the concentrations of all five
metals, more than an order of magnitude, from 1990 to 1992 and somewhat smaller increases
from 1992 to 1994. All metal concentrations, with the exception of copper, were well above
1 mg/L in 1994. The seasonal variations are not evident.
The water leaving Boomerang Lake is sampled at a station about 5 to 10 m outside the mouth
of the outflow area in Lost Bay in Confederation Lake (C1, Figure 7). Seasonal variations are
stronger than in Boomerang lake. The 1994 values (are above 1 mg/L for Zn and Mn) are
somewhat lower than those for the same months in 1992. There is some uncertainty regarding
[Al] and [Cu], due to the higher detection limits used for the 1992 samples.
The seepages which drain toward Confederation Lake , also indicated on Map 5, are seeps
(BR13, 13B and 13C) and their seasonal metal concentrations are summarized in Figure 8.
As would be expected strong seasonal variations occurred in all five metal concentrations,
primarily due to varying degrees of dilution with time. Overall the 1994 values for all metals
are lower than the 1992 values. This may well reflect the effect of the drainage ditches.
The metal concentrations of Portal Raise Cap (PRC) (Figure 9) show some seasonal variations.
Overall, the 1994 values for all metals are higher than the 1992 values and at this point can
not be explained. The Portal Raise Seep (PRS) (Figure 10) displays strong seasonal variations
in 1992 and smaller variations in 1994. The 1994 values for [Fe], [Mn], and [Zn] are higher
than those for 1992; the 1994 values for [Al] and [Cu] are within the ranges for these metals
for 1992. In 1994 the metal concentrations were higher in the PRS samples than in the PRC
samples. This is highly likely due to the fact that more fresh water from Antenna hill was
diverted and thus generally less water enters the PRC.
In Confederation Lake a shore sample is collected to determine the degree of dilution which

Boojum Research Limited 1995 South Bay ReportFebruary 28, 1997 Talisman Energy Inc.36
takes place on the shores of (CS13) (Figure 11). Metal concentrations show some seasonal
variation for 1994, with a possible increasing trend for Mn and Zn. The 1994 values, all below
1.0 mg/L, are apparently lower than those for 1992.
TheThe surfacesurface waterswaters leavingleaving the tailings basin tothe tailings basin to MudMud LakeLake areare
referredreferred toto asas stations.stations. Decant Pond Outflow (DPO) metal concentrations are
plotted with respect to time in Figure 12. Some seasonal variations are noted and in 1994 all
[Mn] and [Zn] values were lower than those in 1992. Trends for [Al], [Cu] and [Fe] are
uncertain, due to strong seasonal variations. For the 1992 data for this station may be missing
due to higher detection limits (1.0 or 0.1 mg/L) for these years.
For the station Mud Lake Outflow (ML18) (Figure 13) some seasonal variations can also be
observed (higher than average concentrations in March, followed by lower than average
concentrations in April) except for [Zn] and [Cu]. The data for [Zn] suggest a long-term
increase. After April 1994, all Fe, Mn, and Zn concentrations exceeded 5 mg/L. This increase
is clearly connected to the slow breakthrough of the ground water seepage through the
sediment.
In summary, the metal concentrations of the surface water also shows seasonal variations as
was suspected from the piezometer data. Unfortunately the same situation arises, that a more
complete data set should be evaluated for seasonal and long term trends. Of the 19 sampling
stations, seasonal variations occur at 14 locations and were noted. This in part limits a non-
statistical approach to the data set. A trend analysis would be required to assess such
differences. At 4 stations, increases in Zn concentrations are noted, including the seepages
from the underground workings which report to Boomerang Lake. Subsequently, the zinc
concentrations have also increased in Boomerang Lake. At two stations, marginal increases
in Zn concentrations were observed, but concentrations remain below 1 mg/L.


Boojum Research Limited 1995 South Bay ReportFebruary 28, 1997 Talisman Energy Inc.43
5.05.0 MUDMUD LAKE:LAKE: EXISTINGEXISTING CONDITIONSCONDITIONS ANDAND THETHE APPLICATIONAPPLICATION
OF ARUMOF ARUM
5.15.1 Mud Lake Water QualityMud Lake Water Quality
Mud Lake water quality has been measured intermittently between 1986 and 1993, and
intensively since March, 1994, when it was determined that entry of acid mine drainage into
Mud Lake had commenced.
Surface water sampling locations in the vicinity of Mud Lake are shown in Map 6. Water
quality has been determined for major surface water inflows to Mud Lake (DRO, ML28, ML29),
ground water inflow (ML27), Mud Lake proper (MML, ML21, ML22, ML23, ML24, ML25,
ML31, ML32, ML45), locations with an newly constructed enclosure (ML26, ML27, EN5) and
the Mud Lake outflow path (ML20 - ML13). Muskeg pore water quality in the Mud Lake
vicinity has been sampled at CAT2, ML33, ML34, Ml35, ML36, ML37, ML38, ML39, 750N
180E and 750N 80E.
Water quality has also been determined for Lena Lake (NE1, NE2) whose outflow (ML41,
ML37) reports to Armanda Lake (ML11, ML43, ML44), which also receives Mud Lake
discharge. The combined flows of these three lakes is likely mixed at ML30 prior to
discharging to Confederation Lake via a stream (ML1 - ML10). Water quality of the mixing
zone of the three lakes' discharge with Confederation Lake is sampled at C11, located
approximately 15 m from the ML1 discharge (Map 6).
All available water quality data for Mud Lake south end (ML22), middle (MML), and outflow
(ML18) are presented in Table 2. Water quality in the mixing zone of fresh surface water run-
off and Mud Lake presented for ML21.
There is some evidence of Mud Lake contamination at the outflow (ML18) by acid mine
drainage from the South Bay tailings as early as March 24, 1992 (Table 2). The sulphate
concentration was 336 mg/L, while in the previous three samples, sulphate

Boojum Research Limited 1995 South Bay ReportFebruary 28, 1997 Talisman Energy Inc.44

Boojum Research Limited 1995 South Bay ReportFebruary 28, 1997 Talisman Energy Inc.45
Table 2: Mud Lake-Water Chemistry, 1986-1995.
Sample Zn pH Acidity SO4 Fe Cond. EmLocation Date mg/L mg/L mg/L mg/L uS/cm mV
ML18 08-Apr-88 0.01 5.7 nd 42 0.08 35016-Oct-89 0.31 7.2 11 11 0.6 4112-May-91 0.13 6.2 40 26 0.4 19724-Mar-92 <1 6.6 180 336 56 43230-Mar-94 0.20 5.5 353 621 86 1050 6526-Apr-94 0.31 4.8 48 85 6.4 246 16913-Jun-94 6.8 2.8 218 666 30 1436 69311-Jul-94 6.8 2.9 188 585 23 1085 45527-Aug-94 6.7 2.8 148 627 20 780 45704-Dec-94 8.6 2.9 230 462 58 108 37105-May-95 8.3 3.2 342 462 152 967 51127-Jul-95 6.5 3.1 185 696 27 1071 44014-Aug-95 3.7
ML21 05-Apr-86 0.06 6.1 nd 42 0.5 13017-Jun-86 0.05 6.3 nd 36 0.2 15025-Jul-86 <0.005 6.6 nd 180 0.3 48008-Apr-88 0.01 nd nd 144 0.2 nd10-Jul-94 0.16 5.8 28 15 1.2 64 15227-Aug-94 6.1 14 175 10905-May-95 0.07 5.3 3.4 26 0.29 135 282
MML 17-Jun-86 0.02 7.6 nd 160 0.1 43025-Jul-86 0.03 6.2 nd 183 0.4 475
bottom 30-Mar-94 11.8 5.3 600 1143 218 2200 33330-Mar-94 9.8 3.2 304 834 79 1423 393
bottom 27-Apr-94 8.0 5.1 379 954 168 1430 12127-Apr-94 1.7 4.2 79 188 19 406 27215-Jun-94 8.1 2.8 290 681 55 1450 660
bottom 15-Jun-94 8.1 2.8 280 690 55 1455 66228-Aug-94 7.9 2.7 171 494 27 700 384
bottom 28-Aug-94 5.6 281 1790 37726-Feb-95 7.7 5.6 269 519 83 1043 4205-May-95 4.9 4.7 185 366 77 769 33027-Jul-95 7.8 3.0 207 53 925 431
ML22 05-Apr-86 0.22 6.1 nd 28 0.6 13017-Jun-86 0.04 7.3 nd 154 0.1 43525-Jul-86 0.12 6.2 nd 132 0.6 48019-Jul-87 <0.005 6.2 nd 51 6.9 20014-Aug-87 <0.005 6.2 nd 27 1.0 24016-Apr-91 0.67 6.3 nd 109 0.1 418
bottom 27-Apr-94 7.0 3.8 500 1164 269 1670 26415-Jun-94 7.5 2.8 263 660 48 1440 66828-Aug-94 2.6 164 700 408
bottom 28-Aug-94 4.0 161 640 408(A-6 loc) 26-Feb-95 0.34 5.7 127 51.9 35 375 168(B-6 loc) 26-Feb-95 1.3 5.7 240 363 72 722 118
28-Sep-95 11 2.7 216 513 31 1530 540

Boojum Research Limited 1995 South Bay ReportFebruary 28, 1997 Talisman Energy Inc.46
concentrations did not exceed 42 mg/L.
Relatively high zinc concentrations in Mud Lake outflow (ML18) were first measured on June
13, 1995, when 6.8 mg/L Zn was detected in the outflow. Since this date, the pH of outflow
water has remained less than 3.7, and is typically around pH 3.0. Because of the relatively
low pH, dissolved iron remains is solution, ranging from 20 to 152 mg/L, and because of
dissolved iron and zinc concentrations, the acidity has ranged from 148 to 342 mg/L.
Although Mud Lake is relatively shallow (< 2 m), water quality differences between surface
and bottom water have been regularly detected, particularly during winter sampling (Table 2).
Bottom water pH, conductivity and particularly iron concentrations are usually much higher at
the sediment-water interface than surface water. Since Mud Lake sediments are comprised
of highly organic materials, microbially-mediated ferric iron reduction in near-surface sediments
appears to be an very active process year-round. Recycling of iron as dissolved ferrous iron-
ferric iron - ferric hydroxide, then iron reduction again, is likely rapidly occurring throughout
Mud Lake.
Zinc concentrations in bottom water are only slightly elevated, compared to surface water zinc
concentrations. This may indicates that recycling of iron, but not zinc, between sediment and
the water column is occurring. In fact, ferrous iron oxidation and ferric hydroxide precipitation
is likely already contributing to zinc removal from Mud Lake surface water prior to its discharge.
Surface water quality at ML22, located at the south end of Mud Lake, is similar to MML water
quality. This is expected, since surface water freely mixes throughout most of Mud Lake in the
ice-free season. One notable exception is the north-east section of Mud Lake (ML21), where
fresh water run-off mixes with Mud Lake water. Water quality is this small bay is typically
good, with high pH, low acidity and relatively low zinc and iron concentrations.
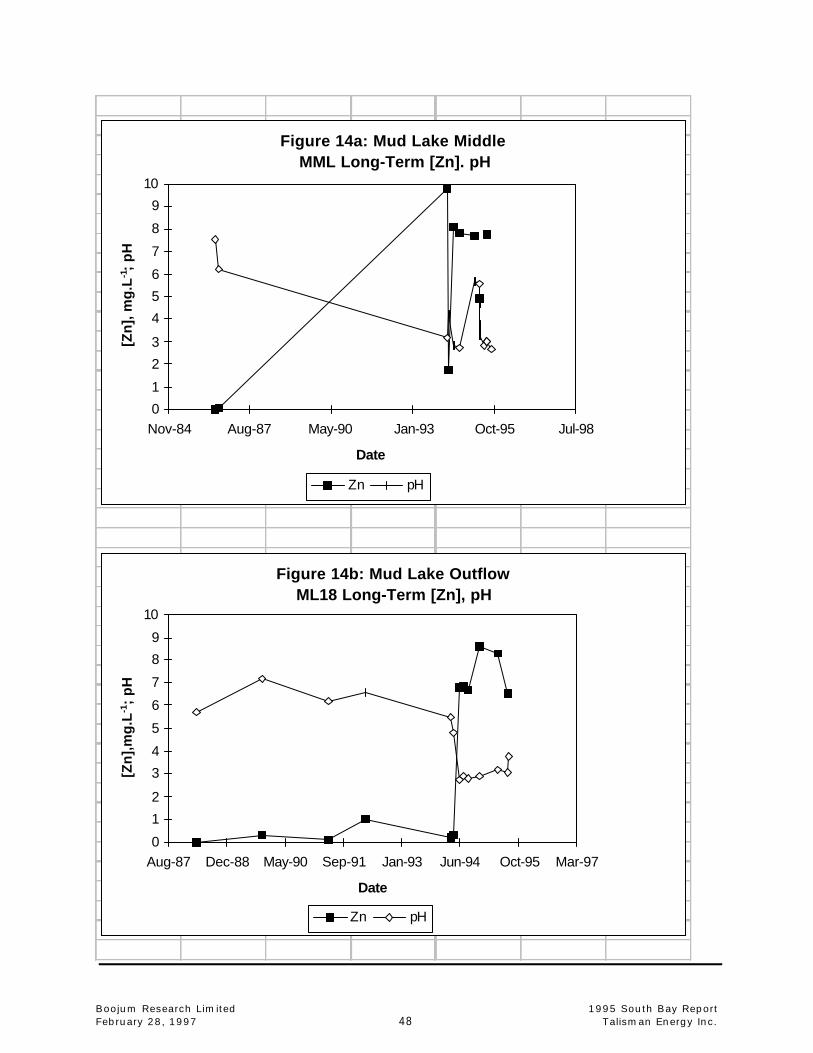
The long term pH and zinc concentration data for station MML are shown in Figure 14a. It is
evident that regular sampling should have been performed between 1986 and 1994.

Boojum Research Limited 1995 South Bay ReportFebruary 28, 1997 Talisman Energy Inc.47
Fortunately, the outflow of Mud Lake (ML18) was more regularly sampled (Figure 14b), and
the rapid deterioration of Mud Lake water quality in the spring of 1994 is clearly evident. From
estimates of hydraulic conductivity in the region of "Kalin Canyon" it can be projected, that the
time the seepage would take to travel the distance between the northwestern edge of the
tailings pond and the northern end of Mud lake is about 5 to 6 years. Thus the sudden
appearance of contamination in Mud lake, supports a very well defined ground water seepage
path. It will be interesting to determine a contaminate mass balance for the drainage basin
integrating, both ground water and surface water loadings when a complete data set is
generated in 1996.
Boojum Research Limited 1995 South Bay ReportFebruary 28, 1997 Talisman Energy Inc.48
Figure 14a: Mud Lake MiddleMML Long-Term [Zn]. pH
0
1
2
3
4
5
6
7
8
9
10
Nov-84 Aug-87 May-90 Jan-93 Oct-95 Jul-98
Date
[Zn]
, mg.
L-1;
pH
Zn pH
Figure 14b: Mud Lake OutflowML18 Long-Term [Zn], pH
0
1
2
3
4
5
6
7
8
9
10
Aug-87 Dec-88 May-90 Sep-91 Jan-93 Jun-94 Oct-95 Mar-97
Date
[Zn]
,mg.
L-1;
pH
Zn pH

Boojum Research Limited 1995 South Bay ReportFebruary 28, 1997 Talisman Energy Inc.49
5.25.2 Receiving Water (C11) Water QualityReceiving Water (C11) Water Quality
The combined flows of Mud Lake, Lena Lake and Armanda Lake report to Confederation lake
and are sampled in the mixing zone, about 5 to 10 metres away from a diffuse stream bed
defined by a beaver dam at station C11 (Table 3). Zinc concentrations were typically less than
0.1 mg/L between 1996 and September 1991. Essentially since 1994 higher zinc
concentrations are reported, particularly during run-off season in April 1994 and May 1995 and
then reported in October 1995, where concentrations of zinc were as high as 2 mg/L. In
October 1995 the pH measured was also low with a value 3.6 and the acidity elevated 206
mg/L in comparison to no detectable acidity . Values of 1 to 10 reported in Table 3 compare
to alkalinity very well. Alkalinity and acidity values are generally very low in the October, 1995
sample. However, a sample collected 15 m further out in Confederation Lake (@ sedges)
contained only 0.054 mg/L and the pH was 5.6, indicating that the discharge dissipates very
fast.

Boojum Research Limited 1995 South Bay ReportFebruary 28, 1997 Talisman Energy Inc.50
Table 3: Confederation Lake at C11-Water Chemistry, 1986-1995
Sample Zn pH Acidity Alkalinity SO4 Fe Cond. Em
Date mg/L mg/L mg/L mg/L mg/L :S/cm mV
18-Jun-86 0.04 7.0 N.D. N.D. 0.07 70 N.D.
26-Jul-86 0.03 7.2 N.D. N.D. 0.09 51 N.D.
17-Aug-86 0.02 7.7 N.D. N.D. 0.02 60 N.D.
15-Oct-86 0.33 6.6 N.D. N.D. 0.89 50 N.D.
16-Jul-87 1.00 6.9 N.D. 174 99 100 N.D.
13-Aug-87 <0.005 7.2 N.D. <0.01 <0.01 70 N.D.
05-Oct-87 0.04 6.6 N.D. 24 <0.01 38 N.D.
24-May-88 0.04 7.2 N.D. 39 <0.01 120 N.D.
19-Jun-88 <0.01 6.9 N.D. 24 <0.1 N.D. N.D.
23-Aug-88 0.01 6.0 N.D. 36 0.1 N.D. N.D.
14-May-89 0.03 6.3 N.D. 36 0.1 142 N.D.
25-Aug-89 0.30 6.6 N.D. 33 0.7 60 N.D.
23-Jun-90 <0.01 6.3 N.D. 42 0.1 N.D. N.D.
11-Oct-90 0.05 5.8 N.D. 3.3 0.1 150 3
28-Sep-91 0.04 6.6 10 15 <1 N.D. N.D.
24-Mar-92 <1 5.8 10 39 <1 92 321
14-Jul-92 0.70 8.0 5.5 78 <1 140 360
17-Oct-92 0.31 6.2 4.7 N.D. 0.33 218 218
10-Apr-93 0.17 6.3 7.9 17 N.D. 0.53 190 156
11-Sep-93 0.43 6.9 1.2 21 16 0.046 78 29
10-Oct-93 0.27 6.4 6 12 80 0.35 244 100
30-Mar-94 0.11 6.1 17 30 24 0.10 119 169
26-Apr-94 0.15 6.9 6.6 8 38 0.42 128 53
18-Jun-94 0.10 7.2 2.2 11 86 0.16 216 394
14-Jul-94 1.1 5.7 14 35 0.26 222 103
30-Aug-94 0.06 6.0 4.1 22 8.04 0.033 55 134
20-Mar-95 0.48 6.1 5.1 8 86 0.67 226 139
11-May-95 0.72 6.7 5.7 4 95 0.69 170 584
11-May-95 0.64 6.7 0 8 76 0.84 140 536
21-Oct-95 2.02 3.6 206 48 1.8 401 206
21-Oct-95 * 0.054 5.6 78 3.8 0.019 69 78

Boojum Research Limited 1995 South Bay ReportFebruary 28, 1997 Talisman Energy Inc.51
5.35.3 Mud Lake mass balancesMud Lake mass balances
Measurements of flows at key locations in the Mud Lake drainage basin and downstream had
been carried out in 1994 August and chloride analysis where performed to arrive at a mass
balance of elements in the drainage basin. The frequency of the measurements is not very
high, however, they are useful for comparison to estimates of drainage basin base flow made
based on drainage basin area and net precipitation data for the region.
The Mud Lake drainage basin area is estimated to generate a base flow of 15.9 L/s (Table 4a
and 4b). Measured flow volumes at Mud Lake outflow (ML18) are in good agreement for the
month July and May 1995 and the May measurement in August 1994, but the measurements
in July 1994 with 66 L/s, and the measurement in August 1995 with 7.23 L/s are either half
or four times the estimated base flow. In order to resolve these differences it is necessary to
obtain the area for the total drainage basin of which Mud Lake is only a subbasin, and
includes Armanda Lake and Lena Lake.
Extensive sampling of water and measurements of flows were performed on August 29, 1994
in the immediate area of Mud Lake. This data were reported in the Mud Lake report in
November 1994 and are used to compare the data which have been collected in 1995 at the
same locations with the May 12, 1995. The results are presented for sources of water to Mud
Lake, including Decant Pond Outflow (DRO), freshwater inflow (ML29), and two examples of
contaminated ground water emergence into Mud Lake at its north end (ML26 bottom, ML27
bottom). The final water quality of Mud Lake, following mixing of fresh and contaminated
water, is presented for ML18 Mud Lake Outflow, the location where good flow measurements
can be carried out as the channel is well defined (Table 5). Generally the concentrations of Ca,
K, S are higher in the fresh water in August 1994 than in May 1995. Unfortunately the Na
concentrations are higher in May and the pH is lower than in 1994 fall.

Boojum Research Limited 1995 South Bay ReportFebruary 28, 1997 Talisman Energy Inc.52
Table 4a: Water Balance for Mud Lake Drainage Basin, 1994 - 1995.
Decant Pond Run-Off
0.012 L.s-1 13-Jul-943.11 L.s-1 29-Aug-94
0.29 L.s-1 05-May-95
1.61 L.s-1 12-May-95 Table 4b: Mud Lake Outflow Volumes.1.25 L.s-1 26-Jul-950.03 L.s-1 14-Aug-95 Mud Lake Drainage Basin
Freshwater Inflow Stream, ML29
0.658 L.s-1 29-Aug-94 500,125 m3.yr -1, ROVE, 1989
15.9 L.s-1
Contaminated Groundwater Inflow ML18, Outflow65.70 L.s-1 13-Jul-94
21,870 m3.yr-1, ROVE, 1989 14.55 L.s-1 29-Aug-94
0.7 L.s-1 from tailings 16.13 L.s-1 12-May-95
(N, NW, W directions) 17.60 L.s-1 26-Jul-95
7.23 L.s-1 14-Aug-95
NE,NW,Mud Lakes
Combined Outflows, ML1
51.30 L.s-1 29-Aug-9434.03 L.s-1 12-May-95
Table 5: Mud Lake Area Water Chemistry and Flows.
Decant Decant Fresh Fresh Ground Ground Ground Mud MudPond Pond Inflow Inflow Water Water Water Lake Lake
Outflow Outflow Stream Area Inflow Inflow Inflow Outflow OutflowDRO DRO ML29 ML21 ML26 Bot ML26 Bot ML27Bot ML18 ML18
29-Aug-94 12-May-95 29-Aug-94 12-May-95 29-Aug-94 12-May-95 29-Aug-94 29-Aug-94 12-May-95
Flow, L/s 3.11 1.61 0.66 N.A. N.A. N.A. N.A. 15 16
pH 5.7 5.8 6.1 5.3 5.3 5.4 5.7 2.8 3.2Cond, uS/cm 450 517 175 135 3520 1464 4120 780 967
TDS,mg/L 252 N.A. 156 N.A. 10200 N.A. 12900 774 N.A.Na,mg/L 1.2 2.8 0.40 2.2 15 14 15 2.5 4.7Cl,mg/L 0.25 N.A. 1.6 N.A. 20 N.A. 23 2.2 N.A.S,mg/L 39 62 29 8.6 2553 1500 3400 209 232Zn,mg/L 1.1 2.0 0.05 0.07 184 113 184 6.7 8.30Al,mg/L 0.03 0.01 0.03 0.01 0.19 0.01 0.03 0.17 0.01Fe,mg/L 0.12 0.01 0.21 0.29 1610 1730 1790 20 152K,mg/L 5.6 1.80 4.4 1.40 20 17 23 2.3 3.6Ca,mg/L 87 65 38 13 502 364 508 91 107
N.A. Not assayed/measured.
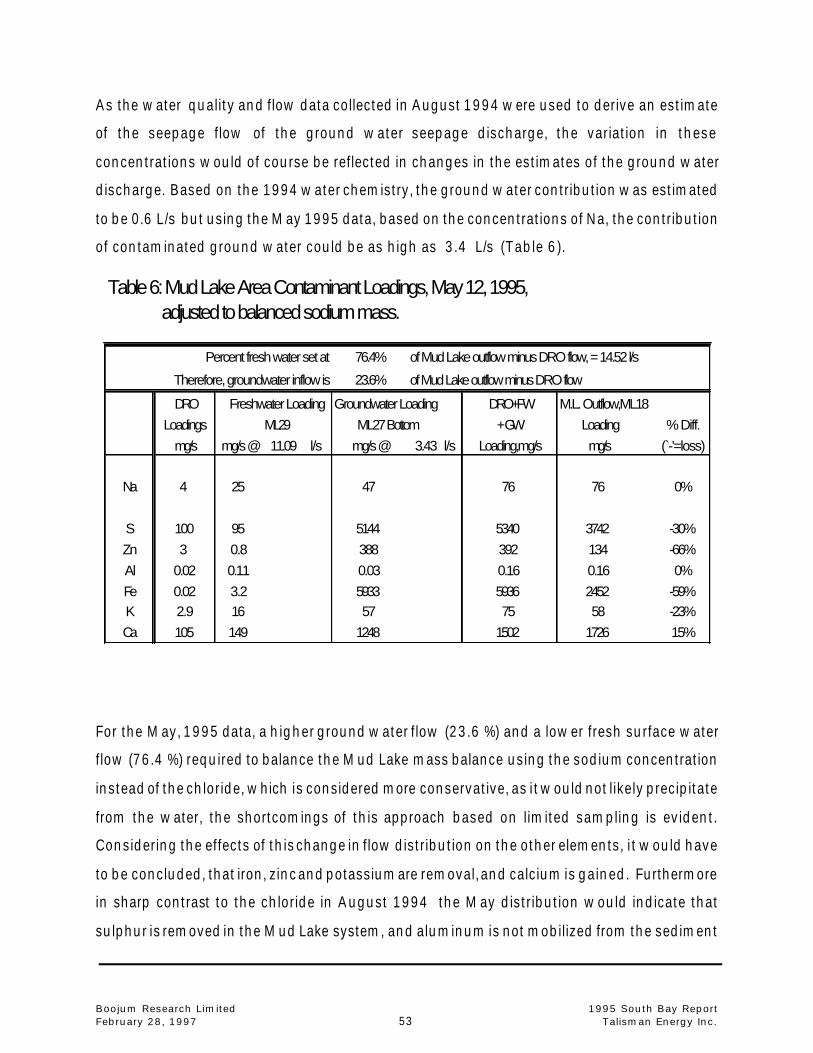
Boojum Research Limited 1995 South Bay ReportFebruary 28, 1997 Talisman Energy Inc.53
Table 6: Mud Lake Area Contaminant Loadings, May 12, 1995, adjusted to balanced sodium mass.
Percent fresh water set at 76.4% of Mud Lake outflow minus DRO flow, = 14.52 l/s
Therefore, groundwater inflow is 23.6% of Mud Lake outflow minus DRO flow
DRO Freshwater Loading Groundwater Loading DRO+FW M.L. Outflow,ML18Loadings ML29 ML27 Bottom + GW Loading % Diff.
mg/s mg/s @ 11.09 l/s mg/s @ 3.43 l/s Loading,mg/s mg/s (̀ -'=loss)
Na 4 25 47 76 76 0%
S 100 95 5144 5340 3742 -30%Zn 3 0.8 388 392 134 -66%Al 0.02 0.11 0.03 0.16 0.16 0%Fe 0.02 3.2 5933 5936 2452 -59%K 2.9 16 57 75 58 -23%Ca 105 149 1248 1502 1726 15%
As the water quality and flow data collected in August 1994 were used to derive an estimate
of the seepage flow of the ground water seepage discharge, the variation in these
concentrations would of course be reflected in changes in the estimates of the ground water
discharge. Based on the 1994 water chemistry, the ground water contribution was estimated
to be 0.6 L/s but using the May 1995 data, based on the concentrations of Na, the contribution
of contaminated ground water could be as high as 3.4 L/s (Table 6).
For the May, 1995 data, a higher ground water flow (23.6 %) and a lower fresh surface water
flow (76.4 %) required to balance the Mud Lake mass balance using the sodium concentration
instead of the chloride, which is considered more conservative, as it would not likely precipitate
from the water, the shortcomings of this approach based on limited sampling is evident.
Considering the effects of this change in flow distribution on the other elements, it would have
to be concluded, that iron, zinc and potassium are removal, and calcium is gained. Furthermore
in sharp contrast to the chloride in August 1994 the May distribution would indicate that
sulphur is removed in the Mud Lake system, and aluminum is not mobilized from the sediment

Boojum Research Limited 1995 South Bay ReportFebruary 28, 1997 Talisman Energy Inc.54
in Mud lake.
Similar to the conclusions reached based on the evaluation of the new flow data obtained
during 1995 the mass balances have to be evaluated in the context of the seasonal variations
and the entire drainage basin.
5.45.4 Sedimentation in Mud Lake and Sediment CompositionSedimentation in Mud Lake and Sediment Composition
From the mass balances and the visual observations it is undebatable that iron is precipitating
in Mud lake. The ARUM process, Acid Reduction Using Microbiology, is a natural process,
which can support iron precipitation, but for the implementation it is necessary to determine
the rates at which iron is precipitating, in order to design the section of the treatment system
in which this precipitation is to take place. After precipitation of iron, the microbial acid
reduction will increase the pH and metals are relegated to the sediment. From sedimentation
traps the quantity of iron particles, which are settling out of the water column can be
quantified.
5.4.15.4.1 Sedimentation RatesSedimentation Rates
Removal of iron from Mud Lake is suggested both from visual observations of massive iron
hydroxide precipitation in Mud Lake and confirmed by the mass balance evaluations.
Elevated pH (~ pH 5) in Mud Lake surface water beneath the ice in April 1994 and March,
1995 suggests that iron reduction with subsequent pH increases occurs in the water column
during winter. Following the melt of the ice cover in early May, 1995, the pH of Mud Lake
surface water rapidly decreased, suggesting that ferrous iron accumulated in the water column
over winter oxidized to ferric iron, which in turn hydrolysed and generated hydrogen ions.

Boojum Research Limited 1995 South Bay ReportFebruary 28, 1997 Talisman Energy Inc.55
Table 7: Mud Lake Sediment Trap Data for 1994 and 1995.
Avg. t Sed. Cum. t Sed. Avg. g.m-2.d-1
Period Days in Cum. Days in Lake in Lake Sed. in LakeFrom To period in Period During Period During Period During Period
17-Jun-94 28-Aug-94 72 72 93 93 16.128-Aug-94 11-May-95 256 328 286 379 14.011-May-95 28-Jun-95 48 376 183 561 47.628-Jun-95 28-Jul-95 30 406 179 741 74.628-Jul-95 20-Oct-95 84 490 110 851 16.4
Average Sedimentation 634 t.lake-1.yr-1 33.7 g.m-2.d-1
Seasonal variation in iron hydroxide sedimentation rates are anticipated, based on the
seasonally variable chemistry of Mud Lake. Sedimentation traps were installed in Mud Lake
in June, 1994, and periodically sampled since. Sedimentation rates have ranged from 14 to
75 g/m2/d in the period between June, 1994 and October, 1995. The average sedimentation
rate over the entire surface area of Mud Lake is equivalent to 634 t of new sediment per year
(Table 7).
The iron load removed in the Mud Lake system was estimated at 801 mg/s, from the chloride-
based mass balance estimates. This is equivalent to only 25 t of iron each year. The
sedimentation data indicate, compared to estimates of the iron load that iron is recycled in Mud
Lake, possibly as many as 12 times each year, assuming that about 50 % of the sedimenting
particles are iron. It is this process which should be utilized to remove zinc, either through the
microbially-driven iron cycling, which could be supplemented by organic carbon stored in
surface sediments or through a better understanding the zinc iron particulate interaction as

Boojum Research Limited 1995 South Bay ReportFebruary 28, 1997 Talisman Energy Inc.56
Figure 15: Mud Lake Seasonal Sedimentation RatesValue above bars denotes no. of days in situ.
25684
30
72
48
0102030405060
7080
Jun-
95
Aug
-94
Jul-9
5
Oct
-95
May
-95
Season
Sedi
men
tatio
n R
ate,
g.m
-2.d
-1
Spring Summer Fall Overwinter
part of the zinc removal process.
The seasonal sedimentation rates are shown in Figure 15. As expected, sedimentation rates
are highest in spring in summer, while in fall and winter, sedimentation rates are low. High
spring sedimentation rates may be due to oxidation of accumulated ferrous iron concentrations,
while high rates in summer may be due to both higher microbially-mediated iron reduction
rates and possibly remobilization of settled sediments by wind-driven circulation in the lake.
5.4.25.4.2 Settling Particles and Sediment CompositionSettling Particles and Sediment Composition
The solids recovered from the Mud Lake sedimentation trap on five occasions were assayed
for metals and cations (Table 8). The iron content in these solids range from 41 % to 60 %.
Zinc concentrations in these samples are relatively low, ranging from 0.01 % to only 0.1 %.
However, the 634 t of particles settling each year contain 63 to 630 kg of zinc. The zinc
removal estimate, according to the chloride-based load calculations, is very similar, suggesting
that 599 kg of zinc remain in Mud Lake.

Boojum Research Limited 1995 South Bay ReportFebruary 28, 1997 Talisman Energy Inc.57
Table 8: Mud Lake 1994, 1995 Sed Trap Solids;1995 Sediments Elemental Composition.
Sedimentation Traps SedimentDate 10-Jul-94 28-Aug-94 07-May-95 28-Jul-95 20-Oct-95 20-Oct-95 20-Oct-95
Assay No. 5708 5709 5710 5711 5712 5713 5714Location South Bay South Bay South Bay South Bay South Bay South Bay South Bay
Mud Lake Mud Lake Mud Lake Mud Lake Mud Lake Mud Lake Mud LakeSed Trap Sed Trap Sed Trap Sed Trap Sed Trap Inside Outside
Enclosure EnclosureAl 39 22 47 < 1.0 15.6 4030 4570Co 21 16 < 1.5 42 37 10.8 28Cr < 0.30 < 0.30 < 1.5 < 0.30 < 0.30 26 81Cu 11 2.7 134 0.20 0.70 16.2 20Fe 410000 422000 457000 59900 55300 133000 109000Mn 337 < 0.30 155 < 0.30 27 475 615Pb < 1.0 2.2 < 5.0 < 1.0 < 1.0 14.5 16.8S 43400 37800 226 49900 44600 26000 26300
SO4 130200 113400 678 149700 133800 78000 78900Zn 535 120 963 195 752 3350 12100
The May 7, 1995 sedimentation trap solids sample was collected after the traps overwintered
in Mud Lake. These solids' composition varies from the remainder of trap solids which
collected in the traps over the ice-free season (Table 8). The May, 1995 sample contains only
0.07 % sulphate, compared to 11 to 15 % in the other four samples. However, this sample
contained higher concentrations of zinc, copper, manganese and aluminum than most or all
of the other samples. Freeze-out of these elements from the ice cover and precipitation due to
this increased concentration may be an other possible mechanism which should be
investigated, since the amount of zinc which had accumulated in the particles is higher. The
lower sulphate concentration in the May, 1995 sample is possibly a reflection of the changes
in ground water composition, where a reduction of sulphur in the discharge from the ground
water can be noted (Table 5) between August 1994 and May 1995.
The composition of lake sediment is notable different that the composition of new sediment
particles forming in the water column, according to the composition of materials collected in

Boojum Research Limited 1995 South Bay ReportFebruary 28, 1997 Talisman Energy Inc.58
the sedimentation traps (Table 8). Lake sediment collected from inside and outside of the Mud
Lake ARUM enclosure contains much higher aluminum and zinc concentrations, and somewhat
higher manganese, lead and chromium concentrations than sedimentation trap solids.
However, lake sediments contain less iron and sulphate, compared to sedimentation trap solids
(in most cases).
The higher pH and lower redox of lake sediment, compared to the water column, likely favours
the formation of metal hydroxides and the adsorption of metals onto sediment organics.
Therefore, the sediment pore water concentrations may have low concentrations of dissolved
forms or these metals, and serve as a metal sink, such that there is a net flux of dissolved
metals from the water column to the sediment.
It is suggested that a undetermined fraction of the iron which settles to the lake sediment each
year is reduced and remobilized as dissolved ferrous iron. This dissolved iron may not only
diffuse back into the water column, but could also diffuse downwards to greater depths in the
sediment. Elevated concentrations in bulk surface sediment samples would therefore not
necessarily reflect increases in sediment iron concentrations.
Long-term changes in Mud Lake sediment composition might provide some indication of the
long term accumulation of elements in these sediments. Sediments collected in 1986, 1994
and 1995 were analyzed and comparisons is possible (Table 9). Aluminum, and organic
content (according to % loss on ignition) have diminished over the ten years. Leaching of
aluminum from clay particles in sediments by the recent decrease in pH is likely.
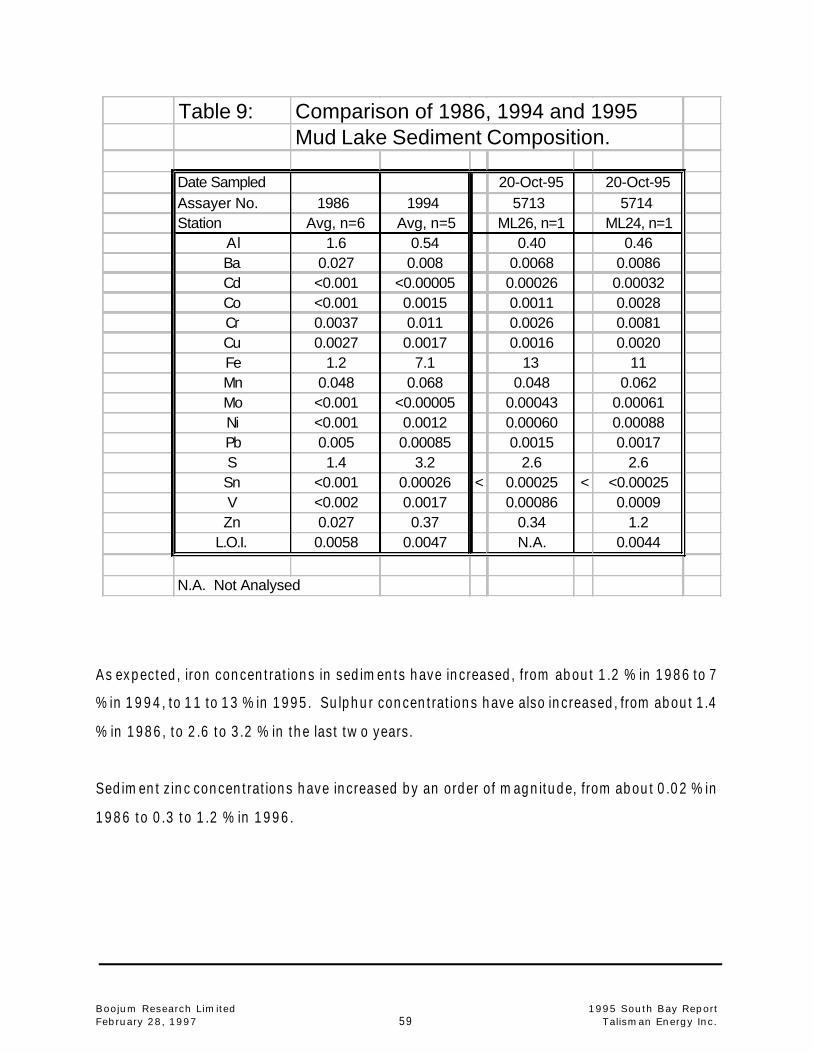
Boojum Research Limited 1995 South Bay ReportFebruary 28, 1997 Talisman Energy Inc.59
Table 9: Comparison of 1986, 1994 and 1995 Mud Lake Sediment Composition.
Date Sampled 20-Oct-95 20-Oct-95Assayer No. 1986 1994 5713 5714Station Avg, n=6 Avg, n=5 ML26, n=1 ML24, n=1
Al 1.6 0.54 0.40 0.46Ba 0.027 0.008 0.0068 0.0086Cd <0.001 <0.00005 0.00026 0.00032Co <0.001 0.0015 0.0011 0.0028Cr 0.0037 0.011 0.0026 0.0081Cu 0.0027 0.0017 0.0016 0.0020Fe 1.2 7.1 13 11Mn 0.048 0.068 0.048 0.062Mo <0.001 <0.00005 0.00043 0.00061Ni <0.001 0.0012 0.00060 0.00088Pb 0.005 0.00085 0.0015 0.0017S 1.4 3.2 2.6 2.6Sn <0.001 0.00026 < 0.00025 < <0.00025V <0.002 0.0017 0.00086 0.0009Zn 0.027 0.37 0.34 1.2
L.O.I. 0.0058 0.0047 N.A. 0.0044
N.A. Not Analysed
As expected, iron concentrations in sediments have increased, from about 1.2 % in 1986 to 7
% in 1994, to 11 to 13 % in 1995. Sulphur concentrations have also increased, from about 1.4
% in 1986, to 2.6 to 3.2 % in the last two years.
Sediment zinc concentrations have increased by an order of magnitude, from about 0.02 % in
1986 to 0.3 to 1.2 % in 1996.

Boojum Research Limited 1995 South Bay ReportFebruary 28, 1997 Talisman Energy Inc.60
5.55.5 Application of ARUM in Mud LakeApplication of ARUM in Mud Lake
The long-term nature of the zinc load leaving Mud Lake is of primary concern to the overall
health of the downstream aquatic ecosystems. A process which could serve as a long-term,
passive biological treatment system, ARUM (Acid Reduction Using Microbiology), is being
applied to the Mud Lake system for precipitation and storage of this zinc in Mud Lake. With
successful application, acidity and other elements' concentrations will also be reduced, and
effluents with a higher pH will discharge from Mud Lake.
ARUM is a sediment-based process in which chemical conditions are maintained that favour
the formation, and maintain stable conditions for the storage of, metal precipitates as
hydroxides, carbonates and sulphides. These chemical conditions are created by several
microbially-mediated reductive processes, including nitrate, iron and sulphate reduction, as
well as ammonification of nitrogen compounds. The microbial communities responsible for
accelerating these processes are dependent on a degradable organic carbon supply.
To date, Boojum initiates the ARUM process by the addition of waste materials containing
easily degradable organic carbon. This is followed by installation of floating vegetation covers,
which serve to eliminate wind driven circulation and oxygen of the water column, and supply
organic carbon for long term operation of the process.
In Table 10 the dimensions, operating parameters and overall performance of ARUM field
systems designed by Boojum are presented. Mud Lake water quality is in the range treated
at locations 1 and 2, characterized by higher acidities, metals and sulphate concentrations.

Table 10: ARUM Field Systems Dimensions, Operating Parameters and Overall Performance.
AMD Type
Location System Type
Surface Area
Volume Flow Retention
Acidity Iron Sulphate Metals
m2 m3 L.min-1 Days mg.L-1mg.L-1mg.L-1mg.L-1 mg.L-1 mg.L-1mg.L-1mg.L-1
Initial Final Initial Final Initial Final Initial Final
Ni Ni
Ni/CuCentral Ontario
#1
Cells Flow
Through
224 188 0.9 145 139 27.5 13 7.6 2400 450 15.3 0.8
Al Al
Coal Nova Scotia #2
Cells Diffuse
100 40 0.3 (a) 93 504 242 30 4.3 1213 920 23.5 12.7
Zn Zn
Zn/CuCentral
Newfoundland #3
Cells Stagna
nt12.5 34 - 151 (b) 57.5 <1 (c) (c) 202 27 23 0.7
Zn Zn
Zn/CuCentral
Newfoundland #4
Bog Diffuse
44 22 14.7 1 431 217 2.3 2 0.92 0.5 127 56
Ni Ni
As/NiNorthern
Saskatchewan #5
Cell Stagna
nt5.8 2.9 - 74 (b) (d) (d) 2.2 0.06 264 40 26 2.6
As As9.3 0.9Zn Zn
ZnMud Lake
ARUM Enclosure
Flow Throug
h4800 4800 36.6 91 364 ? 87 ? 660 ? 13.8 ?
(a) Estimated flow (b) Time to onset of treatment used to calculate removal(c) Metals not present in significant concentrations(d) < 10 mg.L-1 in seepage

Boojum Research Limited 1995 South Bay ReportFebruary 28, 1997 Talisman Energy Inc.62
5.5.15.5.1 SummarySummary ofof LaboratoryLaboratory ARUMARUM TreatabilityTreatability ExperimentExperiment
A laboratory experiment was carried out to determine whether ARUM can remove Zn and other
contaminants from Mud Lake water.
A preliminary experiment was carried out to determine what would happen to the ground
water in oxidising conditions. Such conditions will be present in the mixed surface waters of
Mud Lake. This experiment sought to determine whether, to what extent and at what rate Fe
oxidation and subsequent precipitation of Fe(OH)3 can occur.
This oxidation experiment determined that aeration of ground water entering Mud Lake (GD
trap water) at room temperature (similar to summer conditions in the field) results in oxidation,
hydrolysis and precipitation of Fe commencing at 88 h. From around 213 h, an equilibrium
between Fe2+ and Fe3+ is attained with no further net oxidation or removal of Fe from solution.
The oxidation rate was estimated as around 103 mg/m3/min and was little influenced by the
presence of a sediment. However, in the presence of sediment approximately 50 % of the Fe
and acidity in the water was removed in 27 days.
In cold room conditions, where the temperature (1-5oC) is similar to what would be
encountered within and just above sediments in the field in winter, oxidation did not occur
during the first 27 day period of observations with all Fe remaining in the Fe2+ state. However,
within 72 days, oxidation had commenced in jars with sediment and pH had declined to <3.
As at room temperature, 50 % of the acidity and Fe was removed by the sediment. The data
are presented in Table 11 together with all the other ARUM laboratory results obtained since
work on this process started.

Boojum Research Limited 1995 South Bay ReportFebruary 28, 1997 Talisman Energy Inc.63
Table 11: Acidity, Sulphate and Metal Removal in Reactors.
AMD Location Acidity Iron Sulfate MetalsType Removal Removal Removal Removal
g/m3/d g/m3/d g/m3/d g/m3/d
Cu/Ni Central NiOntario 2.5 0.8 8.6 0.2
U CentralOntario 5.3 2.5 7.1 (a)
Cu/Zn Northern ZnQuebec 8 3.1 12 1.2
Cu/Zn/Pb South ZnBay (22oC) 49 39 51 3.8
Cu/Zn/Pb South ZnBay (5oC) 11 5.5 18 0.8
U Northern Ni AsSaskatchewan 4.1 0.005 16 0.17 1.8
(a) Only low concentrations of metals in solution.
ARUM worked very well on ground water entering Mud Lake (GD trap water). Within 23 days
at room temperature, dissolved Zn concentration was reduced from >80
mg/L to <1 mg/L in reducing condition induced through addition of decomposable organic
matter (alfalfa or potato waste). With added alfalfa, some of the Zn remained in the suspended
solid fraction. This is potentially mobile. With potato waste, the Zn was almost totally removed
to the sediment. Therefore, potato waste is the amendment of choice. In cold room conditions,
and in the presence of an amendment and Mud Lake sediment, reducing conditions were
established in Mud Lake ground water within 54 days and Zn concentration reduced to 0.334
mg/L in the presence of potato waste.

Boojum Research Limited 1995 South Bay ReportFebruary 28, 1997 Talisman Energy Inc.64
5.5.25.5.2 Installation of ARUM EnclosureInstallation of ARUM Enclosure
In May, 1995, a crescent-shaped, 100 m long curtain was attached to a series of posts, driven
into the sediment, extending from two locations along the shore, enclosing a 0.48 ha area of
Mud Lake where contaminated ground water was observed emerging from the bottom of the
lake.
Some problems with the enclosure curtain were experienced, including lifting of the curtain
by high winds, and waves overtopping the curtain, when strong winds prevailed from the
south-west. In Plate 1 the curtain can be seen after installation, having developed a problem.
Due to the strong winds over Mud lake area, the posts driven into the sediment loosened and
had to be reinforced. The curtain was secured by September 1995.
An application of 800 kg of potato waste was distributed inside this enclosure for stimulation
of sediment microbial activity. The potato waste was distributed with the boat in the original
bags contained each about 20 pounds in July 1995. All potato waste purchased in 1994 was
transported to the site and stored on the concrete pad on the town site, for future application.
A total of 25 cattail rafts, each 6' by 12' in area, were installed as three strips over sections of
the enclosure, covering an area of 167 m2. However, this has left most of the surface area of
the ARUM enclosure exposed to wind-driven circulation of the water column. In Plate 2 the
initial construction of the rafts with the organic substrate is depicted and Plate 3 displays the
planted rafts installed in the enclosure.
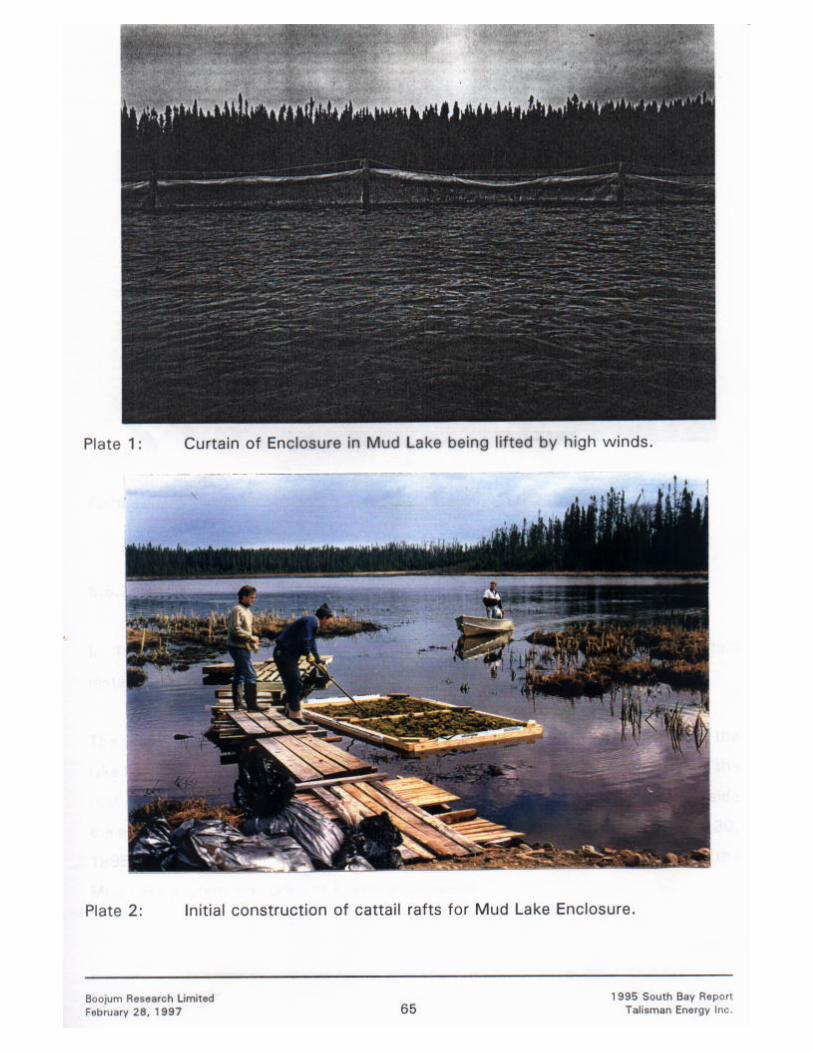

Boojum Research Limited 1995 South Bay ReportFebruary 28, 1997 Talisman Energy Inc.66
Plate 3: Planted rafts installed in the Mud Lake Enclosure.
5.5.3 Water Quality in the ARUM Enclosure
In Table 12, the water quality for the enclosure area before and after curtain installation
(ML27) and Mud Lake middle (MML) are provided.
The enclosure appears to be retaining contaminated ground water emerging from the
lake bottom within its perimeter, and preventing mixing of this ground water with the
rest of Mud Lake, as designed. A higher zinc concentration was determined inside the
enclosure (10.3 mg/L) than at MML (7.8 mg/L) on July 27, 1995. On October 30,
1995, the highest surface water zinc concentration (13.8 mg/L) ever measured in the
Mud Lake system was present in enclosure water.

Boojum Research Limited 1995 South Bay ReportFebruary 28, 1997 Talisman Energy Inc.67
Table 12: Mud Lake Outflow(ML18), Centre(MML) and Enclosure(ML27 after May, 1995) Chemistry,1986-1995.
Sample Zn pH Temp Acidity SO4 Fe Cond. EmLocation date mg/L Celcius mg/L mg/L mg/L uS/cm mV
Mud Lake EnclosureOpen ML27 SURFACE 11-Jul-94 2.8 22.7Open ML27 SURFACE 28-Aug-94 2.7 14.6Open ML27 SURFACE 01-May-95 5.5 13.7Open ML27 SURFACE 05-May-95 5.8 4.4 13.9 202 393 85 600 356Open ML27 SURFACE 07-May-95 3.6 11.8Open ML27 SURFACE 08-May-95 3.3 14.8Open ML27 SURFACE 10-May-95 3.1 15
Enclosed ML27 SURFACE 28-Jun-95 2.8 26Enclosed ML27 SURFACE 26-Jul-95 3.0 20.2Enclosed ML27 SURFACE 27-Jul-95 10.3 3.0 19.9 240 54 935 383Enclosed ML27 SURFACE 14-Aug-95 3.4 18.1Enclosed ML27 SURFACE 20-Oct-95 13.8 2.8 0.9 285 660 87 1480 285
Open ML27 BOTTOM 11-Jul-94 4.9 21.3Open ML27 BOTTOM 28-Aug-94 5.7 9.1
Enclosed ML27 BOTTOM 28-Jun-95 6.5 18Enclosed ML27 BOTTOM 26-Jul-95 6.0 18.8Enclosed ML27 BOTTOM 20-Oct-95 5.8 6
Mud Lake Middle date Zn pHMML SURFACE 17-Jun-86 0.02 7.6 nd 160 0.13 430MML SURFACE 25-Jul-86 0.03 6.2 nd 183 0.36 475MML SURFACE 30-Mar-94 9.8 3.2 304 834 79 1423 393MML SURFACE 27-Apr-94 1.7 4.2 17.1 79 188 19 406 272MML SURFACE 15-Jun-94 8.1 2.8 21.3 290 681 55 1450 660MML SURFACE 28-Aug-94 7.9 2.7 15.5 171 1482 27 700 384MML SURFACE 26-Feb-95 7.7 5.6 6.4 269 519 83 1043 42MML SURFACE 01-May-95 5.6 12.8MML SURFACE 05-May-95 4.9 4.7 13.5 185 366 77 769 330MML SURFACE 07-May-95 3.7 12.5MML SURFACE 08-May-95 3.5 14.2MML SURFACE 10-May-95 3.3 14.5MML SURFACE 28-Jun-95 2.8 24MML SURFACE 26-Jul-95 3.0 20.9MML SURFACE 27-Jul-95 7.8 3.0 20.9 207 53 925 431MML SURFACE 28-Sep-95 2.7 216 1530 540MML BOTTOM 30-Mar-94 12 5.3 600 1143 218 2200 333MML BOTTOM 27-Apr-94 8.0 5.1 17 379 954 168 1430 121MML BOTTOM 15-Jun-94 8.1 2.8 280 690 55 1455 662MML BOTTOM 15-Jun-94 2.8 21.2MML BOTTOM 28-Aug-94 5.6 281 1790 377MML BOTTOM 26-Jul-95 3.0 20.9

Boojum Research Limited 1995 South Bay ReportFebruary 28, 1997 Talisman Energy Inc.68
There is evidence that zinc concentrations were increasing in the enclosure. If, in fact,
concentrations remained the same or even decreased, then this would be evidence of effective
ARUM activity inside the enclosure. In Figure 16 zinc concentrations Mud Lake middle surface
and bottom (MML) and inside the enclosure (ML27) are plotted. Zinc concentrations at MML
were relatively constant in 1995, while there is some indication that enclosure zinc
concentrations were increasing.
In Figure 17, the expected zinc concentration in the enclosure is modelled, assuming a ground
water inflow of 0.61 L/s, containing 184 mg/L, and assumes no loss of zinc by dilution of the
enclosure water, except that water flowing out of the enclosure, or precipitation as zinc. This
graph shows that enclosure zinc concentrations should reach approximately 180 mg/L in 1996.
For 1995, measured zinc concentrations in the enclosure were increasing at a much lower rate
that expected from the modelled concentrations. This suggests, that the other factors are
affecting the zinc concentration which should be addressed and that likely the assumptions
are not justified. Most likely however this simple model approach is at best an approximation
`of what could be expected. In summary, to date the enclosure does not appear to work which
is not unexpected, given the conditions of the curtain and the cattail cover being incomplete.

Boojum Research Limited 1995 South Bay ReportFebruary 28, 1997 Talisman Energy Inc.69
Figure 16: Mud LakeMiddle (MML), Outflow (ML18) and Enclosure (ML27)
0
2
4
6
8
10
12
14
Aug-93 Mar-94 Sep-94 Apr-95 Oct-95
Date
[Zn]
, mg.
L-1
MML-s MML-b ML27
Figure 17: Mud Lake ARUM EnclosureMeasured [Zn] vs Expected [Zn]
02040
6080
100
120140160180
200
Apr-95 Jul-95 Oct-95 Feb-96 May-96 Aug-96
Date
[Zn
], m
g.L
-1
MML ENCL MODEL

Boojum Research Limited 1995 South Bay ReportFebruary 28, 1997 Talisman Energy Inc.70
5.5.45.5.4 Pore Water QualityPore Water Quality
As the sediment in the enclosure will accumulate significant amounts of iron and zinc, pore
water peepers, 0.5 m long plastic chambers containing distilled water and covered with a
semi-permeable membrane, were installed in enclosure sediments in July and recovered in
October, 1995. Their construction is displayed in Schematic 3. In Table 13 the general
chemistry and dissolved concentrations of zinc, sulphur and iron in the solutions recovered
from the porewater peepers are presented and compared to enclosure surface water chemistry
in October, 1995.
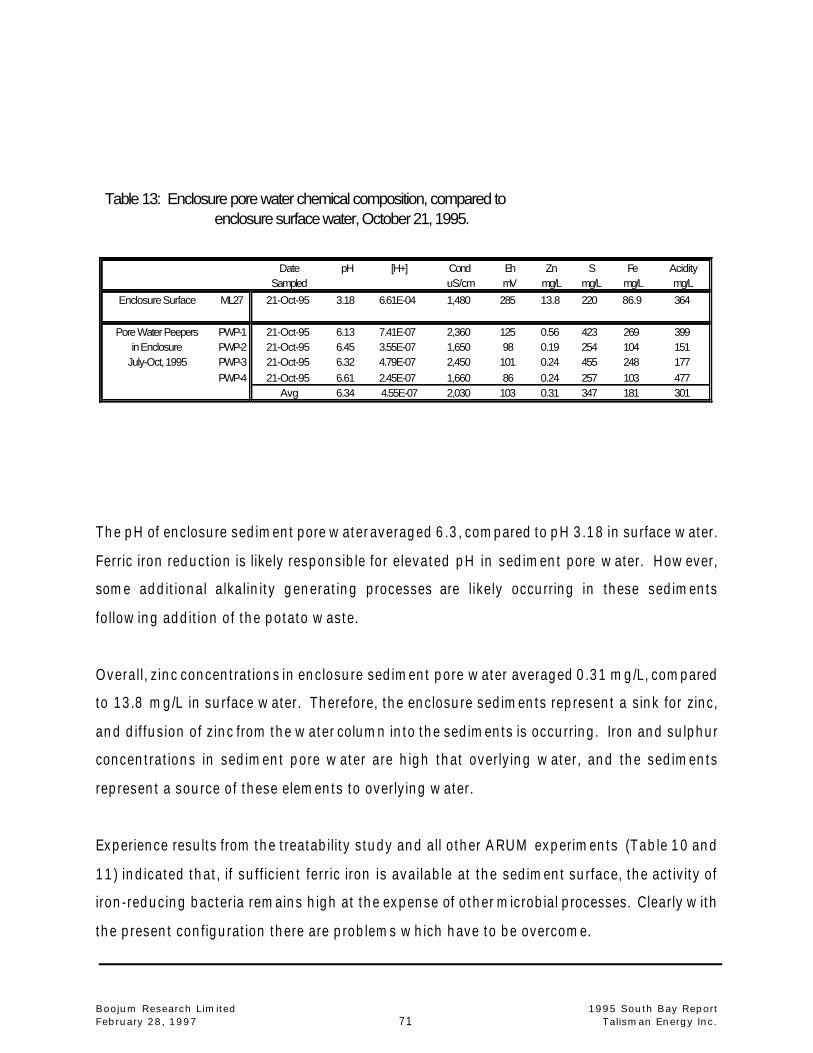
Boojum Research Limited 1995 South Bay ReportFebruary 28, 1997 Talisman Energy Inc.71
Table 13: Enclosure pore water chemical composition, compared to enclosure surface water, October 21, 1995.
Date pH [H+] Cond Eh Zn S Fe AciditySampled uS/cm mV mg/L mg/L mg/L mg/L
Enclosure Surface ML27 21-Oct-95 3.18 6.61E-04 1,480 285 13.8 220 86.9 364
Pore Water Peepers PWP-1 21-Oct-95 6.13 7.41E-07 2,360 125 0.56 423 269 399in Enclosure PWP-2 21-Oct-95 6.45 3.55E-07 1,650 98 0.19 254 104 151
July-Oct, 1995 PWP-3 21-Oct-95 6.32 4.79E-07 2,450 101 0.24 455 248 177PWP-4 21-Oct-95 6.61 2.45E-07 1,660 86 0.24 257 103 477
Avg 6.34 4.55E-07 2,030 103 0.31 347 181 301
The pH of enclosure sediment pore water averaged 6.3, compared to pH 3.18 in surface water.
Ferric iron reduction is likely responsible for elevated pH in sediment pore water. However,
some additional alkalinity generating processes are likely occurring in these sediments
following addition of the potato waste.
Overall, zinc concentrations in enclosure sediment pore water averaged 0.31 mg/L, compared
to 13.8 mg/L in surface water. Therefore, the enclosure sediments represent a sink for zinc,
and diffusion of zinc from the water column into the sediments is occurring. Iron and sulphur
concentrations in sediment pore water are high that overlying water, and the sediments
represent a source of these elements to overlying water.
Experience results from the treatability study and all other ARUM experiments (Table 10 and
11) indicated that, if sufficient ferric iron is available at the sediment surface, the activity of
iron-reducing bacteria remains high at the expense of other microbial processes. Clearly with
the present configuration there are problems which have to be overcome.

Boojum Research Limited 1995 South Bay ReportFebruary 28, 1997 Talisman Energy Inc.72
5.5.55.5.5 Possible Modifications to ARUM EnclosurePossible Modifications to ARUM Enclosure
Improvement of the enclosure curtain will be required in order to retain contaminated ground
water in the enclosure are for as long as possible for treatment.
Installation of a cover over the ARUM enclosure is required in order to prevent oxidation of
ferrous iron entering the enclosure area from contaminated ground water sources.
The floating cover should, ideally, be comprised of a floating vegetation mats, in order that a
long-term source of organic carbon is available to sediment microbial communities.
All sediments in Mud Lake contain some organic carbon which should assist in the removal of
zinc. Presently, a relatively large volume of fresh water run-off enters Mud Lake, reducing its
overall retention time. Options for diverting fresh water run-off around Mud Lake should be
examined.

Boojum Research Limited 1995 South Bay ReportFebruary 28, 1997 Talisman Energy Inc.73
Figure 18: Boomerang LakeHistorical Annual Average pH, [Zn], [Acidity]
0
2
4
6
8
10
12
14
16
18
1971
1974
1977
1980
1983
1986
1989
1992
1995
Year
Ann
ual A
vera
gepH
; [Zn
], m
g.L
-1
pH Zn Acidity
P e r i o d i c
Liming
B R D
D i v e r s i o n
6.06.0 BOOMERANGBOOMERANG LAKE:LAKE: EXISTINGEXISTING CONDITIONSCONDITIONS AND THE AND THE
APPLICATION OF PHOSPHATE ROCKAPPLICATION OF PHOSPHATE ROCK
6.16.1 A Brief History of the Boomerang Lake Drainage BasinA Brief History of the Boomerang Lake Drainage Basin
The Boomerang Lake drainage basin has historically received run-off from the mine site,
including Mill Pond and Backfill Raise Ditch, seepage from the east and west tailings dams,
and some run-off from the Tailings Diversion Ditch. The Boomerang Lake drainage basin also
collects clean run-off from areas to the north and east.
Boomerang Lake is the recipient of all surface and seepage water from these various sources.
Historically, annual average pH decreases were first noted in 1977 (Figure 18), and zinc
concentrations began to climb in 1978. Acidity remained less than 10 mg/L (CaCO3
equivalent) up to 1984. Thereafter, acidity measurements were consistently climbing.

Boojum Research Limited 1995 South Bay ReportFebruary 28, 1997 Talisman Energy Inc.74
Lime was periodically added to Boomerang Lake to precipitate zinc and maintain neutral pH.
Following cessation of liming, the pH of Boomerang Lake steadily declined to level out at pH
3 to 4, the acidity has increased to as high as 90 mg/L, and annual average zinc concentration
reached 17 mg/L in 1995 (Figure 18). The steep increase in annual average zinc
concentrations between 1992 and 1995 is due to diversion of Backfill Raise Ditch water,
containing Backfill Raise Cap and Warehouse Seep waters, to Boomerang Lake following
excavation of a deep ditch.
Remedial measures have been taken since 1990 to reduce zinc concentrations in Boomerang
Lake. Substrate has been placed in Boomerang Lake to support Biological Polishing for zinc
removal. Phosphate rock applications have been mad to precipitate iron as ferric phosphate,
in order to reduce iron cycling and acidity regeneration in the lake.
6.26.2 Water Balance for Boomerang Lake Drainage BasinWater Balance for Boomerang Lake Drainage Basin
In order to assess the contributions of the various sources of contaminants to Boomerang Lake,
the annual water volumes of, and contaminants concentrations in, these sources to Boomerang
Lake have been estimated. Periodic field measures of flow have been performed in order to
verify some of the hydrological estimates and assumptions.
In Table 14, hydrological estimates of flows from the various sources of water and
contaminants are provided for comparison with flow measurements. Generally, estimated base
flows, in L/s (R.O. van Everdingen), fall within the range of measured flow data collected to
date, for those sources where measurements were possible.
Since the volume of Boomerang Lake is approximately 1,000,000 m3, and the volume of water
discharged from Boomerang Lake is approximately 344,000 m3, the retention time of water in
Boomerang Lake in approximately 3 years.

Boojum Research Limited 1995 South Bay ReportFebruary 28, 1997 Talisman Energy Inc.75
Run-off and seepage water reports to Boomerang Lake from five major areas (Table 14):
- Clean run-off from surrounding forested areas (6.1 L/s).
- East and West Tailings Dam seepage (0.04 L/s)
- Tailings Diversion Ditch (0.3 L/s)
- Backfill Raise Ditch, including BRC and WHS (1.1 L/s)
- Mill Pond area (2.1 L/s)
In addition, direct precipitation onto the surface of Boomerang Lake contributes 41,265 m3/yr-,
equivalent to 1.3 L/s. Collectively, run-off from these five areas, plus direct precipitation onto
Boomerang Lake, amounts to 10.9 L/s. Between 1993 and 1995, flow measures at Boomerang
Lake outflow have ranged from 2.6 to 61 L/s (Table 14).

Table 14: Water Balance for Boomerang Lake Drainage Basin, 1992 - 1995.
Tailings Seepage (EDS,WDS) Clean Run-off1,200 m3/yr, ROVE 192,648 m3/yr, ROVE0.04 = L/s 6.1 =L/s OUTFLOW0.01 L/s 12-Sep-93 343,603 m3/yr, ROVE0.04 L/s 09-Oct-93 10.9 =L/s
0.004 L/s 31-Aug-94 61.2 L/s 12-Sep-93Boomerang Lake Run-off (lake area only) 9.6 L/s 09-Oct-93
Tailings Ditch/Pol Pond (TDD) 41,265 m3/yr, ROVE 2.56 L/s 18-Jun-948,176 m3/yr,ROVE 11.7 L/s 29-Aug-94
0.3 =L/s 3.6 L/s 12-May-95
0.04 L/s 12-Sep-93
0.08 L/s 09-Oct-93
0.027 L/s 31-Aug-94
BRC Ditch Backfill Raise Ditch (BR2.5) Mill Pond34,788 m3/yr, ROVE 65,526 m3/yr,ROVE Upper Dam
0.052 L/s 29-Aug-94 1.1 =L/s 2.1 =L/s 1.408 L/s 29-Aug-941.8 L/s 11-Apr-93 0.06 L/s 16-Jul-92
Warehouse Seep 0.5/1 L/s 16-Jun-93 0.13 L/s 07-Sep-930.27 L/s 09-Oct-93 0.72 L/s 07-Sep-93 1.2 L/s 12-Sep-93
0.163 L/s 18-Jun-94 1.04 L/s 09-Oct-93 0.07 L/s 09-Oct-93 Dave's Dam0.35 L/s 13-Jul-94 0.675 L/s 18-Jun-94 0.075 L/s 18-Jun-94 0.004 L/s 09-Oct-930.32 L/s 29-Aug-94 1.047 L/s 14-Jul-94 0.139 L/s 14-Jul-94 1.64 L/s 29-Aug-940.13 L/s 12-May-95 1.375 L/s 29-Aug-94 0.32 L/s 29-Aug-940.40 L/s 26-Jul-95 0.90 L/s 12-May-95 0.02 L/s 12-May-950.25 L/s 14-Aug-95 1.48 L/s 26-Jul-95 1.41 L/s 26-Jul-95
0.97 L/s 14-Aug-95 0.09 L/s 14-Aug-95

Boojum Research Limited 1995 South Bay ReportFebruary 28, 1997 Talisman Energy Inc.77
6.36.3 ContamiContaminn antant SourcesSources inin thethe BoomerangBoomerang LakeLake DrainageDrainage
BasinBasin
Direct measurement of flow volumes and water quality for some sources of water in the
Boomerang Lake drainage basin is possible, while for other sources, both these parameters
must be based on indirect evidence, such as piezometer and seepage water quality. Direct
measurements have been made for the Backfill Raise Ditch and Mill Pond outflow path, and
contaminants carried in these flows paths are known to enter Boomerang Lake. However,
Tailings Dam seepage, Tailings Diversion Ditch water and clean run-off have not been directly
measured in most cases.
There is visual evidence of seepage from the East and West Tailings Dams emerging below
water in Boomerang Lake. A minor seepage can periodically be sampled at the base of the East
Dam.
In Table 15, annual average East Dam pH, and zinc, iron, sulphate and acidity concentrations
have been summarized for all years when data is available (1987, 1988, 1992 - 1994). The
pH of seepages and piezometer was is typically high since these solutions are likely still
reduced, as indicated by high iron concentrations. The average annual zinc concentration has
reached 192 mg/L, while acidity may average as high as 1,476 mg/L.
For assessing West Dam seepage, only single samples of piezometer M47 water were collected
for the years 1987, 1988, 1990 and 1992 (Table 16). The solutions have consistently
contained high zinc (73 to 219 mg/L) and iron (290 to 2300 mg/L) concentrations.

Boojum Research Limited 1995 South Bay ReportFebruary 28, 1997 Talisman Energy Inc.78
Table 15: East Dam Seepage, M8 and M47 Long Term Water Chemistry, 1985 - 1995.
pH Zn, mg/L Fe, mg/L Sulphate, mg/L Acidity, mg/L CaCO3 equiv.Year avg max min avg max min avg max min avg max min avg max min
1985
1986
1987 6.4 3.8 3.0 663n=1
1988 5.7 6.6 5.4 192 382 2.0 156 311 0.01 2549 4566 531n=2
1989
1990
1991
1992 6.7 1.0 1.0 264 50n=1
1993 5.3 5.5 5.1 118 139 98 885 1030 739 2204 2541 1866 1476 1904 1048n=2
1994 4.9 4.9 4.9 151 180 121 1315 1420 1210 3066 3600 2532 1275 2335 215n=2
1995
Table 16: West Dam M47 Long Term Water Chemistry, 1987 - 1995.
pH Zn, mg/L Fe, mg/L Sulphate, mg/L Acidity, mg/L CaCO 3 equiv.Year1987 5.2 143 290 3855n=1
1988 6.1 219 311 5841n=1
1989
1990 5.2 73 615 2742n=1
1991
1992 5.3 174 2300 6180 3975n=1
1993
1994
1995

Boojum Research Limited 1995 South Bay ReportFebruary 28, 1997 Talisman Energy Inc.79
Table 17: Tailings Diversion Ditch (TDD) Long Term Water Chemistry, 1987 - 1995.
pH Zn, mg/L Fe, mg/L Sulphate, mg/L Acidity, mg/L CaCO3 equiv.Year Avg Max Min Avg Max Min Avg Max Min Avg Max Min Avg Max Min1987 6.0 6.8 5.6 2.8 10 0.01 13 79 0.01 397 723 33n=7 (n=6)
1988 4.7 7.2 3.7 4.2 35 0.01 0.16 0.80 0.01 347 672 69n=9
1989 5.4 8.8 5.1 5.1 10 0.20 11 14 7.8 260 312 207n=2
1990 4.5 5.9 4.2 65 128 2.7 15 29 0.50 686 1140 231n=2
1991 6.3 6.7 6.1 2.3 2.5 2.0 0.85 1.0 0.70 119 144 95 28 30 25n=2
1992 3.4 6.4 3.0 13 31 0.61 804 2410 0.10 2785 5400 171 2564 5105 23n=3 (n=2) (n=2)
1993 3.1 5.6 2.8 8.4 13 0.27 526 791 5.3 1472 2169 95 1272 2547 6.9n=3
1994 3.0 14 834 2292 1902n=1
1995
Seepages emerging from the walls of the Tailings Diversion Ditch can, at times, collectively
generate a small stream. The quality of this stream was periodically measured between 1987
and 1994 (Table 17). Annual average zinc concentrations have been as high as 65 mg/L
(1990), but are typically less than 15 mg/L. There is some indication that iron, sulphate and
acidity concentrations have been increasing with time, generally reaching maxima in 1994.
Between 1987 and 1992, Backfill Raise Ditch was basically a shallow depression directing
some surface run-off from the mine and mill area to Boomerang Lake. Surface water overlying
Backfill Raise Cap and the Warehouse seep area drained to Confederation Lake. In 1993, the
Backfill Raise Ditch was deepened in order to direct all Backfill Raise Cap and Warehouse seep
water, as well as BR13 water, towards Boomerang Lake and away from Confederation Lake.
Since the deepening of the ditch and excavation of the Backfill Raise Cap and Warehouse Seep
area in 1993, year-round flow is present in the ditch.

Boojum Research Limited 1995 South Bay ReportFebruary 28, 1997 Talisman Energy Inc.80
In Table 18, annual average pH and zinc, iron, sulphate and acidity concentrations for Backfill
Raise are presented. Since deepening of the ditch in 1993, the pH is consistently low (3.1),
and zinc, sulphate and acidity generally higher than in the previous years.
The current zinc concentration in the ditch is approximately 240 mg/L , while the iron, sulphate
and acidity concentrations are approximately 60, 2000, and 860 mg/L, respectively.
Since mining commenced, Mill Pond has always received run-off from the mine and mill site,
including the old concentrate storage pads. Subsequently, Mill pond water and sediments
contain high concentrations of copper and zinc.
Annual average zinc concentrations have historically been as high as 1,012 mg/L (Table 19).
There is some indication that zinc concentrations in Mill Pond Outflow water are diminishing
with time, and the 1995 annual average zinc concentration was 139 mg/L.
The pH of Mill Pond outflow water has remained around pH 3.5 over the past five years. Since
the pH is above pH 3.0, dissolved iron concentrations have remained below 28 mg/L, and in
1995 averaged only 7.8 mg/L.
Deepening of the Backfill Raise ditch was performed in order to reduce the amount of shallow
ground water moving from the mine and mill area towards Confederation Lake through waste
rock in the vicinity. Flow and water quality at the Portal Raise Seep (PRS), periodically
monitored (Table 20) since 1992, indicate that seepage flows are generally diminished, and
zinc, iron, copper, sulphate and acidity concentrations have also diminished.

Boojum Research Limited 1995 South Bay ReportFebruary 28, 1997 Talisman Energy Inc.81
Table 18: Backfill Raise Ditch (BR2.5) Long Term Water Chemistry, 1987 - 1995.
pH Zn, mg/L Fe, mg/L Sulphate, mg/L Acidity, mg/L CaCO3 equiv.Year Avg Max Min Avg Max Min Avg Max Min Avg Max Min Avg Max Min
1987 6.3 0.13 0.40 0.01 0.91 3.5 0.01 80 129 24n=4 (n=1)
1988 2.2 3.6 0.70 0.40 0.70 0.10 75 108 42n=2
1989 3.0 20 72 507n=1
1990 4.2 128 29n=1
1991 3.1 3.7 3.0 170 295 39 33 47 21 1209 2067 435 574 600 556n=5 (n=3)
1992 3.4 3.9 3.1 13 19 6.9 28 52 2.9 311 474 148 206 340 73n=2
1993 3.7 4.3 3.4 256 288 213 15 22 1.9 1598 1863 1281 795 1128 578n=3
1994 3.1 3.4 2.8 309 362 268 41 58 20 2054 2343 1749 898 1014 840n=4
1995 3.1 237 60 861n=1

Boojum Research Limited 1995 South Bay ReportFebruary 28, 1997 Talisman Energy Inc.82
Table 19: Mill Pond Outflow (MPO) Long Term Water Chemistry, 1987 - 1995.
pH Zn, mg/L Fe, mg/L Sulphate, mg/L Acidity, mg/L CaCO3 equiv.Year Avg Max Min Avg Max Min Avg Max Min Avg Max Min Avg Max Min
1977 7.0 7.1 6.9 21 40 0.30 0.60 1.8 0.09n=5
1978 4.4 6.8 3.8 259 794 63 14 50 1.3n=4
1979 6.0 42 1.5n=1
1980 3.6 1012 5.0n=1
1981
1982 4.8 6.1 4.2 197 710 14 39 150 0.04 2665 1398n=4 n=1 n=1
1983 3.8 280 65 2100 842n=1
1984 3.5 3.7 3.3 510 620 330 47 49 45 2428 2456 2400 1102 1388 815n=2 (n=3) (n=3)
1985 6.8 517 51n=1
1986 4.3 6.0 3.8 223 406 118 9 78 0.01 1230 1866 657n=12 (n=6)1987 4.6 6.5 3.9 176 503 74 17 87 0.01 1107 2892 381n=8 (n=7)
1988 3.0 7.2 2.7 271 876 0.30 41 164 0.01 1901 4098 39n=4 (n=2)
1989 3.3 4.9 2.9 267 463 112 34 72 3.9 1832 3504 705 1304n=3 n=1
1990 2.7 3.7 2.4 264 320 175 22 48 4.4 1489 1566 1386 800n=3 (n=1)
1991 3.3 4.1 3.1 234 320 107 28 51 10 1353 1815 714 444 817 133n=6
1992 3.5 4.7 3.2 281 383 191 23 84 2.8 1394 1911 1107 583 765 430n=9 (n=7) (n=6)
1993 3.3 3.7 3.1 158 188 128 11 20 3.1 1067 1299 816 543 629 439n=3
1994 3.6 4.9 3.1 89 152 34 5.2 9.5 2.5 673 987 294 222 392 87n=7
1995 3.4 3.6 3.2 139 146 132 7.8 11 4.6 1079 1134 1023 435 474 395n=2

Boojum Research Limited 1995 South Bay ReportFebruary 28, 1997 Talisman Energy Inc.83
Table 20: Chemistry of Sampling Location PRS, Mine Site
Year Date Assay. ConcentrationsNo. Cu Zn Fe Pb pH Ni Acidity Alkalinity Sulfate Flow
mg/L mg/L mg/L mg/L mg/L mg/L mg/L mg/L L/s1992 Average 5.5 53 1.5 0.52 4.1 0.51 103 20 428 0.41
1993 Average 2.7 111 4.7 0.025 5.7 0.08 209 2.6 992 0.031994 Average 7.3 133 7.1 0.07 5.7 0.06 279 863 0.011995 1.4 32 0.27 0.038 5.1 0.01 105 269 NR
1992 13-Jul 3868 1.5 46 < 1.0 < 1 5.6 < 1.00 53 15 459 0.0416-Jul 3877 20 122 3.7 < 1 3.5 < 1.00 264 525 1.5
14-Aug 4038 0.6 22 0.2 < 0.025 5.6 0.01 49 299 0.0616-Oct 4218 0.32 23 0.95 0.037 6.0 0.01 44 25 0.08
1993 11-Apr 19 0.31 5.8 82 0.0516-Jun 5.8 44 0.0507-Sep 4565 1.7 137 7.2 0.025 5.6 0.08 293 2.6 936 0.0109-Oct 4592 3.6 176 6.7 << 0.025 5.7 0.08 419 1047 0.02
1994 28-Mar No flow28-Apr 11 186 4.5 0.025 5.1 0.07 400 1.0 1071 NR18-Jun 2.3 89 5.7 0.025 5.4 0.05 58 5.6 648 0.00711-Jul 8.5 180 8.2 0.05 4.4 0.08 410 1167 0.023
30-Aug 6.9 76 10.0 0.17 4.3 0.04 246 567 0.020
1995 20-Mar 5397 1.4 32 0.27 0.038 5.1 0.01 105 269 NR
The long term water quality of Boomerang Lake is presented in Table 21, which includes
annual average pH and zinc, iron, aluminum, sulphate and acidity concentrations between
1971 and 1995.
Over the last six years (1990 - 1995), the pH has remained relatively constant at about pH 3.3 -
3.5. However, zinc concentrations have more than doubled, from 7.4 mg/L in 1990 to 17.2
mg/L in 1995. Sulphate concentrations have also gradually increased, from 200 mg/L in 1990
to current levels of 300 mg/L. A minor trend of increasing aluminum concentrations is also
noted for these years, while iron concentrations are variable. Despite increasing concentrations
of zinc, sulphate and aluminum, a trend of increasing acidity is not apparent from the annual
averages between 1990 and 1996 (Table 21).

Boojum Research Limited 1995 South Bay ReportFebruary 28, 1997 Talisman Energy Inc.84
Table 21: Boomerang Lake Long Term Water Chemistry, 1971 - 1995.
pH Zn, mg/L Fe, mg/L Al, mg/L Sulphate, mg/L Acidity, mg/L CaCO3 equiv.Year Avg Max Min Avg Max Min Avg Max Min Avg Max Min Avg Max Min Avg Max Min1971 7.2 7.5 6.9 0.15 0.45 0.02 0.63 2.1 0.09 5.8 8.0 5.0n=9 (n=7) (n=5)
1972 7.1 7.6 6.6 0.03 0.07 0.02 0.19 0.50 0.03 15 22 6.0 3.6 6.0 1.0n=10 (n=9) (n=8) (n=8) (n=8)1973 7.4 7.6 7.1 0.04 0.07 0.02 0.15 0.36 0.03 18 22 10.0 3.0 4.0 2.0n=6 (n=5) (n=5) (n=4) (n=4)
1974 7.0 7.9 6.6 0.17 0.64 0.00 0.94 5.7 0.10 30 36 25 2.0 2.0 2.0n=13 (n=10) (n=10) (n=4) (n=4)1975 6.4 7.8 6.0 0.55 1.44 0.06 0.74 3.0 0.09 38 43 30 2.0 2.0 2.0n=8 (n=7) (n=7) (n=3) (n=2)
1976 7.2 8.3 7.0 0.38 1.14 0.05 0.20 0.46 0.05 40 50 20 2.0 2.0 2.0n=11 (n=10) (n=10) (n=4) (n=3)1977 4.8 8.1 3.4 0.31 1.49 0.04 0.35 3.1 0.01 63 64 62 1.8 2.0 1.0n=41 (n=3) (n=4)1978 6.4 7.9 5.2 2.4 5.1 0.08 0.45 2.9 0.01 108 267 68 2.0 2.0 2.0n=63 (n=62) (n=7) (n=2)1979 4.5 7.2 3.2 3.6 5.5 0.58 0.56 2.6 0.01 90 135 31 2.0 2.0 2.0n=58 (n=59) (n=4) (n=2)
1980 6.2 6.9 5.9 4.7 6.0 2.5 1.4 8.7 0.01n=241981 6.3 7.5 5.5 4.1 7.3 0.10 1.2 2.2 0.01 148 153 143 6.0 6.0 6.0n=24 (n=2) (n=2)1982 6.2 6.9 5.7 0.1 0.3 0.01 0.16 0.56 0.01n=5
1983 6.7 7.1 6.6 1.5 3.4 0.03 0.91 1.9 0.05 166 7.0n=10 (n=1) (n=1)1984 6.2 7.7 5.4 3.5 4.5 0.68 1.8 2.8 0.19 168 171 164 8.5 9.0 8.0n=9 (n=2) (n=2)
1985 7.0 7.2 6.8 3.5 6.1 0.33 0.93 1.5 0.07n=6 (n=2)
1986 4.3 5.4 4.1 8.4 9.4 6.9 1.2 2.0 0.50 169 183 150n=56 (n=48) (n=28)1987 4.3 5.4 3.8 6.7 9.3 0.01 3.2 62 0.01 1.4 2.9 0.60 226 744 57n=40 (n=35) (n=3) (n=28)1988 3.9 4.9 3.5 7.5 10.0 5.8 0.76 6.6 0.01 0.53 0.70 0.30 218 303 183n=22 (n=21) (n=20)1989 3.8 4.7 3.6 5.0 7.7 0.07 1.9 8.9 0.50 1.0 1.1 0.90 188 255 72 43n=7 (n=8) (n=3) (n=7) (n=1)
1990 3.5 3.6 3.5 7.4 8.7 5.2 0.53 0.80 0.40 1.3 1.3 1.2 202 228 168 150n=3 (n=2) (n=2) (n=1)
1991 3.4 3.8 3.2 7.1 10.8 0.8 1.73 4.5 0.50 1.6 3.0 0.11 232 285 31 67 120 22n=16 (n=14) (n=3) (n=15)1992 3.5 3.8 3.0 8.0 9.3 6.7 1.66 3.0 1.00 2.1 2.6 1.5 228 294 203 54 75 43n=15 (n=4) (n=12) (n=11)1993 3.3 3.6 3.1 9.5 10.2 8.7 2.7 8.3 1.4 1.8 2.0 1.7 251 265 236 77 130 39n=14 (n=7)1994 3.3 3.6 3.1 13.3 17.7 11.1 3.3 13.9 2.0 2.2 2.9 1.9 304 339 280 89 104 77n=161995 3.4 4.9 2.9 17.2 19.2 13.9 1.4 3.6 0.30 3.0 3.5 2.5 304 327 290 80 100 57n=10 (n=9)

Boojum Research Limited 1995 South Bay ReportFebruary 28, 1997 Talisman Energy Inc.85
TThe absence of a trend of increasing acidity may be related to the additions of phosphate rock
performed in 1993, 1994 and 1995. This is further discussed in section below.
6.46.4 Contaminant Loads To Boomerang LakeContaminant Loads To Boomerang Lake
The annual average concentrations of iron, zinc and sulphate in major drainage paths to
Boomerang Lake, presented in Tables 15 through 21, and the estimated flows from these
drainage paths, presented in Table 14, can be used to estimate contaminant loads from these
various sources.
In Table 22a, the estimated annual iron loads from the Mill Pond area, Backfill Raise Ditch,
Tailings Diversion Ditch, the East and West Dams and fresh water run-off are presented for the
years 1987 to 1995. Estimated loads for the first six months are presented separately from the
second 6 months of 1995, since phosphate rock was added in June of 1995. These iron loads
from various sources are summed in the column "Sum of Fe Input to B.L., t/yr". The same type
of estimates are presented for zinc (Table 22b) and sulphate (Table 22c).
Annual average iron, zinc and sulphate concentrations measured in Boomerang Lake are
presented in these tables for comparison to estimated concentrations, based on a simple model
incorporating the estimated iron input from various sources to Boomerang Lake, the mass of
iron in Boomerang Lake, and the annual loss of iron in effluent from Boomerang Lake. Based
on the measured and estimated annual average concentrations, percent removal of iron, zinc
and sulphate are presented in the last column of each table.

Boojum Research Limited 1995 South Bay ReportFebruary 28, 1997 Talisman Energy Inc.86
Table 22a: Iron loadings to, and removal by Boomerang Lake, 1987 - 1995.
MPO BRD TDD EDS WDS Fresh Fe Input Boom. L. Boom. L. Boom. L. YEAR [Fe] [Fe] [Fe] [Fe] [Fe] [Fe] B. L. Meas. Est Est
g/m3 g/m3 g/m3 g/m3 g/m3 g/m3 t/yr [Fe], mg/L [Fe], mg/L Fe Rem,%1987 17 0.9 13 3.0 PZ 290 PZ 0.1 1.5 3.21988 41 0.4 0.2 156 PZ 311 PZ 0.1 3.1 0.8 1.5 51%1989 34 72 11 53 A v g 879 A v g 0.1 5.6 1.9 3.1 38%1990 22 29 15 53 A v g 615 PZ 0.1 3.2 0.5 5.6 91%1991 28 33 0.9 53 A v g 879 A v g 0.1 3.8 1.7 3.2 46%1992 23 28 804 1.0 PZ 2300 PZ 0.1 11 1.7 3.8 56%1993 11 15 526 885 Seep 879 avg 0.1 6.6 2.7 11.1 76%1994 5.2 41 834 1315 PZ 879 avg 0.1 9.8 3.3 6.6 50%1995 7.8 60 275 A v g 369 A v g 879 avg 0.1 5.8 1.4 9.8 85%1995 1 s t 6 mo 7.8 60 275 369 879 avg 0.1 2.9 t / 6 mo 2.1 9.8 78%
2cd 6 mo 7.8 60 275 369 879 avg 0.1 2.9 t / 6 mo 0.7 9.8 92%5.6 t/yr Avg Removal/yr 62%
Table 22b: Zinc loadings to, and removal by Boomerang Lake, 1987 - 1995.
MPO BRD TDD EDS WDS FreshZinc Input Boom. L. Boom. L. Boom. L. YEAR [Zn] [Zn] [Zn] [Zn] [Zn] [Zn] Boom. L. Meas. Est. Est
g/m3 g/m3 g/m3 g/m3 Data* g/m3 Data** g/m3 t/yr [Zn], mg/L [Zn], mg/L Zn Rem,%1987 176 0 2.8 3.8 PZ 143 PZ 0.01 12 6.71988 271 2 4.2 192 PZ 219 PZ 0.01 18 7.5 12 36%1989 267 20 5.1 73 A v g 152 A v g 0.01 18 5.0 18 73%1990 264 128 65 73 A v g 73 PZ 0.01 22 7.4 18 60%1991 234 170 2.3 73 A v g 152 A v g 0.01 21 7.1 22 69%1992 281 13 13 1.0 PZ 174 PZ 0.01 19 8.0 21 62%1993 158 256 8.4 118 Seep 152 avg 0.01 19 10 19 50%1994 89 309 14 151 Seep 152 avg 0.01 17 13 19 32%1995 139 237 14 A v g 87 A v g 152 avg 0.01 18 17 17 -2%1995 1 s t 6 mo 139 237 14 87 152 0.01 8.8 18 17 -8%
2cd 6 mo 139 237 14 87 152 0.01 8.8 16 17 5%18 t/yr Avg Removal/yr 47%
* PZ, M8, M44 piezometer data; Avg, average of piezometer data; Seep at B.L. shore.** PZ, M47 piezometer data; Avg, average of piezometer data.
Table 22c: Sulphate loadings to, and removal by Boomerang Lake, 1987 - 1995.
MPO BRD TDD EDS WDS FreshSO4 Input Boom. L. Boom. L. Boom. L. YEAR [SO4] [SO4] [SO4] [SO4] [SO4] [SO4] Boom. L. Meas. Est Est.
g/m3 g/m3 g/m3 g/m3 g/m3 g/m3 t/yr [SO4], mg/L [SO4], mg/L SO4 Rem,%
1987 1107 80 397 663 PZ 3855 PZ 0.1 82 2261988 1901 75 347 2549 PZ 5841 PZ 0.1 136 218 83 -162%1989 1832 507 260 1159 A v g 4655 A v g 0.1 144 188 137 -37%1990 1489 858 686 1159 A v g 2742 PZ 0.1 136 202 145 -39%1991 1353 1209 119 1159 A v g 4655 A v g 0.1 136 232 136 -70%1992 1084 311 2785 264 PZ 6180 PZ 0.1 110 228 137 -66%1993 1067 1598 1472 2204 Seep 4655 avg 0.1 142 251 112 -124%1994 673 2054 2292 3066 Seep 4655 avg 0.1 139 304 144 -112%1995 1079 837 1045 avg 1749 A v g 4655 avg 0.1 113 304 141 -116%1995 1 s t 6 mo 1079 837 1045 1749 A v g 4655 avg 0.1 57 312 141 -121%
2cd 6 mo 1079 837 1045 1749 A v g 4655 avg 0.1 57 296 141 -110%127 t/yr Avg Removal/yr -91%
m3/yrMPO Mill Pond Outflow 65526BRD Backfill Raise Ditch 34788TDD Tailings Diversion Ditch 8176EDS East Dam Seepage 300WDS West Dam Seepage 900Fresh Fresh Water Run-off 192648

Boojum Research Limited 1995 South Bay ReportFebruary 28, 1997 Talisman Energy Inc.87
It is estimated that, on average (1987 - 1995), 5.6 t of iron enter Boomerang Lake each year
from the various sources. Higher annual iron loads from 1992 to 1995 (5.8 to 11 t/yr-) are due
to larger contributions by the Tailings Diversion Ditch and Backfill Raise Ditch.
Higher iron concentrations in Boomerang Lake would be expected if iron entering Boomerang
Lake were to remain in solution. It appears that, annually, 47 to 92% (1987 - 1995) of the iron
entering Boomerang Lake is precipitated as iron hydroxides and remains in Boomerang Lake.
According to zinc load estimates from the various sources, about 18 t of zinc enter Boomerang
Lake each year (1987 to 1995), ranging from 12 to 22 t/yr- over this period. However, between
1987 and 1992, measured annual average zinc concentrations were only 5 to 8 mg/L, but have
since steadily increased to 17 mg/L. The relatively constant load, but recent increase in
measured Boomerang Lake zinc concentrations, indicates that the zinc source and/or
attenuation of the zinc load prior to reaching Boomerang Lake has changed since 1993.
Deepening of the Backfill Raise Ditch, and exposure and drainage from the Backfill Raise Cap
and Warehouse seepages, have created a large zinc load which reports directly to Boomerang
Lake. This change in hydrology and subsequent zinc load more than off sets the diminishing
zinc load from the Mill Pond area. Furthermore, zinc moving in run-off from Mill Pond resides
in a series of ponds prior to discharge to Boomerang Lake, in contrast to Backfill raise Ditch
drainage, which drains to Boomerang Lake in a matter of hours. Biological Polishing processes
in the series of pond receiving Mill Pond outflow may be a more significant process than
previously anticipated.
The annual zinc removal estimates for the years between 1987 and 1994 (48 to 78% removal)
indicate that there was a net loss of zinc in the Boomerang Lake drainage basin. However, in
1995, it appears that a smaller percentage of the higher zinc load to Boomerang Lake is being
removed (33 %). Backfill Raise Ditch directs 8 t (1995) of dissolved zinc each year to
Boomerang Lake, since no opportunity for zinc removal, such as by adsorption onto organics,
exists along this water course.

Boojum Research Limited 1995 South Bay ReportFebruary 28, 1997 Talisman Energy Inc.88
Further measures to augment zinc removal in the Boomerang Lake are required to reduce zinc
concentrations in Boomerang Lake outflow. The two focus areas are clearly Mill Pond Outflow
and Backfill Raise Ditch, given that these two areas represent the major sources of zinc.
According to estimated sulphate loads to Boomerang Lake and measured sulphate
concentrations in Boomerang Lake, approximately 14 % of the sulphate load may be removed
in the Boomerang Lake drainage basin.
6.56.5 Sedimentation in Boomerang LakeSedimentation in Boomerang Lake
Iron removal in Boomerang Lake is likely due to oxidation of dissolved ferrous iron in run-off
and seepages and the formation of ferric hydroxide particles which settle to the lake bottom.
A monitoring program examining sedimentation rates using sedimentation traps has been
ongoing since 1991.
Measured sedimentation rates in Boomerang Lake between 1991 and 1995 range from 0.22
to 7.5 g/m2/d. On a whole lake basis, these sedimentation rates are equivalent to 121 to 196
t of sediment per year (Table 23).
Based on chemical analyses of sediments collected in the traps, this rate of sedimentation is
equivalent to approximately 18 (1994) to 27 (1992) tonnes of iron settling in Boomerang Lake
each year, 15% and 18% of iron respectively (Table 23). Since the total annual input of iron to
Boomerang Lake is only estimated at 1.5 to 11 t/yr (Table 22a), cycling of iron between the
water and sediment phases is strongly suggested.

Boojum Research Limited 1995 South Bay ReportFebruary 28, 1997 Talisman Energy Inc.89
Table 23: Boomerang Lake Sed iment Trap Data for 1991 to 1995.
A v g . t S e d . Cum. t Sed. Avg . g /m 2 /d Per iod Days in Cum. days in lake in lake sed. in lake
F r o m To per iod in per iod dur ing per iod dur ing per iod dur ing per iod
15 -May -91 23 -Jun -91 3 9 3 9 2 2 2 2 2.323 -Jun -91 23-Ju l -91 3 0 6 9 1 9 4 0 2.623-Ju l -91 25 -Sep -91 6 4 1 3 3 2 0 6 0 1.3
25 -Sep -91 13-Ju l -92 2 9 2 4 2 5 7 3 1 3 3 1.113-Ju l -92 1 7 - O c t - 9 2 9 6 5 2 1 8 7 2 2 0 3.8
Avg . Sed imenta t ion , 1991-1992 1 5 4 t/ lake/yr
1 7 - O c t - 9 2 17 -Jun -93 2 4 3 2 4 3 1 1 6 1 1 6 2.017 -Jun -93 12 -Sep -93 8 7 3 3 0 5 7 1 7 4 2.8
12 -Sep -93 1 1 - O c t - 9 3 2 9 3 5 9 4.8 1 7 9 0.69
1 1 - O c t - 9 3 17 -Jun -94 2 4 9 6 0 8 1 3 1 9 2 0.22
17 -Jun -94 2 8 - A u g - 9 4 7 2 6 8 0 3 3 2 2 5 1.91
Avg. Sed imenta t ion , 1993-1994 1 2 1 t/ lake/yr
2 8 - A u g - 9 4 11 -May -95 2 5 6 2 5 6 5 0 5 0 0.8111 -May -95 28 -Jun -95 4 8 3 0 4 8 6 1 3 5 7.5
Avg. Sed imenta t ion , 1995 pre-PR 1 6 2 t/ lake/yr 4.1 g/m 2/d
28 -Jun -95 28-Ju l -95 3 0 3 0 42.28 42.3 5.928-Ju l -95 2 0 - O c t - 9 5 8 4 1 1 4 18.86 61.1 0.94
Average Sed imenta t ion , 1995 pos t -PR 1 9 6 t/ lake/yr 3.4 g/m 2/d
Precip. Comp. % F e % Z n % S O 4 % A l t Fe/yr t Zn/yr t SO4 / y r t A l /y r
1992 * 1 8 0.59 8.3 0.42 2 7 0.91 1 3 0.61994 * * 1 5 0.31 2.5 0.24 1 8 0.37 3.0 0.3
1995 p re PR # 2 1 0.38 8.1 0.25 3 5 0.61 1 3 0.4
1995 a f te r PR @ 2 6 0.34 3.0 0.40 5 1 0.66 6.0 0.8
* A v e r a g e c o n c e n t r a t i o n s f r o m a s s a y # ' s 4 2 9 3 - 4 2 9 5 ( 1 9 9 2 )* * Ave rage concen t ra t i ons f r om assay # ' s 5716 ,5717 (1994 )# Ave rage concen t ra t i ons f r om assay # ' s 5718 ,5719 . 5720 (1995 )@ A v e r a g e c o n c e n t r a t i o n s f r o m a s s a y # ' s 5 7 2 1 , 5 7 2 2 , 5 7 2 3 ( 1 9 9 5 )
Based on the measured sedimentation rates and the zinc content of collected sediments,
approximately 0.37 (1994) to 0.91 (1992) tonnes of zinc are settling to the Boomerang Lake
sediments annually. In contrast to iron, apparent zinc removal in Boomerang Lake is much
higher than indicated by sedimentation trap data, according to the mass balance calculations
presented in Table 23. For these years, 8 (1994) and 13 (1992) tonnes of zinc entering
Boomerang Lake were removed prior to the outflow.
According to sedimentation trap data, 13 t and 3 t of sulphate (1992 and 1994, respectively)
are removed in sediments settling to the lake bottom. For these same years, the mass balance
estimates suggest that 23 t and 1.4 t of the sulphate load are moved prior to Boomerang Lake
discharge.

Boojum Research Limited 1995 South Bay ReportFebruary 28, 1997 Talisman Energy Inc.90
Overall, it appears that the mass balance estimates and removal rates according to
sedimentation trap data are somewhat similar for sulphate, and the observed sulphate removal
in Boomerang Lake could be attributed to particle formation and settling. For iron, the
sedimentation trap data suggests recycling of iron between water and sediments, since
measured iron-bearing particle settling greatly exceeds the estimated iron removal according
to load calculations.
Since sedimentation trap data indicate much lower zinc removal that the calculated zinc
removal according to load estimates, direct uptake of zinc from the water column by sediments
is suggested. Boomerang Lake sediment pore water quality, measured using pore water
peepers in 1993 (CANMET Report, pg 58), indicated that zinc concentrations in Boomerang
Lake sediment pore water are one order of magnitude lower than lake water concentrations.
Therefore, a diffusive flux of zinc from the water column into the sediments is occurring, and
the sediments may still be serving as a sink for zinc.
This same Boomerang Lake sediment pore water quality data set indicates that dissolved iron
concentrations in sediment pore water area about an order of magnitude higher than in the
water column, and diffusive flux out of the sediments into the water column is occurring.
Calculations based on Fick's equation indicated than 13 to 100 t of iron may flux from
Boomerang Lake sediments into the water column, an estimate in the same order of magnitude
as those made based on sedimentation rates and composition (18 to 27 t Fe/yr).
In Figure 19, seasonal sedimentation rates are presented for Boomerang Lake, based on
sedimentation trap data. Spring and Summer sedimentation rates are typically higher than fall
and winter rates. Higher temperatures promoting more active sediment microbial activity
(including ferric iron reduction) in spring and summer are probably responsible for higher iron
flux from sediment and subsequent ferrous iron oxidation and ferric hydroxide precipitation.
Periphytic and phytoplanktonic growth in the ice-free season also contribute to sediment
formation and settling.

Boojum Research Limited 1995 South Bay ReportFebruary 28, 1997 Talisman Energy Inc.91
Figure 19: Boomerang Lake Sedimentation Rates According toSedimentation Trap Data: Values above bars denote days in situ.
256249
243
292l 8429
30
72
87
96
64
30
48
39
0
1
2
3
4
5
6
7
823
-Jun
-91
28-J
un-9
5
23-J
ul-9
1
25-S
ep-9
1
17-O
ct-9
2
12-S
ep-9
3
28-A
ug-9
4
28-J
ul-9
5
11-O
ct-9
3
20-O
ct-9
5
13-J
ul-9
2
17-J
un-9
3
17-J
un-9
4
11-M
ay-9
5
Sampling Date
Ave
rag
e S
edim
enta
tio
n R
ate
in p
erio
dg.
m-2.d
-1
Spring Summer Fall Overwinter
6.66.6 Boomerang Lake Particle and Sediment CompositionBoomerang Lake Particle and Sediment Composition
Sedimentation traps solids and Boomerang Lake sediment composition are presented in Table
24 for comparison. Sediment samples are collected using an Ekman dredge, which collects the
top 10 to 15 cm of sediment.
The iron concentrations in sedimentation trap solids (14 to 33 %) are consistently higher than
the iron concentration in sediment (4.5 %). The processes, dissolution of ferric hydroxide,
reduction of ferric iron to ferrous iron and flux of ferric iron from sediment to water, are likely
minimizing the accumulation of iron in the sediments.
The zinc concentration in the Boomerang Lake sediment sample is higher than those found in
all sedimentation trap solids to date. Zinc present in settled solids is being concentrated in the
sediment. It is noteworthy that the zinc concentration in Boomerang Lake sediment trap
material shows large variations from 0.1% to 0.5% zinc.

Table 24: Boomerang Lake Sedimentation Trap Solids Elemental Composition, 1994, 1995.
Date 28-Aug-94 28-Aug-94 11-May-95 11-May-95 11-May-95 28-Jul-95 28-Jul-95 20-Oct-95 20-Oct-95Assay No. 5716 5717 5718 5719 5720 5721 5722 5723 5715Location South Bay South Bay South Bay South Bay South Bay South Bay South Bay South Bay South Bay
Boomerang Boomerang Boomerang Boomerang Boomerang BoomerangBoomerang Boomerang BoomerangLake Lake Lake Lake Lake Lake Lake Lake Lake
B5 middle B5 top Average B5-1 B5-2 B5-3 Average B4 middle B4 bottom B4 surface Average SedimentAl 2,600 2,260 2,430 1,850 2,500 3,070 2,473 3,540 4,540 3,800 3,960 14,100Co 16 11 14 15 14 28 19 3 20 8 10 48Cr 11 11 11 8 16 11 12 62 65 43 57 43Cu 199 194 197 187 196 238 207 150 298 575 341 299Fe 142,000 161,000 151,500 331,000 154,000 158,000 214,333 160,000 334,000 279,000 257,667 45,300Mn 1,170 919 1,045 336 1,080 2,280 1,232 402 509 293 401 734Pb 60 47 54 28 58 47 44 198 131 87 139 44S 7,150 9,500 8,325 26,300 8,150 46,100 26,850 9,050 10,900 10,500 10,150 15,200
SO4 21,450 28,500 24,975 78,900 24,450 138,300 80,550 27,150 32,700 31,500 30,450 45,600Zn 3,440 2,710 3,075 1,490 3,280 6,570 3,780 1,530 5,440 3,130 3,367 8,620

Boojum Research Limited 1995 South Bay ReportFebruary 28, 1997 Talisman Energy Inc.93
Table 25: Boomerang Lake 1995 periphyton population biomass,elemental compositionand contaminant removal capacity.
Assay # Location Substrate Date Days Branch wt. Biomass g dw algae/ g/kg/d BiomassFrom To (g dry wt) (g dry wt) g dw branch % L.O.I.
5795 B2 Spruce 27-Jun-95 15-Aug-95 49 66 7.0 0.11 2.1 45.8%5796 B11 Spruce 27-Jun-95 15-Aug-95 49 25 4.4 0.17 3.6 52.7%5797 B8 Aspen 27-Jun-95 20-Oct-95 115 66 7.4 0.11 0.97 48.0%5798 Control Bay Aspen 27-Jun-95 20-Oct-95 115 73 2.6 0.04 0.32 81.9%
MPO Aspen 27-Jun-95 20-Oct-95 115 45 3.1 0.07 0.60Average 0.10 1.5
Assay # Location Substrate Date Zn, % Fe, % S, % Al, %5795 B2 Spruce 15-Aug-95 0.10% 16% 0.41% 0.25%5796 B11 Spruce 15-Aug-95 0.12% 14% 0.34% 0.22%5797 B8 Aspen 20-Oct-95 0.09% 22% 1.6% 0.16%5798 Control Bay Aspen 20-Oct-95 0.07% 3.1% 0.62% 0.06%
0.09% 14% 0.73% 0.17%
1995 Brush Addition to Boomerang Lake100 Truckloads (7x1x3m) 12,600 kg algal standing biomass140 brush units/load 11.67 kg zinc9.1 kg/brush unit 1,721 kg iron
127,273 kg of brush 92.3 kg sulphurTherefore, 12,600 kg of algae, standing biomass 21.5 kg aluminum
The concentration of aluminum in the sediment is significantly higher than in sedimentation
trap solids. Unlike iron, aluminum can not be reduced to a more soluble form and subsequently
is less likely to flux as a dissolved compound from the sediments.
6.76.7 Biological Polishing Capacity of Boomerang LakeBiological Polishing Capacity of Boomerang Lake
In June, 1995, 100 truckloads of cut brush were distributed in Boomerang Lake in order to
provide substrate for periphytic algal growth. This quality of brush is estimated to equal 127
t of brush (Table 25). In Plate 4, a flat bed with brush is depicted, which is considered
representative of a load of brush.
Samples of brush were sampled in August and October, 1995, 49 and 115 days after
placement. On average, 0.1 g of algal biomass covered each g of brush, equivalent to 12,600
kg of algal biomass on the 127 t of brush. In Plate 5, the algal growth in 1995 is depicted.
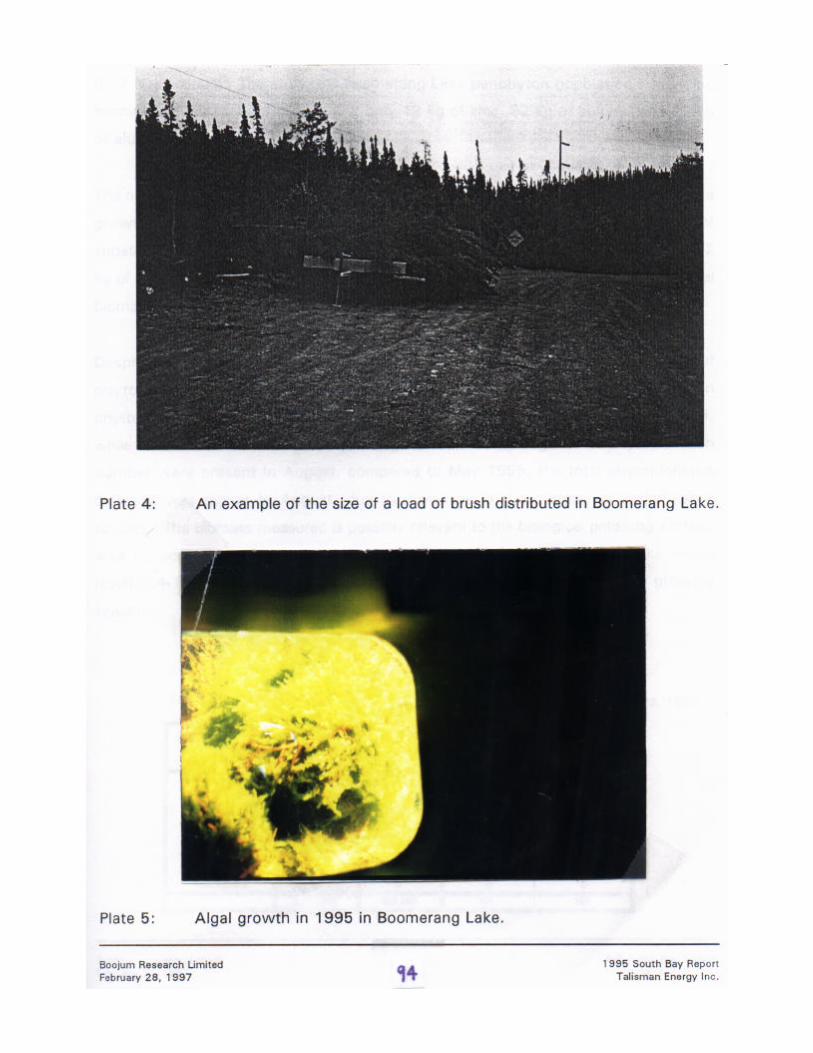
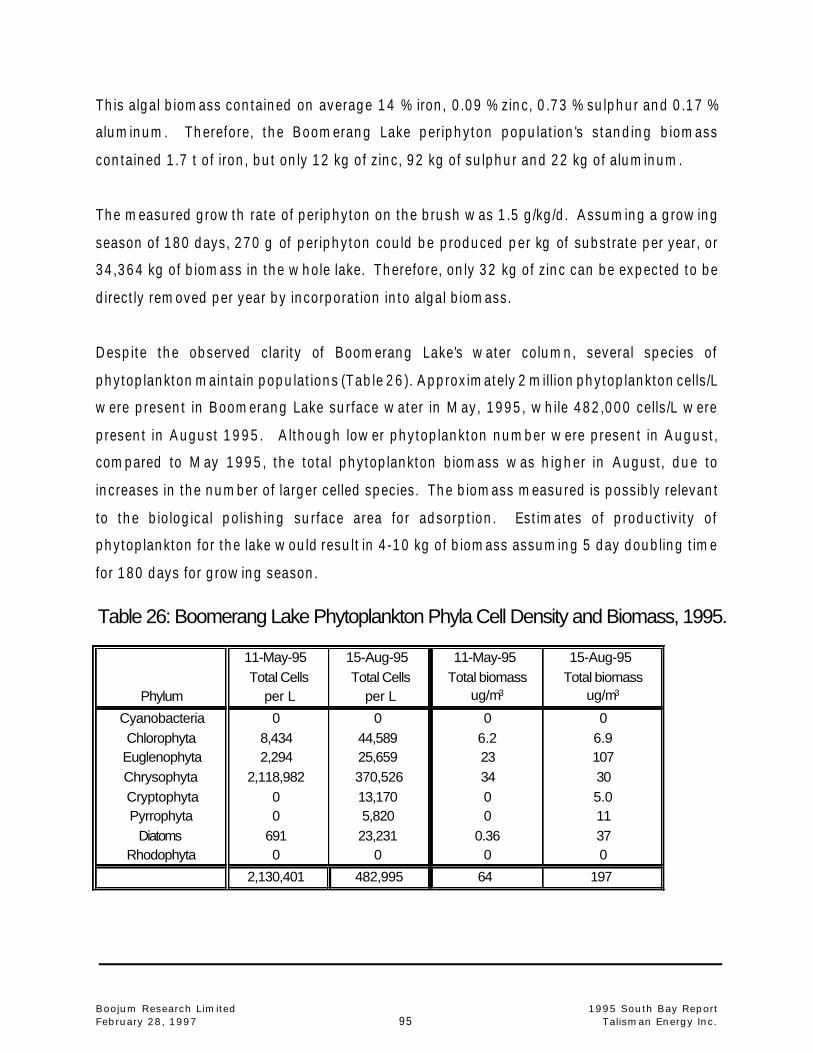
Boojum Research Limited 1995 South Bay ReportFebruary 28, 1997 Talisman Energy Inc.95
Table 26: Boomerang Lake Phytoplankton Phyla Cell Density and Biomass, 1995.
11-May-95 15-Aug-95 11-May-95 15-Aug-95Total Cells Total Cells Total biomass Total biomass
Phylum per L per L ug/m3 ug/m3
Cyanobacteria 0 0 0 0Chlorophyta 8,434 44,589 6.2 6.9
Euglenophyta 2,294 25,659 23 107Chrysophyta 2,118,982 370,526 34 30Cryptophyta 0 13,170 0 5.0Pyrrophyta 0 5,820 0 11
Diatoms 691 23,231 0.36 37Rhodophyta 0 0 0 0
2,130,401 482,995 64 197
This algal biomass contained on average 14 % iron, 0.09 % zinc, 0.73 % sulphur and 0.17 %
aluminum. Therefore, the Boomerang Lake periphyton population's standing biomass
contained 1.7 t of iron, but only 12 kg of zinc, 92 kg of sulphur and 22 kg of aluminum.
The measured growth rate of periphyton on the brush was 1.5 g/kg/d. Assuming a growing
season of 180 days, 270 g of periphyton could be produced per kg of substrate per year, or
34,364 kg of biomass in the whole lake. Therefore, only 32 kg of zinc can be expected to be
directly removed per year by incorporation into algal biomass.
Despite the observed clarity of Boomerang Lake's water column, several species of
phytoplankton maintain populations (Table 26). Approximately 2 million phytoplankton cells/L
were present in Boomerang Lake surface water in May, 1995, while 482,000 cells/L were
present in August 1995. Although lower phytoplankton number were present in August,
compared to May 1995, the total phytoplankton biomass was higher in August, due to
increases in the number of larger celled species. The biomass measured is possibly relevant
to the biological polishing surface area for adsorption. Estimates of productivity of
phytoplankton for the lake would result in 4-10 kg of biomass assuming 5 day doubling time
for 180 days for growing season.

Boojum Research Limited 1995 South Bay ReportFebruary 28, 1997 Talisman Energy Inc.96
6.86.8 Phosphate Rock Additions to Boomerang LakePhosphate Rock Additions to Boomerang Lake
Natural phosphate rock (Texasgulf) was added to Boomerang Lake in 1992, 1993, 1994 and
1995 (Map 7). Phosphate rock is being added to, first, react with iron in order to form stable
ferric phosphate particles which reduce or eliminate iron cycling, and subsequent acid
generation in Boomerang Lake. Second, excess phosphate released by the phosphate rock
should provide along term supply of phosphate to algal populations in Boomerang Lake.
Three types of phosphate rock, Code 30, Code 31 and Code 132, have been added to
Boomerang Lake. Code 30 phosphate rock is simply ground phosphate ore, with a fine sand
composition. Code 31 is a calcined phosphate rock ground into a fine powder. Code 132 has
a similar particle size distribution as Code 30, but has been calcined.
In 1992, 5.5 t of Code 31 was distributed by hand from a boat along the shore between B9
and B10. The bay in the vicinity of B7 received 0.5 t of Code 31. A widespread distribution
of 3 t of Code 31 from B11 bay to B2 was also applied.
In 1993, 9.3 t of Code 30 phosphate rock was distributed from a barge in the B10 area close
to the East Dam, and another 15.6 t in the vicinity of B9 close to the West Dam. In addition,
7.9 t of Code 132 was distributed in the B9 area. Code 132 (15.7 t) was also distributed along
the centre of Boomerang Lake Between B8 and the island. In Backfill Bay, 3.9 t of Code 30 and
3.9 t of Code 132 were applied.
In 1994, 16.5 t of Code 132 were distributed from a barge over the lower third of Boomerang
Lake's shores from the island to B2 and then towards Control Bay.
In late June - early July, 1995, 80 t of Code 31 was distributed over the entire surface of
Boomerang Lake, using an tank and pump apparatus mounted on barge which slurried the
phosphate rock with lake water prior to discharge. In Plates 6 and 7, the barge constructed for
this purpose is depicted. The loading of the barge and the distribution system can be seen.


Boojum Research Limited 1995 South Bay ReportFebruary 28, 1997 Talisman Energy Inc.99
Based on a limited set of samples, it appears that the Boomerang Lake iron concentration was
lower (2.1 mg/L) in the second half of 1995 following phosphate rock addition (Table 22a),
compared to the first half of 1995 (2.1 mg/L). The Boomerang Lake zinc concentrations in the
second half of 1995 was slightly lower (16 mg/L) than in the first half (18 mg/L Table 22b).
There is some indication that sedimentation rates in Boomerang Lake were relatively high
before (May - June, 1995; 7.5 g/m2/d) and during (June - July, 1995; 5.9 g/m2/d) application
of phosphate rock in 1995, and much lower in the summer and fall of 1995 (July- October,
1995; 0.94 g/m2/d). The iron, zinc, sulphate and aluminum content of trapped sediments
collected in the first half of 1995 were similar to those collected over the summer and fall
following application (Figure 19). If sedimentation rates were lower in the second half of
1995, then less dissolved ferrous iron was diffusing from sediments and re-precipitating as
ferric hydroxide. At this point it is not clear how effectively the phosphate rock application
was, but the sedimentation traps clearly looked free of iron in comparison to the encrustment
which was viewed previous to phosphate rock addition. Unfortunately we do not have a
photographic record of this.
The pH of Boomerang Lake was higher following the 1995 phosphate rock application, while
Iron, zinc, aluminum, sulphate and acidity concentrations were lower (Table 27). it is
estimated at 2.3 t of zinc were removed by the phosphate rock application, and 1.4 t of iron,
16 t of sulphate, 0.8 t of aluminum and approximately 27 t of acidity were also removed. It
is anticipated that iron cycling in Boomerang Lake will be diminished following application of
sufficient phosphate rock for precipitation of iron as phosphates. Sedimentation rate
monitoring data in 1996 should indicate whether iron cycling has in fact diminished.

Boojum Research Limited 1995 South Bay ReportFebruary 28, 1997 Talisman Energy Inc.100
Table 27: Contaminant concentrations in Boomerang Lake in 1994 and in the first and second halves of 1995.
pH Zn, mg/L Fe, mg/L Acidity, mg/L Sulphate, mg/|L Al, mg/LAvg Max Min Avg Max Min Avg Max Min Avg Max Min Avg Max Min Avg Max Min
a: 1994 (n=16) 3.3 3.1 3.6 13 18 11 3.3 14 2.0 89 104 77 304 339 280 2.2 2.9 1.9
b: 1995, 1st 6 mo (n=5) 3.2 2.9 3.7 18 19 18 2.1 3.6 0.80 95 100 92 312 327 290 3.4 3.5 3.3(n=4)
c: 1995, 2cd 6 mo (n=5) 3.8 3.4 4.9 16 19 14 0.74 1.3 0.30 68 88 57 296 296 296 2.6 2.9 2.5
Tonnes element removed
d: from [] difference, b-c 2.3 t 1.4 t 27 t 16 t 0.8 t
e: Sed Trap data(196 t/y) 0.71 t 46 t 11 t 0.6 t
f: Periphyton (from Table 25) 0.01 t 1.7 t 0.09 t 0.02 t
g: Sed uptake, by diff.(d-e,f) 1.6 t -47 t (sed is source) 4.7 t 0.2 t

Boojum Research Limited 1995 South Bay ReportFebruary 28, 1997 Talisman Energy Inc.101
7.07.0 INTERPRETATIONINTERPRETATION OFOF EMEM SUSURVEY DATA FOR MINE SITERVEY DATA FOR MINE SITE
AND SOUTH OF AND SOUTH OF TAILINGS / TOWN SITE TAILINGS / TOWN SITE
7.17.1 Mine Site Mine Site
The February 1995 survey was carried out over essentially the same grid that was established
in March 1992. This year, two lines were added at both the east and west ends, and the
complete grid surveyed with receiver - transmitter coil separations of 10 m, 20 m and 40 m.
In the March 1992 survey, only 10 and 20 m coil separations were used. The 1992 results
have been presented in Kalin and Pawlowski (1993). Differences between two sets of results
are reported on Map 8a (MS-9) and Map 8b (MS-10).
Although the 1995 survey recovered the same 10 anomalies initially identified in 1992,
differences in both horizontal and vertical positioning, as well as changes in the levels of
conductivity, imply that significant changes have occurred in the ground water regime in the
area of the Mine Site. Some of these changes appear to be directly related to the presence of
the Backfill Raise Diversion Ditch which was constructed shortly after the 1992 survey.
ReviewReview ofof Anomalies:Anomalies: In total, 10 anomalies have been designated for ease of
discussion from "A" to "J", and their sources, if known, are listed below. Except for Anomalies
G, H and I, which likely represent portions of one anomalous trend, most other anomalies are
one line, or point source, Bull's Eye type anomalies, which rarely extend more than the 50 m
distance to the adjacent grid line.
ANOMALY SOURCE/COMMENTS
A - directly at the shaft
- may reflect contaminated ground water or a cultural source
B - directly at the concentrator
- likely a cultural source

Boojum Research Limited 1995 South Bay ReportFebruary 28, 1997 Talisman Energy Inc.102
MAP 8a

Boojum Research Limited 1995 South Bay ReportFebruary 28, 1997 Talisman Energy Inc.103
MAP 8b
Boojum Research Limited 1995 South Bay ReportFebruary 28, 1997 Talisman Energy Inc.104
C - concentrate loading area
- likely reflects an accumulation of concentrate spilled during the
loading of the concentrate trucks during the 12 year life of the
mine
D - Mill Pond anomaly
- metal precipitation at entry point of contaminated ground water
originating from the mine and mill areas
E - Warehouse Seep / Backfill Raise Cap anomaly (WHS & BRC)
- contaminated ground water discharging at surface at two
locatio
ns.
- survey too coarse to separate the two sources, or surface seeps
are joined in the subsurface
F - probably the site where the mine core was buried
- likely acid mine drainage originating from the sulphide rich cores
G - Tailings Line Spill
- acid mine drainage originating from tailings spilled when the
tailings pipeline broke during operations
H & I - probably portions of the same anomaly related to the Backfill
Raise spill during operations
- Backfill Raise Diversion Ditch may have merged these waters
from H & I with anomaly G
J - Portal Raise Cap anomaly (PRC)
- acid mine drainage flowing out of the Portal Raise
A detailed discussion of the anomalies at the mine site can be provided on request, as the data
of the survey are compiled in a map catalogue for the site, serving as the baseline data for the
monitoring program. The main conclusion can be derived from the different maps presented,
since positive conductivity values indicate an increase (since 1992) and a negative value
indicates a decrease in ground conductivity.
Boojum Research Limited 1995 South Bay ReportFebruary 28, 1997 Talisman Energy Inc.105
The following summary describes the changes most effectively.
! Anomalies A, E and J have significantly diminished in intensity and in some cases areal
extent.
! Anomaly B appears to have changed very little.
! Anomaly C may have spread laterally to the north at depths of below 20 m, and to the
south west, to Mill Pond at shallower depths.
! Anomaly D may have diminished slightly in intensity.
! Anomaly F has increased dramatically in both intensity and size, and appears to be
migrating northward to the Backfill Raise Drainage Ditch.
! Anomaly G has increased in both extent and intensity, but at least in part appears to
be captured by the Backfill Raise Ditch. Movement northward away from the ditch, but
still towards Boomerang Lake, is suggested by the responses on the 10 m survey.
! Anomaly H appears to be contaminated water captured in the western portion of the
Backfill Raise Drainage Ditch and is being drained towards Boomerang Lake.
! Anomaly I has almost been eliminated. Some contaminated water may still be draining
westward into Mine Bay, while most appears to be draining to Boomerang Lake via the
Backfill Raise Drainage Ditch.
Recommendations:Recommendations: Anomaly F is a known source of AMD that appears to be
spreading northward. The present coverage is inadequate to the north and requires an
additional 100 m of surveying to the north. Total geophysical coverage would be on the order
of 300 m to 400 m. Resurveying of the complete grid for monitoring purposes should be
performed within the next 3-4 years to monitor the remedial work.

Boojum Research Limited 1995 South Bay ReportFebruary 28, 1997 Talisman Energy Inc.106
7.27.2 South of the Tailings/ Town Site South of the Tailings/ Town Site
A small grid was established through the former South Bay Mine town site. It extended from
the southwest corner of the Tailings southward to the shores of Mine Bay. The survey plan
indicates 6 apparently separate "bull's eye" type anomalies (Map 3a to 3d)
The strong anomaly adjacent to the Tailings is referred to as the SOUTH TAILINGS ANOMALY.
It was tested at two levels with 2 piezometers. M78A tested the basal aquifer and returned
a conductivity of 3084 :S/cm in the ground water. The accompanying piezometer M78B
tested a shallower aquifer, and returned a lower conductivity of 1150 :S/cm. The zinc
concentrations were 198 mg/L and 1.14 mg/L respectively.
Both these piezometers are located south of the previously constructed Tailings Diversion
Trench, and extend to an elevation below the bottom of the trench excavation. Although the
South Tailings Anomaly does not appear immediately south on the adjacent line located 100
m to the south, the fact that both holes were drilled 35 m south of L450mS indicates that the
plume extends at least 45 m and as much as 90 m south of L450mS. Alternatively, the plume
may be trending SSW, connecting with other bull's eye type anomalies on L550mS and
L650mS. A better definition of this anomaly/plume could be achieved through fill in lines at
50 m or 25 m spacing. The L650mS ANOMALY is centred at station 100mE on this line. The
anomaly is of moderate strength and was tested with M-82 which returned a moderate
conductivity of 1086 :S/cm from ground water immediately above the bedrock. The zinc value
in this water was 4.08 mg/L.
The origins of this contaminated water is uncertain as geophysically there does not appear to
be a link to the South Tailings Anomaly. It is possible, however, that this linkage does exist at
a depth that is below the depth penetration capabilities of the EM34 survey. Alternatively, a
locally buried pile of AMD generating waste rock may be the source of this anomaly. The
750mS ANOMALY is geophysically weak, allocated immediately north of an area of iron
precipitate observed on the shores of Confederation Lake in the vicinity of the old dock. Two
piezometers, M77A and M77B tested this anomaly and returned conductivities of only 241 and

Boojum Research Limited 1995 South Bay ReportFebruary 28, 1997 Talisman Energy Inc.107
480 :S/cm in the ground water. However, the zinc concentrations are noticeably elevated at
3.77 mg/L and 23.4 mg/L respectively. The anomaly source may reflect AMD seepage from a
nearby waste rock that was used as fill to stabilize the back yards in this area. In addition, iron
cables were encountered in the drilling. The L550mS ANOMALY is located at the eastern end
of the line and adjacent to the former tailings pipe line to the pond and road. This anomaly is
thought to be the result of seepages generated during a break and spill of tailings at this
location. The strong anomaly at the eastern end of L700ms may be cultural cables and other
mine debris present at this site, besides road construction. The two weak anomalies on
L500mS and L650mS are as yet unexplained but may be either cultural or as previously
suggested, linked with the South Tailings Anomaly.
Recommendations: Recommendations: Additional EM34 surveying on 50 m and 25 m line spacing for
a better definition/linkage of the 6 "bull's eye" anomalies in this area. If the survey would be
conducted during the summer time, possible cultural sources may be identified. Total lines
surveying that would be required is estimated at 3-4 km.
In summary, the mine site investigations confirmed that most of the work on the ditching was
successful and the usefulness of the diagnostic tool of EM surveys are indicated by both the
information gained on the changes in anomalies and the connections which can be made to
the piezometer installations. The significance of the town site anomalies has to be evaluated
in context of all other areas of the site, as the amount of water leaving in this direction from the
tailings, in comparison to that volume leaving towards Mud Lake, is relatively small.

Boojum Research Limited 1995 South Bay ReportFebruary 28, 1997 Talisman Energy Inc.108
8.08.0 CONCLUSIONS AND RECOMMENDATIONS CONCLUSIONS AND RECOMMENDATIONS
In 1995 many activities took place in South Bay summarized in Table 28. Most of the
activities were reported on in detail in the individual sections of the report, with the exception
of the GPS Survey, where no details were reported. Unfortunately the GPS could not be
completed since a severe snowstorm was approaching the site. The data were processed and
the errors which occurred in the two previous surveys where resolved. The initial work with
the GPS focussed on the resolution of the errors, and then surveying in the new piezometer
locations, hence the snowstorm interrupted the completion of the work.
Table 28: South Bay 1995 Activities List
Date Activities
January Mud Lake ARUM Experiment
February Electromagnetic survey, Mud Lake
March Electromagnetic survey, completed
April Boomerang Lake - Phosphate Rock requirement experiment
April Geochemical Evaluation of Surface and Ground Waters, 1992-1994
April-May Drilling, piezometer installation, enclosure construction, cattail
planting
April 25 - May 9 Installation of ARUM Enclosure and cattail raft construction
May 24-June 1 Arrival of Phosphate Rock
June 27 - 29 Inspection of Phosphate Rock application+Boomerang Lake Outflow
Assessment
June 27 - July 25 Starting of brush cutting and placement
June 27 - July 12 Placement of Phosphate Rock 80 tons
July 2 - 5 Completion of Mine Site Ditches
July 4 - 5 Application of potato waste
July 26 - 28 Inspection of Arum Enclosure and cattail growth
August 13-16 Salmo Consulting , MOE and MNR
September 24 - 26 Repair of ARUM Enclosure
October 19 - 22 GPS survey, water sampling

Boojum Research Limited 1995 South Bay ReportFebruary 28, 1997 Talisman Energy Inc.109
The updated database was submitted under separate cover. It contains now all chemical
analysis which have been carried out for all solid and liquid samples. A total of 2268 samples
were analysed on the project up to 1996. Such a data set is now suitable for statistical
analysis of long term trends, once sampling and seasonal variations in concentrations are
delineated. A summary of the 1212 titrations is also ready for processing, determining
acidity and alkalinity up to 1995. This is an important background monitoring parameter, to
a certain changes in the water quality cost effectively .
In 1994, an environmental impact assessment was commissioned by Talisman to SALMO
Consulting, which addressed the accumulations of zinc in the sediments in the receiving
waters and their potential effects on benthos. Boojum Research assisted with the field work
and provided assistance in the data assembly from historic records.
In summary , the 1995 work , lead to the conclusion, that a broader view has to be taken to
identify remedial options. In the past years, a relatively limited view of the site was necessary,
in that areas where addressed, which required immediate attention to comply with the
regulatory requirements. Although this approach is was effective, it is recommended that in
1996 a broader view of the project is taken. The conclusions are presented in point form and
options for evaluation of future remedial actions are outlined to develop at long term strategy
for the site. These remedial actions should be viewed in the context of 1993/1994 work,
where cost estimates for conventional liming options were obtained. Those options were
considered as non-sustainable, due to the sludge disposal problem, which is associated with
the conventional approach to treatment.
8.1 Conclusions
! From the hydrological investigations it can be concluded, that a good understanding
of the drainage basin and the path of the seepage to Mud Lake has been obtained.
The problem of bedrock closure remains to be addressed with ground trouthing of the

Boojum Research Limited 1995 South Bay ReportFebruary 28, 1997 Talisman Energy Inc.110
area at the North end of Mud Lake. It was not possible to model the EM responses
based on the reference points of the piezometers in the Gravel pit.
! The hydrogeological investigation resulted in strong recommendations, that in the
North end of Mud Lake the installation of piezometers is risky, since a hydrological
pressure exists surrounding Mud Lake of undefined magnitude. With the use of non-
intrusive measures to determine bedrock depth, at least the existing retaining strata
which must exist at the north end of Mud lake, will not be disturbed. Historical
information on water quality in the northern part of the total drainage basin, containing
NW lake should be evaluated to determine possible contamination of these lakes in
the future.
! The differences in elemental concentrations in both surface water and ground water
are found to be too large to decern either seasonal or long term trends in water quality.
A summary and review of the entire data base is recommended, to arrive at
contaminant loadings from the tailings in the various directions within the Mud lake
drainage basin. Contaminant pathway / direction and the associated metal loading
are fundamental requirements to evaluate the treatment options.
! The results of the porewater peepers placed in the Mud Lake enclosure are indicating
that the porewater has no or low zinc concentration in the porewater . This would
generally facilitate at least for some time a zinc flux from the water to the sediment.
This is similar to the finings for Boomerang Lake, using the sedimentation trap data
and Fix’s equation to evaluate the zinc distribution in this report.
! The results of the enclosure itself in Mud lake were not encouraging after the first
application of the potato waste. This is not unexpected as a cover should be
constructed for the enclosure. The construction of a cover will be not a simple task,
since iron precipitation of such a structure is difficult to predict which will affect the
floatation and the cattail growth in these harsh conditions. Unfortunately extensive

Boojum Research Limited 1995 South Bay ReportFebruary 28, 1997 Talisman Energy Inc.111
discussion with Hoey, at A Quality contracting delayed the installation of such a cover
in 1994/1995.
! The phosphate rock treatment in Boomerang lake is giving sings of being effective.
The literature suggest phosphate applications to lakes which had been acidified by
atmospheric acidification, as an effective means to increase pH in the lake. These
new literature reports along with the visual observation of the absence of an iron
encrustment on the sedimentation traps , suggest that the project is developing
technically the correct direction. At present one can not differentiate between the
precipitation rates of the fall season, which are generally lower than those of the
summer. Furthermore the increased iron loading from the Backfill Raise ditch have to
be considered , in obtaining a measure of the true reduction in iron cycling achieved.
! The EM survey at the mine / mill site did not produce new anomalies compared to
1992 . The survey suggests that essentially with the possible exception of two small
anomalies on the mine site, all other plumes of contaminated ground water/surface
waters, are migrating towards Boomerang Lake. The two anomalies of concern,
migrating towards Confederation lake have decreased in intensity drastically . The
decrease is interpreted to be due to but may be related to decrease in ground water
flow through this area due to the construction of the Backfill Raise Diversion Ditch.
8.2 Acidic Drainage Remediation Options
The overall conclusion of the 1995 work was that a broader view had to be taken in 1996 in
order to address the remedial options for the site in the near future. Some of these options are
identified here as part of the conclusions, since they will guide to a large degree the activities
in 1996 and 1997. Remediation options that could be considered for application at the South
Bay tailings site, to reduce or eliminate the discharge of acidic drainage from the site are
listed below in related groups:

Boojum Research Limited 1995 South Bay ReportFebruary 28, 1997 Talisman Energy Inc.112
! Flooding the Tailings by e.g.:
1- natural precipitation, or
2- pumping from Boomerang Lake
Moving the Tailings e.g. to:
3-1 Boomerang Lake
3-2 Underground
These options are given for completeness but will not be considered further given the
evaluation carried out in 1993/1994 which produced a potential fall back position for site
remediation, but leaves the undesirable economic expenditures without assurances of a
sustainable solution to the problem.
! Plugging Subsurface Pathways by e.g.:
1- grouting, or
2- bacterial biomass, or
3- slurry cut-off wall, or
4- artificial permafrost
Grouting and slurry cut-off walls are likely not only uneconomic options, but also non
sustainable options, as the terrain is very difficult to access for construction purposes, due
to the floating muskeg in the northern part of the drainage basin. As a first cut a hydrological
evaluation is recommended to be carried out to address surface and ground water diversion
of freshwater away from the tailings area. In addition the source of the surface water in Decant
pond should be delineated clearly .
A second option to be pursued in 1996 , is the evaluation of the feasibility of in-situ treatment
of ground water seepage, referred to as the option under bacterial biomass generation. This
option is particularly attractive, since it might also be relevant as an option to consider for the
Mine/mill site and the underground mine workings. .

Boojum Research Limited 1995 South Bay ReportFebruary 28, 1997 Talisman Energy Inc.113
! Covering the Tailings by e.g.:
1- vegetation, or
2- impermeable geofabric, or
3- clay cover, or
4- graduated cover (Swedish process)
Reducing Hydraulic Conductivity of the Tailings by e.g.:
4-1 Application of Ca(OH)2, or
4-2 Application of Ba(OH)2
Essentially all covers have one objective to reduce the permeability of water falling onto the
tailings area infitrating into the tailings. . It is recommended that any of these cover options is
first evaluated with respect to the hydrological implications, since water from the sky has to
go somewhere. This is particularly important in relation to Decant pond , where the source of
surface water has to be addressed.