Embed Size (px)
Citation preview

Reinsurance Market OutlookJanuary 2014
Empower Results®

2
Contents
3 Executive Summary – Reinsurers Use Competitive Strength in Underwriting
4 Excess Supply at Tipping Point to Bring Additional Demand
9 Fourth Quarter 2013 Catastrophe Bond Transaction Review
11 2013 Global Catastrophe Losses Below Average
13 Tropical Cyclone Loss in Asia Highlights Dearth of Insurance Penetration
15 Profitable Growth: Brazil
22 Rating Agency and Regulatory Update
28 M&A Activity Update
29 Economic and Financial Market Update
34 Bank Leverage
Aon Benfield
3
Executive Summary—Reinsurers Use Competitive Strength in Underwriting
New competitive capital flows will continue to benefit reinsurance buyers in the April, June and July renewal seasons. Traditional reinsurers have responded to the 25 to 40 percent price decreases allowed by insurance-linked securities investors and some collateralized reinsurance funds that occurred in 2013. Traditional reinsurers have strategically underwritten contractual features that are hard to replicate in insurance-linked securities and collateralized reinsurance and we believe this comparative strength of traditional reinsurers will continue to benefit buyers of reinsurance. Reinsurer capital grew 5 percent year on year. Demand for U.S. hurricane (the global peak zone) reinsurance limits from insurers was flat year on year. Reinsurance capital growth as a univariate continues to be less predictive than alternative capital flows and low real interest rates in reinsurance pricing algorithms. Expected pension fund, life insurer, endowment and high net worth family trust returns continue to drive interest in alternative asset classes including insurance-linked securities and collateralized reinsurance funds. Reinsurers will continue to incorporate the competitive strengths of alternative capital flows into their capital and organizations through (i) sponsorship of catastrophe bonds to lower their cost of underwriting capital supporting tail risks; (ii) sponsorship of sidecars to lower their cost of underwriting capital throughout their underwriting risk distribution; and (iii) formation of insurance-linked securities and collateralized reinsurance fund management units. We will continue to focus on contractual differences that can detract from the value proposition of traditional reinsurance for each client in comparison to alternative capital. We made material progress for clients that desired relaxed hours clauses, more favorable reinstatement terms and other terms and conditions. These activities will continue to improve the value proposition of traditional reinsurers, enhance valued relationships, better meet the realistic expectations of reinsurance buyers and help the entire market grow. The cost of reinsurance capital as a component of underwriting capital has declined materially for nearly every class of reinsurance over the last two renewal cycles. The most dramatic cost decreases have occurred in U.S. peak hurricane zones. We believe more instances of opportunistic reinsurance use will emerge in the near-term. Reinsurance buyers continue to evaluate incorporating these new lower price points to grow strategically in peak zones. We further believe the increasing availability of multi-year catastrophe reinsurance from traditional reinsurers that incorporate new alternative capital flows will help reinsurance buyers believe strategic growth opportunities are sustainable and increase reinsurance demand over the long-term. Note: This reinsurance market outlook report should be read in conjunction with our firm’s views on rate on line, capacity and retention changes for each cedent’s market. Our professionals are prepared to discuss variations from our market sector outlook that apply to individual programs due to established trading relationships, capacity needs, loss experience, exposure management, data quality, model fitness, expiring margins and other factors that may cause variations from our reinsurance market outlook.
Reinsurance Market Outlook
4
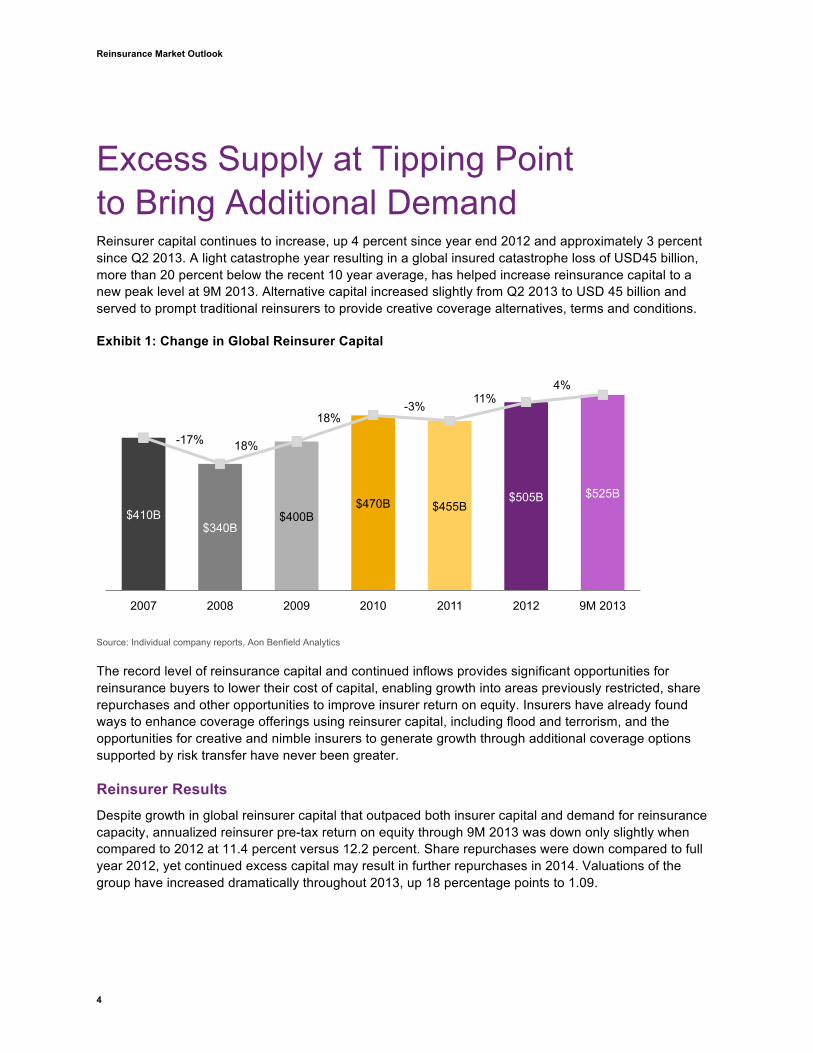
Excess Supply at Tipping Point to Bring Additional Demand Reinsurer capital continues to increase, up 4 percent since year end 2012 and approximately 3 percent since Q2 2013. A light catastrophe year resulting in a global insured catastrophe loss of USD45 billion, more than 20 percent below the recent 10 year average, has helped increase reinsurance capital to a new peak level at 9M 2013. Alternative capital increased slightly from Q2 2013 to USD 45 billion and served to prompt traditional reinsurers to provide creative coverage alternatives, terms and conditions. Exhibit 1: Change in Global Reinsurer Capital
Source: Individual company reports, Aon Benfield Analytics
The record level of reinsurance capital and continued inflows provides significant opportunities for reinsurance buyers to lower their cost of capital, enabling growth into areas previously restricted, share repurchases and other opportunities to improve insurer return on equity. Insurers have already found ways to enhance coverage offerings using reinsurer capital, including flood and terrorism, and the opportunities for creative and nimble insurers to generate growth through additional coverage options supported by risk transfer have never been greater.
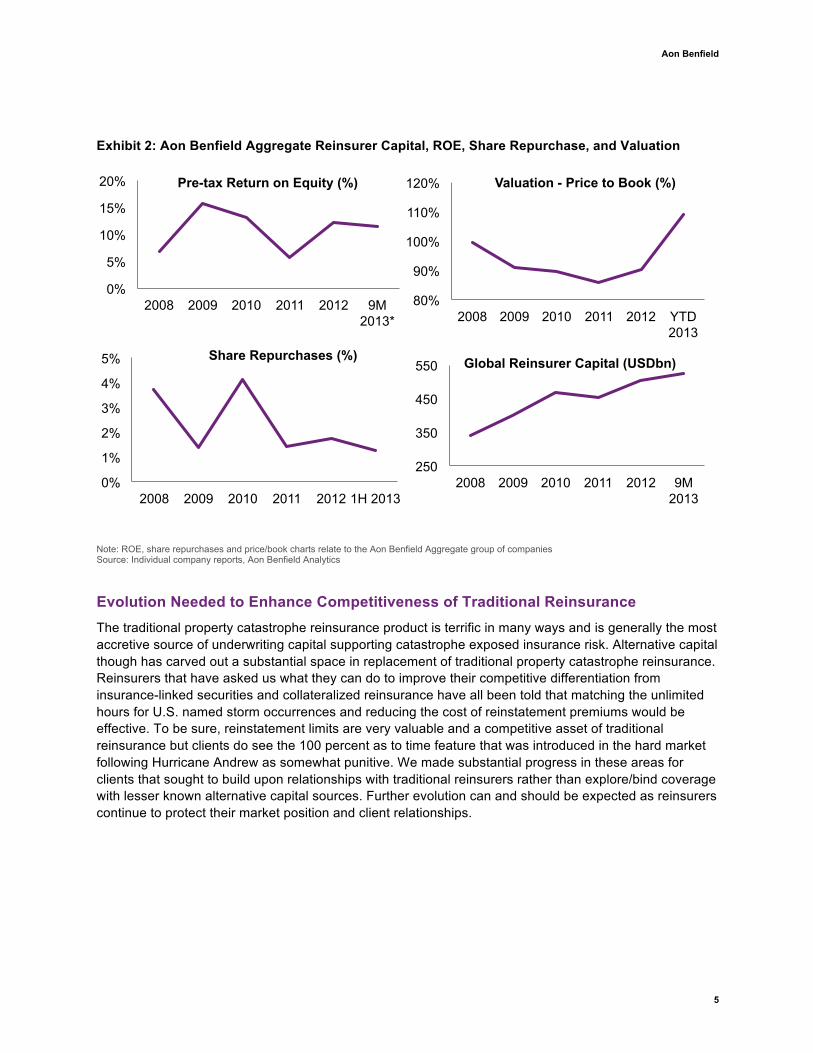
Reinsurer Results Despite growth in global reinsurer capital that outpaced both insurer capital and demand for reinsurance capacity, annualized reinsurer pre-tax return on equity through 9M 2013 was down only slightly when compared to 2012 at 11.4 percent versus 12.2 percent. Share repurchases were down compared to full year 2012, yet continued excess capital may result in further repurchases in 2014. Valuations of the group have increased dramatically throughout 2013, up 18 percentage points to 1.09.
$410B $340B
$400B $470B $455B
$505B $525B
-17% 18%
18% -3% 11%
4%
2007 2008 2009 2010 2011 2012 9M 2013
Aon Benfield
5
Exhibit 2: Aon Benfield Aggregate Reinsurer Capital, ROE, Share Repurchase, and Valuation
Note: ROE, share repurchases and price/book charts relate to the Aon Benfield Aggregate group of companies Source: Individual company reports, Aon Benfield Analytics
Evolution Needed to Enhance Competitiveness of Traditional Reinsurance The traditional property catastrophe reinsurance product is terrific in many ways and is generally the most accretive source of underwriting capital supporting catastrophe exposed insurance risk. Alternative capital though has carved out a substantial space in replacement of traditional property catastrophe reinsurance. Reinsurers that have asked us what they can do to improve their competitive differentiation from insurance-linked securities and collateralized reinsurance have all been told that matching the unlimited hours for U.S. named storm occurrences and reducing the cost of reinstatement premiums would be effective. To be sure, reinstatement limits are very valuable and a competitive asset of traditional reinsurance but clients do see the 100 percent as to time feature that was introduced in the hard market following Hurricane Andrew as somewhat punitive. We made substantial progress in these areas for clients that sought to build upon relationships with traditional reinsurers rather than explore/bind coverage with lesser known alternative capital sources. Further evolution can and should be expected as reinsurers continue to protect their market position and client relationships.
0%
5%
10%
15%
20%
2008 2009 2010 2011 2012 9M 2013*
Pre-tax Return on Equity (%)
80%
90%
100%
110%
120%
2008 2009 2010 2011 2012 YTD 2013
Valuation - Price to Book (%)
0%
1%
2%
3%
4%
5%
2008 2009 2010 2011 2012 1H 2013
Share Repurchases (%)
250
350
450
550
2008 2009 2010 2011 2012 9M 2013
Global Reinsurer Capital (USDbn)
Reinsurance Market Outlook
6
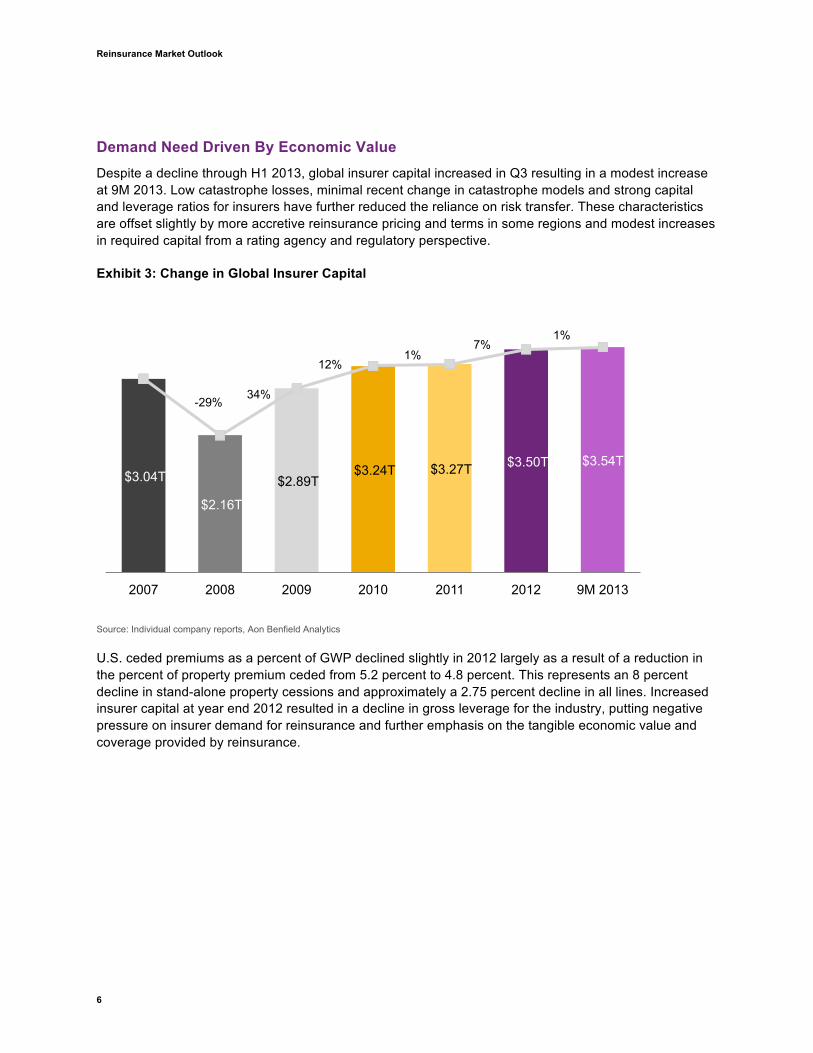
Demand Need Driven By Economic Value Despite a decline through H1 2013, global insurer capital increased in Q3 resulting in a modest increase at 9M 2013. Low catastrophe losses, minimal recent change in catastrophe models and strong capital and leverage ratios for insurers have further reduced the reliance on risk transfer. These characteristics are offset slightly by more accretive reinsurance pricing and terms in some regions and modest increases in required capital from a rating agency and regulatory perspective.
Exhibit 3: Change in Global Insurer Capital
Source: Individual company reports, Aon Benfield Analytics
U.S. ceded premiums as a percent of GWP declined slightly in 2012 largely as a result of a reduction in the percent of property premium ceded from 5.2 percent to 4.8 percent. This represents an 8 percent decline in stand-alone property cessions and approximately a 2.75 percent decline in all lines. Increased insurer capital at year end 2012 resulted in a decline in gross leverage for the industry, putting negative pressure on insurer demand for reinsurance and further emphasis on the tangible economic value and coverage provided by reinsurance.
$3.04T
$2.16T
$2.89T $3.24T $3.27T $3.50T $3.54T
-29% 34%
12% 1%
7% 1%
2007 2008 2009 2010 2011 2012 9M 2013
Aon Benfield
7
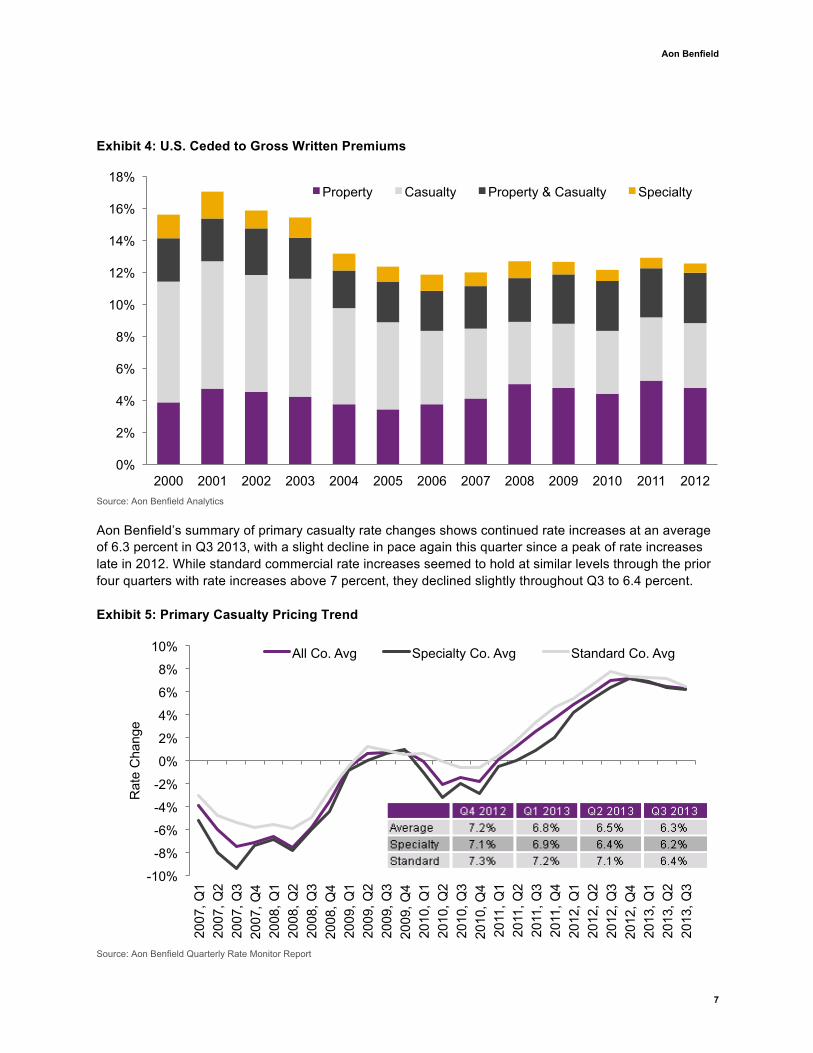
Exhibit 4: U.S. Ceded to Gross Written Premiums
Source: Aon Benfield Analytics
Aon Benfield’s summary of primary casualty rate changes shows continued rate increases at an average of 6.3 percent in Q3 2013, with a slight decline in pace again this quarter since a peak of rate increases late in 2012. While standard commercial rate increases seemed to hold at similar levels through the prior four quarters with rate increases above 7 percent, they declined slightly throughout Q3 to 6.4 percent. Exhibit 5: Primary Casualty Pricing Trend
Source: Aon Benfield Quarterly Rate Monitor Report
0%
2%
4%
6%
8%
10%
12%
14%
16%
18%
2000 2001 2002 2003 2004 2005 2006 2007 2008 2009 2010 2011 2012
Property Casualty Property & Casualty Specialty
-10%
-8%
-6%
-4%
-2%
0%
2%
4%
6%
8%
10%
2007
, Q1
2007
, Q2
2007
, Q3
2007
, Q4
2008
, Q1
2008
, Q2
2008
, Q3
2008
, Q4
2009
, Q1
2009
, Q2
2009
, Q3
2009
, Q4
2010
, Q1
2010
, Q2
2010
, Q3
2010
, Q4
2011
, Q1
2011
, Q2
2011
, Q3
2011
, Q4
2012
, Q1
2012
, Q2
2012
, Q3
2012
, Q4
2013
, Q1
2013
, Q2
2013
, Q3
Rat
e C
hang
e
All Co. Avg Specialty Co. Avg Standard Co. Avg
Reinsurance Market Outlook
8
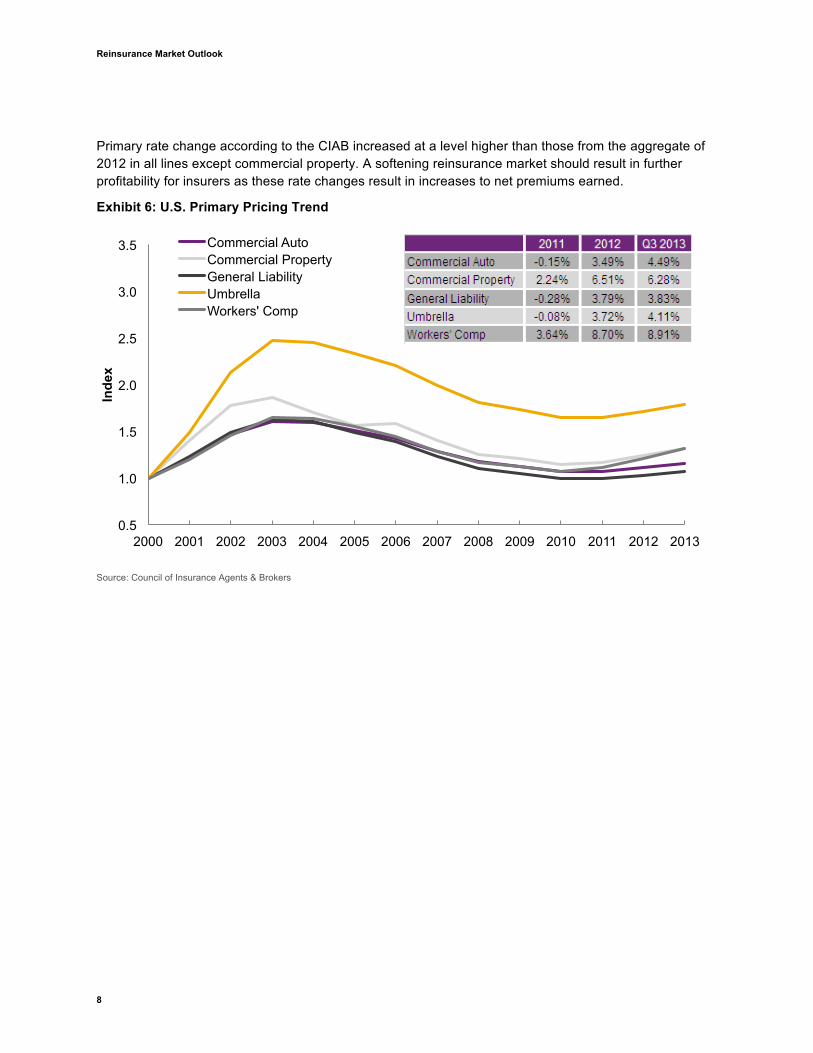
Primary rate change according to the CIAB increased at a level higher than those from the aggregate of 2012 in all lines except commercial property. A softening reinsurance market should result in further profitability for insurers as these rate changes result in increases to net premiums earned.
Exhibit 6: U.S. Primary Pricing Trend
Source: Council of Insurance Agents & Brokers
0.5
1.0
1.5
2.0
2.5
3.0
3.5
2000 2001 2002 2003 2004 2005 2006 2007 2008 2009 2010 2011 2012 2013
Inde
x
Commercial Auto Commercial Property General Liability Umbrella Workers' Comp
Aon Benfield
9
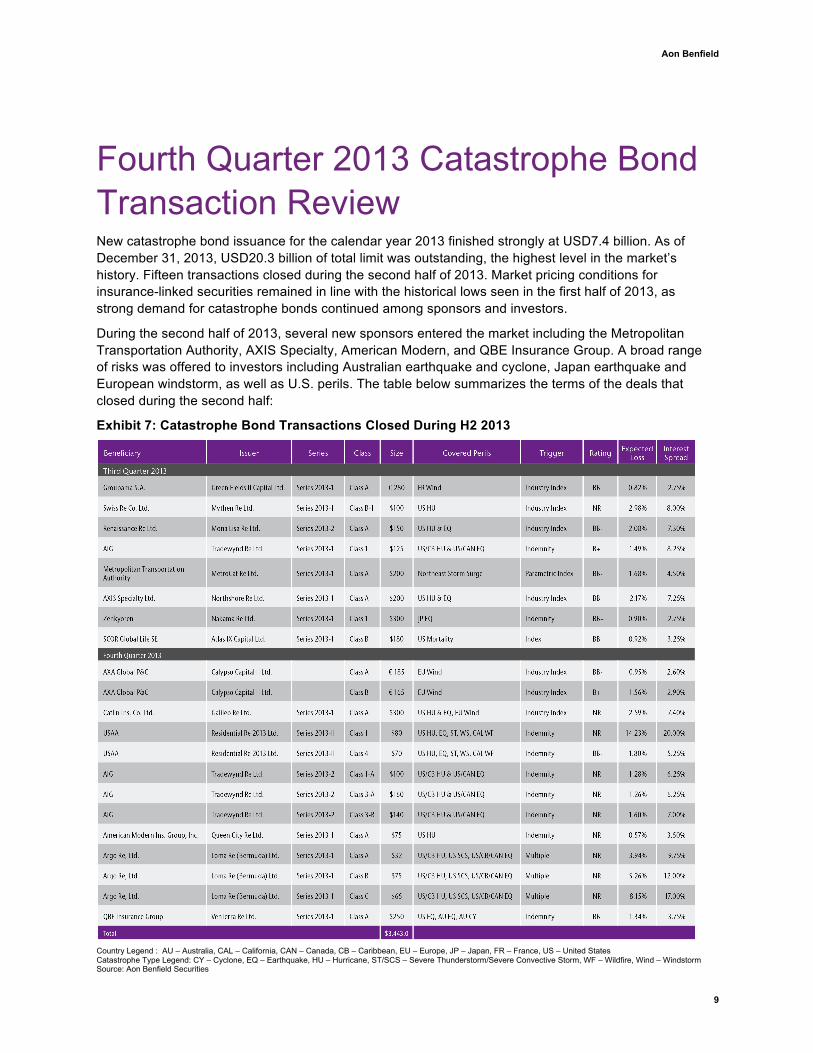
Fourth Quarter 2013 Catastrophe Bond Transaction Review New catastrophe bond issuance for the calendar year 2013 finished strongly at USD7.4 billion. As of December 31, 2013, USD20.3 billion of total limit was outstanding, the highest level in the market’s history. Fifteen transactions closed during the second half of 2013. Market pricing conditions for insurance-linked securities remained in line with the historical lows seen in the first half of 2013, as strong demand for catastrophe bonds continued among sponsors and investors.
During the second half of 2013, several new sponsors entered the market including the Metropolitan Transportation Authority, AXIS Specialty, American Modern, and QBE Insurance Group. A broad range of risks was offered to investors including Australian earthquake and cyclone, Japan earthquake and European windstorm, as well as U.S. perils. The table below summarizes the terms of the deals that closed during the second half:
Exhibit 7: Catastrophe Bond Transactions Closed During H2 2013
Country Legend : AU – Australia, CAL – California, CAN – Canada, CB – Caribbean, EU – Europe, JP – Japan, FR – France, US – United States Catastrophe Type Legend: CY – Cyclone, EQ – Earthquake, HU – Hurricane, ST/SCS – Severe Thunderstorm/Severe Convective Storm, WF – Wildfire, Wind – Windstorm Source: Aon Benfield Securities
Reinsurance Market Outlook
10
In the third quarter, Zenkyoren successfully sponsored its first indemnity transaction. Nakama Re Ltd. provides the insurer with USD300 million in coverage for Japan earthquakes. SCOR Global Life SE sponsored its first non-property catastrophe transaction. Atlas IX Capital Limited secured USD180 million in capacity and provides coverage for extreme mortality in the U.S.
In the fourth quarter, QBE came to market with its first transaction, which provides indemnity coverage for U.S. earthquakes, Australia cyclones and Australia earthquakes. VenTerra Re Ltd. provides QBE with USD250 million in capacity and closed at the low end of marketed guidance.
Also in the fourth quarter, Argo Re returned to the catastrophe bond market with its third issuance, Loma Re (Bermuda) Ltd. The transaction provides the sponsor with U.S. multi-peril coverage using a combination on industry index and indemnity triggers.
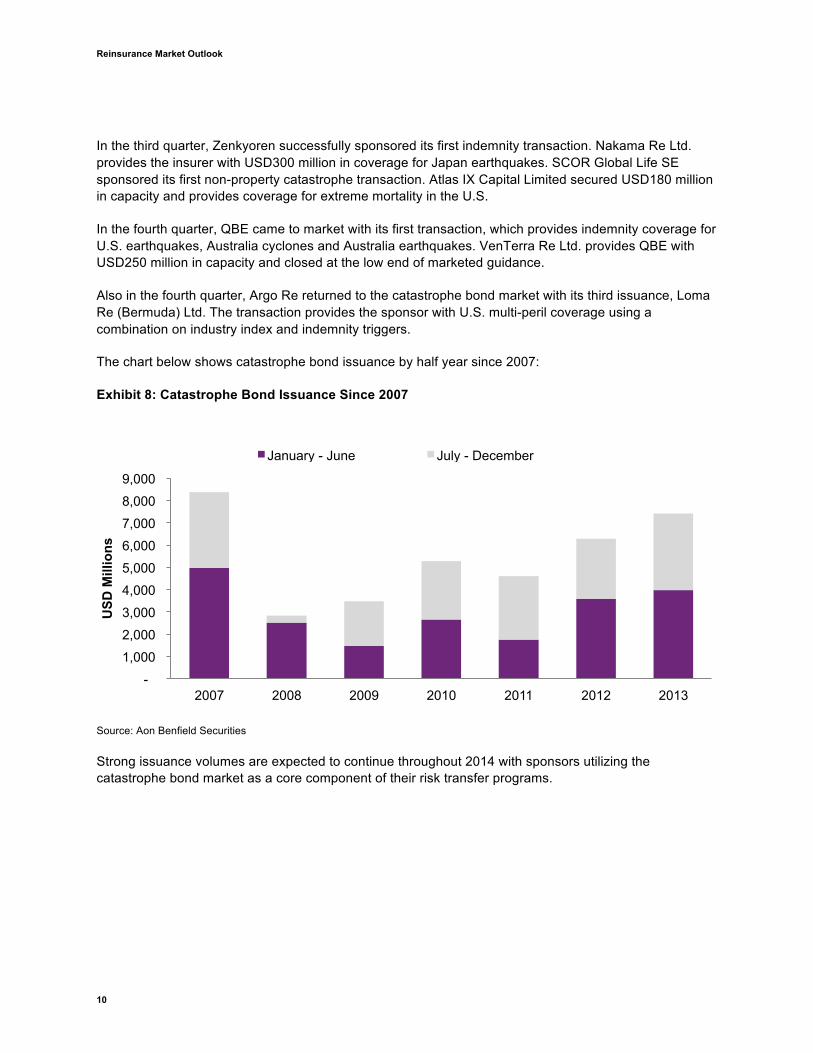
The chart below shows catastrophe bond issuance by half year since 2007:
Exhibit 8: Catastrophe Bond Issuance Since 2007
Source: Aon Benfield Securities
Strong issuance volumes are expected to continue throughout 2014 with sponsors utilizing the catastrophe bond market as a core component of their risk transfer programs.
-
1,000
2,000
3,000
4,000
5,000
6,000
7,000
8,000
9,000
2007 2008 2009 2010 2011 2012 2013
USD
Mill
ions
January - June July - December
Aon Benfield
11
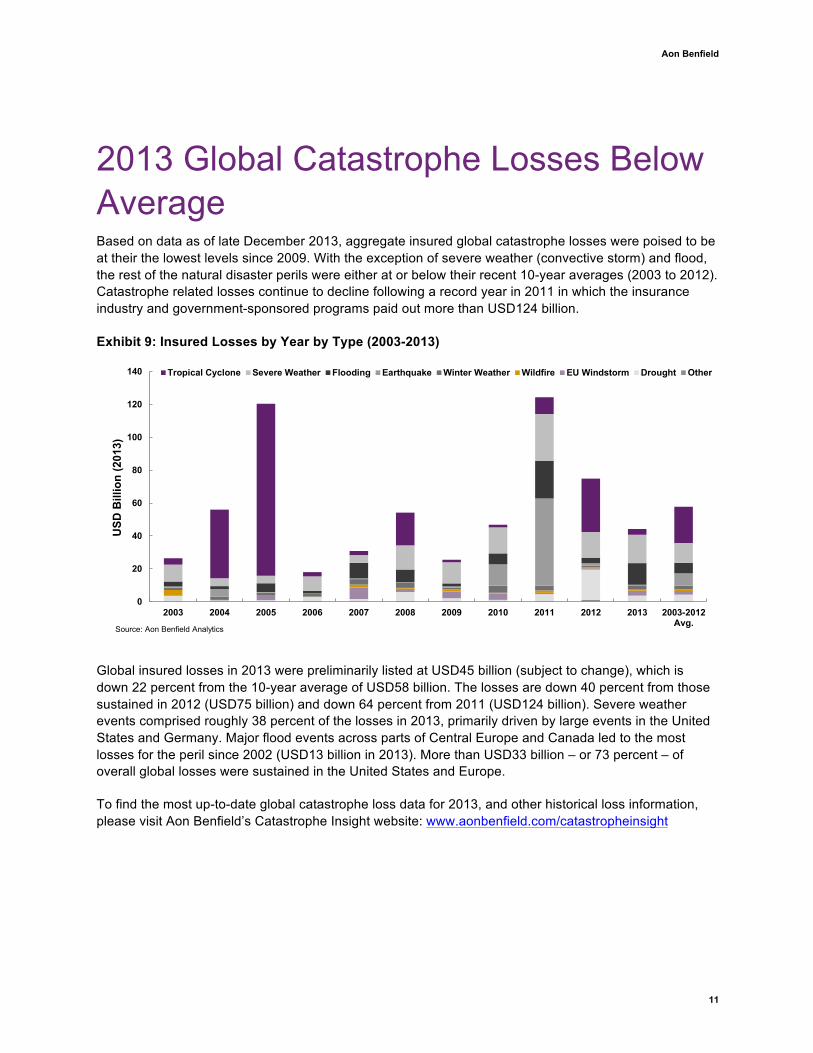
2013 Global Catastrophe Losses Below Average Based on data as of late December 2013, aggregate insured global catastrophe losses were poised to be at their the lowest levels since 2009. With the exception of severe weather (convective storm) and flood, the rest of the natural disaster perils were either at or below their recent 10-year averages (2003 to 2012). Catastrophe related losses continue to decline following a record year in 2011 in which the insurance industry and government-sponsored programs paid out more than USD124 billion.
Exhibit 9: Insured Losses by Year by Type (2003-2013)
Global insured losses in 2013 were preliminarily listed at USD45 billion (subject to change), which is down 22 percent from the 10-year average of USD58 billion. The losses are down 40 percent from those sustained in 2012 (USD75 billion) and down 64 percent from 2011 (USD124 billion). Severe weather events comprised roughly 38 percent of the losses in 2013, primarily driven by large events in the United States and Germany. Major flood events across parts of Central Europe and Canada led to the most losses for the peril since 2002 (USD13 billion in 2013). More than USD33 billion – or 73 percent – of overall global losses were sustained in the United States and Europe.
To find the most up-to-date global catastrophe loss data for 2013, and other historical loss information, please visit Aon Benfield’s Catastrophe Insight website: www.aonbenfield.com/catastropheinsight
0
20
40
60
80
100
120
140
2003 2004 2005 2006 2007 2008 2009 2010 2011 2012 2013 2003-2012Avg.
USD
Bill
ion
(201
3)
Tropical Cyclone Severe Weather Flooding Earthquake Winter Weather Wildfire EU Windstorm Drought Other
Source: Aon Benfield Analytics
Reinsurance Market Outlook
12
Exhibit 10: 2013 Insured Losses Compared to Recent Annual Averages by Region
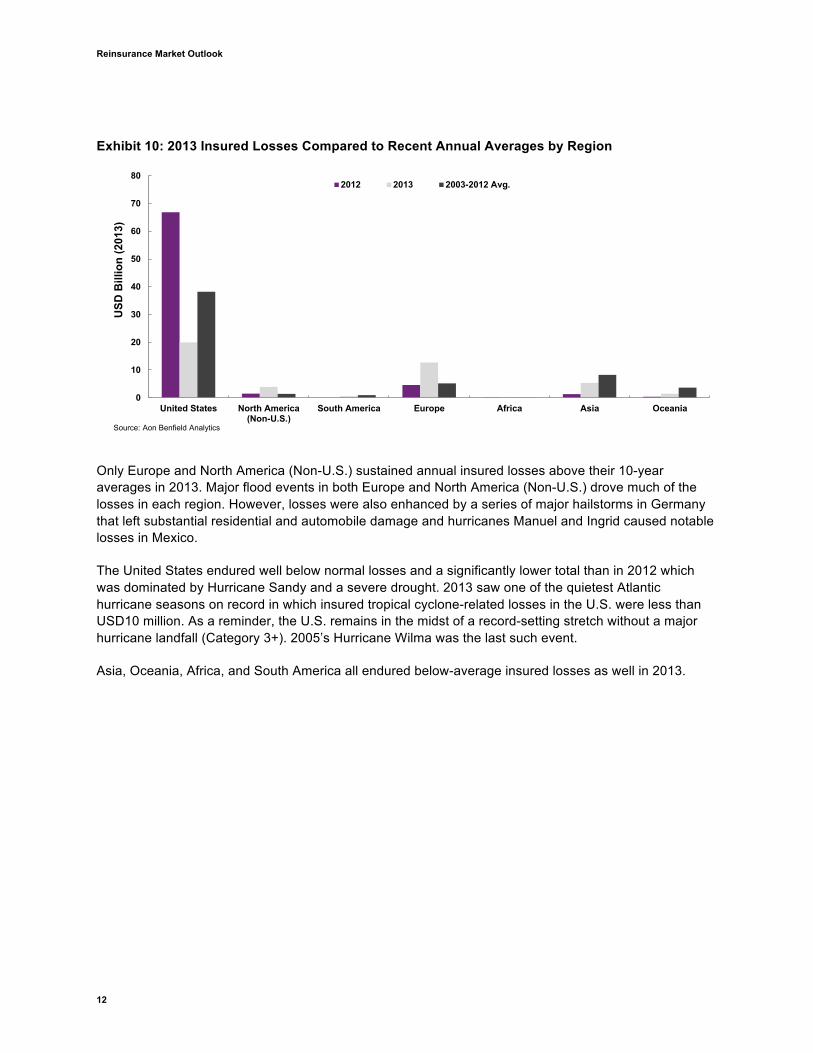
Only Europe and North America (Non-U.S.) sustained annual insured losses above their 10-year averages in 2013. Major flood events in both Europe and North America (Non-U.S.) drove much of the losses in each region. However, losses were also enhanced by a series of major hailstorms in Germany that left substantial residential and automobile damage and hurricanes Manuel and Ingrid caused notable losses in Mexico.
The United States endured well below normal losses and a significantly lower total than in 2012 which was dominated by Hurricane Sandy and a severe drought. 2013 saw one of the quietest Atlantic hurricane seasons on record in which insured tropical cyclone-related losses in the U.S. were less than USD10 million. As a reminder, the U.S. remains in the midst of a record-setting stretch without a major hurricane landfall (Category 3+). 2005’s Hurricane Wilma was the last such event.
Asia, Oceania, Africa, and South America all endured below-average insured losses as well in 2013.
0
10
20
30
40
50
60
70
80
United States North America(Non-U.S.)
South America Europe Africa Asia Oceania
USD
Bill
ion
(201
3)
2012 2013 2003-2012 Avg.
Source: Aon Benfield Analytics
Aon Benfield
13
Tropical Cyclone Loss in Asia Highlights Dearth of Insurance Penetration Active tropical cyclone seasons in the Northwest Pacific Ocean and North Indian Ocean basins led to several catastrophic landfalling events in Asia during 2013. The year was highlighted by Super Typhoon Haiyan, which made landfall in the central Philippines as one of the strongest storms in world history – coming ashore at Category 5 intensity with estimated 195 mph (315 kph) maximum sustained winds. Haiyan damaged or destroyed more than 1.2 million homes in the Philippines alone and decimated the transportation, agricultural and electrical infrastructures. The government’s insurance commissioner estimated total insured losses at upwards of USD1.5 billion
Beyond Haiyan, the second-costliest global tropical cyclone of the year was Typhoon Fitow, which came ashore in China and spawned exceptional flooding across several provinces that inundated hundreds of thousands of homes and submerged vast areas of cropland. China’s Ministry of Civil Affairs cited economic losses at USD6.7 billion.
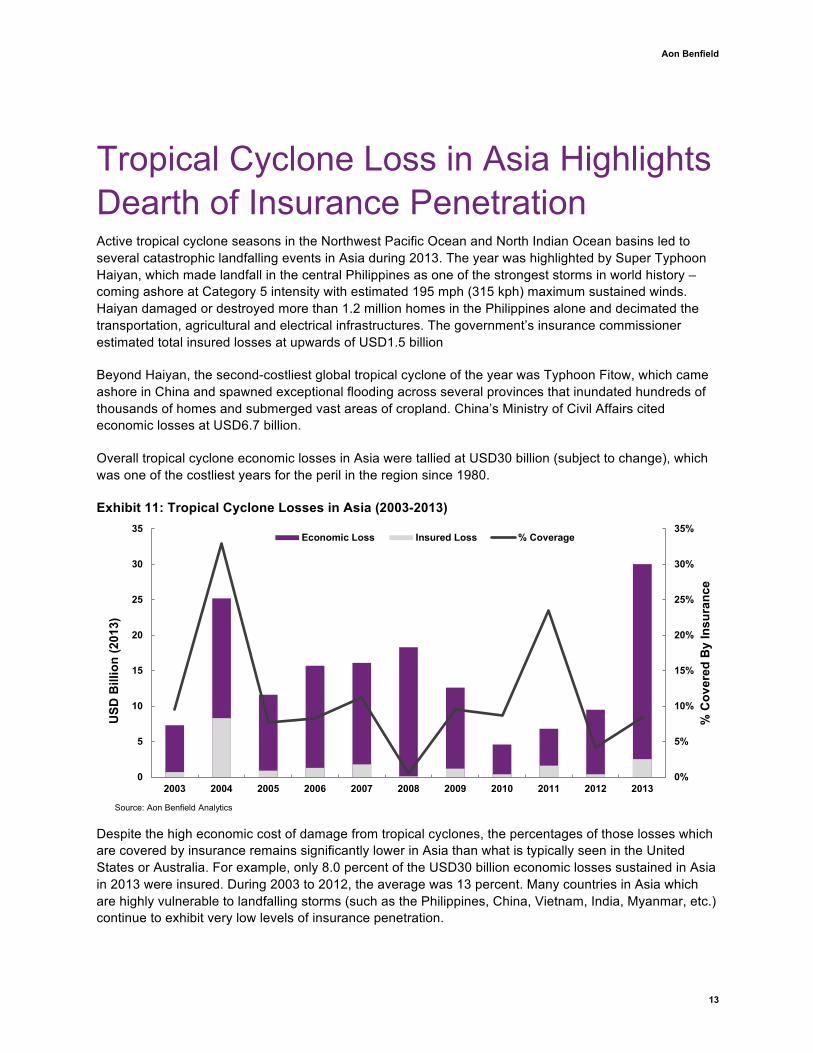
Overall tropical cyclone economic losses in Asia were tallied at USD30 billion (subject to change), which was one of the costliest years for the peril in the region since 1980.
Exhibit 11: Tropical Cyclone Losses in Asia (2003-2013)
Despite the high economic cost of damage from tropical cyclones, the percentages of those losses which are covered by insurance remains significantly lower in Asia than what is typically seen in the United States or Australia. For example, only 8.0 percent of the USD30 billion economic losses sustained in Asia in 2013 were insured. During 2003 to 2012, the average was 13 percent. Many countries in Asia which are highly vulnerable to landfalling storms (such as the Philippines, China, Vietnam, India, Myanmar, etc.) continue to exhibit very low levels of insurance penetration.
0%
5%
10%
15%
20%
25%
30%
35%
0
5
10
15
20
25
30
35
2003 2004 2005 2006 2007 2008 2009 2010 2011 2012 2013
% C
over
ed B
y In
sura
nce
USD
Bill
ion
(201
3)
Economic Loss Insured Loss % Coverage
Source: Aon Benfield Analytics
Reinsurance Market Outlook
14
As Exhibit 11 shows, there have been years in which a greater percentage of Asian cyclone losses have been covered by insurance. This typically happens when storms directly affect Japan or South Korea – two countries which have continued to see insurance penetration steadily increase. In 2004, Japan endured several typhoon events (Songda, Tokage, Meari, and Chaba) which caused severe damage throughout the island nation. Nearly 33 percent of the USD25 billion in economic losses were insured.
However, Asian cyclone damage in 2008 was heavily concentrated in Myamar, where Cyclone Nargis caused nearly USD11 billion in economic damages. Despite the tremendous level of damage, the level of insurance penetration in the country is exceptionally small and almost none of those losses were insured. For that year, only 1.0 percent of cyclone losses were covered by insurance in Asia.
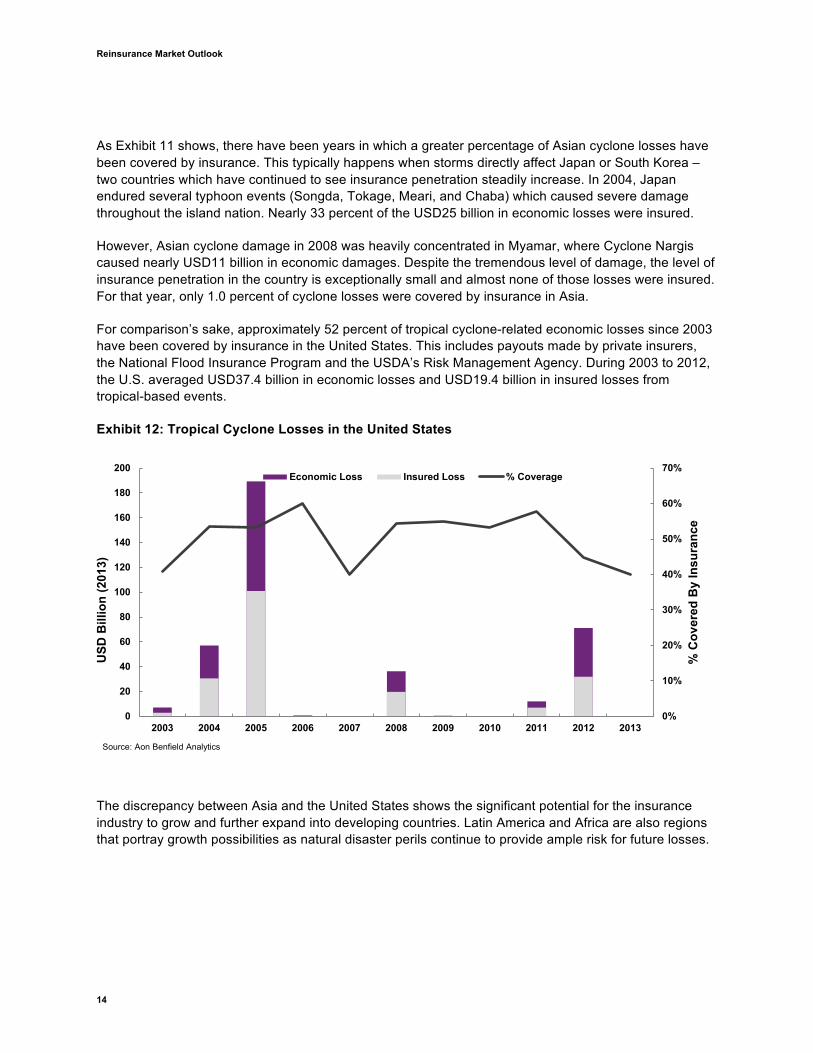
For comparison’s sake, approximately 52 percent of tropical cyclone-related economic losses since 2003 have been covered by insurance in the United States. This includes payouts made by private insurers, the National Flood Insurance Program and the USDA’s Risk Management Agency. During 2003 to 2012, the U.S. averaged USD37.4 billion in economic losses and USD19.4 billion in insured losses from tropical-based events.
Exhibit 12: Tropical Cyclone Losses in the United States
The discrepancy between Asia and the United States shows the significant potential for the insurance industry to grow and further expand into developing countries. Latin America and Africa are also regions that portray growth possibilities as natural disaster perils continue to provide ample risk for future losses.
0%
10%
20%
30%
40%
50%
60%
70%
0
20
40
60
80
100
120
140
160
180
200
2003 2004 2005 2006 2007 2008 2009 2010 2011 2012 2013
% C
over
ed B
y In
sura
nce
USD
Bill
ion
(201
3)
Economic Loss Insured Loss % Coverage
Source: Aon Benfield Analytics
Aon Benfield
15
Profitable Growth: Brazil In addition to Aon Benfield’s annual Insurance Risk Study, we will release a series of market reports that delve into more detail on a country by country basis and outlines potential opportunities for growth. Aon Benfield’s September 2013 China P&C Insurance and Reinsurance Market Report can be found at http://thoughtleadership.aonbenfield.com and below is an abridged version of the Brazil P&C Insurance and Reinsurance Market report to be released in Q1 2014.
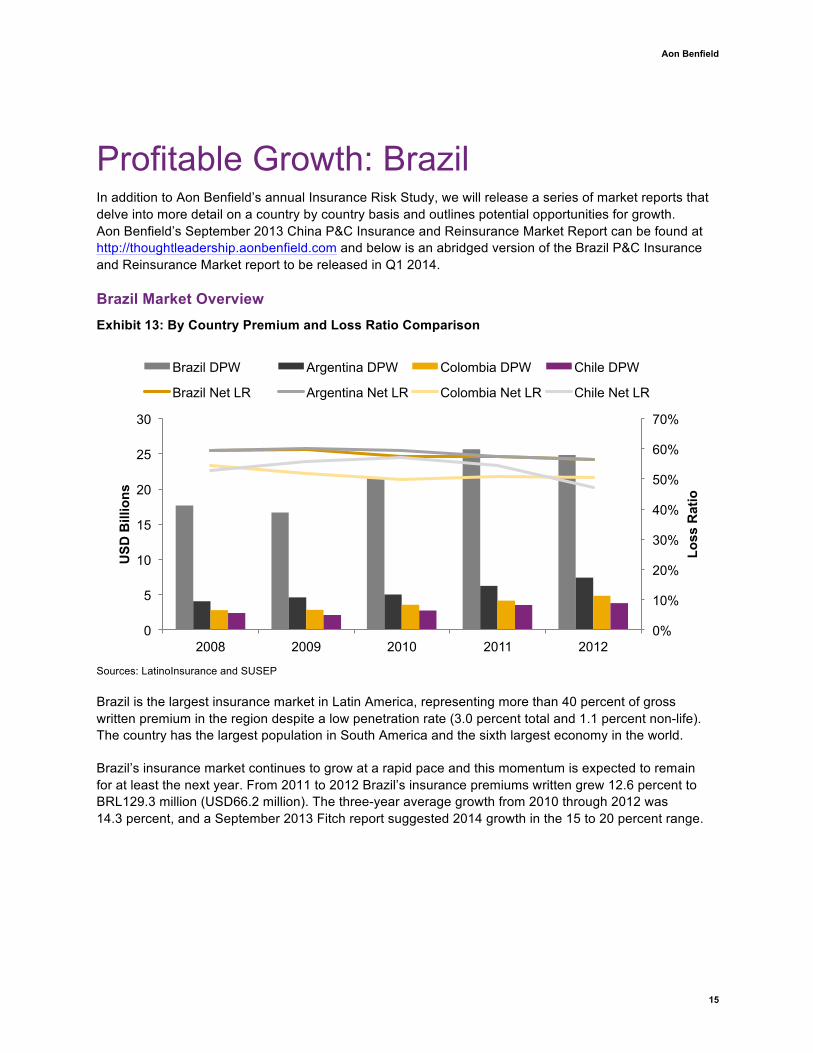
Brazil Market Overview Exhibit 13: By Country Premium and Loss Ratio Comparison
Sources: LatinoInsurance and SUSEP
Brazil is the largest insurance market in Latin America, representing more than 40 percent of gross written premium in the region despite a low penetration rate (3.0 percent total and 1.1 percent non-life). The country has the largest population in South America and the sixth largest economy in the world.
Brazil’s insurance market continues to grow at a rapid pace and this momentum is expected to remain for at least the next year. From 2011 to 2012 Brazil’s insurance premiums written grew 12.6 percent to BRL129.3 million (USD66.2 million). The three-year average growth from 2010 through 2012 was 14.3 percent, and a September 2013 Fitch report suggested 2014 growth in the 15 to 20 percent range.
0%
10%
20%
30%
40%
50%
60%
70%
0
5
10
15
20
25
30
2008 2009 2010 2011 2012
Loss
Rat
io
USD
Bill
ions
Brazil DPW Argentina DPW Colombia DPW Chile DPW
Brazil Net LR Argentina Net LR Colombia Net LR Chile Net LR
Reinsurance Market Outlook
16
From a demand perspective, there are a number of catalysts for the growth, namely Brazil’s infrastructure development in advance of the 2014 FIFA World Cup (estimated at USD17 billion) and 2016 Olympics (estimated at USD60 billion). Both surety and professional lines insurance are benefiting from this development. Additionally, Brazil’s middle class is expanding, similar to many other Latin American countries, resulting in growth for personal lines insurance such as homeowners, extended warranty and other credit-related insurance. The middle class expansion is also impacting commercial lines as there is a growing appreciation for business-related products. These growth drivers are coupled with current low penetration rates across the country. Further, Brazil recently discovered vast natural oil reserves offshore, which should result in growth in related insurance lines.
On the supply side, Brazil’s limited exposure to catastrophe risks such as earthquakes and hurricanes result in the country being a diversified risk within the region for many of the global market players.
Brazil is a relatively concentrated market, with the top five companies controlling 41 percent of the market and the top ten controlling 60 percent, as of 2012. Bancassurance is the predominant life and homeowners model in Brazil, noting that the insurance subsidiaries of the top five public and private banking groups control much of the market. According to Fitch, approximately 90 percent of life premiums were distributed via this channel in 2012. The personal auto and commercial market is dominated by intermediaries, noting there were over 70,000 brokers operating in the country as of year-end 2012. Of this total, 46,000 were individuals, largely serving the personal auto and small and mid-market commercial sectors.
Brazil’s overall insurance market penetration of 3.0 percent is well below that of Chile (4.2 percent) and just slightly ahead of Argentina’s rate of 2.7 percent. As the education of the Brazilian consumer regarding the benefits of insurance continue, significant opportunities for expansion of insurance coverage will emerge.
Brazils’ real five year GDP growth was 4.9 percent as of 2012 and GDP per capital on a PPP basis was USD 11,875. Unemployment is hovering around 5.5 percent, which has declined slightly from 6.0 percent in 2011. Solid premium growth reflects historically low unemployment rates that have been supporting consumption and stable disposable income. Given an inflation rate of 5.4 percent, the real growth rate of the sector was very strong.
Underwriting Analysis Based on Aon Benfield’s 2013 Insurance Risk Study analysis Brazil ranked as a high growth and loss ratio outperformer in motor, property and liability as well as on an all lines combined ratio basis. This was determined by examining the five year annualized premium growth and five year cumulative loss ratio performance by country across motor, property and liability lines of business as well as premium growth and five year annualized combined ratio performance by country for all lines1.
1 Countries with premium growth values greater than 7.5 percent are classified as high growth. Each country’s loss ratio performance is compared against its income level peers, using a USD 30,000 GDP per capita split between high income and low income companies; whereas, combined ratio performance is compared against the global combined ratio. Countries with five year loss ratios lower than the average of their income peers or combined ratios below the global combined ratio are classified as out performers.
Aon Benfield
17
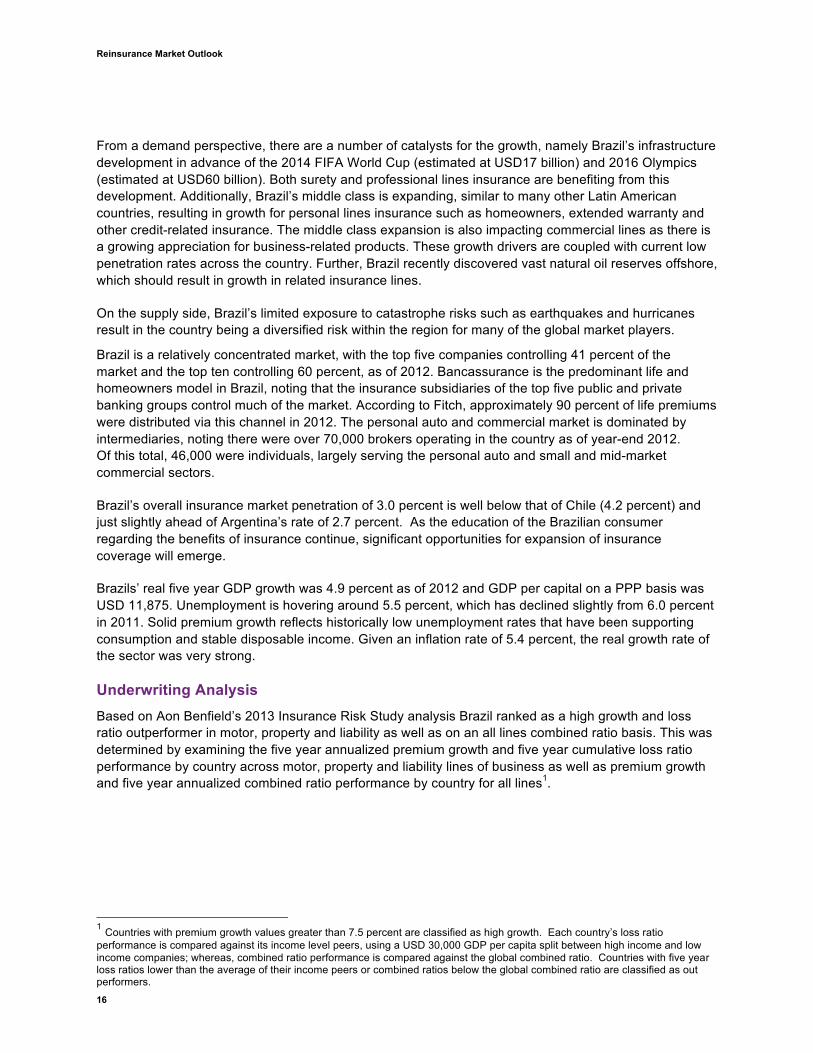
Exhibit 14: Brazil P&C DPW Growth and Profitability
Sources: LatinoInsurance and SUSEP
P&C premium in Brazil has grown annually on average by 12.0 percent over the last five years and has accelerated in the last three years growing by 14.2 percent on average each year. Profitability across all P&C lines has been fairly stable, and trending just slightly downward, with a 10-year average combined ratio of 79.6 percent and 3-year average combined of 78.7 percent. Similarly, losses followed 58.7 percent and 57.1 percent for the 10-year average and 3-year average, respectively.
0%
10%
20%
30%
40%
50%
60%
70%
80%
90%
0
5
10
15
20
25
30
2002 2003 2004 2005 2006 2007 2008 2009 2010 2011 2012
Prof
itabi
lity
Rat
ios
USD
Bill
ions
P&C DPW Loss Ratio Combined Ratio
Reinsurance Market Outlook
18
Property
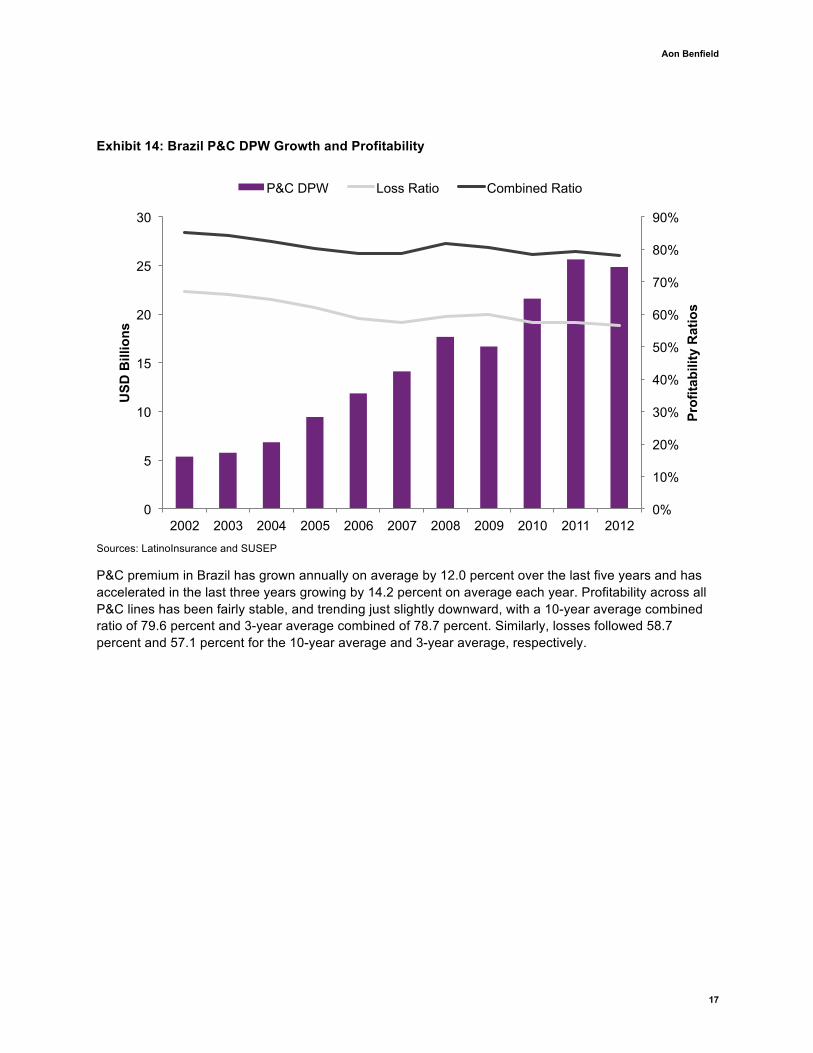
Exhibit 15: Brazil Property Premium and Loss Ratios
Sources: LatinoInsurance and SUSEP
Commercial Approximately 75 percent of commercial premium comes from large accounts, and the remaining 25 percent is spread between small and medium enterprises. Large commercial activity is predominately concentrated around the largest municipalities: Sao Paulo, Rio de Janeiro and Belo Horizonte, which are all located in the Southeastern region of the country. Brazil had 33 companies on Forbes’ Global 2000 List ranging in market value from USD2 to190 billion, a majority of which operate in the oil & gas, utilities and financial industries.
Commercial insurance premium (USD3.8 billion in 2012), which consists of Fire, Multirisk, Theft, Business Interruption and Agriculture, has experienced 14 percent growth on average annually 2009-2012. Fire and Multirisk are the largest components at 87 percent of premium and have grown over the last three years on average 10 to 15 percent.
Commercial lines loss ratios have been downward trending since 2002. The 10-year weighted average loss ratios (37.0 percent) and 3-year average (33.9 percent) reflect this trend, which could be a factor of rates for large accounts meeting global standards. Being fairly unexposed to major natural catastrophes, with the occasional exception of flooding, Brazil’s major property losses come from fires and accidents. Recent major losses include the tragic nightclub fire in January 2013 and a slaughterhouse fire in 2009 (insured loss of USD200 million). Another major cause of loss includes mid-construction building collapses—notably the November 2013 Sao Paulo soccer stadium collapse, a mid-construction Sao Paulo building collapse in August 2013 that killed 10 and the January 2012 Rio commercial office collapse that killed 17.
Homeowners The Brazilian homeowners’ insurance market is approximately USD900 million and has grown on average each year by 26 percent since 2007. As Brazil’s middle class continues to grow, the homeowners’ market will simultaneously develop as more home buyers require insurance with their mortgages. Mortgage loans have increased five times between 2009 and 2012 while average housing prices have also increased (14 percent in 2012). The national poverty rate has continued decline (2005: 30.8 percent of Brazil’s population living below the national poverty line 2009: 21.4 percent).
The homeowners’ loss ratio has been fairly stable over the last 10 years averaging 36.1 percent. Brazil is not strongly litigious, so most homeowners’ claims are due to property losses, specifically theft.
0%
20%
40%
60%
80%
0
1
2
3
4
5
2002 2003 2004 2005 2006 2007 2008 2009 2010 2011 2012
Net
Los
s R
atio
USD
Bill
ions
Commercial Property DPW Homeowners DPW Commercial Property Net LR Homeowners Net LR
Aon Benfield
19
Auto
Exhibit 16: Auto Premium and Loss Ratios
Sources: LatinoInsurance and SUSEP
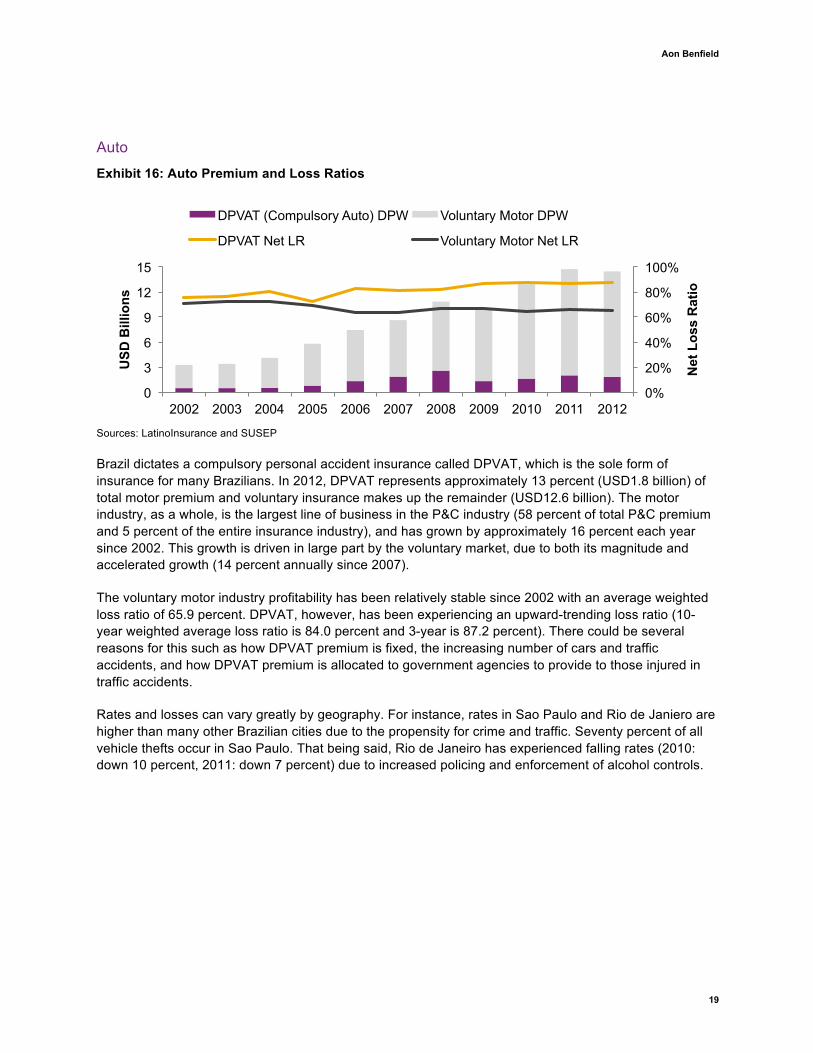
Brazil dictates a compulsory personal accident insurance called DPVAT, which is the sole form of insurance for many Brazilians. In 2012, DPVAT represents approximately 13 percent (USD1.8 billion) of total motor premium and voluntary insurance makes up the remainder (USD12.6 billion). The motor industry, as a whole, is the largest line of business in the P&C industry (58 percent of total P&C premium and 5 percent of the entire insurance industry), and has grown by approximately 16 percent each year since 2002. This growth is driven in large part by the voluntary market, due to both its magnitude and accelerated growth (14 percent annually since 2007).
The voluntary motor industry profitability has been relatively stable since 2002 with an average weighted loss ratio of 65.9 percent. DPVAT, however, has been experiencing an upward-trending loss ratio (10-year weighted average loss ratio is 84.0 percent and 3-year is 87.2 percent). There could be several reasons for this such as how DPVAT premium is fixed, the increasing number of cars and traffic accidents, and how DPVAT premium is allocated to government agencies to provide to those injured in traffic accidents.
Rates and losses can vary greatly by geography. For instance, rates in Sao Paulo and Rio de Janiero are higher than many other Brazilian cities due to the propensity for crime and traffic. Seventy percent of all vehicle thefts occur in Sao Paulo. That being said, Rio de Janeiro has experienced falling rates (2010: down 10 percent, 2011: down 7 percent) due to increased policing and enforcement of alcohol controls.
0%
20%
40%
60%
80%
100%
0
3
6
9
12
15
2002 2003 2004 2005 2006 2007 2008 2009 2010 2011 2012
Net
Los
s R
atio
USD
Bill
ions
DPVAT (Compulsory Auto) DPW Voluntary Motor DPW
DPVAT Net LR Voluntary Motor Net LR
Reinsurance Market Outlook
20
Reinsurance
Exhibit 17: Reinsurance Premium and Loss Ratios
Sources: LatinoInsurance and SUSEP
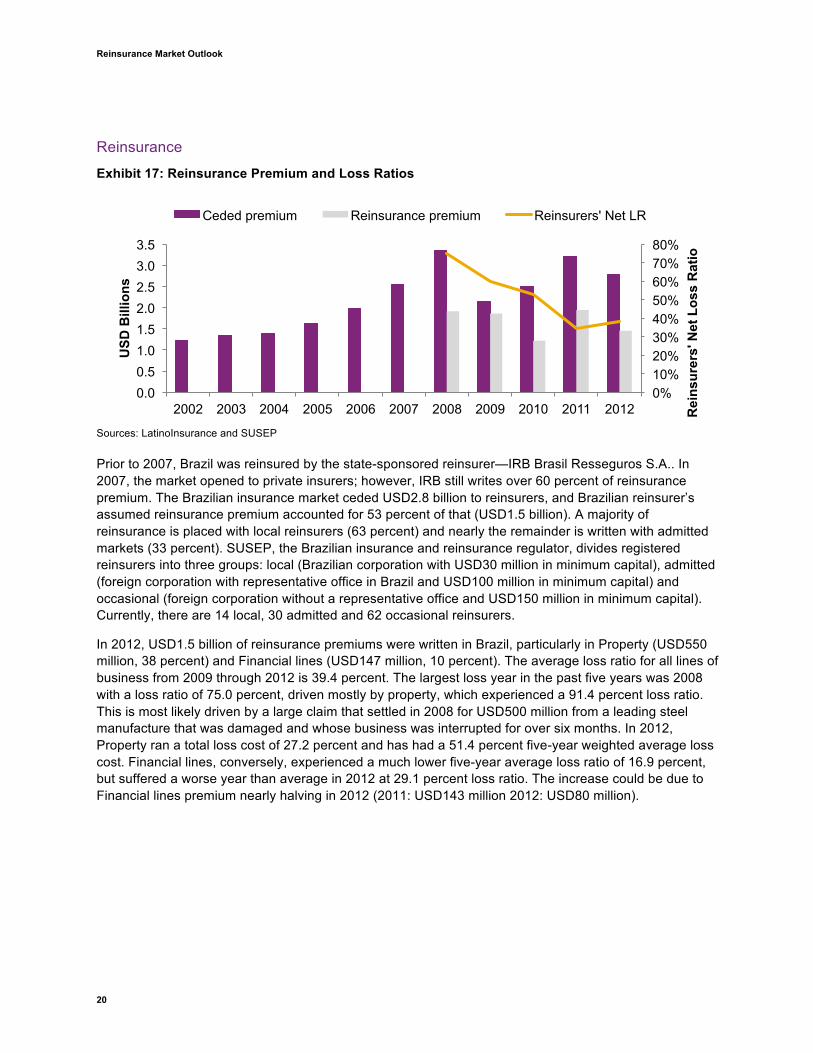
Prior to 2007, Brazil was reinsured by the state-sponsored reinsurer—IRB Brasil Resseguros S.A.. In 2007, the market opened to private insurers; however, IRB still writes over 60 percent of reinsurance premium. The Brazilian insurance market ceded USD2.8 billion to reinsurers, and Brazilian reinsurer’s assumed reinsurance premium accounted for 53 percent of that (USD1.5 billion). A majority of reinsurance is placed with local reinsurers (63 percent) and nearly the remainder is written with admitted markets (33 percent). SUSEP, the Brazilian insurance and reinsurance regulator, divides registered reinsurers into three groups: local (Brazilian corporation with USD30 million in minimum capital), admitted (foreign corporation with representative office in Brazil and USD100 million in minimum capital) and occasional (foreign corporation without a representative office and USD150 million in minimum capital). Currently, there are 14 local, 30 admitted and 62 occasional reinsurers.
In 2012, USD1.5 billion of reinsurance premiums were written in Brazil, particularly in Property (USD550 million, 38 percent) and Financial lines (USD147 million, 10 percent). The average loss ratio for all lines of business from 2009 through 2012 is 39.4 percent. The largest loss year in the past five years was 2008 with a loss ratio of 75.0 percent, driven mostly by property, which experienced a 91.4 percent loss ratio. This is most likely driven by a large claim that settled in 2008 for USD500 million from a leading steel manufacture that was damaged and whose business was interrupted for over six months. In 2012, Property ran a total loss cost of 27.2 percent and has had a 51.4 percent five-year weighted average loss cost. Financial lines, conversely, experienced a much lower five-year average loss ratio of 16.9 percent, but suffered a worse year than average in 2012 at 29.1 percent loss ratio. The increase could be due to Financial lines premium nearly halving in 2012 (2011: USD143 million 2012: USD80 million).
0% 10% 20% 30% 40% 50% 60% 70% 80%
0.0 0.5 1.0 1.5 2.0 2.5 3.0 3.5
2002 2003 2004 2005 2006 2007 2008 2009 2010 2011 2012 Rei
nsur
ers'
Net
Los
s R
atio
USD
Bill
ions
Ceded premium Reinsurance premium Reinsurers' Net LR
Aon Benfield
21
Regulatory SUSEP has been very active in recent years working to modernize the regulatory framework. In recent months SUSEP introduced a number of significant changes. First, they introduced criteria for the calculation of risk capital for operational risks, which supplement the existing regulations on credit and underwriting risks. These resolutions also now extend capital requirements to life, pensions and capitalization companies. The new solvency requirement is expected to lead to more consolidation among local insurers due to more stringent capital requirements.
Second, SUSEP authorized insurance companies, local reinsurers and pension providers to hold equity interests in foreign insurance companies, private pensions, reinsurance companies or any other similar entities. This is a change from the previous resolution, in which insurers were not allowed to invest in foreign entities.
Thirdly, SUSEP is adopting a more gradual transition into Solvency II type regulation rather than implement as a framework as originally planned. As part of this process, SUSEP has decided to implement its rules and directives to manage each risk category individually. This approach is due to the different levels of maturity of the market players, and the investment constraints that could arise if a framework approach is implemented.
Finally, SUSEP introduced criteria related to internal capital models and corresponding capital requirements. For the calculation of underwriting risk, those companies with an internal capital model approved by SUSEP will be allowed to use “reduced risk factors”. Insurers without an internal capital model must use “standard risk factors” to calculate the underwriting risk. Therefore, insurers with an approved internal capital model will benefit the most since the required risk capital will be reduced using the lower factors. This approach taken by the regulators in Mexico and Brazil will propose a more proactive role for insurers in monitoring its capital requirements and work to enhance overall risk management by companies.
Conclusion
The Brazil insurance market continues to expand and currently does not show signs of abating, though there are suggestions of a possible slow down due to an increase in political unrest as evidence of government protectionism emerges and uncertainty around the upcoming general election persists. Nonetheless, many companies have opened up local branches in Brazil and many more are currently exploring the market opportunity. Key lines of business, namely motor, property and reinsurance, remain profitable, and a relative lack of catastrophe exposure make Brazil a diversifying play for many companies seeking growth in the Latin American market. Aon Benfield looks forward to releasing a comprehensive report of the Brazilian insurance market in the coming quarter.
Reinsurance Market Outlook
22
Rating Agency and Regulatory Update Impact on Reinsurance Demand = Slight Increase
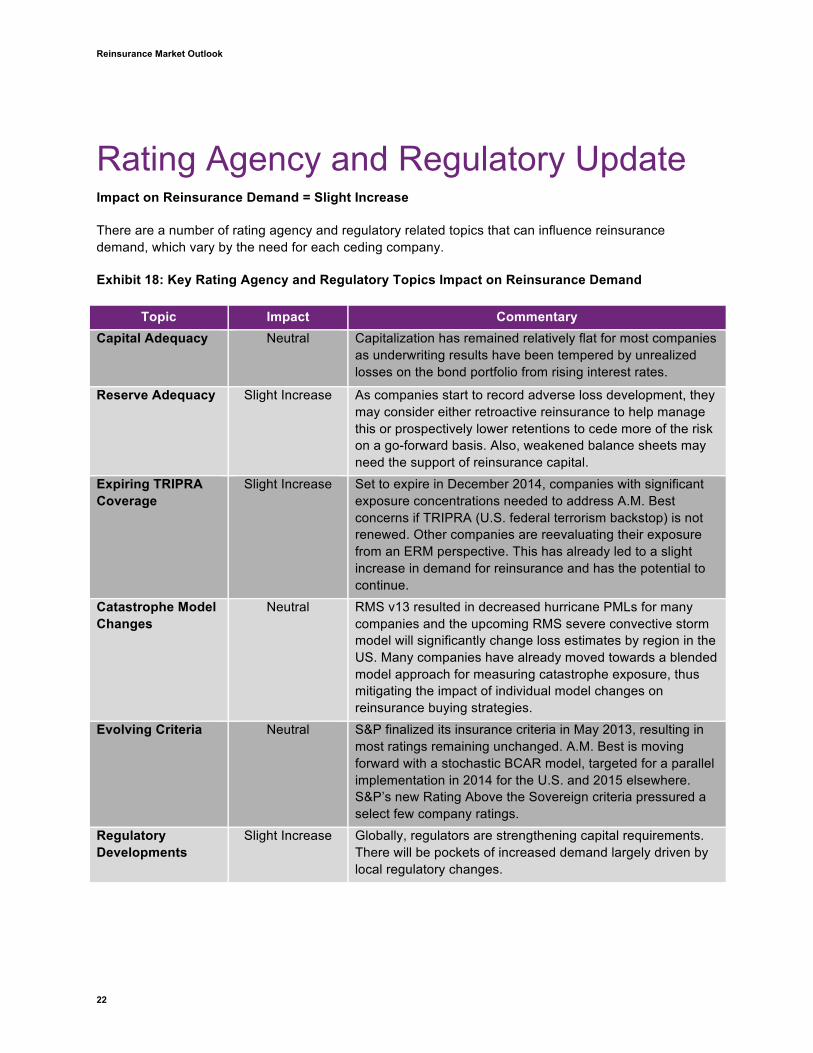
There are a number of rating agency and regulatory related topics that can influence reinsurance demand, which vary by the need for each ceding company.
Exhibit 18: Key Rating Agency and Regulatory Topics Impact on Reinsurance Demand
Topic Impact Commentary Capital Adequacy Neutral Capitalization has remained relatively flat for most companies
as underwriting results have been tempered by unrealized losses on the bond portfolio from rising interest rates.
Reserve Adequacy Slight Increase As companies start to record adverse loss development, they may consider either retroactive reinsurance to help manage this or prospectively lower retentions to cede more of the risk on a go-forward basis. Also, weakened balance sheets may need the support of reinsurance capital.
Expiring TRIPRA Coverage
Slight Increase Set to expire in December 2014, companies with significant exposure concentrations needed to address A.M. Best concerns if TRIPRA (U.S. federal terrorism backstop) is not renewed. Other companies are reevaluating their exposure from an ERM perspective. This has already led to a slight increase in demand for reinsurance and has the potential to continue.
Catastrophe Model Changes
Neutral RMS v13 resulted in decreased hurricane PMLs for many companies and the upcoming RMS severe convective storm model will significantly change loss estimates by region in the US. Many companies have already moved towards a blended model approach for measuring catastrophe exposure, thus mitigating the impact of individual model changes on reinsurance buying strategies.
Evolving Criteria Neutral S&P finalized its insurance criteria in May 2013, resulting in most ratings remaining unchanged. A.M. Best is moving forward with a stochastic BCAR model, targeted for a parallel implementation in 2014 for the U.S. and 2015 elsewhere. S&P’s new Rating Above the Sovereign criteria pressured a select few company ratings.
Regulatory Developments
Slight Increase Globally, regulators are strengthening capital requirements. There will be pockets of increased demand largely driven by local regulatory changes.
Aon Benfield
23
Ratings Stabilized, But Adverse Loss Development Emerging
Ratings stabilized in 2013 as upgrades outpaced downgrades from A.M. Best and S&P for the first time in three years. In addition, the rating agencies maintain a generally stable view of the U.S. insurance industry as evidenced by the current outlooks published by the four global rating agencies. Unfortunately, rating agencies do not consistently publish outlooks for other regions. Moody’s recently revised the U.S. Life Industry outlook from negative to stable based upon expectations of gradually increasing interest rates and an improving economy. A.M. Best carries a negative outlook on the commercial lines due to insufficient pricing for a number of years and eroding reserve redundancies, with some notable adverse loss development reported in 2013.
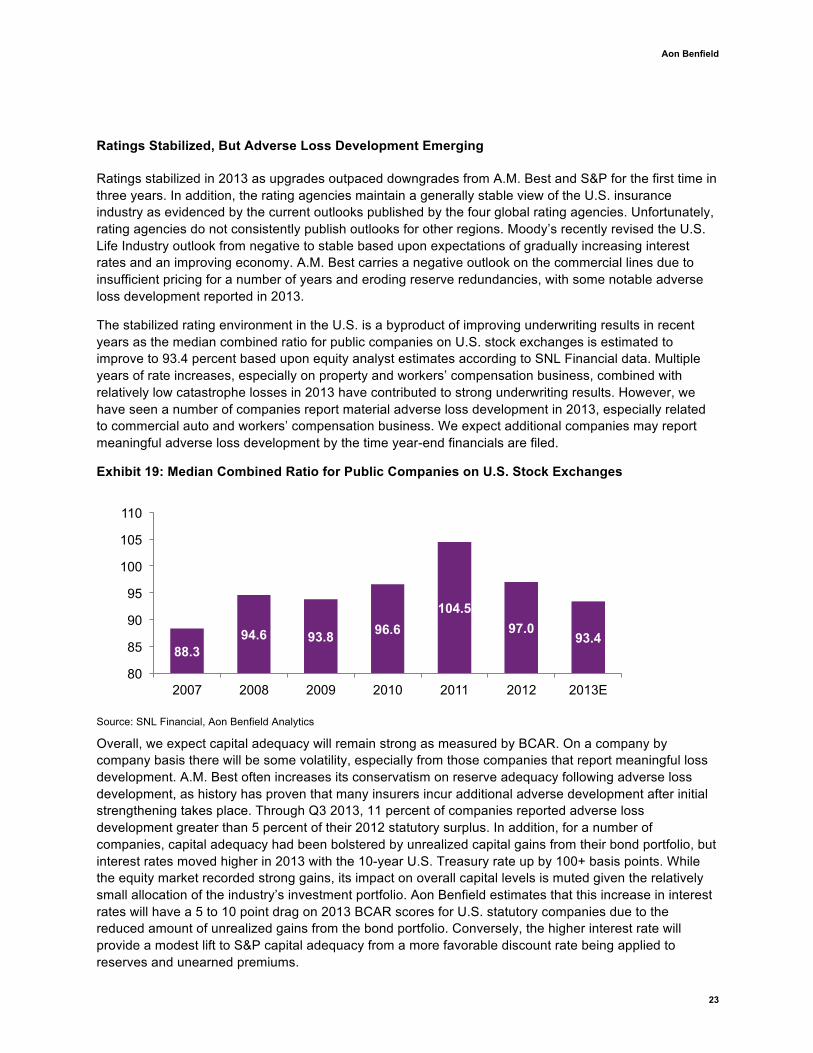
The stabilized rating environment in the U.S. is a byproduct of improving underwriting results in recent years as the median combined ratio for public companies on U.S. stock exchanges is estimated to improve to 93.4 percent based upon equity analyst estimates according to SNL Financial data. Multiple years of rate increases, especially on property and workers’ compensation business, combined with relatively low catastrophe losses in 2013 have contributed to strong underwriting results. However, we have seen a number of companies report material adverse loss development in 2013, especially related to commercial auto and workers’ compensation business. We expect additional companies may report meaningful adverse loss development by the time year-end financials are filed.
Exhibit 19: Median Combined Ratio for Public Companies on U.S. Stock Exchanges
Source: SNL Financial, Aon Benfield Analytics
Overall, we expect capital adequacy will remain strong as measured by BCAR. On a company by company basis there will be some volatility, especially from those companies that report meaningful loss development. A.M. Best often increases its conservatism on reserve adequacy following adverse loss development, as history has proven that many insurers incur additional adverse development after initial strengthening takes place. Through Q3 2013, 11 percent of companies reported adverse loss development greater than 5 percent of their 2012 statutory surplus. In addition, for a number of companies, capital adequacy had been bolstered by unrealized capital gains from their bond portfolio, but interest rates moved higher in 2013 with the 10-year U.S. Treasury rate up by 100+ basis points. While the equity market recorded strong gains, its impact on overall capital levels is muted given the relatively small allocation of the industry’s investment portfolio. Aon Benfield estimates that this increase in interest rates will have a 5 to 10 point drag on 2013 BCAR scores for U.S. statutory companies due to the reduced amount of unrealized gains from the bond portfolio. Conversely, the higher interest rate will provide a modest lift to S&P capital adequacy from a more favorable discount rate being applied to reserves and unearned premiums.
88.3 94.6 93.8 96.6
104.5 97.0
93.4
80
85
90
95
100
105
110
2007 2008 2009 2010 2011 2012 2013E
Reinsurance Market Outlook
24
Rating Agency Criteria Continues to Evolve
Rating agencies continue to assess and fine-tune rating criteria in response to developing industry trends, with an emphasis on improving their analytical approach and transparency in the process. We summarize key criteria developments in 2013 and changes on the horizon for 2014.
S&P Insurance Ratings Criteria
In May, S&P finalized its Insurance Rating Criteria and updated ratings during the following months. In the end, 91 percent of S&P’s global ratings were affirmed, 7 percent were upgraded and 2 percent were lowered.
Given the increased transparency in S&P’s disclosure of rating factors and subfactors, we analyzed the results of 48 U.S. and Bermuda based P&C companies and noted the following observations:
§ No companies have an “excellent” Business Risk Profile because of the Insurance Industry and Country Risk Assessment of “intermediate risk” for the U.S. P&C business
§ 79 percent have “very strong” Capital & Earnings, but only 37 percent have “very strong” Financial Risk Profile
§ The rating anchor and financial strength rating were the same 63 percent of the time, while the financial strength rating was higher 29 percent and lower 8 percent
§ Only companies with ERM of “strong” or better are rated AA- or higher
S&P Sovereign Risk Criteria
On November 19, 2013, S&P released its finalized methodology outlining under the specific circumstances and by how much an entity’s rating can be above the sovereign rating. S&P’s criteria had previously allowed entities in the European Economic & Monetary Union to be rated above their respective sovereign rating. The updated criteria now apply to entities in developed and developing countries alike. An entity can now be rated above the sovereign’s foreign currency rating if S&P believes there is a significant possibility that the entity would not default if the sovereign defaults. For insurers where the sovereign is rated ‘A+’ or lower, a stress test would apply where various asset values exposed to a specific sovereign would be haircut by varying amounts and compared to available regulatory surplus. A liquidity test comparing the stressed asset values to various life and non-life liabilities would also be performed. If the regulatory surplus exceeds the amount of haircuts and the liquidity ratio is above 100 percent, the company would “pass” the test and be allowed to have a rating of up to two (life, health and composite re/insurers) or four (non-life re/insurers) notches above the sovereign. For insurers where the sovereign rating is ‘AA-’ or better, mitigation characteristics against a sovereign stress scenario will be analyzed.
Treatment of Terrorism Risk Insurance Program Act (TRIPRA) Expiring
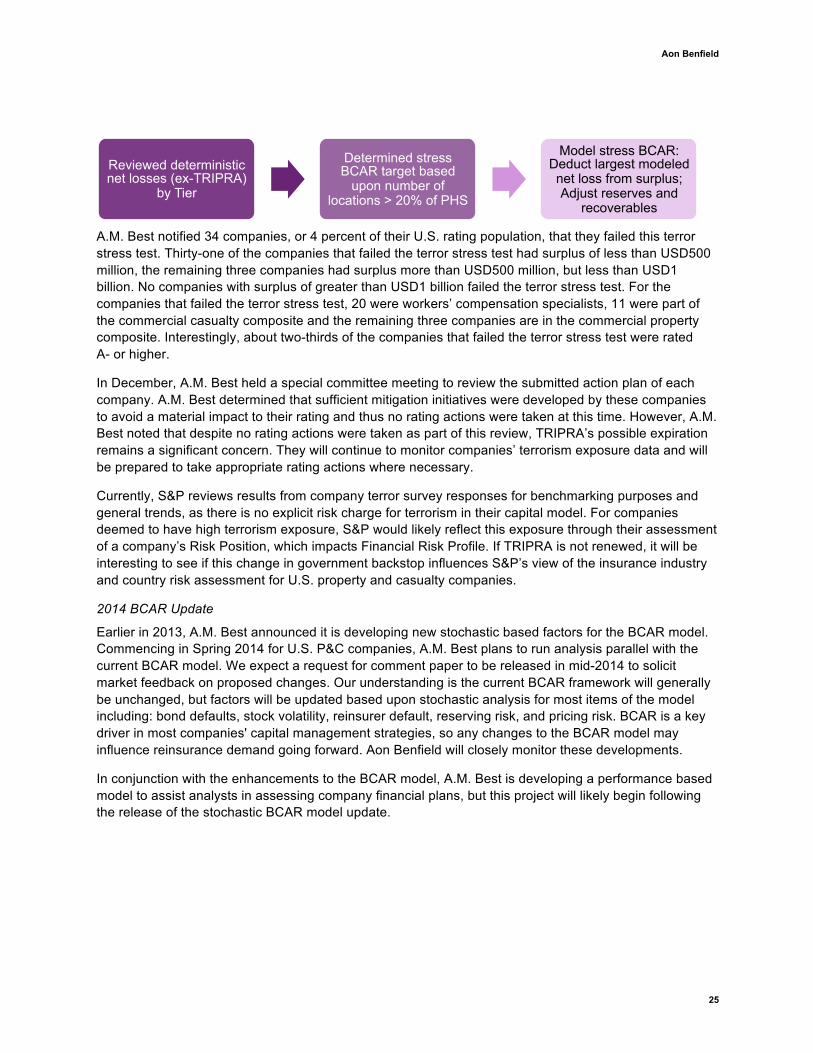
On October 9, 2013, A.M. Best released a briefing regarding the expiration of TRIPRA and a report discussing their current terrorism methodology. In conjunction with these documents, A.M. Best utilized a terror stress test to measure the balance sheet impact of terrorism losses to companies. The terror stress test specifically looks at a 5-ton truck bomb deterministic loss scenario – net of reinsurance but gross of TRIPRA recoveries. The following diagram highlights the process A.M. Best went through to analyze companies in determining whether they were over-reliant on TRIPRA.
Aon Benfield
25
A.M. Best notified 34 companies, or 4 percent of their U.S. rating population, that they failed this terror stress test. Thirty-one of the companies that failed the terror stress test had surplus of less than USD500 million, the remaining three companies had surplus more than USD500 million, but less than USD1 billion. No companies with surplus of greater than USD1 billion failed the terror stress test. For the companies that failed the terror stress test, 20 were workers’ compensation specialists, 11 were part of the commercial casualty composite and the remaining three companies are in the commercial property composite. Interestingly, about two-thirds of the companies that failed the terror stress test were rated A- or higher.
In December, A.M. Best held a special committee meeting to review the submitted action plan of each company. A.M. Best determined that sufficient mitigation initiatives were developed by these companies to avoid a material impact to their rating and thus no rating actions were taken at this time. However, A.M. Best noted that despite no rating actions were taken as part of this review, TRIPRA’s possible expiration remains a significant concern. They will continue to monitor companies’ terrorism exposure data and will be prepared to take appropriate rating actions where necessary.
Currently, S&P reviews results from company terror survey responses for benchmarking purposes and general trends, as there is no explicit risk charge for terrorism in their capital model. For companies deemed to have high terrorism exposure, S&P would likely reflect this exposure through their assessment of a company’s Risk Position, which impacts Financial Risk Profile. If TRIPRA is not renewed, it will be interesting to see if this change in government backstop influences S&P’s view of the insurance industry and country risk assessment for U.S. property and casualty companies.
2014 BCAR Update
Earlier in 2013, A.M. Best announced it is developing new stochastic based factors for the BCAR model. Commencing in Spring 2014 for U.S. P&C companies, A.M. Best plans to run analysis parallel with the current BCAR model. We expect a request for comment paper to be released in mid-2014 to solicit market feedback on proposed changes. Our understanding is the current BCAR framework will generally be unchanged, but factors will be updated based upon stochastic analysis for most items of the model including: bond defaults, stock volatility, reinsurer default, reserving risk, and pricing risk. BCAR is a key driver in most companies' capital management strategies, so any changes to the BCAR model may influence reinsurance demand going forward. Aon Benfield will closely monitor these developments.
In conjunction with the enhancements to the BCAR model, A.M. Best is developing a performance based model to assist analysts in assessing company financial plans, but this project will likely begin following the release of the stochastic BCAR model update.
Reviewed deterministic net losses (ex-TRIPRA)
by Tier
Determined stress BCAR target based
upon number of locations > 20% of PHS
Model stress BCAR: Deduct largest modeled net loss from surplus; Adjust reserves and
recoverables
Reinsurance Market Outlook
26
Regulatory Developments on the Horizon
Solvency II Update
At a November 13 meeting between the European Parliament, European Committee, and European Council, key issues holding back the Omnibus II negotiations for Solvency II implementations were discussed and agreed upon. Further Omnibus II proposals can now be voted upon in early 2014 and if passed, could pave the way for Solvency II to be implemented starting on January 1, 2016. The key issues discussed were related to capital requirements for long-term guarantee products, equivalence with non-EEA countries and transitional arrangements. The capital requirements for long-term guarantee are now more favorable and the provisional equivalence for insurers in the U.S. and other countries means that insurers and reinsurers in Europe will not be at a competitive disadvantage for at least the next ten years. The agreement was met with positive response from the rating agencies as they had seen some companies rein back their efforts in implementing more robust risk management frameworks due to a Solvency II “fatigue” effect.
APAC
To better manage risks to help foster the industry, regulators in this region are enhancing regulations to monitor insurers’ capital adequacy in order to better align themselves with global best practices. The trend of RBC adoption continued as China and Hong Kong made solid progress to upgrade their solvency regimes.
Earlier this year, China Insurance Regulatory Commission (CIRC) issued “the Overall Framework of the Second-Generation Solvency Supervision System in China”, which set the objectives and framework and determined the technical guidelines. The second-generation solvency regime, officially named China Risk Oriented Solvency System (C-ROSS), has a three-pillar structure—quantitative capital requirements, qualitative regulatory requirements or risk management, and market discipline or information disclosure. According to CIRC, the details of C-ROSS will not be available until the end of 2014. In the last 12 months, the CIRC has also issued multiple new regulations aimed at easing restrictions of investment and pricing. More investment channels and classes are now allowed, which may help insurers improve their financial performance.
In Hong Kong, where the current solvency requirement has a limited ability to appropriately reflect the risks insurers face, the regulator, OCI, has hired an external consultant to help produce an RBC framework for OCI to implement in approximately 2016. In addition, the initiative of establishing an Independent Insurance Authority has passed the consultation stage. This authority, anticipated to be in place in 2015, may help facilitate market innovation and sustainable development while enhancing regulatory activities.
Meanwhile, in markets where RBC has been in place for some time, continuous improvement is being made. For example, in early 2009 the Australian Prudential Regulation Authority (APRA) initiated the Life and General Insurance Capital Review project, which has strong parallels to Solvency II. The new prudential standards became effective on January 1, 2013, and these have greatly enhanced the risk management practices by considering more risk types and adopting sophisticated calculation techniques.
Aon Benfield
27
For general insurers, the most significant enhancement is to the insurance concentration risk charge (ICRC), which is the amount of capital to be held against the concentration of insurance risk, generally driven by natural disasters. The old ICRC requirement did not consider the risk that an insurer’s capital position can be adversely affected over the year by the occurrence and aggregation of a number of smaller sized loss events, including the cost of purchasing additional reinstatements of reinsurance cover. The enhanced ICRC requirement features a horizontal requirement for exposures to natural perils and is intended to address this weakness. Based on the quantitative impact study performed, APRA estimates that the revision of the capital standards will reduce the overall level of solvency coverage as the general insurance industry would see an overall increase in capital requirements.
Latin America
The regulatory trend in Latin America is moving toward adoption of Solvency II type regime. During 2013, major insurance markets in the region passed laws or draft legislation that contemplates Solvency II regulation and risk based capital requirements. Brazil is taking a more gradual shift and address each risk component individually rather than adopting a regulatory framework. For this purpose, the Brazilian regulator has passed resolution 280, 282 and 283 in February 2013 which provides new minimum capital requirements for insurance, reinsurance, pension and capitalization (asset management) companies. These resolutions supplement capital requirements for underwriting risk; provide new formula for calculation of minimum required capital and operational risks. Resolution 282 is currently being amended to be reissued at a later date.
Mexico has taken a more drastic approach, choosing to integrate regulatory changes as a framework. The Mexican insurance regulatory authority (CNSF) passed Law of Insurance and bonding institution on April 2013, which incorporates sweeping changes to the regulatory framework. The objective of the law is to strengthen the legislative framework of the insurance and surety companies. The new regulation will require insurers to develop its own investment strategy, disclose financial situation, risk profile, and capitalization level. Companies will require being more proactive in developing its own risk management program.
United States
The NAIC Capital Adequacy Task Force approved changes to the 2013 risk based capital (RBC) report, which will include two new risk charges for catastrophic events. Beginning December 31, 2013, a charge for catastrophe risks (R6 and R7) is required as part of the RBC calculation on an information only basis. These charges are for Earthquake and Hurricane (100 year return period, aggregate perspective) only, and other catastrophe risks are excluded. The catastrophe risk charge will also incorporate a credit risk charge for ceded losses excluding recoveries from mandatory pools and affiliates, as well as a reduction in the premium capital factor to avoid double counting of catastrophe losses. The exclusion of mandatory pools can be significant for Florida companies as the FHCF is considered a mandatory pool. After examining the reported catastrophe loss data and its effect on RBC, the risk charge is expected to be fully integrated into the RBC formula in 2015 or 2016.
Reinsurance Market Outlook
28
M&A Activity Update Merger and acquisition (M&A) activity in the global insurance and reinsurance market declined in 2013. According to Capital IQ, global insurance sector M&A deal volume in 2013 totaled USD15.3 billion2, versus USD18.8 billion in 2012, a decrease of approximately 18.6 percent.
Over the past six months, recognition of underpricing and reserving due to excess growth in poor market conditions has initiated a number of “challenged company” M&A transactions. Over the longer term, we believe that M&A activity will expand into a broader set of insurers in order to address anemic growth, excess capital, increased alternative capital competition and the resulting inability for many insurers and reinsurers to earn their cost of capital.
Many of the same themes reported in the last M&A Activity Update continue to exist today, namely:
§ Insurer and reinsurer stock price performance has been strong, tracking the broader equity markets. As summarized in the ABS Weekly Public Market Recap3, most global insurers and reinsurers have enjoyed relatively robust stock price appreciation this year. This stock price performance has been greater than 25 percent for each of the major P&C insurance and reinsurance indices, with several indices above 30 percent.
§ The resulting tangible book value multiples have returned to pre-crisis levels. For many insurers and reinsurers, especially specialty commercial (1.51x)4 and personal line insurers (1.91x)3, the recent stock price appreciation has elevated TBV multiples to levels not experienced for several years.
§ The generally favorable pricing environment has been offset by increased alternative capital competition in catastrophe reinsurance. While commercial insurers and reinsurers have continued to achieve rate increases in most lines of business, the alternative capital’s dramatic increase in property cat reinsurance has and will continue to impact the traditional markets’ premiums and capital allocation. Many reinsurers are attempting to manage third party capital to ameliorate this impact.
§ Continued interest exists in specialty managing general underwriters (MGUs), wholesalers and fee for service providers. Both strategic and private equity investors continue to demonstrate interest in acquiring distribution sources and services providers, including third party capital managers.
§ Hedge funds continue to develop permanent capital vehicles. Despite the challenges with SAC Re, hedge funds and private equity investors continue to appreciate the strategic rationale in establishing off-shore reinsurers. These vehicles provide the hedge fund with a permanent asset base and fund investors with a more tax efficient investment vehicle along with the potential for greater future liquidity.
Over the near term, Aon Benfield Securities expects strategic investors to pursue consolidation in a focused “bolt-on” approach expanding into new geographies or products via acquisitions of underwriting teams or specialty units. Over the medium to longer-term, however, we expect the need to grow and improve returns via traditional whole-company M&A will intensify. 2 Based on publicly disclosed deal values in the global insurance brokerage, property and casualty insurance and reinsurance subsectors. 3 Aon Benfield Securities Weekly Public Market Recap is prepared and distributed to Aon Benfield clients each week. Please call your Aon Benfield representative to be added to the distribution list. 4 Price to 9/30 Tangible Book Value multiple as of December 27, 2013.
Aon Benfield
29
Economic and Financial Market Update The global economy The recovery in global growth in 2013 was gradual, and this trend is expected to continue through 2014. A pick-up in consumer spending, business investment and housing construction provided a stimulus in the U.S. but growth in emerging markets experienced something of a setback in the middle of the year as economies were unsettled by fears the U.S. Federal Reserve would taper its asset repurchase program sooner than expected. While Europe appears to have pulled out of recession, growth remains hampered by austerity measures, private deleveraging and tight credit conditions, especially in the so-called peripheral economies. Nevertheless, leading economic indicators, such as Purchasing Managers Indices, have risen to the growth range. Despite a sharp mid-year rise, yields on government bonds remain low in historical terms and are expected to remain so through 2014. Inflation is currently under control but remains a longer term risk as governments address deficits.
According to the International Monetary Fund (IMF)5, there has been a rebalancing in global growth projections, weakening in emerging markets while picking up in the advanced economies, notably the U.S. and Japan. Structural bottlenecks in infrastructure, labor markets, and investment have combined with a natural cooling following stimulus and contributed to slowdown in many emerging markets. The IMF observed private demand and a recovering housing market were factors behind economic growth in the U.S. It also pointed to the policy actions in Europe which have reduced major risks and stabilized financial conditions and to Japan’s new “abenomics” policy package of fiscal stimulus and monetary easing which has generated a strong rebound in economic activity, although this will be constrained by planned tax rises in 2014. China’s growth has slowed from double digits to a projected 7.6 percent as its political leaders move towards a more balanced and sustainable growth path. Emerging markets and developing economies present a mixed picture with generally solid domestic demand, recovering exports, and supportive fiscal, monetary and financial conditions, while geopolitical uncertainties are expected to hold back some economies, notably in the Middle East and North Africa, Afghanistan, and Pakistan.
The IMF is currently projecting a 2.9 percent rise in global GDP for 2013, having pared back its July 2013 forecast by 0.3 percentage points. The forecast remains below the 3.2 percent recorded in 2012, but growth of 3.6 percent is projected for 2014, driven by the advanced economies. However, the IMF has cautioned that downside risks still dominate this positive scenario, noting the risks in the emerging market economies as well as the resurfacing of geopolitical risks. Worries for the stability of the euro area have abated but the problems have not been fully resolved, including high levels of government indebtedness and related fiscal and financial risks.
5 IMF World Economic Outlook, October 7, 2013
Reinsurance Market Outlook
30
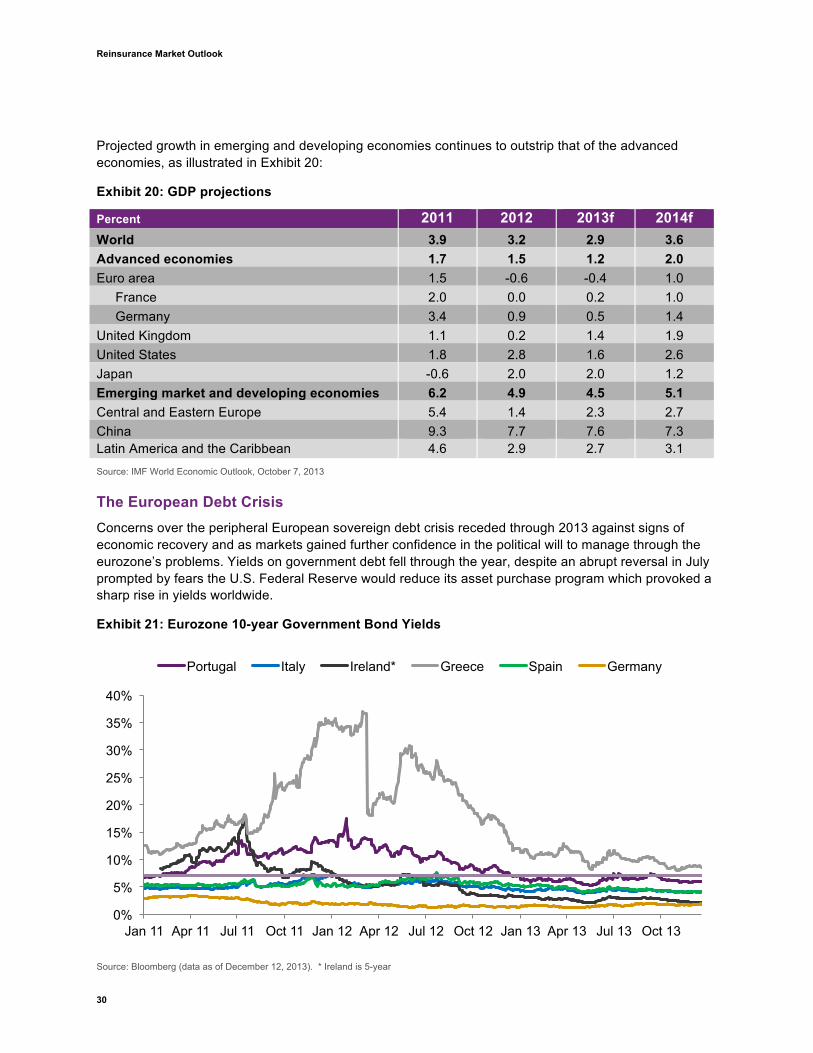
Projected growth in emerging and developing economies continues to outstrip that of the advanced economies, as illustrated in Exhibit 20:
Exhibit 20: GDP projections
Percent 2011 2012 2013f 2014f World 3.9 3.2 2.9 3.6 Advanced economies 1.7 1.5 1.2 2.0 Euro area 1.5 -0.6 -0.4 1.0
France 2.0 0.0 0.2 1.0 Germany 3.4 0.9 0.5 1.4
United Kingdom 1.1 0.2 1.4 1.9 United States 1.8 2.8 1.6 2.6 Japan -0.6 2.0 2.0 1.2 Emerging market and developing economies 6.2 4.9 4.5 5.1 Central and Eastern Europe 5.4 1.4 2.3 2.7 China 9.3 7.7 7.6 7.3 Latin America and the Caribbean 4.6 2.9 2.7 3.1 Source: IMF World Economic Outlook, October 7, 2013
The European Debt Crisis Concerns over the peripheral European sovereign debt crisis receded through 2013 against signs of economic recovery and as markets gained further confidence in the political will to manage through the eurozone’s problems. Yields on government debt fell through the year, despite an abrupt reversal in July prompted by fears the U.S. Federal Reserve would reduce its asset purchase program which provoked a sharp rise in yields worldwide.
Exhibit 21: Eurozone 10-year Government Bond Yields
Source: Bloomberg (data as of December 12, 2013). * Ireland is 5-year
0%
5%
10%
15%
20%
25%
30%
35%
40%
Jan 11 Apr 11 Jul 11 Oct 11 Jan 12 Apr 12 Jul 12 Oct 12 Jan 13 Apr 13 Jul 13 Oct 13
Portugal Italy Ireland* Greece Spain Germany
Aon Benfield
31
While the risk of an imminent crisis has receded, many of the fundamental issues remain unaddressed, and the austerity measures introduced as a condition of European Central Bank assistance have been a drag on economic recovery. Ireland has been the bright spot among the so-called peripheral economies of Spain, Portugal, Italy, Ireland and Greece, exiting the bail-out program in mid-December, as planned, and returning to the private markets for its financing needs.
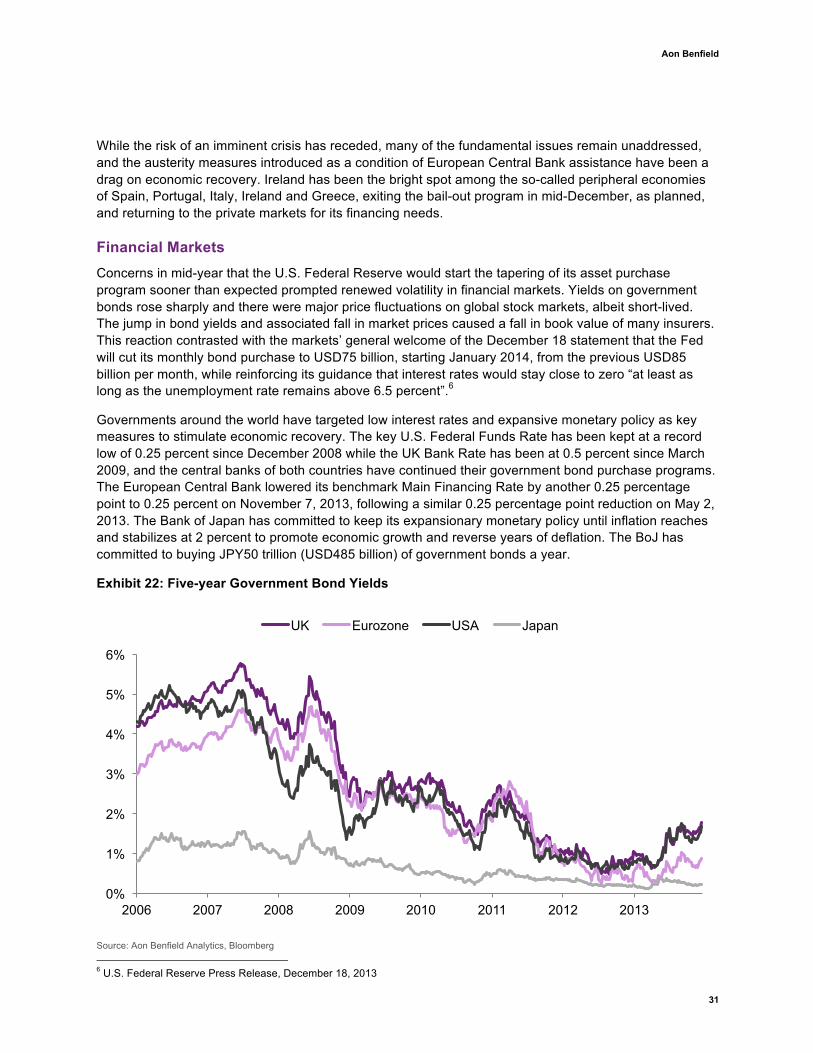
Financial Markets Concerns in mid-year that the U.S. Federal Reserve would start the tapering of its asset purchase program sooner than expected prompted renewed volatility in financial markets. Yields on government bonds rose sharply and there were major price fluctuations on global stock markets, albeit short-lived. The jump in bond yields and associated fall in market prices caused a fall in book value of many insurers. This reaction contrasted with the markets’ general welcome of the December 18 statement that the Fed will cut its monthly bond purchase to USD75 billion, starting January 2014, from the previous USD85 billion per month, while reinforcing its guidance that interest rates would stay close to zero “at least as long as the unemployment rate remains above 6.5 percent”.6
Governments around the world have targeted low interest rates and expansive monetary policy as key measures to stimulate economic recovery. The key U.S. Federal Funds Rate has been kept at a record low of 0.25 percent since December 2008 while the UK Bank Rate has been at 0.5 percent since March 2009, and the central banks of both countries have continued their government bond purchase programs. The European Central Bank lowered its benchmark Main Financing Rate by another 0.25 percentage point to 0.25 percent on November 7, 2013, following a similar 0.25 percentage point reduction on May 2, 2013. The Bank of Japan has committed to keep its expansionary monetary policy until inflation reaches and stabilizes at 2 percent to promote economic growth and reverse years of deflation. The BoJ has committed to buying JPY50 trillion (USD485 billion) of government bonds a year.
Exhibit 22: Five-year Government Bond Yields
Source: Aon Benfield Analytics, Bloomberg 6 U.S. Federal Reserve Press Release, December 18, 2013
0%
1%
2%
3%
4%
5%
6%
2006 2007 2008 2009 2010 2011 2012 2013
UK Eurozone USA Japan
Reinsurance Market Outlook
32
Weak economic conditions and measures to boost the global economy kept government bond yields at historical lows throughout 2012 and these conditions persisted into the first quarter of 2013. Yields rose sharply in late April before stabilizing through the final quarter. Despite the recent increases, insurers and reinsurers face the continued erosion of running yields of their investment portfolios as the reinvestment yield on new bond purchases remains below that on maturing investments.
Starting the year at 0.71 percent, the yield on five-year U.S. Treasuries more than doubled to 1.68 percent by late-December. At the same time, the yield on UK bonds rose from 0.85 percent to 1.77 percent, while that of Eurozone debt was up from 0.30 percent to 0.88 percent. The yield on Japanese bonds started the year at 0.19 percent, rising in April to peak at 0.37 percent before falling back to 0.21 percent.
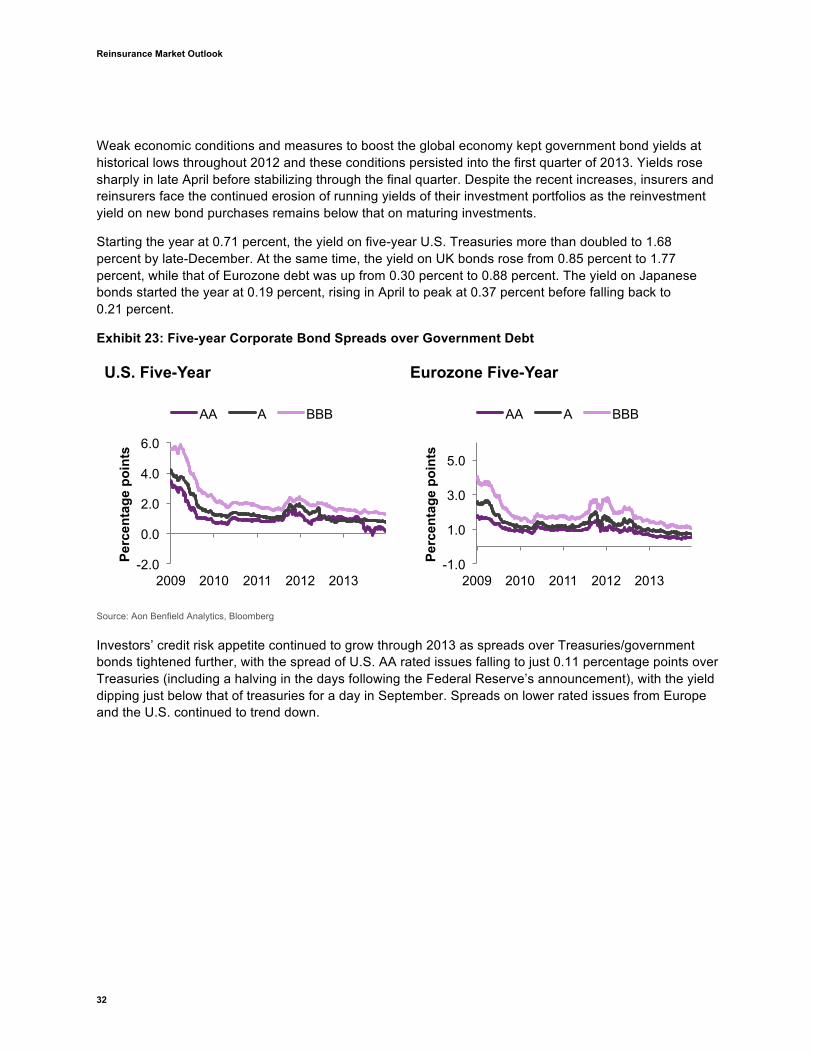
Exhibit 23: Five-year Corporate Bond Spreads over Government Debt
Source: Aon Benfield Analytics, Bloomberg
Investors’ credit risk appetite continued to grow through 2013 as spreads over Treasuries/government bonds tightened further, with the spread of U.S. AA rated issues falling to just 0.11 percentage points over Treasuries (including a halving in the days following the Federal Reserve’s announcement), with the yield dipping just below that of treasuries for a day in September. Spreads on lower rated issues from Europe and the U.S. continued to trend down.
-2.0
0.0
2.0
4.0
6.0
2009 2010 2011 2012 2013
Perc
enta
ge p
oint
s
U.S. Five-Year
AA A BBB
-1.0
1.0
3.0
5.0
2009 2010 2011 2012 2013
Perc
enta
ge p
oint
s
Eurozone Five-Year
AA A BBB
Aon Benfield
33
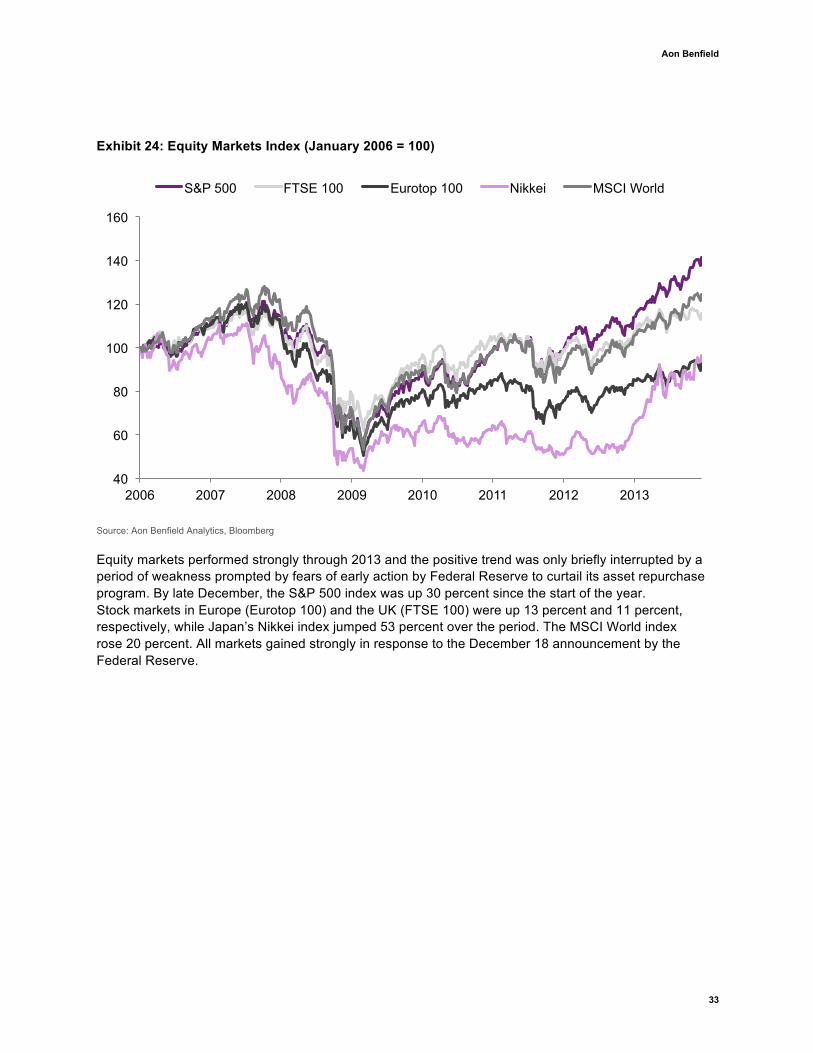
Exhibit 24: Equity Markets Index (January 2006 = 100)
Source: Aon Benfield Analytics, Bloomberg
Equity markets performed strongly through 2013 and the positive trend was only briefly interrupted by a period of weakness prompted by fears of early action by Federal Reserve to curtail its asset repurchase program. By late December, the S&P 500 index was up 30 percent since the start of the year. Stock markets in Europe (Eurotop 100) and the UK (FTSE 100) were up 13 percent and 11 percent, respectively, while Japan’s Nikkei index jumped 53 percent over the period. The MSCI World index rose 20 percent. All markets gained strongly in response to the December 18 announcement by the Federal Reserve.
40
60
80
100
120
140
160
2006 2007 2008 2009 2010 2011 2012 2013
S&P 500 FTSE 100 Eurotop 100 Nikkei MSCI World
Reinsurance Market Outlook
34
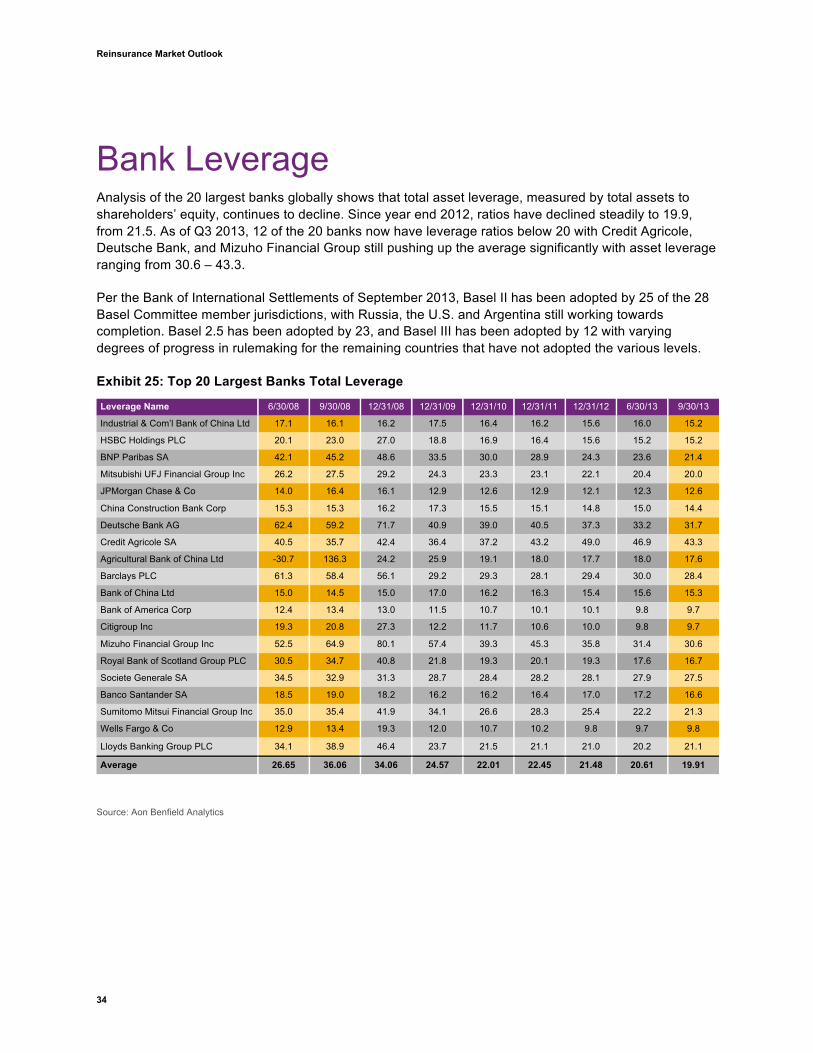
Bank Leverage Analysis of the 20 largest banks globally shows that total asset leverage, measured by total assets to shareholders’ equity, continues to decline. Since year end 2012, ratios have declined steadily to 19.9, from 21.5. As of Q3 2013, 12 of the 20 banks now have leverage ratios below 20 with Credit Agricole, Deutsche Bank, and Mizuho Financial Group still pushing up the average significantly with asset leverage ranging from 30.6 – 43.3.
Per the Bank of International Settlements of September 2013, Basel II has been adopted by 25 of the 28 Basel Committee member jurisdictions, with Russia, the U.S. and Argentina still working towards completion. Basel 2.5 has been adopted by 23, and Basel III has been adopted by 12 with varying degrees of progress in rulemaking for the remaining countries that have not adopted the various levels.
Exhibit 25: Top 20 Largest Banks Total Leverage
Leverage Name 6/30/08 9/30/08 12/31/08 12/31/09 12/31/10 12/31/11 12/31/12 6/30/13 9/30/13
Industrial & Com’l Bank of China Ltd 17.1 16.1 16.2 17.5 16.4 16.2 15.6 16.0 15.2
HSBC Holdings PLC 20.1 23.0 27.0 18.8 16.9 16.4 15.6 15.2 15.2
BNP Paribas SA 42.1 45.2 48.6 33.5 30.0 28.9 24.3 23.6 21.4
Mitsubishi UFJ Financial Group Inc 26.2 27.5 29.2 24.3 23.3 23.1 22.1 20.4 20.0
JPMorgan Chase & Co 14.0 16.4 16.1 12.9 12.6 12.9 12.1 12.3 12.6
China Construction Bank Corp 15.3 15.3 16.2 17.3 15.5 15.1 14.8 15.0 14.4
Deutsche Bank AG 62.4 59.2 71.7 40.9 39.0 40.5 37.3 33.2 31.7
Credit Agricole SA 40.5 35.7 42.4 36.4 37.2 43.2 49.0 46.9 43.3
Agricultural Bank of China Ltd -30.7 136.3 24.2 25.9 19.1 18.0 17.7 18.0 17.6
Barclays PLC 61.3 58.4 56.1 29.2 29.3 28.1 29.4 30.0 28.4
Bank of China Ltd 15.0 14.5 15.0 17.0 16.2 16.3 15.4 15.6 15.3
Bank of America Corp 12.4 13.4 13.0 11.5 10.7 10.1 10.1 9.8 9.7
Citigroup Inc 19.3 20.8 27.3 12.2 11.7 10.6 10.0 9.8 9.7
Mizuho Financial Group Inc 52.5 64.9 80.1 57.4 39.3 45.3 35.8 31.4 30.6
Royal Bank of Scotland Group PLC 30.5 34.7 40.8 21.8 19.3 20.1 19.3 17.6 16.7
Societe Generale SA 34.5 32.9 31.3 28.7 28.4 28.2 28.1 27.9 27.5
Banco Santander SA 18.5 19.0 18.2 16.2 16.2 16.4 17.0 17.2 16.6
Sumitomo Mitsui Financial Group Inc 35.0 35.4 41.9 34.1 26.6 28.3 25.4 22.2 21.3
Wells Fargo & Co 12.9 13.4 19.3 12.0 10.7 10.2 9.8 9.7 9.8
Lloyds Banking Group PLC 34.1 38.9 46.4 23.7 21.5 21.1 21.0 20.2 21.1
Average 26.65 36.06 34.06 24.57 22.01 22.45 21.48 20.61 19.91
Source: Aon Benfield Analytics

3
Aon Benfield
Aon Benfield Securities is providing its Annual Review of the Catastrophe Bond Market Update for informational purposes only. This Update is not intended as advice with respect to any specific situation, and should not be relied upon as such. In addition, readers should not place undue reliance on any forward-looking statements. Aon Benfield Securities undertakes no obligation to review or update any such statements based on changes, new developments or otherwise.
This Update is intended only for designated recipients, and it is not to be considered (1) an offer to sell any security, loan, or other financial product, (2) a solicitation or basis for any contract for purchase of any securities, loan, or other financial product, (3) an official confirmation, or (4) a statement of Aon Benfield Securities or its affiliates. With respect to indicative values, no representation is made that any transaction can be effected at the values provided and the values provided are not necessarily the value carried on Aon Benfield Securities’ books and records.
Discussions of tax, accounting, legal or actuarial matters are intended as general observations only based on Aon Benfield Securities’ experience, and should not be relied upon as tax, accounting, legal or actuarial advice. Readers should consult their own professional advisors on these matters as Aon Benfield Securities does not provide such advice.
Aon Benfield Securities makes no representation or warranty, whether express or implied, that the products or services described in this Update are suitable or appropriate for any issuer, investor or participant, or in any location or jurisdiction. The products and services described in this Update are complex and speculative, and are intended for sophisticated issuers, investors, or participants capable of assessing the significant risks involved.
Except as otherwise noted, the information in this Update was compiled by Aon Benfield Securities from sources it believes to be reliable. However, Aon Benfield Securities makes no representation or warranty as to the accuracy, reliability or completeness of such information, and the information should not be relied upon in making business, investment or other decisions.
Aon Benfield Securities and/or its affiliates may have independent business relationships with, and may have been or in the future will be compensated for services provided to, companies mentioned in this Update.
About Aon BenfieldAon Benfield, a division of Aon plc (NYSE: AON), is the world’s leading reinsurance intermediary and full-service capital advisor. We empower our clients to better understand, manage and transfer risk through innovative solutions and personalized access to all forms of global reinsurance capital across treaty, facultative and capital markets. As a trusted advocate, we deliver local reach to the world’s markets, an unparalleled investment in innovative analytics, including catastrophe management, actuarial and rating agency advisory. Through our professionals’ expertise and experience, we advise clients in making optimal capital choices that will empower results and improve operational effectiveness for their business. With more than 80 offices in 50 countries, our worldwide client base has access to the broadest portfolio of integrated capital solutions and services. To learn how Aon Benfield helps empower results, please visit aonbenfield.com.
Bryon EhrhartChairman of Aon Benfield Analytics Chairman of Aon Benfield Securities+1 312 381 [email protected]
John MooreHead of Analytics, InternationalAon Benfield Analytics+44 (0) 20 7522 [email protected]
Stephen MildenhallGlobal Chief Executive Officer of AnalyticsAon Analytics and Innovation Center+65 6231 6481 [email protected]
Tracy HatlestadManaging DirectorAon Analytics and Innovation Center+65 6512 [email protected]
Contact Information
Scan here to access prior editions of the Reinsurance Market Outlook.

200 E Randolph Street Chicago Illinois 60601 t: +1 312 381 5300 | f: +1 312 381 0160 | aonbenfield.com
Copyright Aon Benfield Inc 2013 | #12678 — 08/2013