Embed Size (px)
Citation preview
Regional Logistics Corridor
Georgian National Investment Agency(GNIA)
2012
Regional Logistics Corridor
www.investingeorgia.org 2
Trans-Caucasian route• Latent gateway between Europe and Central Asia• Around 80% of port cargo and 60% of freight rail are transits
Transport Infrastructure• Rapidly developing road infrastructure• Ports are cost-competitive vs. alternative routes• FDI inflows in the logistics sector have primarily targeted transport
infrastructure
Opportunities• Deep-sea port with PanaMax vessel• Baku-Tbilisi-Kars railway – direct connection between EU and Central
Asia• Logistical centers

Georgia’s transport infrastructure
Rail▪ 1,500 km (90% electrified)▪ ~7,000 rolling stock, 180 locos
Road▪ 1,500 km international highway + 20,000 km internal and
local roads
Rail▪ BTK connection to Turkey▪ Modernization▪ Tbilisi bypass▪ ~2500 new rolling stock
Road▪ East-West highway upgrade
Poti seaport▪ 13 berths, 8-10m draft▪ Container and bulk (210k TEU)▪ Owned/operated by Maersk/RAKIA
Batumi seaport▪ 5 berths, 1 offshore mooring, 11m draft▪ 90% petroleum/oil, 10% containers (44k TEU) ▪ Operated by JSC KazTransOil
Kuhlevi seaport▪ Crude oil, petroleum, and lubricants▪ Owned/operated by State Oil Company Azerbaijan
Poti seaport▪ New container berth (2014)
Deep-sea port▪ Min. 2 berth of 20m draft
(PanaMax)▪ First phase: Dry bulk (10m tons) and
containers (200k TEU)▪ USD 200 mn investment volume
Tbilisi international airport▪ ~1 mn passengers (capacity: 3 mn)▪ Serving 28 destinations
Batumi international airport▪ 100,000 passengers
Kutaisi international airport▪ Passenger, incl. low-cost airlines▪ Currently under construction
Poti international airport▪ Cargo airport, not yet commissioned
Mode of transport Existing infrastructure and flows Upgrades
Road
/Rai
lM
arit
ime
Air
www.investingeorgia.org 3
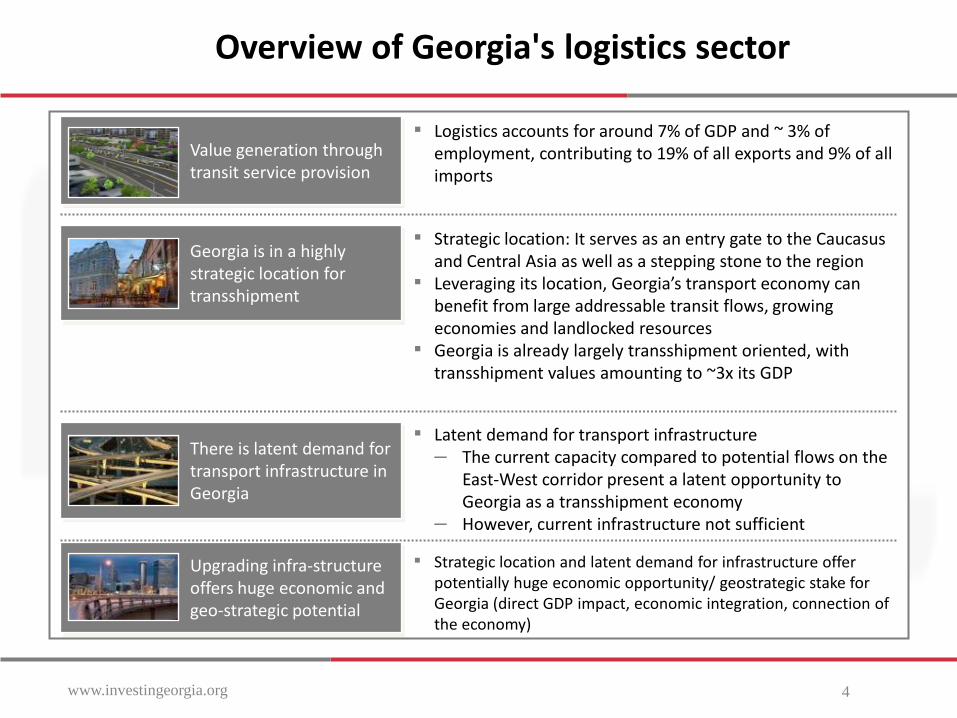
Overview of Georgia's logistics sector
www.investingeorgia.org 4
Value generation through transit service provision
▪ Logistics accounts for around 7% of GDP and ~ 3% of employment, contributing to 19% of all exports and 9% of all imports
Georgia is in a highly strategic location for transshipment
▪ Strategic location: It serves as an entry gate to the Caucasus and Central Asia as well as a stepping stone to the region
▪ Leveraging its location, Georgia’s transport economy can benefit from large addressable transit flows, growing economies and landlocked resources
▪ Georgia is already largely transshipment oriented, with transshipment values amounting to ~3x its GDP
There is latent demand for transport infrastructure in Georgia
▪ Latent demand for transport infrastructure– The current capacity compared to potential flows on the
East-West corridor present a latent opportunity to Georgia as a transshipment economy
– However, current infrastructure not sufficient
▪ Strategic location and latent demand for infrastructure offer potentially huge economic opportunity/ geostrategic stake for Georgia (direct GDP impact, economic integration, connection of the economy)
Upgrading infra-structure offers huge economic and geo-strategic potential
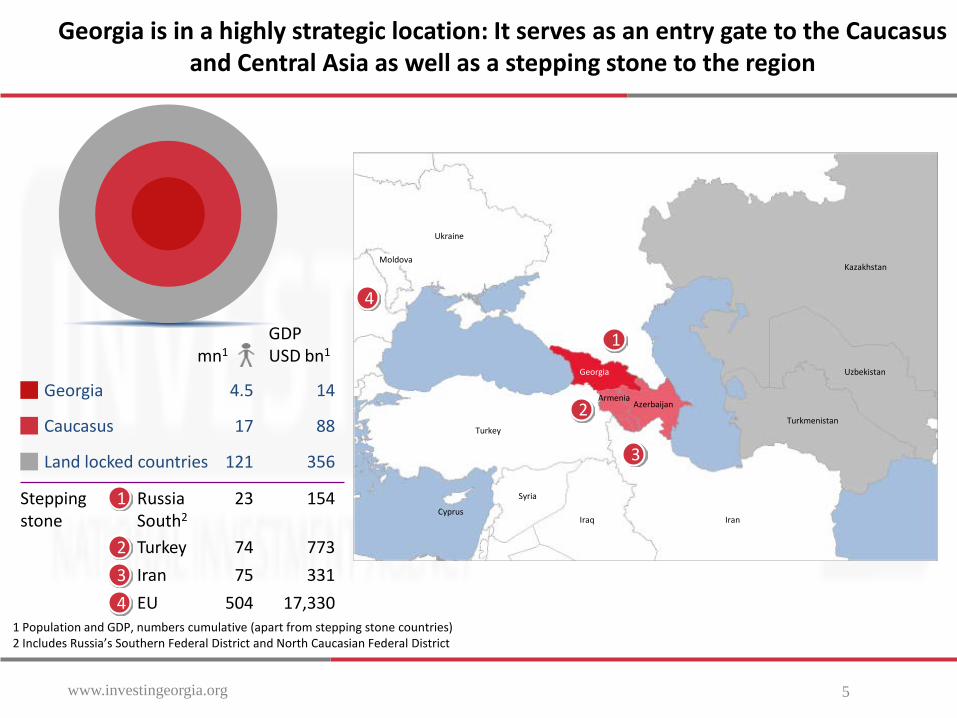
Georgia is in a highly strategic location: It serves as an entry gate to the Caucasus and Central Asia as well as a stepping stone to the region
www.investingeorgia.org 5
1 Population and GDP, numbers cumulative (apart from stepping stone countries)2 Includes Russia’s Southern Federal District and North Caucasian Federal District
Georgia
ArmeniaAzerbaijan
Kazakhstan
Uzbekistan
Turkmenistan
IranIraq
Syria
Cyprus
Ukraine
Moldova
Turkey
2
3
4
1mn1
74Turkey
75Iran
504EU
4.5
17
121
Georgia
Caucasus
Land locked countries
23Stepping stone
GDPUSD bn1
773
331
14
88
356
17,330
154RussiaSouth2
1
2
3
4
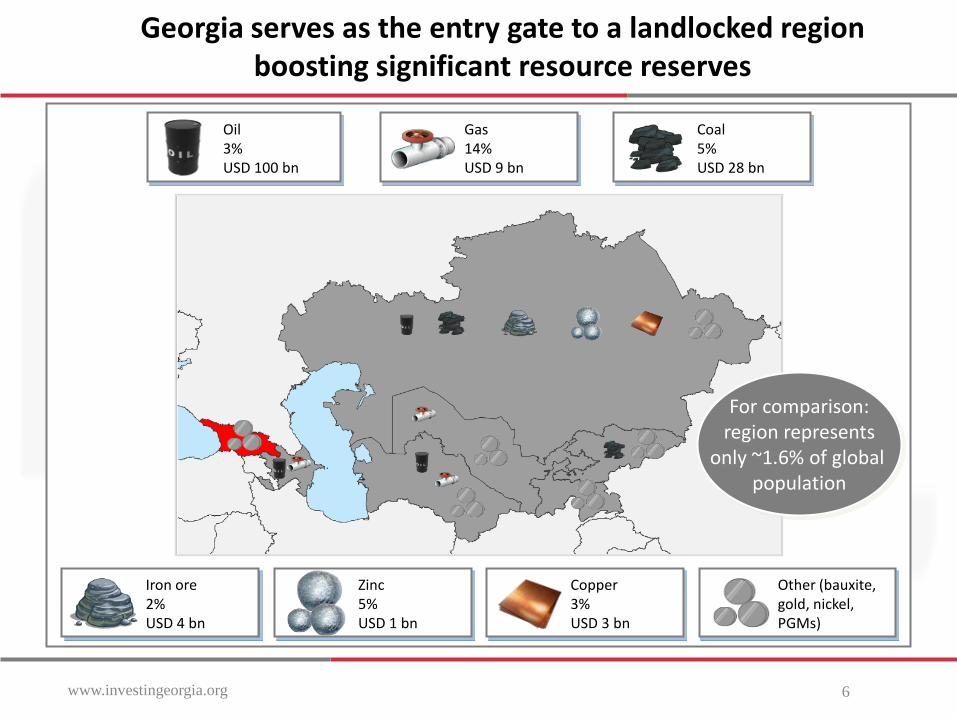
Georgia serves as the entry gate to a landlocked region boosting significant resource reserves
www.investingeorgia.org 6
Iron ore2%USD 4 bn
Other (bauxite, gold, nickel, PGMs)
Zinc5%USD 1 bn
Copper3%USD 3 bn
Oil3%USD 100 bn
Coal5%USD 28 bn
Gas14%USD 9 bn
For comparison:region represents
only ~1.6% of global population

1 Including Eastern Europe, Balkans and Turkey 2 Excluding Central Asia, Asia and Middle East 3 Estimated using total export volume by province4 Covering trade flows stated or convertible into tons only (excludes, e.g. electricity), equal to >80% of all flows in value
Georgia can utilize its location to address several flows on the major European-Central Asian trading routes
1
Caucasus – Europe1/RoW2
~44 mn tons p.a.Central Asia – Europe1/RoW2
~79 mn tons p.a.
Western China3 – Europe~3 mn tons p.a.
3
Total trade on all 3 routes▪ Total trade volume (mn tons)4
▪ Total trade value (bn USD)
~126
~100
North-South corridor Russia-Turkey
~35 mn tons p.a.
2
2010
www.investingeorgia.org 7
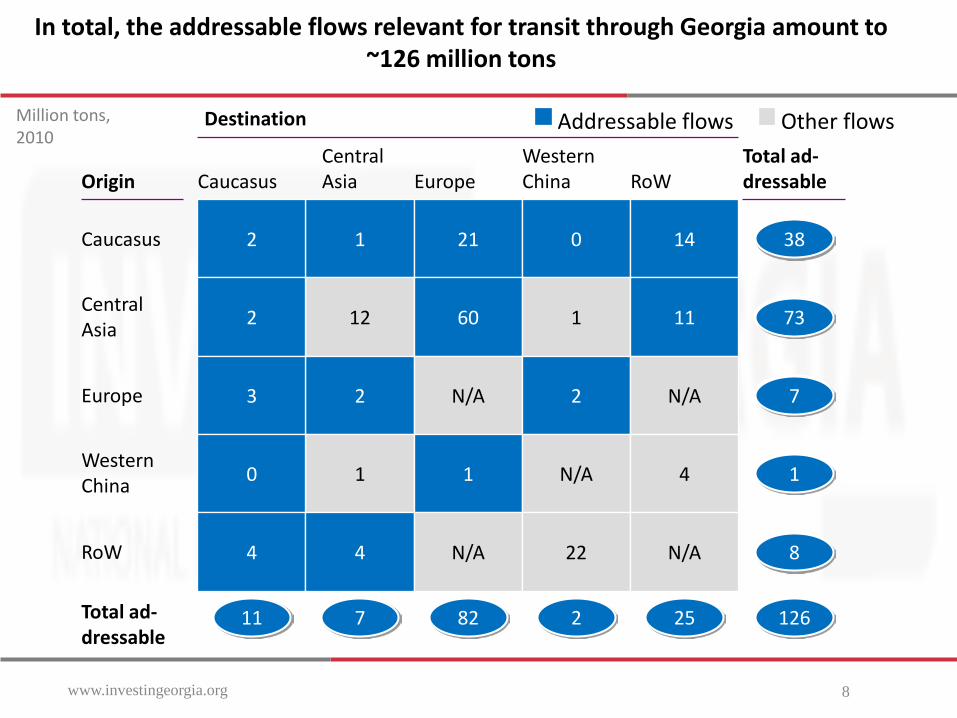
In total, the addressable flows relevant for transit through Georgia amount to ~126 million tons
Million tons,2010
1 21 0 14
12 60 1 11
2 N/A 2 N/A
1 1 N/A 4
2
2
3
0
4 4 N/A 22 N/A
11 7 82 2 25
38
73
7
1
8
126
CaucasusCentral Asia Europe
WesternChina RoW
Destination
Total ad-dressableOrigin
Caucasus
Central Asia
Europe
WesternChina
RoW
Total ad-dressable
Addressable flows Other flows
www.investingeorgia.org 8
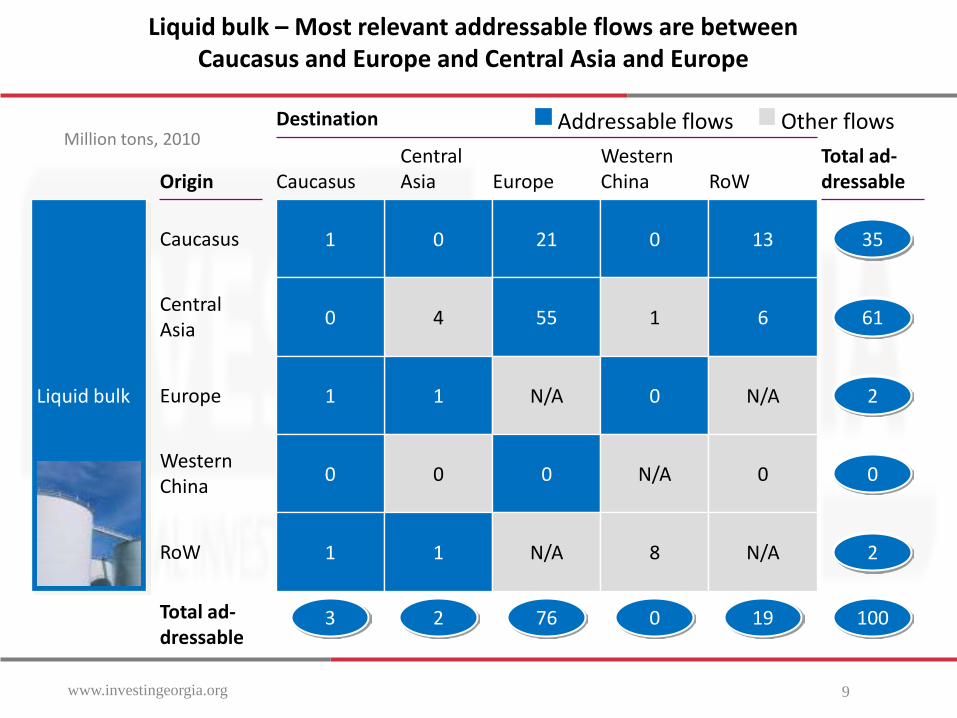
Liquid bulk – Most relevant addressable flows are between Caucasus and Europe and Central Asia and Europe
Million tons, 2010Addressable flows Other flows
Liquid bulk
0 21 0
4 55 1 6
1 N/A 0 N/A
0 0 N/A 0
131
0
1
0
1 1 N/A 8 N/A
3 2 76 0 19
35
61
2
0
2
CaucasusCentral Asia Europe
Western China RoW
Destination
Total ad-dressableOrigin
Caucasus
Central Asia
Europe
WesternChina
RoW
100Total ad-dressable
www.investingeorgia.org 9
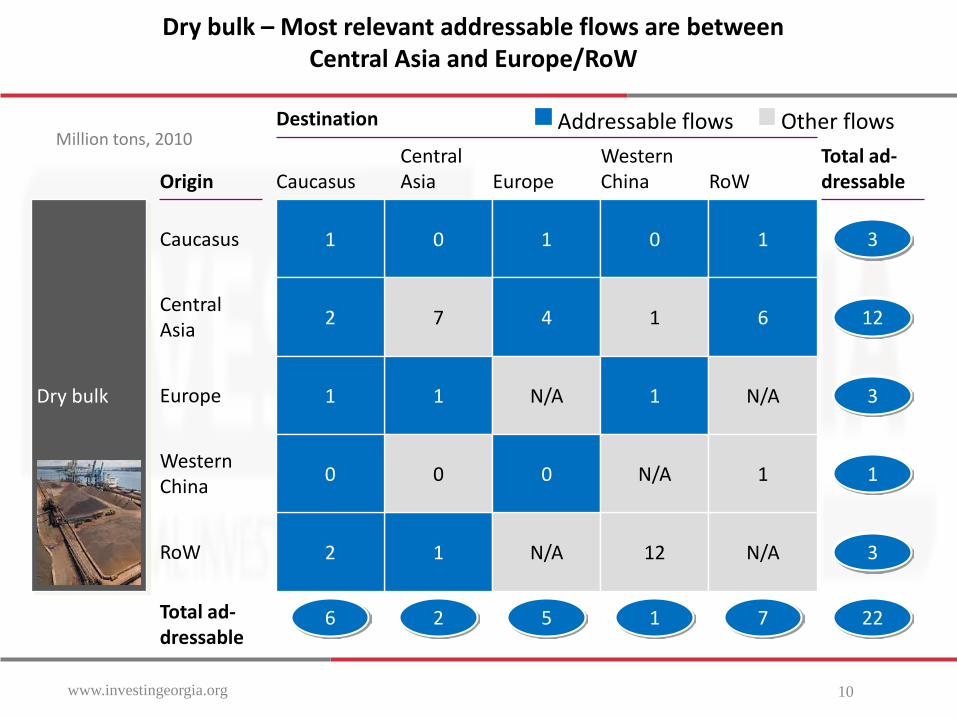
Dry bulk – Most relevant addressable flows are between Central Asia and Europe/RoW
Million tons, 2010
0 1 0 1
1 N/A 12 N/A
6 2 5 1 7
3
32
1
7 4 1 62 12
1 N/A 1 N/A1 3
0 0 N/A 10 1
CaucasusCentral Asia Europe
Western China RoW
Destination
Dry bulk
Total ad-dressableOrigin
Caucasus
Central Asia
Europe
WesternChina
RoW
22Total ad-dressable
Addressable flows Other flows
www.investingeorgia.org 10

Million tons, 2010
Container – Most relevant addressable flows are between Central Asia and Europe/RoW
CaucasusCentral Asia Europe
Western China RoW
Destination
Container
Total ad-dressableOrigin
Caucasus
Central Asia
Europe
WesternChina
RoW
Total ad-dressable
0.0 0.2 0.0 0.2
1.4 0.7 0.0 0.0
1.6 N/A 0.8 N/A
0.1 1.0 N/A 2.3
0.1
0.0
0.8
0.0
1.5 1.5 N/A 1.6 N/A
2.4 3.1 1.9 0.8 0.2
0.5
0.7
3.2
1.0
3.0
8.4
Addressable flows Other flows
www.investingeorgia.org 11
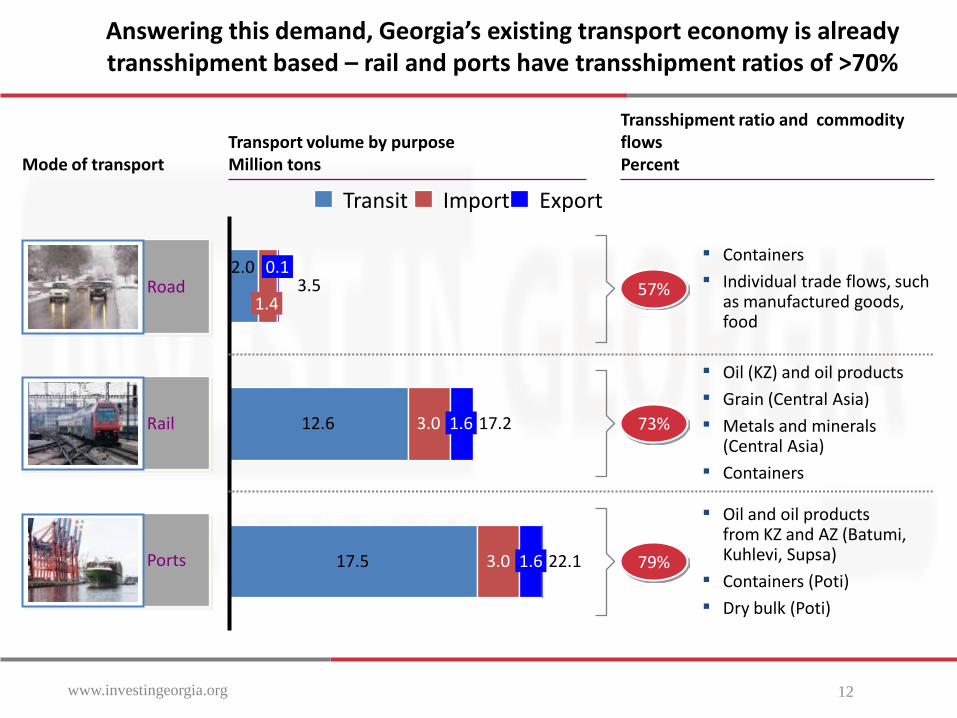
Answering this demand, Georgia’s existing transport economy is already transshipment based – rail and ports have transshipment ratios of >70%
Mode of transport
22.117.5 3.0 1.6
17.212.6 3.0 1.6
3.52.0
1.4
0.1
Transport volume by purpose Million tons
Transshipment ratio and commodity flowsPercent
▪ Oil (KZ) and oil products
▪ Grain (Central Asia)
▪ Metals and minerals (Central Asia)
▪ Containers
▪ Oil and oil products from KZ and AZ (Batumi, Kuhlevi, Supsa)
▪ Containers (Poti)
▪ Dry bulk (Poti)
Transit Import Export
Road
Rail
Ports
▪ Containers
▪ Individual trade flows, such as manufactured goods, food
57%
73%
79%
www.investingeorgia.org 12
Liquid bulk
Dry bulk
Containers
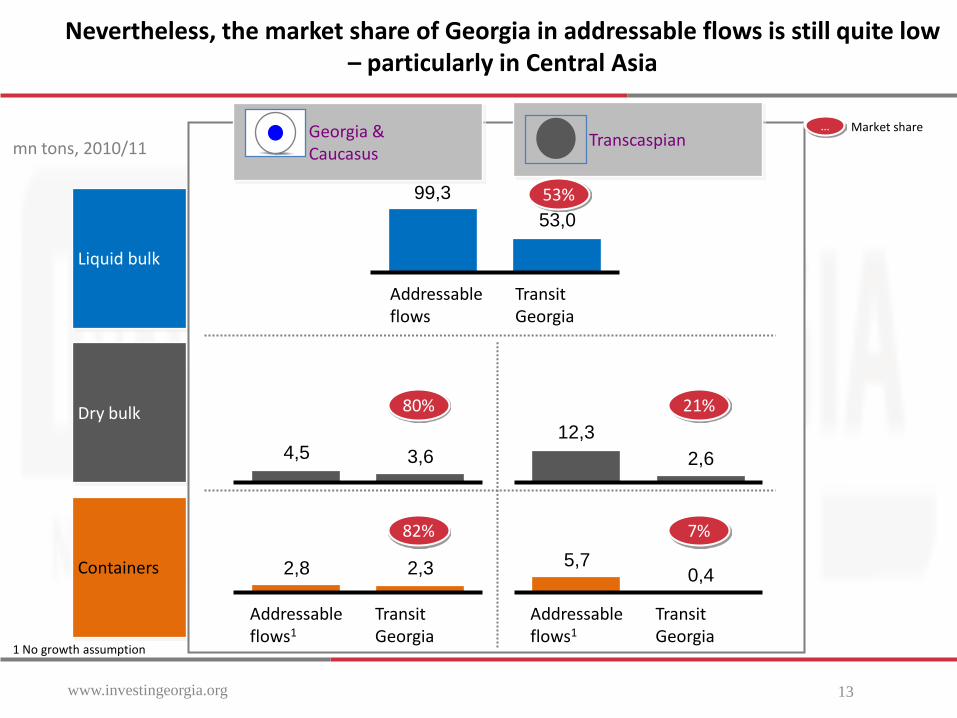
mn tons, 2010/11
Nevertheless, the market share of Georgia in addressable flows is still quite low – particularly in Central Asia
Georgia & Caucasus
Transcaspian
53%
… Market share
2,8 2,3
Transit Georgia
Addressable flows1
82%
5,70,4
Transit Georgia
Addressable flows1
7%
4,5 3,6
80%
12,32,6
21%
1 No growth assumption
99,353,0
Transit Georgia
Addressable flows
www.investingeorgia.org 13

7 5 605 ~ 15
~ 2
8-20
mn tons
This translates into a latent demand for transit and logisticsinfrastructure in Georgia, particularly in dry bulk and containers
Capacity
Current load
Available infrastructure by mode of transportation
1 Caucasus – Europe/Row; Central Asia – Europe/Row; Western China – Europe 2 Projections based on current growth trajectory 3 Transshipment only, not including /imports/exports4 Rolling stock not included (might be additional bottleneck 5 Full capacity after finalization of railway modernization project
Overseas/Regional
RegionalRegional
Dry bulk
Con-tainers
Liquid bulk
Addressable transshipment flows1
Focus destination
Sufficient capacity
2714
5 3
~ 2
TBD
~ 2
394
60
6
Pure rail3,4 Pure road3
Suffi-cientcapacity
Overseas
Latent need for infra-structure
▪ Ports as capacity and economic bottle-necks
▪ Additional rail/road capacity may be needed
▪ Loading/off-loading capacity has to be extended (e.g., terminals)
2010 20162
2010 20162
2010 20162
PipelinePort (for inter-modal and RoRo)
[ ]+ OR
RoRo ferry
+ OR[ ]+
1~2
Regional
Pure pipeline
99 ~100
17 20-25
9 12-15
Pure rail
Rail inter-modal & RoRo
Pure road
Road inter-modal & RoRo
Pipeline to terminal
Only includes Black sea RoRo
Additional capacity on Kars-link to Turkey
www.investingeorgia.org 14

The opportunity space – Georgia needs to build a deep-sea gateway to its economy and to organize trade flows of its natural hinterlands
Organizing RoRo flows
Geographic scope
Flow types
Deep sea-gate for Georgia
CaucasusTranscaspian
Liquid bulk
Dry bulk
Con-tainer
RoRoExtension
Sufficient pipelines and train capacity available
Container network
IIExtension
Organizing dry bulk flows
Extension
Deep-sea portI
IV
III
Flagship projects
www.investingeorgia.org 15

The vision for the logistics corridor needs to be backed by sizing the aspiration for additional flows
Sizing theaspiration1
Additionalflows in mn tons
Container networkDeep-sea port
Geographic scope
Deep sea-gate for Georgia
Caucasus Transcaspian
Infrastruc-turevision
I
Dry bulk corridor
III
II
RoRocorridor
IV
▪ Increase market share1
– 90% container (current: 82%)
– 90% dry bulk (current: 80%)
▪ Increase container/dry bulk flow by 50%/30%1
▪ Capacity of deep-sea port– 10 mn t dry bulk p.a.– and 200k TEU p.a.
▪ 10 t/TEU on average▪ 80% utilization▪ Increase Georgia’s trade
▪ Increase market share1
– 60% container (current: 7%)
– 50% dry bulk (current: 21%)
▪ Increase container/dry bulk flow by 50%/30%1
Dry bulk +8.0 mt +1.6 mt +5.4 mt
Container +1.6 mt +1.5 mt +4.8 mt
Scenarioassumptions
RoRo Included in above volumes
www.investingeorgia.org 16

1
Aspiration needs to be translated into concrete flows to justify deep-sea port and transport corridor infrastructure investments
Pre-condition/aspiration for flows
Potential ways to secure required flows
Deep-sea portITransportation corridors
II
III
IV
▪ Large dry bulk and/or container flows that exceed current port capacity
▪ Sufficient interest for Panamax/capesize vessel traffic
▪ Container: additional containeriza-tionof goods on relevant routs
▪ Dry bulk: large flows to justify infrastructure investments
▪ RoRo: Capacity limits on current network
▪ Involve current port owners to evaluate actual market demand for – Increased capacity– Improved port economics
▪ Involve owners of commodity flows (container, bulk) in superstructure investment to secure baseload flows
▪ Involve owners of commodity flows (container, bulk) in infrastructure investments to secure baseload flows
www.investingeorgia.org 17
The vision – a deep-sea port1 Required infrastructure
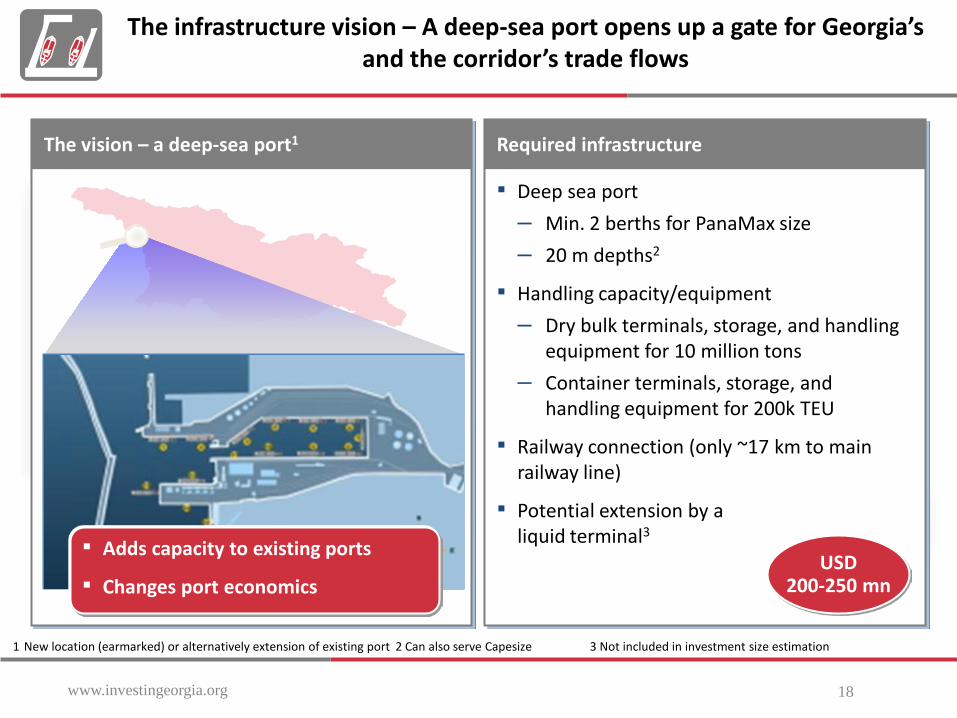
The infrastructure vision – A deep-sea port opens up a gate for Georgia’s and the corridor’s trade flows
Required infrastructure▪ Deep sea port
– Min. 2 berths for PanaMax size
– 20 m depths2
▪ Handling capacity/equipment
– Dry bulk terminals, storage, and handling equipment for 10 million tons
– Container terminals, storage, and handling equipment for 200k TEU
▪ Railway connection (only ~17 km to main railway line)
▪ Potential extension by a liquid terminal3
USD200-250 mn
1 New location (earmarked) or alternatively extension of existing port 2 Can also serve Capesize 3 Not included in investment size estimation
▪ Adds capacity to existing ports
▪ Changes port economics
www.investingeorgia.org 18

Deep-sea port will add significant capacity to current ports …
Current port capacity New deep-sea port
Container
Dry bulk
Liquid bulk
Ownership
DepthPoti
4.55.62.0
8-10 m
Total capacity
52
Dry bulk
~10
Container
~2
Liquid bulk
~27
Dry bulk
~8
Container
~5
Existing capacity Deep-sea port
Kulevi oil terminal
4.0
Million tons
Container
Dry bulk
Liquid bulk
Ownership
Depth
Supsa oil terminal
6.3
Batumi0.92.015.0
11 m
Deep-sea port2.0
10.0
20 m(≈200 k TEU)
?
Main advantages▪ Economics (able to
accept larger vessels)▪ Strategic location▪ Geology (20 m depths
very close to shore)
www.investingeorgia.org 19
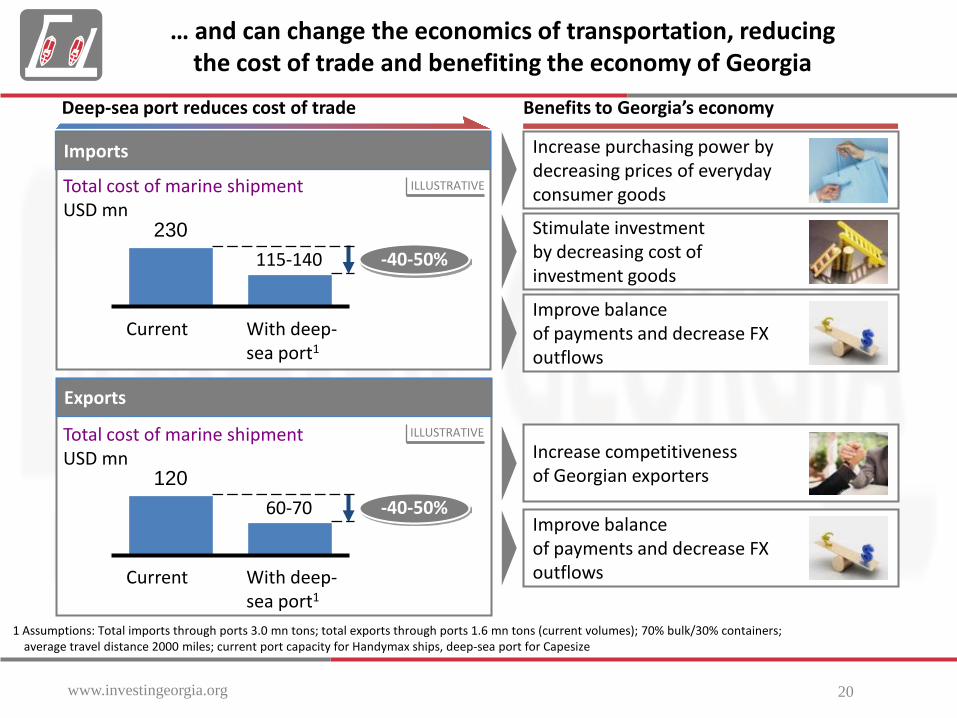
… and can change the economics of transportation, reducing the cost of trade and benefiting the economy of Georgia
www.investingeorgia.org 20
1 Assumptions: Total imports through ports 3.0 mn tons; total exports through ports 1.6 mn tons (current volumes); 70% bulk/30% containers; average travel distance 2000 miles; current port capacity for Handymax ships, deep-sea port for Capesize
Total cost of marine shipmentUSD mn
Exports
Deep-sea port reduces cost of trade
230115-140 -40-50%
With deep-sea port1
Current
Total cost of marine shipmentUSD mn
12060-70 -40-50%
With deep-sea port1
Current
Imports
ILLUSTRATIVE
ILLUSTRATIVE
Increase purchasing power by decreasing prices of everyday consumer goods
Stimulate investmentby decreasing cost of investment goods
Improve balance of payments and decrease FX outflows
Increase competitiveness of Georgian exporters
Improve balance of payments and decrease FX outflows
Benefits to Georgia’s economy
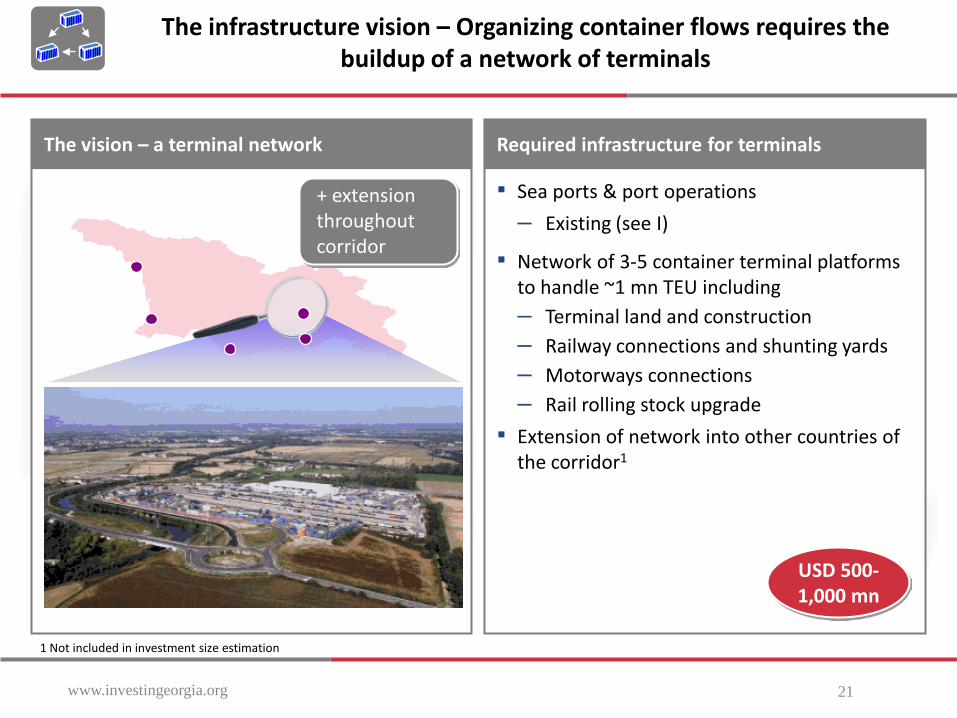
The infrastructure vision – Organizing container flows requires the buildup of a network of terminals
1 Not included in investment size estimation
The vision – a terminal network Required infrastructure for terminals
▪ Sea ports & port operations
– Existing (see I)
▪ Network of 3-5 container terminal platforms to handle ~1 mn TEU including– Terminal land and construction– Railway connections and shunting yards– Motorways connections– Rail rolling stock upgrade
▪ Extension of network into other countries of the corridor1
USD 500-1,000 mn
+ extension throughout corridor
www.investingeorgia.org 21
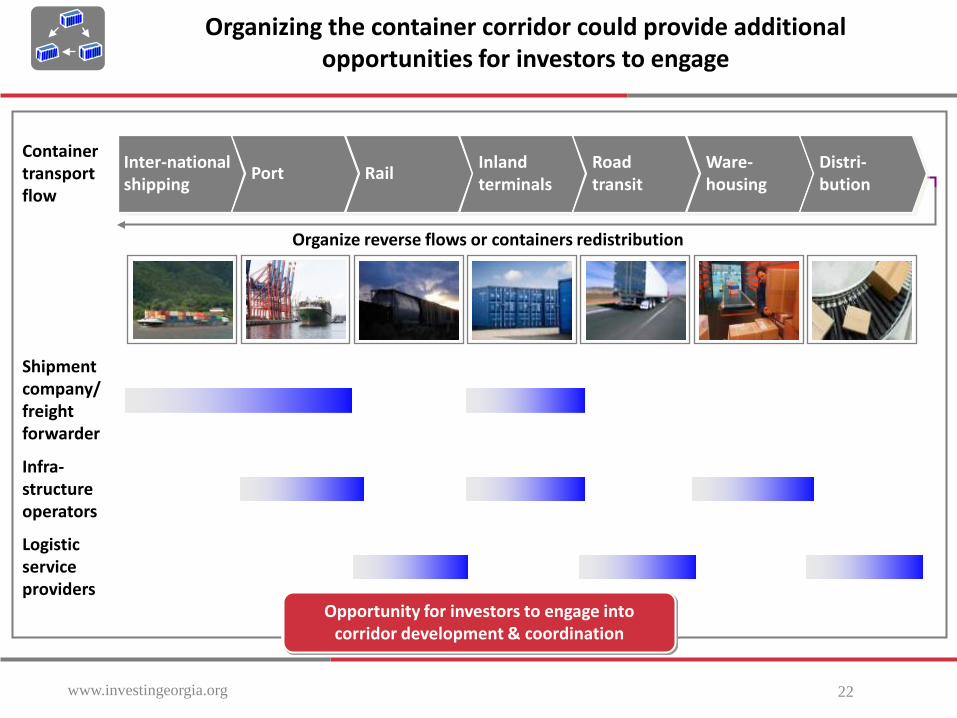
Organizing the container corridor could provide additional opportunities for investors to engage
Organize reverse flows or containers redistribution
Shipment company/ freight forwarder
Infra-structure operators
Logistic service providers
Inter-national shipping
Port RailInland terminals
Road transit
Ware-housing
Distri-bution
Containertransportflow
Opportunity for investors to engage into corridor development & coordination
www.investingeorgia.org 22

GEORGIAN NATIONAL INVESTMENT AGENCY
8, Rustaveli avenue, 0118 Tbilisi, Georgia
Tel: (+995 32) 2 281 196
E-mail: [email protected]
www.investingeorgia.org