Embed Size (px)
Citation preview

<CAISO PUBLIC>
Regional Energy Markets & California’s Green Goals
Mark RothlederVP for Renewable Integration and Market Quality
Assembly Utilities & Energy Committee Informational HearingMarch 14, 2018

<CAISO PUBLIC>
Today’s Electric Grid

<CAISO PUBLIC>
The balancing of supply and demand
Supply
Demand
Inter-RegionalInterchangeSales Purchases
Load
Losses
PowerGenerated
Decrease Increase60
Frequency
Supply
Demand
Inter-RegionalInterchangeSales Purchases
Load
Losses
PowerGenerated
Decrease Increase60
Frequency
<CAISO PUBLIC>
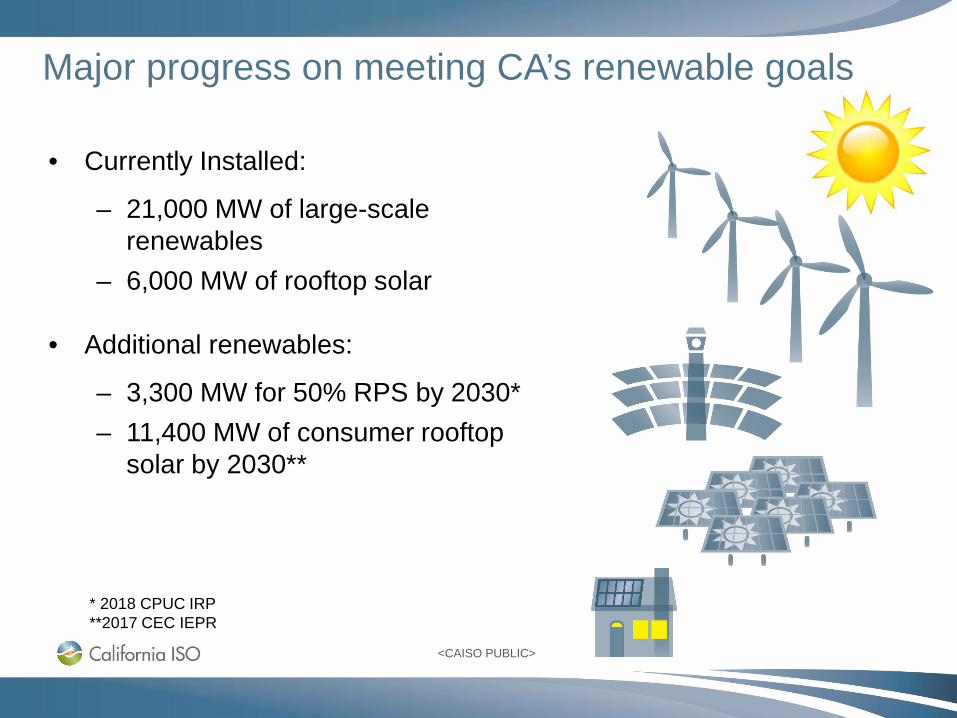
Major progress on meeting CA’s renewable goals
• Currently Installed:
– 21,000 MW of large-scale renewables
– 6,000 MW of rooftop solar
• Additional renewables:
– 3,300 MW for 50% RPS by 2030*– 11,400 MW of consumer rooftop
solar by 2030**
* 2018 CPUC IRP**2017 CEC IEPR
<CAISO PUBLIC>
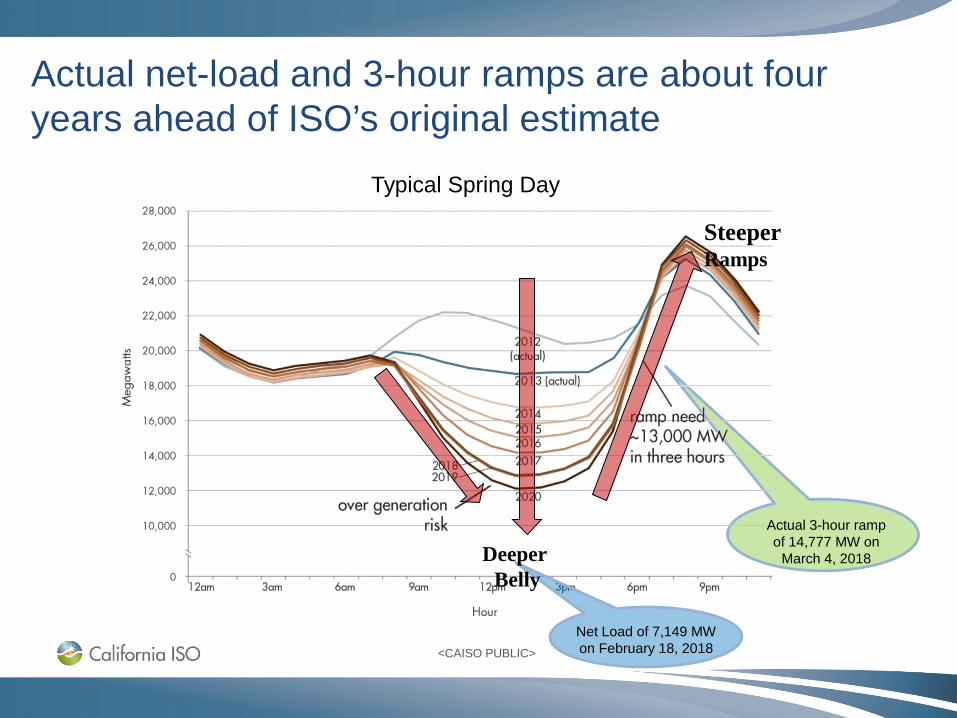
Actual net-load and 3-hour ramps are about four years ahead of ISO’s original estimate
Typical Spring Day
Net Load of 7,149 MW on February 18, 2018
Actual 3-hour rampof 14,777 MW on
March 4, 2018Deeper Belly
SteeperRamps

<CAISO PUBLIC>
0
2,000
4,000
6,000
8,000
10,000
12,000
14,000
16,000
18,000
20,000
22,000
24,000
26,000
28,000
1 2 3 4 5 6 7 8 9 10 11 12 13 14 15 16 17 18 19 20 21 22 23 24
MW
Generation Breakdown --- 02/18/2018
Nuclear Geothermal/Biomass/Biogas Thermal HydroNet Interchange Wind Solar CurtailmentTotal CAISO Load CAISO Net Load
Net Load = Load -Wind -SolarRenewablesCurtailment
On Sunday, February 18, 2018 the CAISO experienced a minimum net-load of 7,149 MW @ 14:06 3-hr, 13,597 MW ramp met by:
- Import ~ 62%- Gas – 28%- Hydro – 10%
70.6% of the load served by Renewable Resources

<CAISO PUBLIC>
0
2,000
4,000
6,000
8,000
10,000
12,000
14,000
16,000
18,000
20,000
22,000
24,000
26,000
28,000
1 2 3 4 5 6 7 8 9 10 11 12 13 14 15 16 17 18 19 20 21 22 23 24
MW
Axis Title
Generation Breakdown --- 03/04/2018
Nuclear Geothermal/Biomass/Biogas Thermal HydroNet Interchange Wind Solar CurtailmentTotal CAISO Load CAISO Net Load
Net Load = Load -Wind -SolarRenewablesCurtailment
On Sunday, March 4, 2018 the maximum 3-hour upward ramp was 14,777 MW 3-hr, 14,777MW ramp met by:
- Import ~ 36%- Gas – 49%- Hydro – 15%

<CAISO PUBLIC>
0
4,000
8,000
12,000
16,000
20,000
24,000
28,000
32,000
36,000
40,000
44,000
48,000
52,000
1 2 3 4 5 6 7 8 9 10 11 12 13 14 15 16 17 18 19 20 21 22 23 24
Load
& N
et L
oad
(MW
)
Generation Breakdown --- 09/01/2017
Nuclear Geothermal/Biomass/BiogasThermal HydroNet Interchange WindSolar CurtailmentTotal CAISO Load CAISO Net Load
Net Load = Load -Wind -Solar
Load
In 2017, the CAISO peak load was 50,116 MW and occurred at 15:58:24 on Friday, September 1, 2017
15:58 to 18:44
• Net Load peaked 2 hours and 46 minutes after peak demand
• Peak load decreased by 2,148 MW
• Solar production decreased by 7,199 MW
• Net Load increased by 5,258 MW

<CAISO PUBLIC>
A suite of solutions are necessary

<CAISO PUBLIC>
Stay connected
Sign up for theDaily Briefing at www.caiso.com
Download ISO Todaymobile app
@California_ISO
Questions

<CAISO PUBLIC>
Appendix

<CAISO PUBLIC>
CAISO GHG emissions reduced by 23% since 2014
<CAISO PUBLIC>
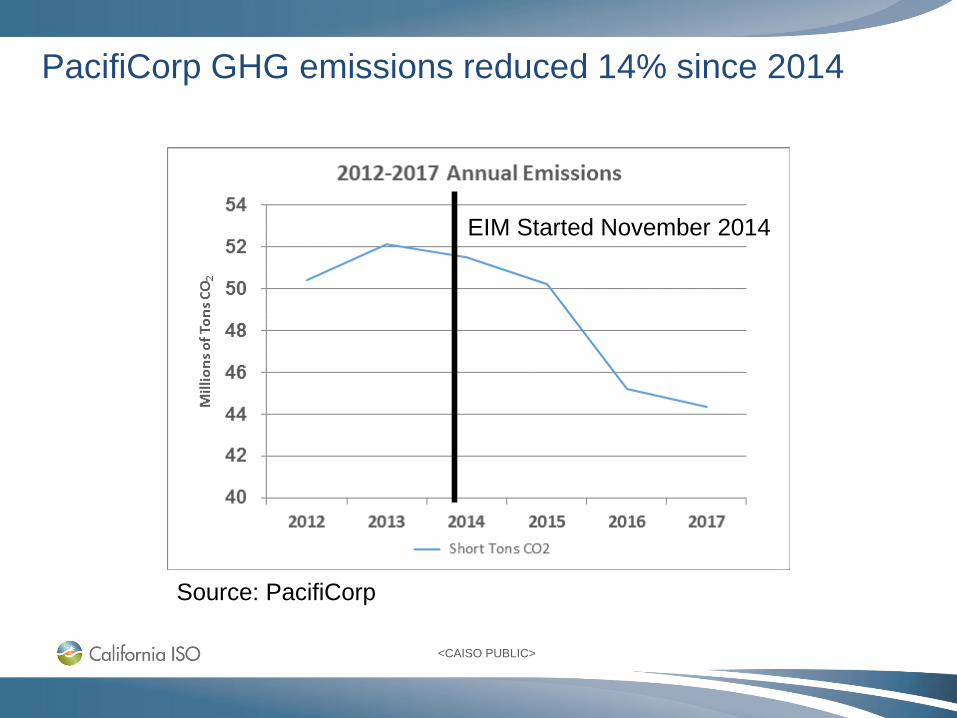
PacifiCorp GHG emissions reduced 14% since 2014
EIM Started November 2014
Source: PacifiCorp

<CAISO PUBLIC>
Increasing trend of renewable curtailment varies with seasonal and hydro conditions
2017 Curtailment Percentage of Potential Production
Solar: 2.8%Wind: 1.3%

<CAISO PUBLIC>
The 1-Hour upward ramps are more than 50% of the three hour ramps, which indicates the need for faster ramping resources
2/18/2018 3/4/2018 3/5/2018Max 3-Hr UP Ramp 13,597 14,777 13,740Max 1-Hr Up Ramp 7,101 7,545 7,537
0
2,000
4,000
6,000
8,000
10,000
12,000
14,000
16,000
MW
Days
Comparison of 3-Hour and 1-Hour upward Ramps
Max 3-Hr UP Ramp Max 1-Hr Up Ramp

<CAISO PUBLIC>
Percentage of load served by wind/solar, total RPS and non-Carbon resources (1-minute average)
24.7
60.9 58.8
50.1
30.2
70.667.2
57.4
44.4
79.975.0
64.8
0.0
10.0
20.0
30.0
40.0
50.0
60.0
70.0
80.0
90.0
9/1/2017 2/18/2018 3/4/2018 3/5/2017
Per
cent
(%
)
Comparison of Load served by Different Combinations of Resources
Load served by Wind/Solar (%) Load Served by RPS (%) Load served by Non-Carbon Res. (%)

<CAISO PUBLIC>
Percentage of daily load served by wind/solar, total RPS and non-Carbon resources
10.2
29.1
23.1
18.915.7
38.0
31.2
26.2
30.5
48.5
40.6
34.7
0.0
10.0
20.0
30.0
40.0
50.0
60.0
9/1/2017 2/18/2018 3/4/2018 3/5/2017
Per
cent
(%
)
Daily Percentage of Load Served by Wind/Solar, RPS andNon-Carbon Resources
Load served by Wind/Solar (%) Load Served by RPS (%) Load served by Non-Carbon Res. (%)