Embed Size (px)
Citation preview

Reference Case Energy and Emissions Forecast for Vermont
Taylor Binnington Scientist, Energy Modeling Program
9 June 2021

Modeling Tool
• Low Emissions Analysis Platform (LEAP)
• A software tool for quantitative modeling of:• Energy systems
• Pollutant emissions from energy and non-energy sources
• Health impacts
• Sustainable development indicators
• Costs and benefits
• Related externalities
• Created by an SEI team based in Somerville, Mass.
• Distinguished by data and methodological flexibility, graphical user interface, built-in accounting features(energy, emissions, costs, natural resources)
• Thousands of users in over 190 countries
https://leap.sei.org

Model Scope and Methods
• Modeling period: 2015-2050, with scenario(s) beginning in 2020
• Model covers all energy demand, energy supply, and GHG emissions
in Vermont (all sectors including emissions from energy and non-
energy sources)
• GHG emissions converted to CO2-equivalent using 100-year global
warming potentials from Intergovernmental Panel on Climate
Change’s Fourth Assessment Report

Model Development Process
Historical energy flows
Reference case projection
Mitigation scenarios
Mitigation pathway(s)
Final energy demand“Simple” energy
supplyElectric capacity and
dispatch
GHGs Other air pollutants Criteria pollutants
Fuel costsInvestment and other mitigation
policy costs
Historical emissionsSimple trend
projectionLULUCF
Scenarios
Scope
Energy-related emissions
Non-energy emissions
Costs
On-Road Transportation
What’s Included?
• Registrations of publicly and privately owned road vehicles from VDMV
• Historical vehicle registrations from UVM TRC (Dowds) and FHWA
• Historical and forecasted VMT from UVM TRC (Sullivan)
• Fuel economy and mileage over vehicle lifetime from VISION 2020 model, including ethanol and
biodiesel blends
• EV sales from VELCO (light-duty) and multi-state MOU (medium- and heavy-duty)
• Other vehicle sales forecasts aligned with AEO 2020
• GHG emissions from EPA’s SIT and GREET

On-Road Transportation: Reference Case Results
0%
20%
40%
60%
80%
100%
2020 2030 2040 2050
Passenger Car Sales Shares by Technology
CNG Diesel Diesel Hybrid E85 Flex Fuel
EV A EV B EV C Gasoline
Gasoline Hybrid Gasoline PHEV A Gasoline PHEV B Natural Gas Fuel Cell

On-Road Transportation: Reference Case Results
0%
20%
40%
60%
80%
100%
2020 2030 2040 2050
Light Truck Sales Shares by Technology
CNG Diesel Diesel Hybrid E85 Flex Fuel
EV A EV B EV C Gasoline
Gasoline Hybrid Gasoline PHEV A Gasoline PHEV B Natural Gas Fuel Cell

On-Road Transportation: Reference Case Results
0
100
200
300
400
500
600
700
THo
usa
nd
Ve
hic
les
Light Duty Vehicles by Technology
CNG Diesel Diesel Hybrid E85 Flex Fuel
EV A EV B EV C Gasoline
Gasoline Hybrid Gasoline PHEV A Gasoline PHEV B Natural Gas Fuel Cell

On-Road Transportation: Reference Case Results
10
20
30
40
50
60
2015 2020 2025 2030 2035 2040 2045 2050
Trill
ion
BTUEnergy Demand for On-Road Transportation by Vehicle Type
Heavy Duty Light Truck Medium Duty Passenger Car

On-Road Transportation: Reference Case Results
10
20
30
40
50
60
2015 2020 2025 2030 2035 2040 2045 2050
Trill
ion
BTU
Energy Demand for On-Road Transportation by Fuel
Biodiesel CNG Diesel Electricity Ethanol Gasoline LPG Natural Gas

On-Road Transportation: Reference Case Results
500
1,000
1,500
2,000
2,500
3,000
3,500
4,000
2015 2020 2025 2030 2035 2040 2045 2050
Tho
usa
nd
Me
tric
To
nn
es
CO
2e
Direct GHG Emissions from On-Road Transportation by Vehicle Type
Heavy Duty Light Truck Medium Duty Passenger Car

Non-Road Transportation
What’s Included?
• Historical and forecasted rail, aviation, navigation, “other” fuel shares from AEO 2020
• Total energy consumption per capita derived from SEDS, and population forecasts from VT DOH and
UVM TRC
• GHG Emissions from EPA’s SIT

Non-Road Transportation: Reference Case Results
50
100
150
200
250
300
2015 2020 2025 2030 2035 2040 2045 2050
Tho
usa
nd
Me
tric
To
nn
es
CO
2e
Direct GHG Emissions from Non-Road Transportation by Mode
Aviation Navigation Other Rail

Commercial Buildings
What’s Included?
• Based on EIA CBECS
• Floorspace for “pre-2007” buildings without retrofits, with HVAC retrofit, with insulation retrofits, “post-2007” buildings
• Within each, penetration of different building technologies and energy use per square foot
• Floorspace projections from AEO 2020 for New England, prorated for Vermont GDP from US BEA
• Adjustments to technology shares within space heating, lighting, water heating from PSD/Cadmus
• Estimated annual heat pump additions from VELCO/Itron
• Energy efficiency program thermal fuel savings and declining electricity use per square foot from EVT,
total natural gas efficiency from Vermont PUC
• GHG emissions from EPA’s SIT

Commercial Buildings: Reference Case Assumptions
20
40
60
80
100
120
140
160
180
2015 2020 2025 2030 2035 2040 2045 2050
Mill
ion
Sq
uar
e F
eet
Commercial Floorspace by Building Category and Construction Year
Pre 2007 Pre 2007 with HVAC Retrofit Pre 2007 with Insulation Retrofit Post 2007

Commercial Buildings: Reference Case Results
5
10
15
20
25
30
2015 2020 2025 2030 2035 2040 2045 2050
Trill
ion
BTU
Energy Demand in Commercial Buildings by End Use
Computing Cooking Lighting Miscellaneous Office Equipment
Refrigeration Space Cooling Space Heating Ventilation Water Heating

Commercial Buildings: Reference Case Results
5
10
15
20
25
30
2015 2020 2025 2030 2035 2040 2045 2050
Trill
ion
BTU
Energy Demand in Commercial Buildings by Fuel
Distillate Fuel Oil Electricity Ethanol Gasoline Kerosene
Natural Gas Propane Residual Fuel Oil Solar Wood

Commercial Buildings: Reference Case Results
2
4
6
8
10
12
14
2015 2020 2025 2030 2035 2040 2045 2050
Trill
ion
BTU
Energy Demand for Space Heating in Commercial Buildings by Fuel
Distillate Fuel Oil Electricity Natural Gas Propane Wood
Commercial Buildings: Reference Case Results
200
400
600
800
1,000
1,200
2015 2020 2025 2030 2035 2040 2045 2050
Tho
usa
nd
Met
ric
Ton
ne
s C
O2e
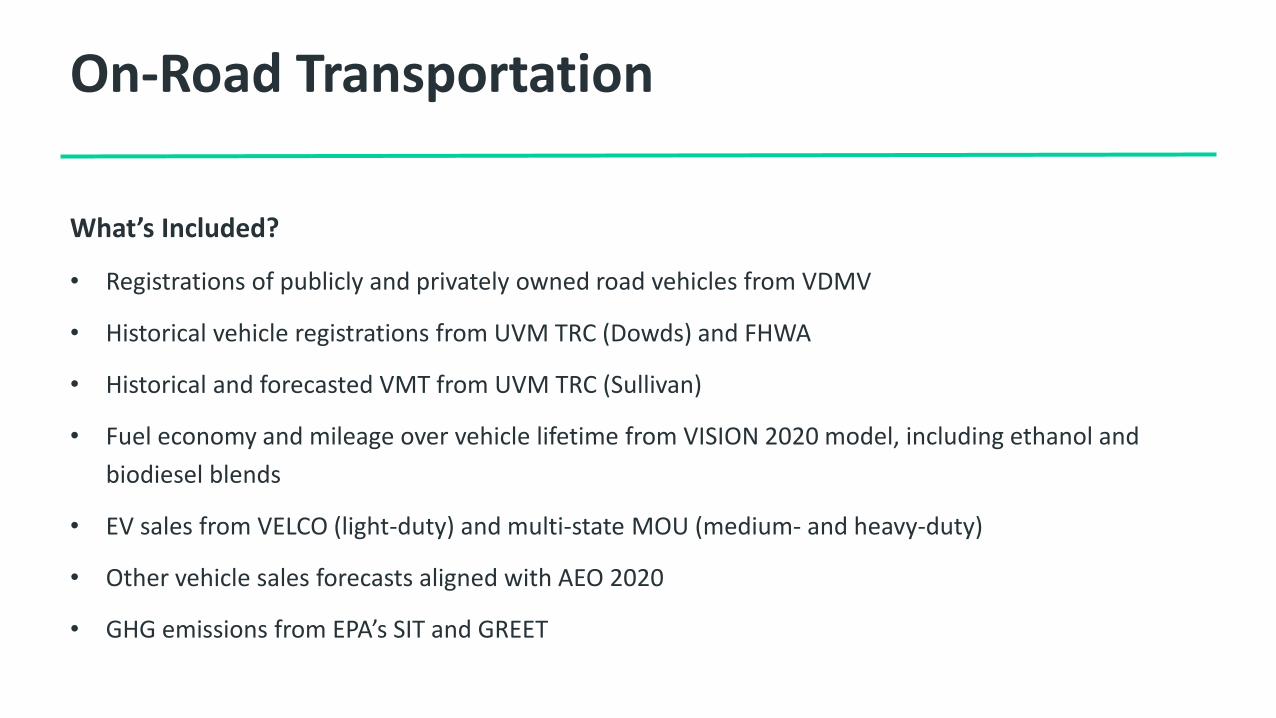
Direct GHG Emissions from Commercial Buildings by Fuel
Distillate Fuel Oil Ethanol Gasoline Kerosene
Natural Gas Propane Residual Fuel Oil Wood

Commercial Buildings: Reference Case Results
200
400
600
800
1,000
1,200
2015 2020 2025 2030 2035 2040 2045 2050
Tho
usa
nd
Me
tric
To
nn
es
CO
2e
Direct GHG Emissions from Commercial Buildings by End Use
Space Heating Space Cooling Water Heating Cooking Miscellaneous

Residential Buildings
What’s Included?
• Based on EIA RECS
• Includes shares of housing units in urban vs. rural areas, by housing type and tenure, having different energy end uses and technologies
• Technology and end use penetrations from VT Residential Market Assessment and RECS
• Equipment efficiencies from RECS and VT Residential Market Assessment
• Total housing units from Census Bureau, population forecast harmonized with UVM TRC
• VT Residential Fuel Assessment: wood and pellet consumption in Vermont
• VT Residential Market Assessment: technology penetration in new housing units
• Projected energy efficiency program savings by end use from EVEE
• Projected building shell retrofits (weatherization) from EVR and VGS, with building shell
improvements in new construction from PSD/EVEE

Residential Buildings (continued)
What’s Included?
• Changes to HDD and CDD from Northeast Regional Climate Center
• Projected changes to device efficiencies, and changes in shares of households using different cooking
technologies from AEO 2020
• Estimated annual heat pump additions from VELCO/Itron
• GHG emissions from EPA’s SIT

Residential Buildings: Reference Case Assumptions
50
100
150
200
250
300
350
400
2015 2020 2025 2030 2035 2040 2045 2050
Tho
usa
nd
Un
its
Housing Units by Type of Structure
Apartment Building 2-4 Units Apartment Building 5 or More Units
Mobile Single Family Attached
Single Family Detached
Residential Buildings: Reference Case Results
5
10
15
20
25
30
35
40
45
2015 2020 2030 2040 2050
Trill
ion
BTU
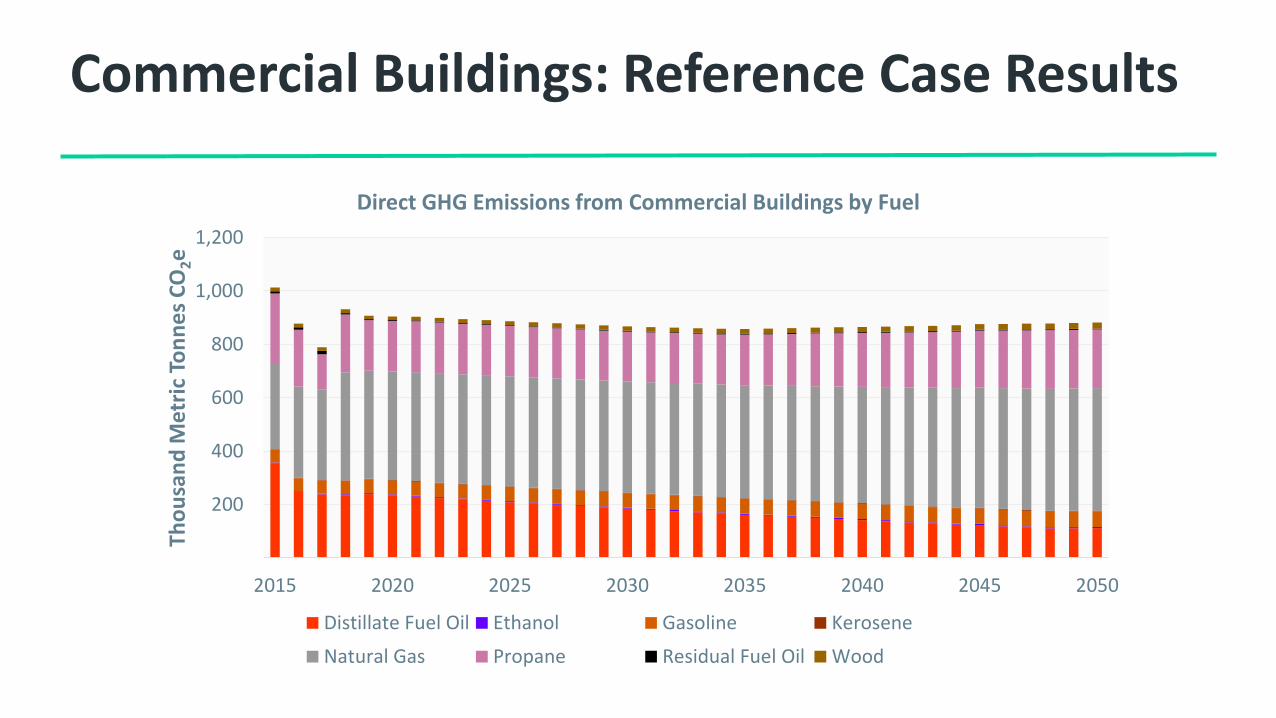
Energy Demand in Residential Buildings by End Use
Cooking Other Refrigeration Space Cooling Space Heating Water Heating

Residential Buildings: Reference Case Results
5
10
15
20
25
30
35
40
45
2015 2020 2030 2040 2050
Trill
ion
BTU
Energy Demand in Residential Buildings by Fuel
Distillate Fuel Oil Electricity Natural Gas Propane Wood Wood Pellets

Residential Buildings: Reference Case Results
5
10
15
20
25
30
2015 2020 2030 2040 2050
Trill
ion
BTU
Energy Demand for Space Heating in Residential Buildings by Fuel
Distillate Fuel Oil Electricity Natural Gas Propane Wood Wood Pellets

Residential Buildings: Reference Case Results
200
400
600
800
1,000
1,200
1,400
1,600
1,800
2015 2020 2030 2040 2050
Tho
usa
nd
Met
ric
Ton
ne
s C
O2e
Direct GHG Emissions from Residential Buildings by Fuel
Distillate Fuel Oil Natural Gas Propane Wood Wood Pellets

Residential Buildings: Reference Case Results
200
400
600
800
1,000
1,200
1,400
1,600
1,800
2015 2020 2025 2030 2035 2040 2045 2050
Tho
usa
nd
Me
tric
To
nn
es
CO
2e
Direct GHG Emissions from Residential Buildings by End Use
Cooking Other Space Heating Water Heating

Industry
What’s Included?
• Historical energy consumption by fuel from SEDS, with consumption forecasts aligned with AEO 2020
• AEO 2020: forecasted growth in final demands for each fuel
• Adjustments in natural gas, thermal fuels and electricity consumption to include forecasted energy
efficiency programs from PUC and EVT
• GHG emissions from EPA’s SIT

Industry: Reference Case Results
5
10
15
20
2015 2020 2025 2030 2035 2040 2045 2050
Trill
ion
BTU
Energy Demand in Industry by Fuel
Electricity Natural Gas Gasoline Kerosene
Distillate Fuel Oil Wood Wood Waste Solids Ethanol
Propane Residual Fuel Oil Biodiesel Lubricants
Cellulosic Ethanol Asphalt and Road Oil

Industry: Reference Case Results
100
200
300
400
500
600
2015 2020 2025 2030 2035 2040 2045 2050
Tho
usa
nd
Met
ric
Ton
ne
s C
O2e
Direct GHG Emissions from Industry by Fuel
Natural Gas Gasoline Kerosene Distillate Fuel Oil
Wood Wood Waste Solids Ethanol Propane
Residual Fuel Oil Biodiesel Lubricants Cellulosic Ethanol

Total Emissions: Notes on Interpretation
In this draft version, emissions from electricity consumption are represented using a simplified consumption-based approach:
• Fixed amount of nuclear energy contracted to Vermont utilities for the duration of existing contracts (from PSD),
• Beginning 2017 and after, Vermont’s Tier I and Tier II Renewable Energy Standard met using renewable energy,
• Remainder of electricity sourced from average grid mix:
• Current GHG emissions from ISO-NE
• Forecast GHG emissions decline assuming each state meets its own renewable portfolio standard
Subsequent versions of the model will simulate electric generation capacity and dispatch, by representing all different
technologies (and imports) on the New England electric grid.
Total Emissions: Notes (continued)
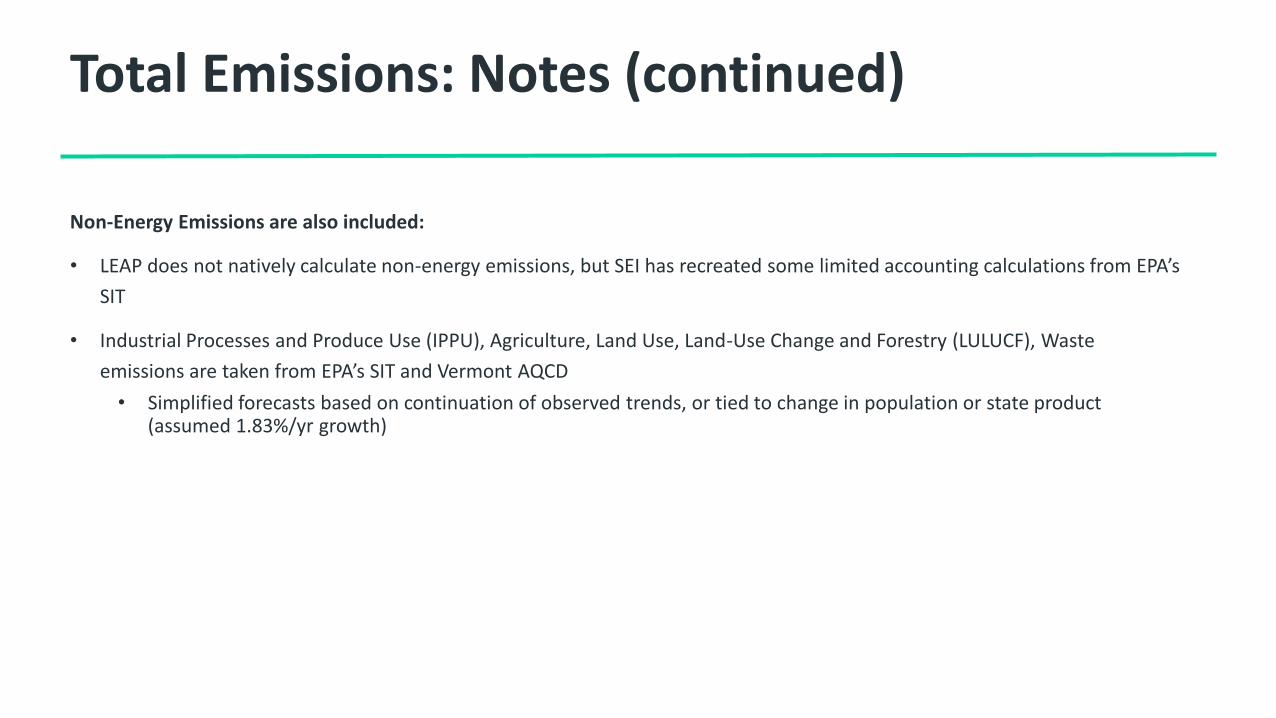
Non-Energy Emissions are also included:
• LEAP does not natively calculate non-energy emissions, but SEI has recreated some limited accounting calculations from EPA’s
SIT
• Industrial Processes and Produce Use (IPPU), Agriculture, Land Use, Land-Use Change and Forestry (LULUCF), Waste
emissions are taken from EPA’s SIT and Vermont AQCD
• Simplified forecasts based on continuation of observed trends, or tied to change in population or state product (assumed 1.83%/yr growth)

Electricity Consumption: Reference Case Results
0
200
400
600
800
1,000
1,200
1,400
1,600
1,800
1,000
2,000
3,000
4,000
5,000
6,000
7,000
8,000
9,000
10,000
2015 2020 2025 2030 2035 2040 2045 2050
Tho
usa
nd
Met
ric
Ton
ne
s C
O2e
Gig
awat
t-h
ou
rs
Electricity Use and GHG Emissions by Source
Nuclear Contracts ISO NE Mix Tier I and II RES ISO NE Mix Emissions

Electricity and Renewable Energy Shares: Reference Case Results
0%
5%
10%
15%
20%
25%
30%
35%
2015 2020 2025 2030 2035 2040 2045 2050
Pe
rce
nta
ge o
f Fi
nal
En
erg
y D
em
and
Share of Electricity in Final Energy Demand Share of Renewable Energy in Final Energy Demand
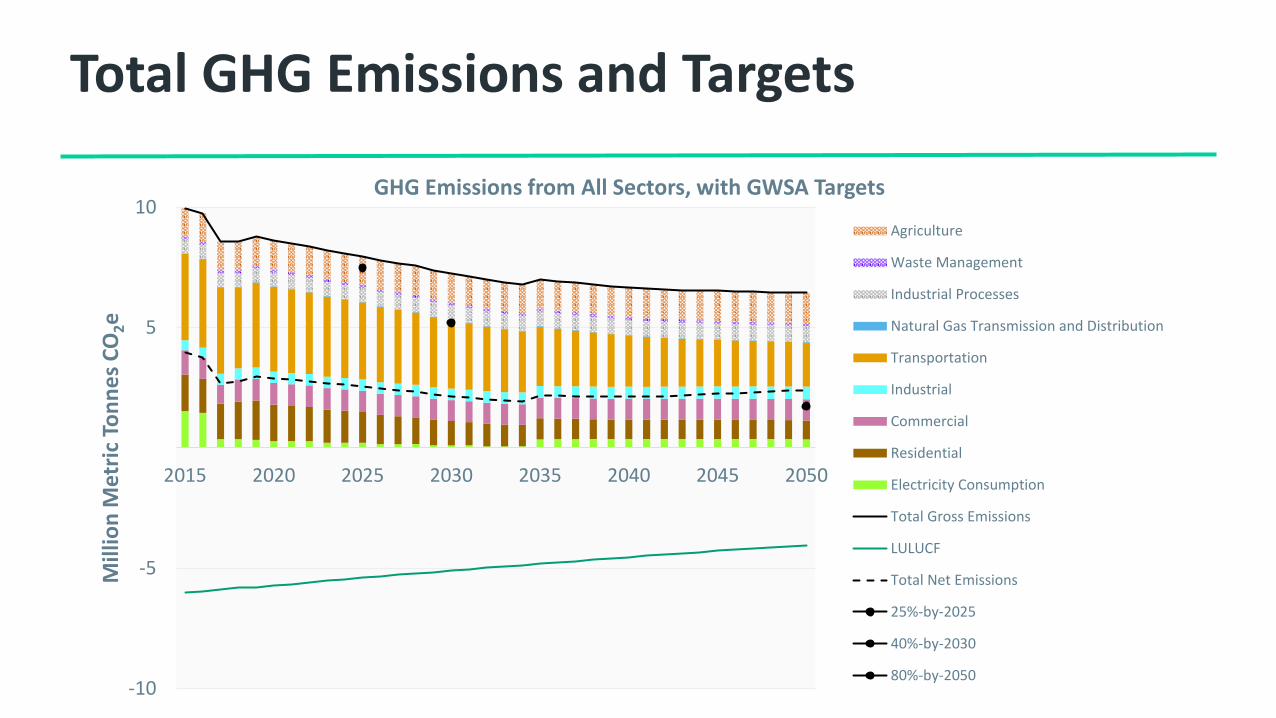
Total GHG Emissions and Targets
-10
-5
5
10
2015 2020 2025 2030 2035 2040 2045 2050
Mill
ion
Me
tric
To
nn
es
CO
2e
GHG Emissions from All Sectors, with GWSA Targets
Agriculture
Waste Management
Industrial Processes
Natural Gas Transmission and Distribution
Transportation
Industrial
Commercial
Residential
Electricity Consumption
Total Gross Emissions
LULUCF
Total Net Emissions
25%-by-2025
40%-by-2030
80%-by-2050