Embed Size (px)
Citation preview
United States Department of Agriculture
Forest Service
Northeastern Forest Experiment Station
Research Paper NE-586
Reduce Dimension Costs by Using WALNUT David G. Martens
Lumber Grade Informat ion (Select only three)
Input Factors
FAS
Yield Ad j . (percent
Volume Constraints (M bf) -0- 0.0 -....I --I -0- -0- I--.. -0-
PF1 = Help PF3 = Exit PF7 = Prev. screen PF8 = Next screen I
The Author David G. Martens, research forest products technolo- gist, received a B.S. degree in forest products from lowa State University in 1961 and an M.S. degree in wood technology from lowa State in 1963. After grad- uation, he joined the staff at the Northeastern Forest Experiment Station's Forestry Sciences Laboratory at Princeton, West Virginia, where he has been conduct- ing or supervising research to improve the efficiency of wood use.
Manuscript received for publication 10 January 1986
Abstract A computer program called WALNUT is described that determines the least-cost combination of lumber grades required to produce a given cutting order of walnut furniture dimension parts. If the least-cost mix is not available, WALNUT can be used to determine the next best alternative. The steps involved in using the program are described.
American black walnut has long been a favorite spe- cies for furniture in this country. However, increasing demand for fine furniture and decreasing supplies of high-quality ,walnut lumber have made prices sky- rocket. As a result, furniture dimension manufacturers making walnut parts have been caught in the middle of a cost-price squeeze.
To help alleviate this situation, a computer program called WALNUT has been developed that determines the least-cost mix of walnut lumber grades required to produce a given dimension cutting order. Through linear programing techniques, WALNUT correlates the cost associated with each grade of lumber with the predicted yields of each cutting size obtainable from that grade to arrive at the combination with the lowest total-mst. The program is easy to use and can be quickly adapted to fit most furniture rough mills and dimension manufacturing operations.
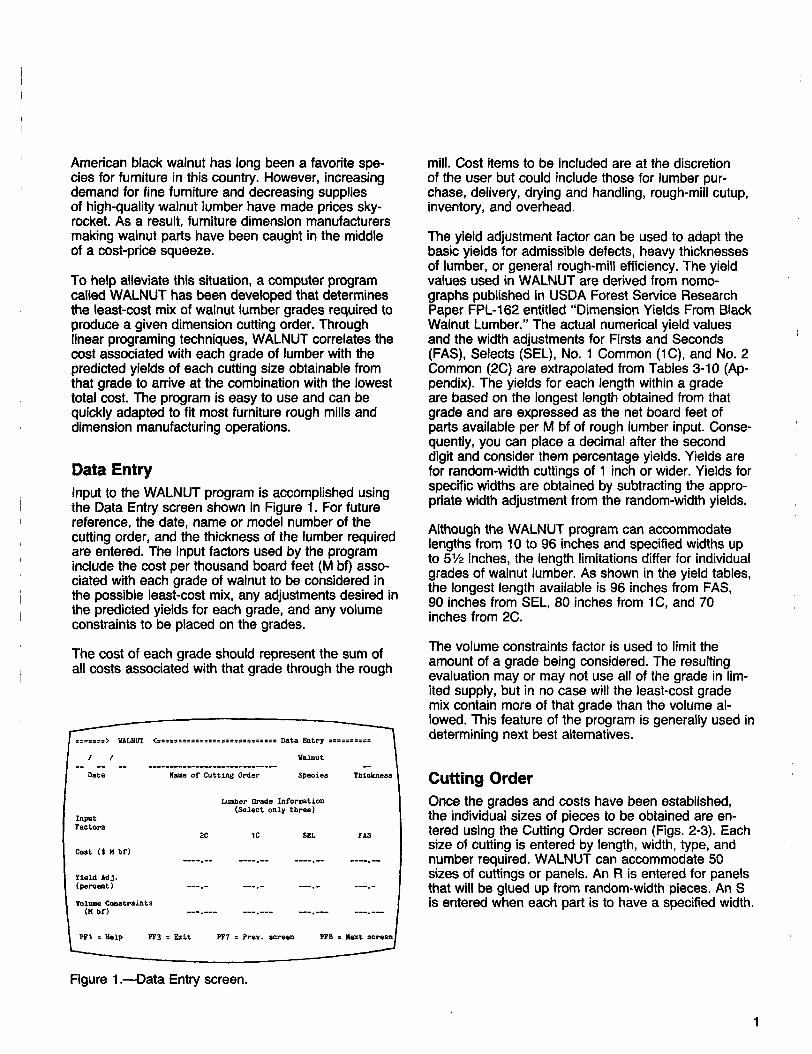
Data Entry Input to the WALNUT program is accomplished using the Data Entry screen shown in Figure 1. For future reference, the date, name or model number of the cutting order, and the thickness of the lumber required are entered. The input factors used by the program include the cost per thousand board feet (M bf) asso- ciated with each grade of walnut to be considered in the possible least-cost mix, any adjustments desired in the predicted yields for each giade, and any volume constraints to be placed on the grades.
The cost of each grade should represent the sum of all costs associated with that grade through the rough
Input Factors
Lumber Grade Information (Select only three)
2C 1C SEL FAS
PFI = Help PF3 = Exit PFI = Prev. screen PF8 = Uext screen /
mill. Cost items to be included are at the discretion of the user but could include those for lumber pur- chase, delivery, drying and handling, rough-mill cutup, inventory, and overhead.
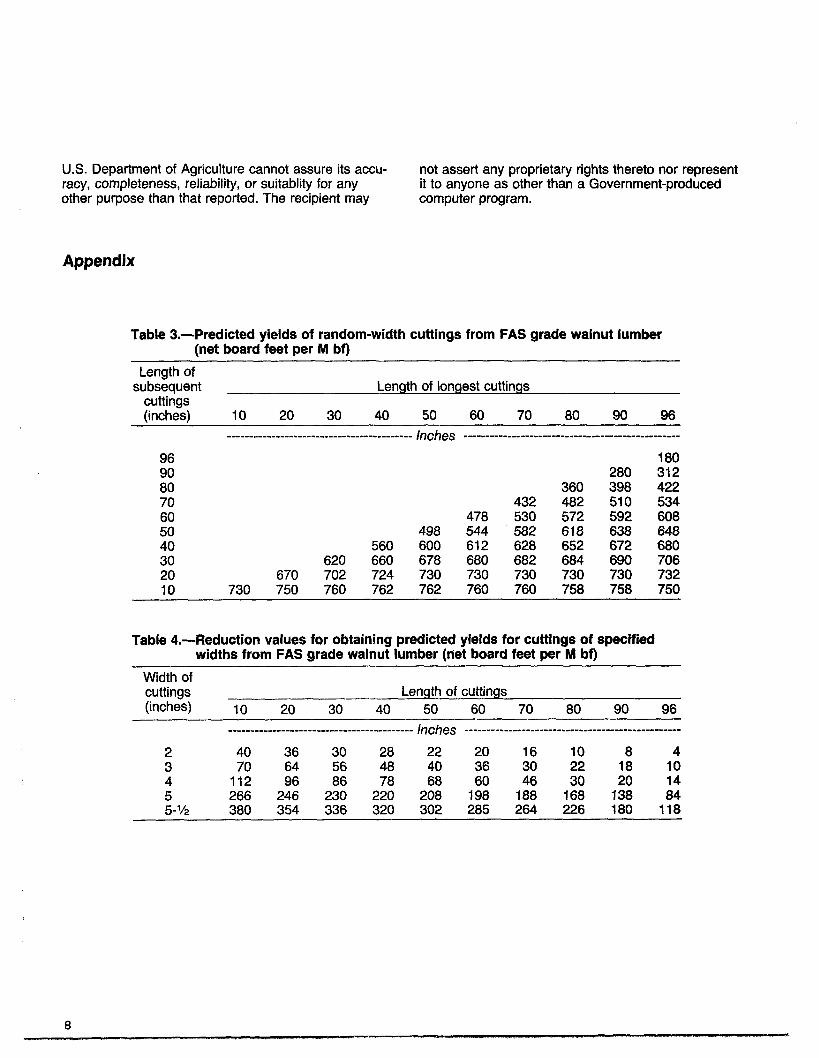
The yield adjustment factor can be used to adapt the basic yields for admissible defects, heavy thicknesses of lumber, or general rough-mill efficiency. The yield values used in WALNUT are derived from nomo- graphs published in USDA Forest Service Research Paper FPL-162 entitled "Dimension Yields From Black Walnut Lumber." The actual numerical yield values and the width adjustments for Firsts and Seconds (FAS), Selects (SEL), No. 1 Common (IC), and No. 2 Common (2C) are extrapolated from Tables 3-10 (Ap- pendix). The yields for each length within a grade are based on the longest length obtained from that grade and are expressed as the net board feet of parts available per M bf of rough lumber input. Conse- quently, you can place a decimal after the second digit and consider them percentage yields. Yields are for random-width cuttings of 1 inch or wider. Yields for specific widths are obtained by subtracting the appro- priate width adjustment from the random-width yields.
Although the WALNUT program can accommodate lengths from 10 to 96 inches and specified widths up to 5% inches, the length limitations differ for individual grades of walnut lumber. As shown in the yield tables, the longest length available is 96 inches from FAS, 90 inches from SEL, 80 inches from 1C, and 70 inches from 2C.
The volume constraints factor is used to limit the amount of a grade being considered. The resulting evaluation may or may not use all of the grade in lim- ited supply, but in no case will the least-cost grade mix contain more of that grade than the volume al- lowed. This feature of the program is generally used in determining next best alternatives.
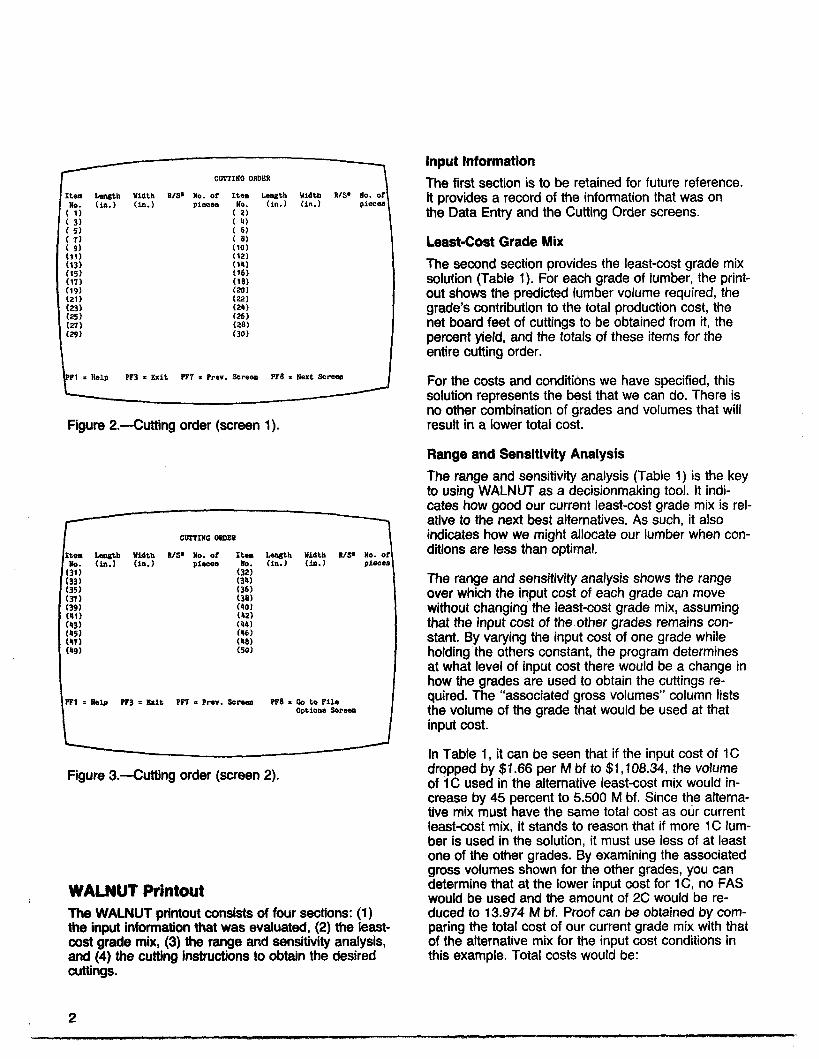
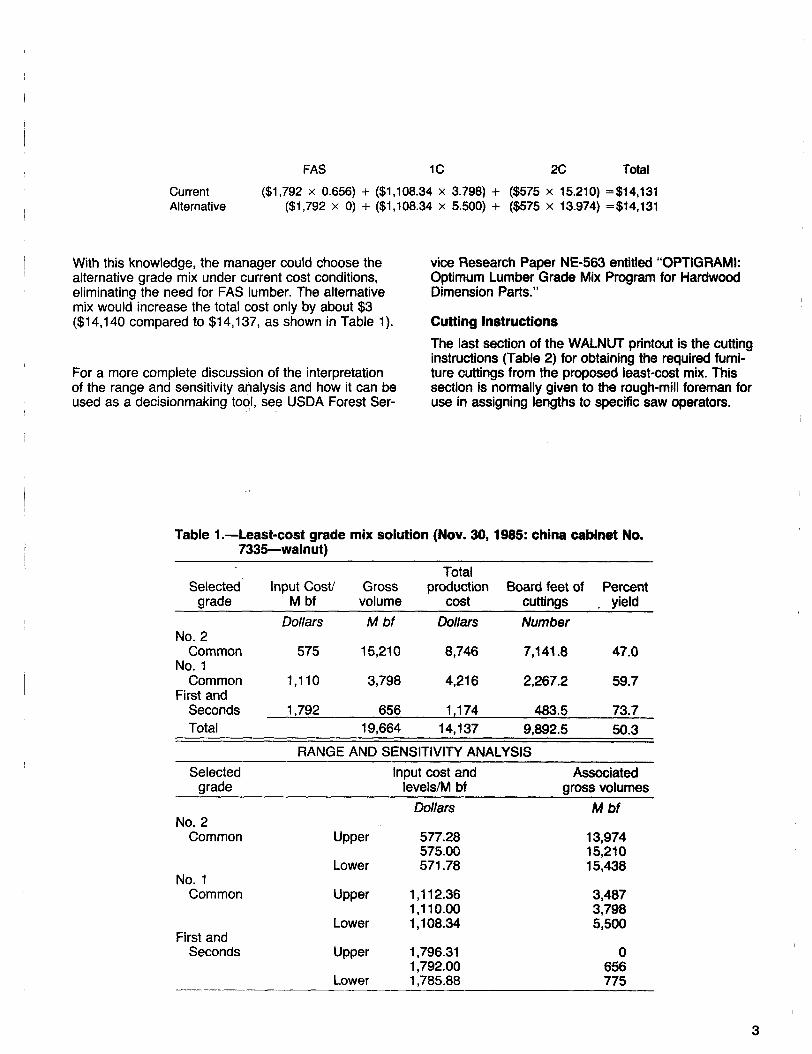
Cutting Order Once the grades and costs have been established, the individual sizes of pieces to be obtained are en- tered using the Cutting Order screen (Figs. 2-3). Each size of cutting is entered by length, width, type, and number required. WALNUT can accommodate 50 sizes of cuttings or panels. An R is entered for panels that will be glued up from random-width pieces. An S is entered when each part is to have a specified width.
Figure 1 .-Data Entry screen.
CUTTING ORDER
Width ( i n . )
Yo. or p i e c e s
Length ( i n . )
NO. or piece8
P1 = Help PF3 = Exit PFT r Prev. Screen PF8 i Next S c r e w
Figure 2.--Cutting order (screen 1).
[tea Langth Width RIS* No. or I t e a Length Width RIS* No. 01 tie. (in.) (in.) p i eoes Uo. (in.) ( in . ) pieces
(32)
PP1 = Nelp PF3 * Brit PP7 = Prev. Screen PP8 = b to P i l e Options Screen
Figure 3.--Cutting order (screen 2).
WALNUT Printout The WALNUT printout consists of four sections: (1) the input information that was evaluated, (2) the least- cost grade mix, (3) the range and sensitivity analysis, and (4) the cutting instructions to obtain the desired cuttings.
Input Information
The first section is to be retained for future reference. It provides a record of the information that was on the Data Entry and the Cutting Order screens.
Least-Cost Grade Mix
The second section provides the least-cost grade mix solution (Table 1). For each grade of lumber, the print- out shows the predicted lumber volume required, the grade's contribution to the total production cost, the net board feet of cuttings to be obtained from it, the percent yield, and the totals of these items for the entire cutting order.
For the costs and conditions we have specified, this solution represents the best that we can do. There is no other combination of grades and volumes that will result in a lower total cost.
Range and Sensitivity Analysis
The range and sensitivity analysis (Table 1) is the key to using WALNUT as a decisionmaking tool. It indi- cates how good our current least-cost grade mix is rel- ative to the next best alternatives. As such, it also indicates how we might allocate our lumber when con- ditions are less than optimal.
The range and sensitivity analysis shows the range over which the input cost of each grade can move without changing the least-cost grade mix, assuming that the input cost of the other grades remains con- stant. By varying the input cost of one grade while holding the others constant, the program determines at what level of input cost there would be a change in how the grades are used to obtain the cuttings re- quired. The "associated gross volumes" column lists the volume of the grade that would be used at that input cost.
In Table 1, it can be seen that if the input cost of 1C dropped by $1.66 per M bf to $1,108.34, the volume of 1C used in the alternative least-cost mix would in- crease by 45 percent to 5.500 M bf. Since the alterna- tive mix must have the same total cost as o1.r current least-cost mix, it stands to reason that if more 1C lum- ber is used in the solution, it must use less of at least one of the other grades. By examining the associated gross volumes shown for the other grades, you can determine that at the lower input cost for IC, no FAS would be used and the amount of 2C would be re- duced to 13.974 M bf. Proof can be obtained by com- paring the total cost of our current grade mix with that of the alternative mix for the input cost conditions in this example. Total costs would be:
FAS 1 C 2C Total
Current ($1,792 x 0.656) + ($1,108.34 x 3.798) + ($575 x 15.210) =$14,131 Alternative ($1,792 x 0) + ($1,108.34 x 5.500) + ($575 x 13.974) =$14,131
With this knowledge, the manager could choose the alternative grade mix under current cost conditions, eliminating the need for FAS lumber. The alternative mix would increase the total cost only by about $3 ($14,140 compared to $14,137, as shown in Table 1).
For a more complete discussion of the interpretation of the range and sensitivity analysis and how it can be used as a decisionmaking tool, .. see . USDA Forest Ser-
vice Research Paper NE-563 entitled "OPTIGRAMI: Optimum Lumber Grade Mix Program for Hardwood Dimension Parts."
Cutting Instructions
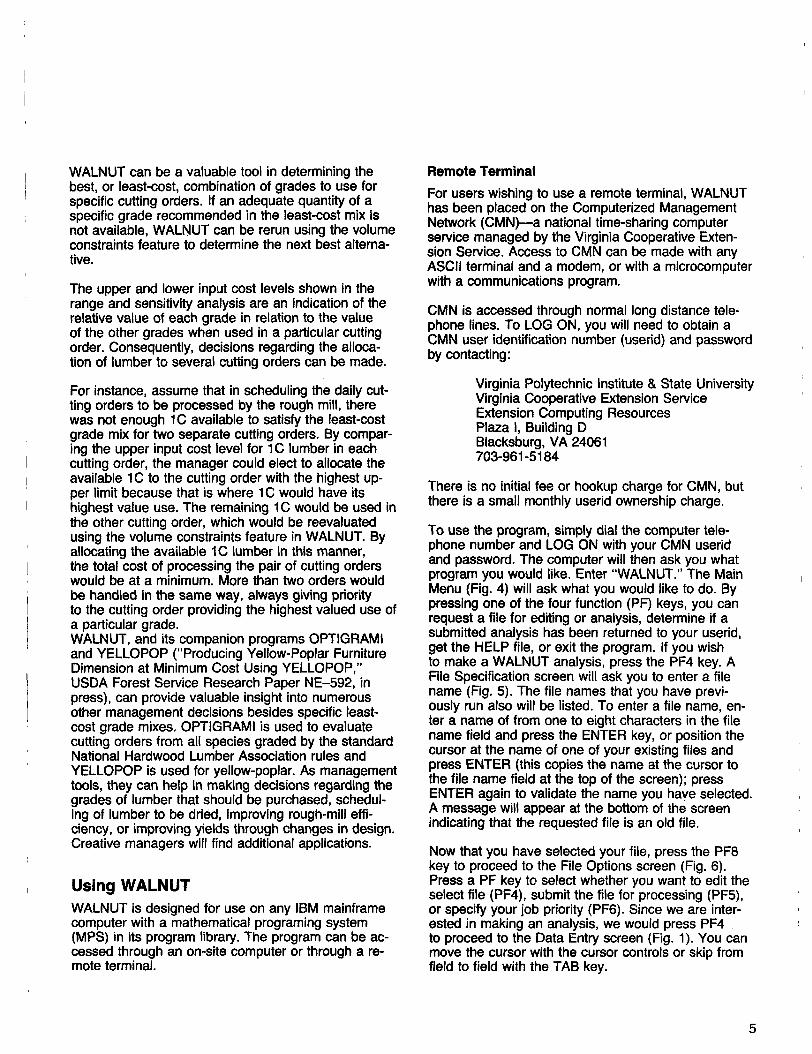
The last section of the WALNUT printout is the cutting instructions (Table 2) for obtaining the required furni- ture cuttings from the proposed least-cost mix. This section is normally given to the rough-mill foreman for use in assigning lengths to specific saw operators.
Table 1.-Least-cost grade mix solution (Nov. 30, 1985: china cabinet No. 7335--walnut)
Total Selected lnput CosV Gross production Board feet of Percent
grade M bf volume cost cuttings yield Dollars M bf Dollars Number
No. 2 Common 575 15,210 8,746 7,141.8 47.0
No. 1 Common 1,110 3,798 4,216 2,267.2 59.7
First and Seconds 1,792 656 1,174 483.5 73.7 Total 19,664 14,137 9,892.5 50.3
RANGE AND SENSITIVITY ANALYSIS Selected Input cost and Associated
qrade IevelsIM bf aross volumes
No. 2 Common
No. 1 Common
First and Seconds
- -
Dollars M bf
Upper 577.28 575.00
Lower 571.78
Upper 1,112.36 1,110.00
Lower 1,108.34
Upper 1,796.31 1,792.00
Lower 1,785.88
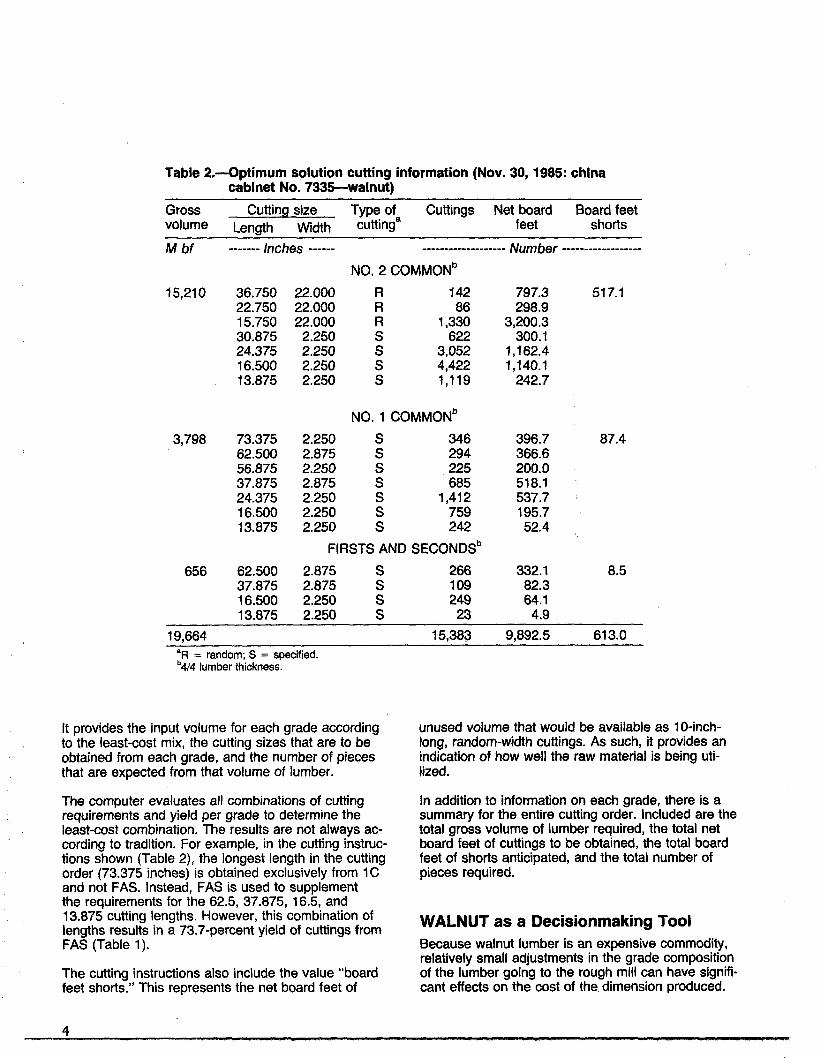
Table 2.-Optimum solution cutting information (Nov. 30, 1985: china cabinet No. 7335--walnut)
Gross Cutting size Type of Cuttings Net board Board feet volume Length Width cuttinga feet shorts
19,664 15,383 9,892.5 61 3.0 "R = random; S = specified. b4/4 lumber thickness.
It provides the input volume for each grade according to the least-cost mix, the cutting sizes that are to be obtained from each grade, and the number of pieces that are expected from that volume of lumber.
The computer evaluates all combinations of cutting requirements and yield per grade to determine the least-cost combination. The results are not always ac- cording to tradition. For example, in the cutting instruc- tions shown (Table 2), the longest length in the cutting order (73.375 inches) is obtained exclusively from 1C and not FAS. Instead, FAS is used to supplement the requirements for the 62.5, 37.875, 16.5, and 13.875 cutting lengths. However, this combination of lengths results in a 73.7-percent yield of cuttings from FAS (Table 1).
The cutting instructions also include the value "board feet shorts." This represents the net board feet of
unused volume that would be available as 1 O-inch- long, random-width cuttings. As such, it provides an indication of how well the raw material is being uti- lized.
In addition to information on each grade, there is a summary for the entire cutting order. Included are the total gross volume of lumber required, the total net board feet of cuttings to be obtained, the total board feet of shorts anticipated, and the total number of pieces required.
WALNUT as a Decisionmaking Tool Because walnut lumber is an expensive commodity, relatively small adjustments in the grade composition of the lumber going to the rough mill can have signifi- cant effects on the cost of the dimension produced.
WALNUT can be a valuable tool in determining the best, or least-cost, combination of grades to use for specific cutting orders. If an adequate quantity of a specific grade recommended in the least-cost mix is not available, WALNUT can be rerun using the volume constraints feature to determine the next best alterna- tive.
The upper and lower input cost levels shown in the range and sensitivity analysis are an indication of the relative value of each grade in relation to the value of the other grades when used in a particular cutting order. Consequently, decisions regarding the alloca- tion of lumber to several cutting orders can be made.
For instance, assume that in scheduling the daily cut- ting orders to be processed by the rough mill, there was not enough 1C available to satisfy the least-cost grade mix for two separate cutting orders. By compar- ing the upper input cost level for 1C lumber in each cutting order, the manager could elect to allocate the available 1C to the cutting order with the highest up- per limit because that is where 1C would have its highest value use. The remaining 1C would be used in the other cutting order, which would be reevaluated using the volume constraints feature in WALNUT. By allocating the available 1C lumber in this manner, the total cost of processing the pair of cutting orders would be at a minimum. More than two orders would be handled in the same way, always giving priority to the cutting order providing the highest valued use of a particular grade. WALNUT, and its companion programs OPTlGRAMl and YELLOPOP ("Producing Yellow-Poplar Furniture Dimension at Minimum Cost Using YELLOPOP," USDA Forest Service Research Paper NE-592, in press), can provide valuable insight into numerous other management decisions besides specific least- cost grade mixes. OPTlGRAMl is used to evaluate cutting orders from all species graded by the standard National Hardwood Lumber Association rules and YELLOPOP is used for yellow-poplar. As management tools, they can help in making decisions regarding the grades of lumber that should be purchased, schedul- ing of lumber to be dried, improving rough-mill effi- ciency, or improving yields through changes in design. Creative managers will find additional applications.
Using WALNUT WALNUT is designed for use on any IBM mainframe computer with a mathematical programing system (MPS) in its program library. The program can be ac- cessed through an on-site computer or through a re- mote terminal.
Remote Terminal For users wishing to use a remote terminal, WALNUT has been placed on the Computerized Management Network (CMN)-a national time-sharing computer service managed by the Virginia Cooperative Exten- sion Service. Access to CMN can be made with any ASCII terminal and a modem, or with a microcomputer with a communications program.
CMN is accessed through normal long distance tele- phone lines. To LOG ON, you will need to obtain a CMN user identification number (userid) and password by contacting:
Virginia Polytechnic Institute & State University Virginia Cooperative Extension Service Extension Computing Resources Plaza I, Building D Blacksburg, VA 24061 703-961 -51 84
There is no initial fee or hookup charge for CMN, but there is a small monthly userid ownership charge.
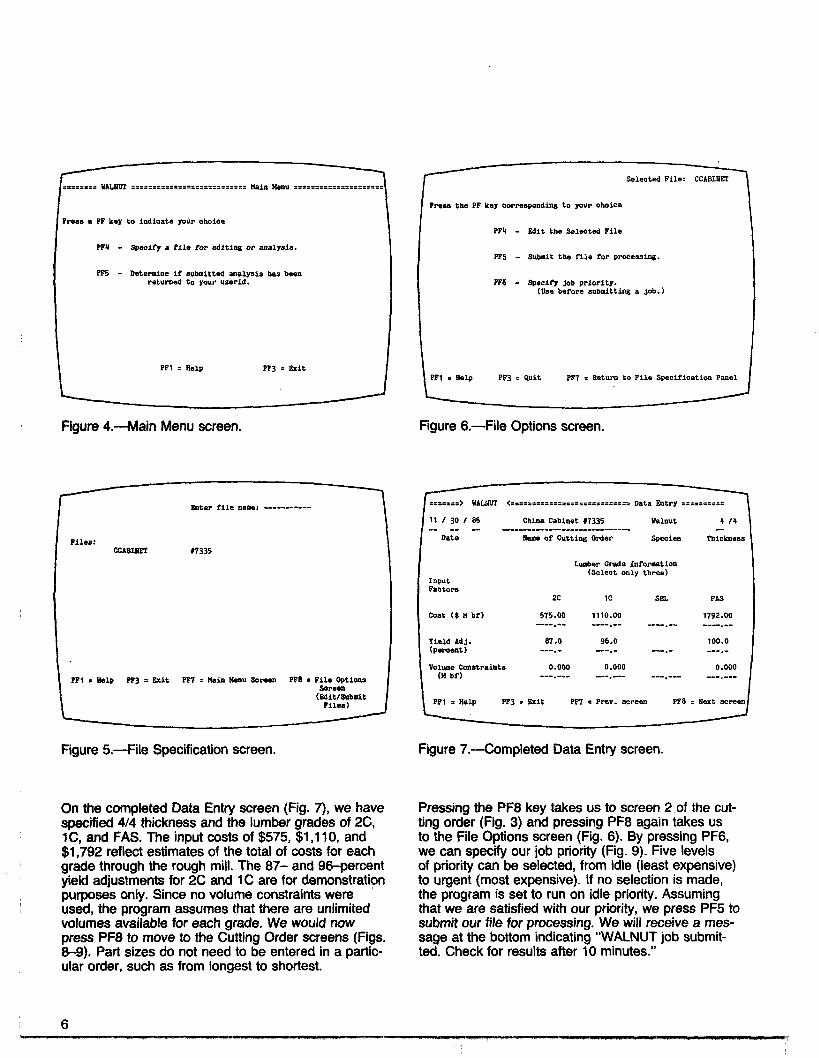
To use the program, simply dial the computer tele- phone number and LOG ON with your CMN userid and password. The computer will then ask you what program you would like. Enter "WALNUT." The Main Menu (Fig. 4) will ask what you would like to do. By pressing one of the four function (PF) keys, you can request a file for editing or analysis, determine if a submitted analysis has been returned to your userid, get the HELP file, or exit the program. If you wish to make a WALNUT analysis, press the PF4 key. A File Specification screen will ask you to enter a file name (Fig. 5). The file names that you have previ- ously run also will be listed. To enter a file name, en- ter a name of from one to eight characters in the file name field and press the ENTER key, or position the cursor at the name of one of your existing files and press ENTER (this copies the name at the cursor to the file name field at the top of the screen); press ENTER again to validate the name you have selected. A message will appear at the bottom of the screen indicating that the requested file is an old file.
Now that you have selected your file, press the PF8 key to proceed to the File Options screen (Fig. 6). Press a PF key to select whether you want to edit the select file (PF4), submit the file for processing (PF5), or specify your job priority (PF6). Since we are inter- ested in making an analysis, we would press PF4 to proceed to the Data Entry screen (Fig. 1). You can move the cursor with the cursor controls or skip from field to field with the TAB key.
ress a PF key t o ind ioa te your choice
PF4 - Specify a file f o r ed i t ing o r analysis .
P95 - Determine i f submitted ana lys i s bas been returnad t o your userid.
PFl = Help PF3 = Exi t
Figure 4.-Main Menu screen.
/
Enter f i l e n w : -----------
Files: CCABIWET 17335
PF1 z Help PF3 s Exit PF7 = Hain Menu Screen PFB = F i l e Options Screen
(i?dit/Submit F i l e a )
Figure 5.-File Specification screen.
On the completed Data Entry screen (Fig. 7), we have specified 414 thickness and the lumber grades of 2C, 1 C, and FAS. The input costs of $575, $1,110, and $1,792 reflect estimates of the total of costs for each grade through the rough mill. The 87- and 96-percent yield adjustments for 2C and 1C are for demonstration purposes only. Since no volume constraints were used, the program assumes that there are unlimited volumes available for each grade. We would now press PF8 to move to the Cutting Order screens (Figs. 8-9). Part sizes do not need to be entered in a partic- ular order, such as from longest to shortest.
Selected F i l e : CCABINET
Press t h e PP key Corresponding t o your choice
PF4 - Edi t t h e Selected F i l e
PFS - Submit t h e f i l e f o r processing.
PF6 - Specify job p r io r i ty . (Use before submitting a Job.)
PFl i Help PF3 = Qui t PF7 = Return t o P i l e Specif icat ion Panel
-.-z
Figure 6.-File Options screen.
11 / 30 1 8 5 China Cabinet 17335 Walnut 4 14 -- -- -- --------------------- -- Date Name o f Cutt ing Order Species Thicknesr
Input Factors
L d e r Grade Information (Select only th ree )
2C 1C SEL FAS
PF1 = Help PF3 = Exit PF7 : Prev. screen P F ~ = Next screw
Figure 7.--Completed Data Entry screen.
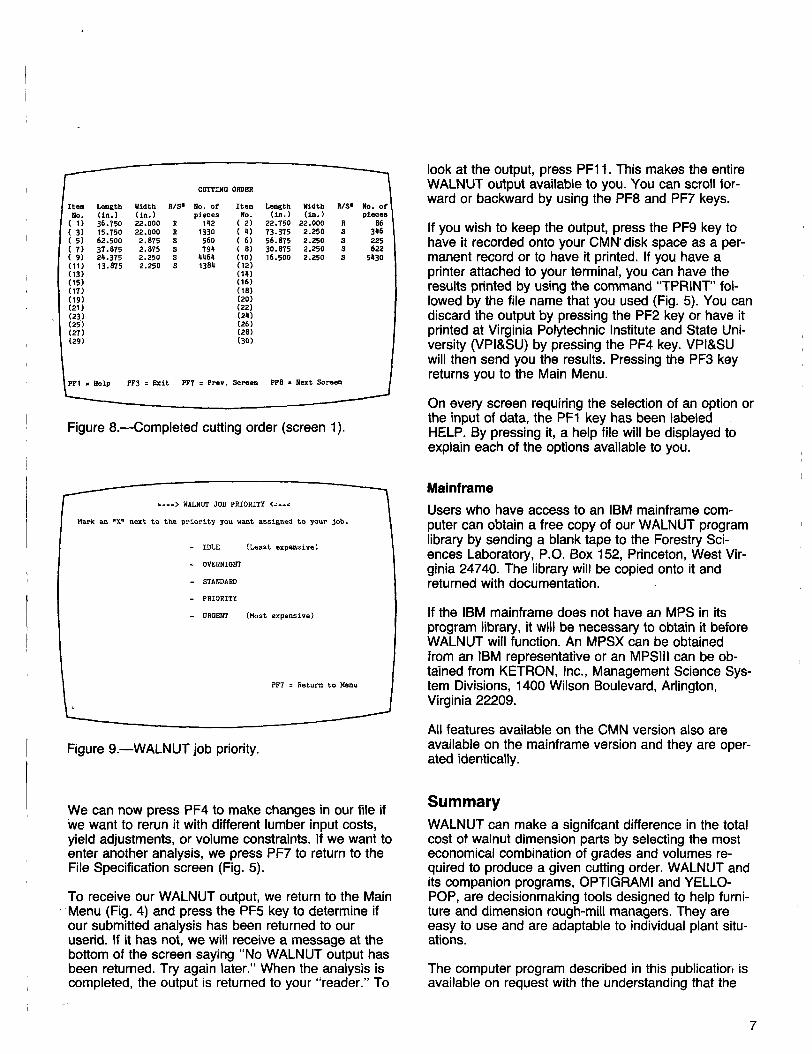
Pressing the PF8 key takes us to screen 2 of the cut- ting order (Fig. 3) and pressing PF8 again takes us to the File Options screen (Fig. 6). By pressing PF6, we can specify our job priority (Fig. 9). Five levels of priority can be selected, from idle (least expensive) to urgent (most expensive). If no selection is made, the program is set to run on idle priority. Assuming that we are satisfied with our priority, we press PF5 to submit our file for processing. We will receive a mes- sage at the bottom indicating "WALNUT job submit- ted. Check for results after 10 minutes."
I CUTTING ORDER
Item Length Width RIS* No. of Item Length Width R/S@ No. of No. ( in . ) ( in . ) pieces No. ( in . ) ( in . ) pieces
( 1 ) 36.750 22.000 R 142 ( 2 ) 22.750 22.000 R 86
PFl : Help PF3 = Exit PF7 = Prev. Screen PF8 = Next SCreeQ
Figure 8.--Completed cutting order (screen 1).
----> WALNUT JOB PRIORITY <====
Mark an "Xu next t o the priority you want assigned t o your job.
- IDLE (Least expensive)
- OVERNIGHT
- STAWARD
- PRIORITY
- URGENT (Most expensive)
PF7 = Return t o Menu
L
Figure 9.-WALNUT job priority.
We can now press PF4 to make changes in our file if we want to rerun it with different lumber input costs, yield adjustments, or volume constraints. lf we want to enter another analysis, we press PF7 to return to the File Specification screen (Fig. 5).
To receive our WALNUT output, we return to the Main Menu (Fig. 4) and press the ' P F ~ key to determine if our submitted analysis has been returned to our userid. If it has not, we will receive a message at the bottom of the screen saying "No WALNUT output has been returned. Try again later." When the analysis is completed, the output is returned to your "reader." To
look at the output, press PF11. This makes the entire WALNUT output available to you. You can scroll for- ward or backward by using the PF8 and PF7 keys.
If you wish to keep the output, press the PF9 key to have it recorded onto your CMN' disk space as a per- manent record or to have it printed. If you have a printer attached to your terminal, you can have the results printed by using the command "TPRINT" fol- lowed by the file name that you used (Fig. 5). You can discard the output by pressing the PF2 key or have it printed at Virginia Polytechnic Institute and State Uni- versity (VPI&SU) by pressing the PF4 key. VPI&SU will then send you the results. Pressing the PF3 key returns you to the Main Menu.
On every screen requiring the selection of an option or the input of data, the PF1 key has been labeled HELP. By pressing it, a help file will be displayed to explain each of the options available to you.
Mainframe
Users who have access to an IBM mainframe com- puter can obtain a free copy of our WALNUT program library by sending a blank tape to the Forestry Sci- ences Laboratory, P.O. Box 152, Princeton, West Vir- ginia 24740. The library will be copied onto it and returned with documentation.
If the IBM mainframe does not have an MPS in its program library, it will be necessary to obtain it before WALNUT will function. An MPSX can be obtained from an IBM representative or an MPSlll can be ob- tained from KETRON, lnc., Management Science Sys- tem Divisions, 1400 Wilson Boulevard, Arlington, Virginia 22209.
All features available on the CMN version also are available on the mainframe version and they are oper- ated identically.
Summary WALNUT can make a signifcant difference in the total cost of walnut dimension parts by selecting the most economical combination of grades and volumes re- quired to produce a given cutting order. WALNUT and its companion programs, OPTlGRAMl and YELLO- POP, are decisionmaking tools designed to help furni- ture and dimension rough-mill managers. They are easy to use and are adaptable to individual plant situ- ations.
The computer program described in this publicatior, is available on request with the understanding that the
U.S. Department of Agriculture cannot assure its accu- not assert any proprietary rights thereto nor represent racy, completeness, reliability, or suitablity for any it to anyone as other than a Government-produced other purpose than that reported. The recipient may computer program.
Appendix
Table 3.-Predicted yields of random-width cuttings from FAS grade walnut lumber (net board feet per M bf)
Length of subsequent Length of longest cuttings
cuttings (inches) 10 20 30 40 50 60 70 80 90 96
Table 4.-Reduction values for obtaining predicted yields for cuttings of specified widths from FAS grade walnut lumber (net board feet per M b9
Width of cuttings (inches)
Length of cuttings 10 20 30 40 50 60 70 80 90 96
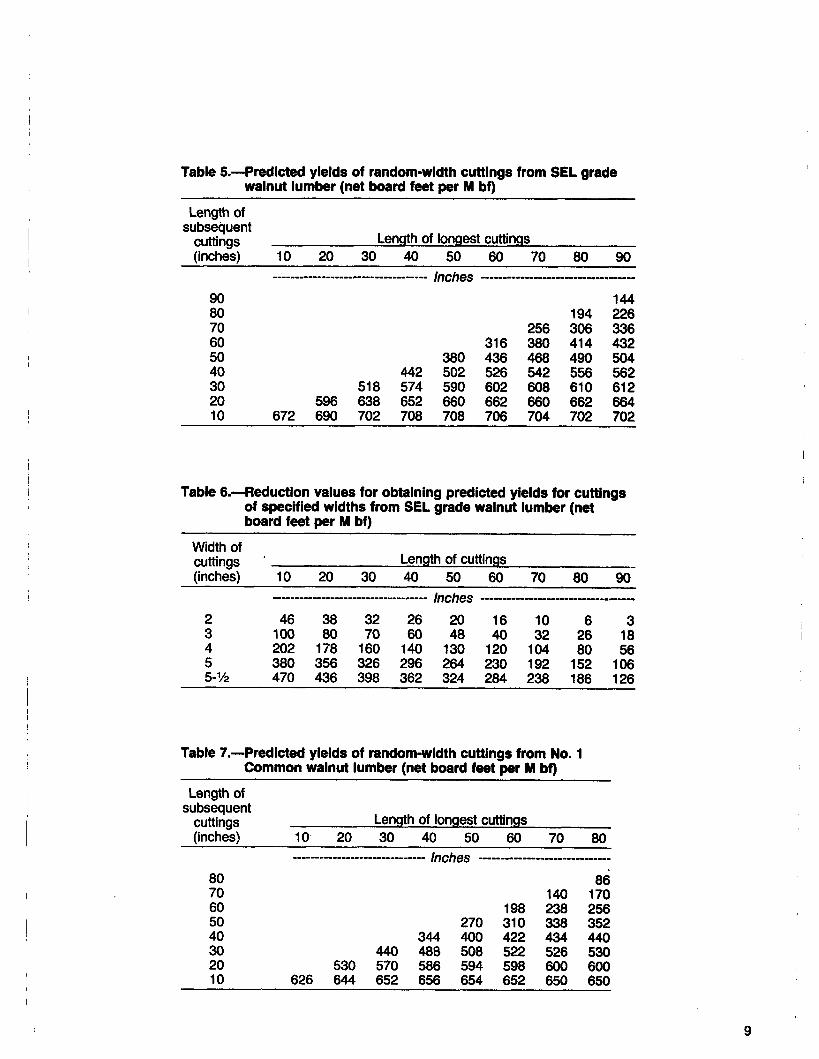
Table 5.-Predicted yields of random-width cuttings from SEL grade walnut lumber (net board feet per M bf)
Length of subsequent
cuttings Length of longest cuttings (inches) 10 20 30 40 50 60 70 80 90
Table 6.-Reduction values for obtaining predicted yields for cuttings of specified widths from SEL grade walnut lumber (net board feet per M bf)
--
Width of cuttings Length of cuttings (inches) 10 20 30 40 50 60 70 80 90
Table 7.-Predicted yields of random-width cuttings from No. 1 Common walnut lumber (net board feet per M bf)
Length of subsequent
cuttings Length of longest cuttings (inches) 10. 20 30 40 50 60 70 80
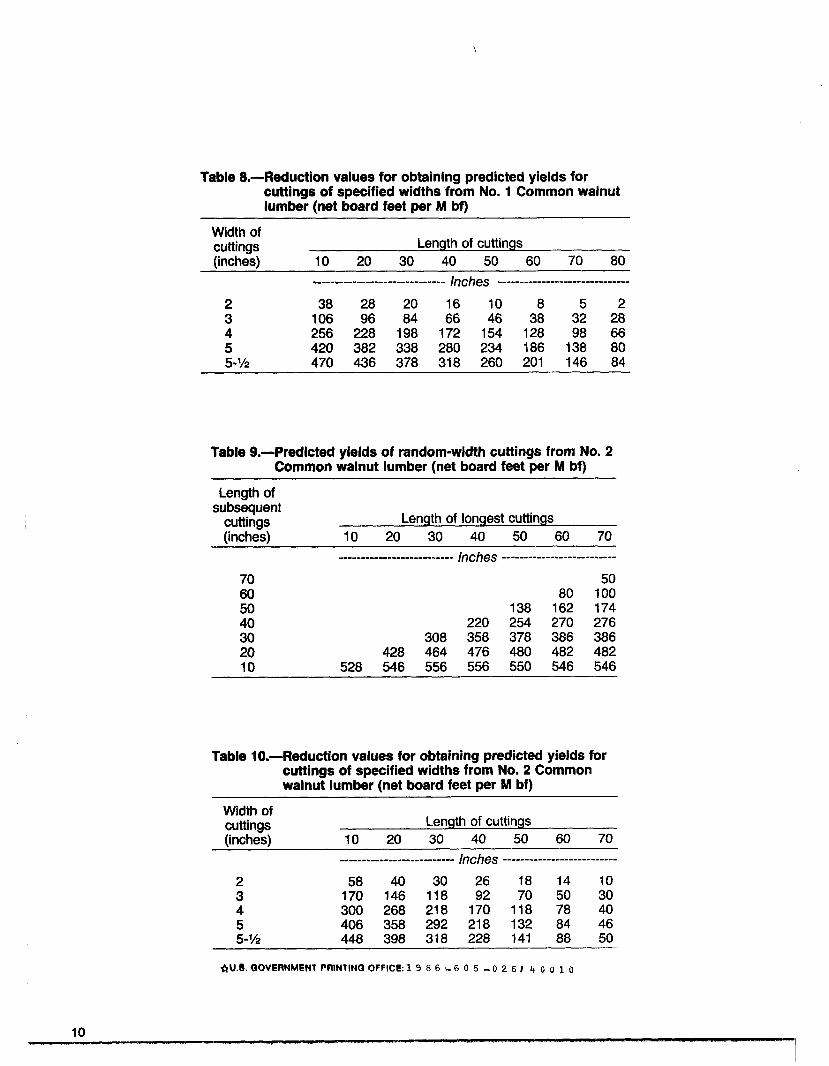
Table 8.-Reduction values for obtaining predicted yields for cuttings of specified widths from No. 1 Common walnut lumber (net board feet per M b9
Width of cuttings Length of cuttings (inches) 10 20 30 40 50 60 70 80
Table 9.-Predicted yields of random-width cuttings from No. 2 Common walnut lumber (net board feet per M bf)
Length of subsequent
cuttinas Length of longest cuttings (inches) 10 20 30 40 50 60 70
Table 10.-Reduction values for obtaining predicted yields for cuttings of specified widths from No. 2 Common walnut lumber (net board feet per M bf)
Width of cuttings Length of cuttings
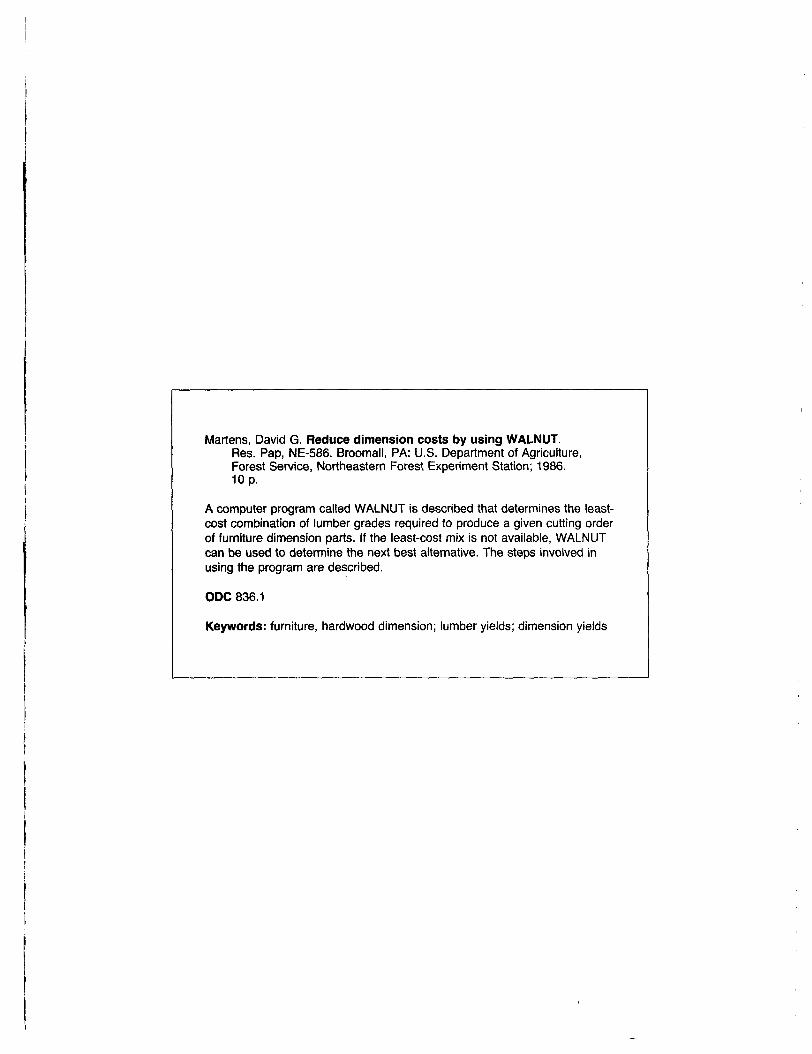
Martens, David G. Reduce dimension costs by using WALNUT. Res. Pap, NE-586. Broomall, PA: US. Department of Agriculture, Forest Service, Northeastern Forest Experiment Station; 1986. 10 p.
A computer program called WALNUT is described that determines the least- cost combination of lumber grades required to produce a given cutting order of furniture dimension parts. If the least-cost mix is not available, WALNUT can be used to determine the next best alternative. The steps involved in using the program are described.
Keywords: furniture, hardwood dimension; lumber yields; dimension yields
Headquarters of the Northeastern Forest Experiment Station are in Broomall, Pa. Field laboratories are maintained at:
Amherst, Massachusetts, in cooperation with the University of Massachusetts. Berea, Kentucky, in cooperation with Berea College. Burlington, Vermont, in cooperation with the University of Vermont. Delaware, Ohio.
0 Durham, New Hampshire, in cooperation with the University of New Hampshire.
0 Hamden, Connecticut, in cooperation with Yale University. 0 Morgantown, West Virginia, in cooperation with West Virginia
University, Morgantown. 0 Orono, Maine, in cooperation with the University of Maine,
orono. 0 Parsons, West Virginia. 0 Princeton, West Virginia. 0 Syracuse, New York, in cooperation witb the State University of
New York College of Environmental &iences and Forestry at Syracuse University, Syracuse. University Park, Pennsylvania, in cooperation with the Pennsylvania State University.
0 Warren, Pennsylvania.