Embed Size (px)
Citation preview

Real Estate CyclesGlenn R. Mueller, Ph.D.
ProfessorUniversity of Denver
Franklin L. Burns School of Real Estate & Construction Management
&
Real Estate Investment StrategistDividend Capital Research
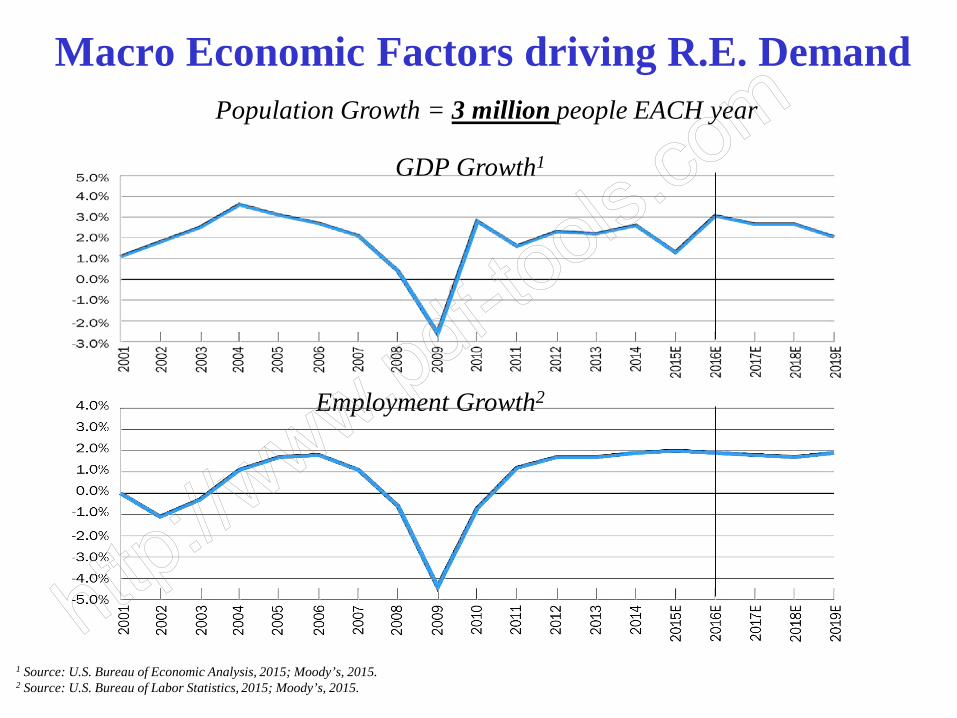
Macro Economic Factors driving R.E. DemandPopulation Growth = 3 million people EACH year
1 Source: U.S. Bureau of Economic Analysis, 2015; Moody’s, 2015.2 Source: U.S. Bureau of Labor Statistics, 2015; Moody’s, 2015.
Employment Growth2
GDP Growth1
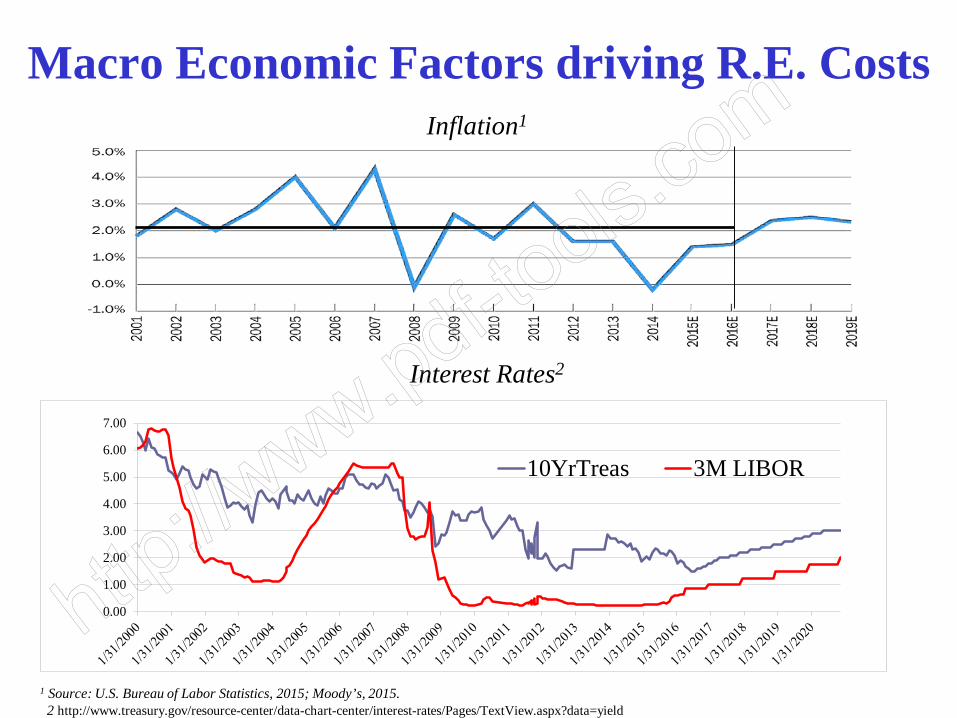
Macro Economic Factors driving R.E. Costs
1 Source: U.S. Bureau of Labor Statistics, 2015; Moody’s, 2015. 2 http://www.treasury.gov/resource-center/data-chart-center/interest-rates/Pages/TextView.aspx?data=yield
Inflation1
Interest Rates2
0.00
1.00
2.00
3.00
4.00
5.00
6.00
7.00
10YrTreas 3M LIBOR
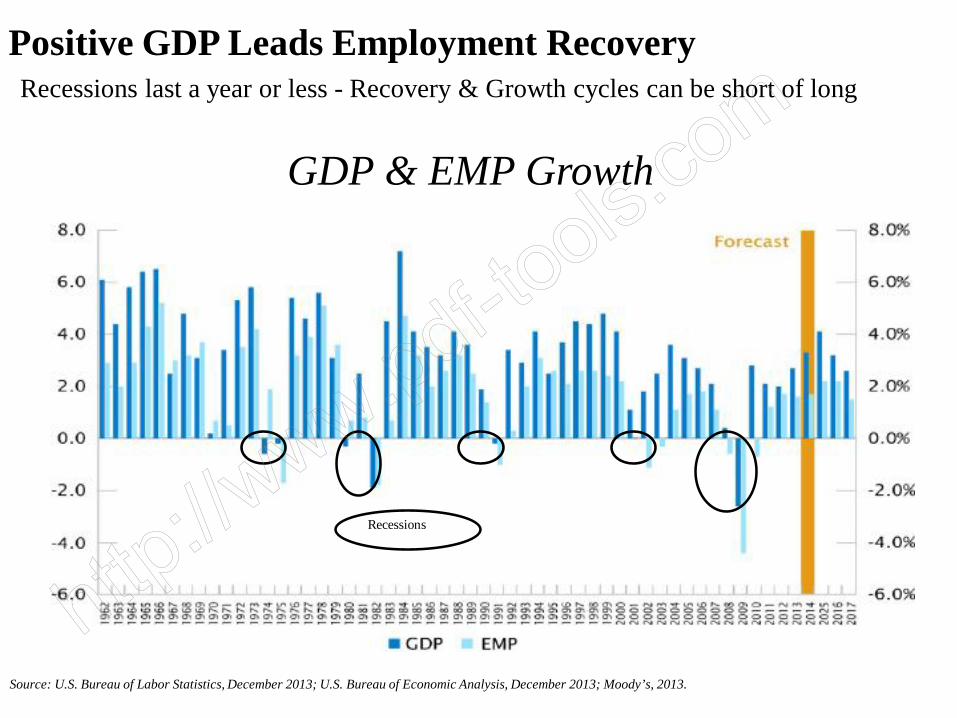
Recessions last a year or less - Recovery & Growth cycles can be short of long Positive GDP Leads Employment Recovery
Source: U.S. Bureau of Labor Statistics, December 2013; U.S. Bureau of Economic Analysis, December 2013; Moody’s, 2013.
GDP & EMP Growth
Recessions
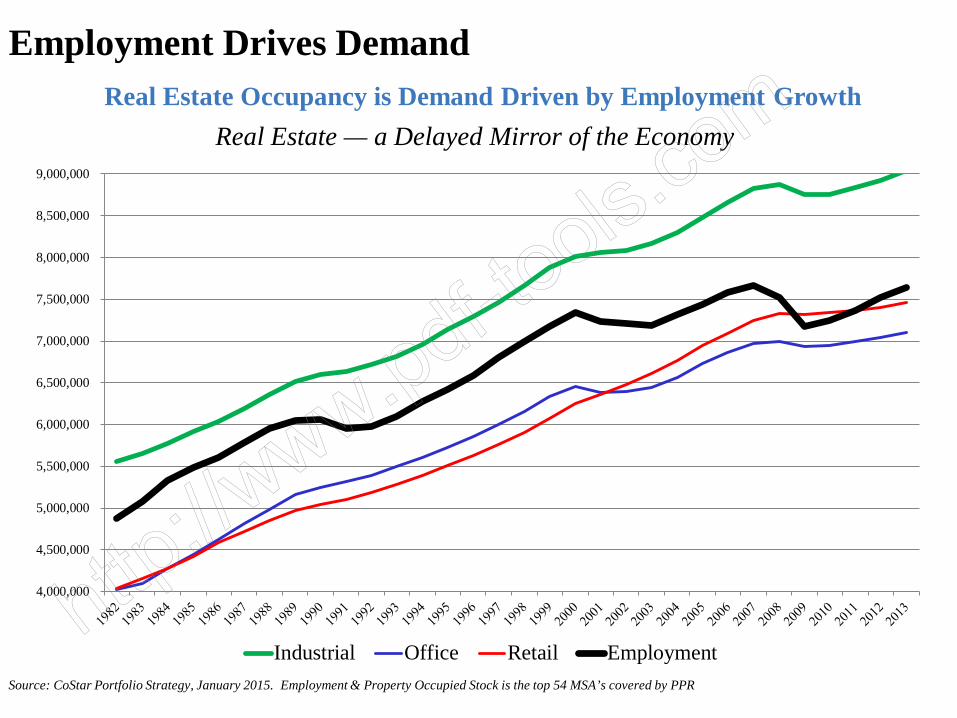
Real Estate Occupancy is Demand Driven by Employment Growth
4,000,000
4,500,000
5,000,000
5,500,000
6,000,000
6,500,000
7,000,000
7,500,000
8,000,000
8,500,000
9,000,000
Industrial Office Retail Employment
Employment Drives Demand
Real Estate — a Delayed Mirror of the Economy
Source: CoStar Portfolio Strategy, January 2015. Employment & Property Occupied Stock is the top 54 MSA’s covered by PPR
US Commercial Real Estate CycleFollows US Economic Cycles
3 Key Metrics:• Occupancies
• Rents• Property Prices
Source: Glenn Mueller, PhD
Market Cycle Analysis
Physical Cycle
Demand & Supply drive OccupancyOccupancy drives Rental Growth
Occupancy + Rent = Income Growth
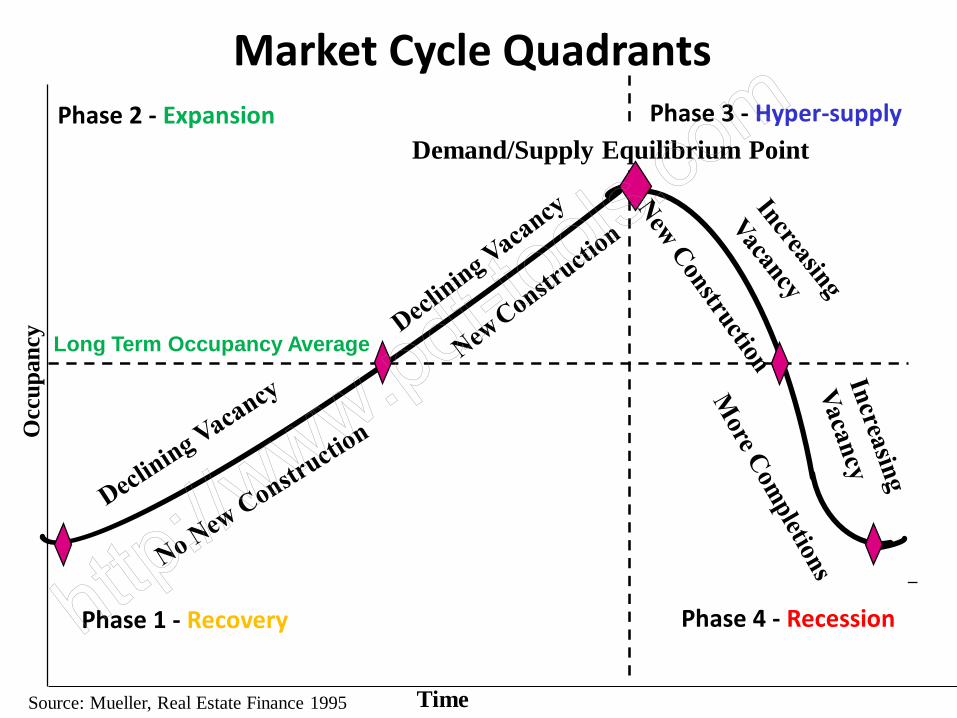
Source: Mueller, Real Estate Finance 1995
Market Cycle Quadrants
Phase 1 - Recovery
Phase 2 - Expansion
Phase 4 - Recession
Demand/Supply Equilibrium Point
Long Term Occupancy Average
Occ
upan
cy
Time
Phase 3 - Hyper-supply
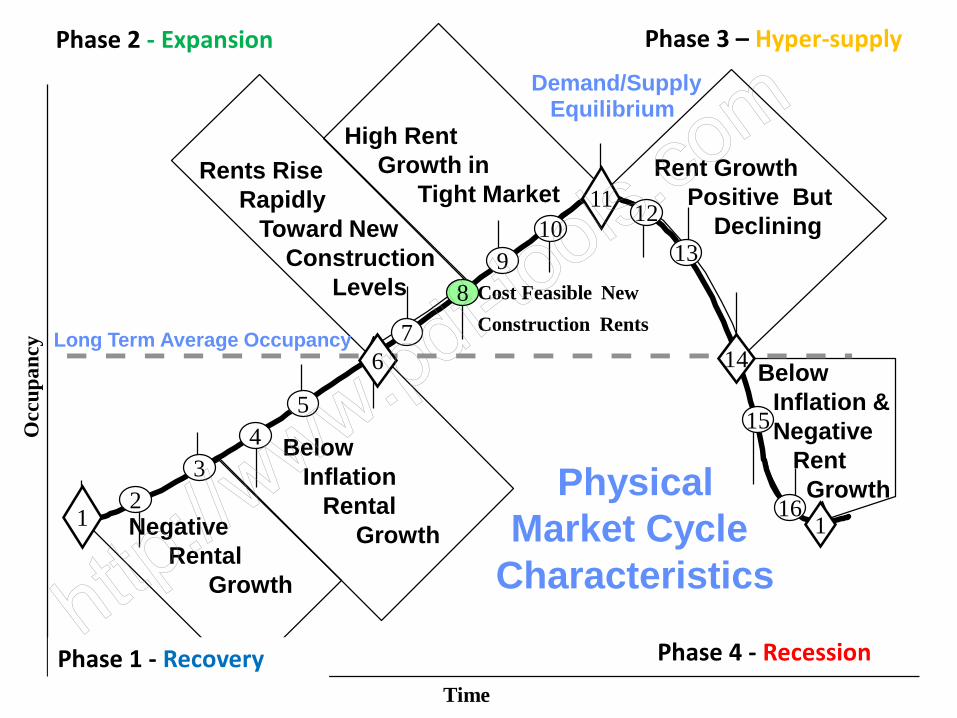
PhysicalMarket Cycle
CharacteristicsNegative
RentalGrowth
BelowInflation
RentalGrowth
Rents Rise Rapidly
Toward New Construction
Levels
High RentGrowth in
Tight Market
Demand/SupplyEquilibrium
Rent GrowthPositive But
Declining
-Below Inflation &Negative
RentGrowth
Cost Feasible NewConstruction Rents
Long Term Average Occupancy
Occ
upan
cy
Time
1467
8
1012
13
1
15
16
54
32
11
9
1
Phase 1 - Recovery
Phase 2 - Expansion
Phase 4 - Recession
Phase 3 – Hyper-supply
2
54
3
89
7
10
16
15
13
1
6
11
14
1
12
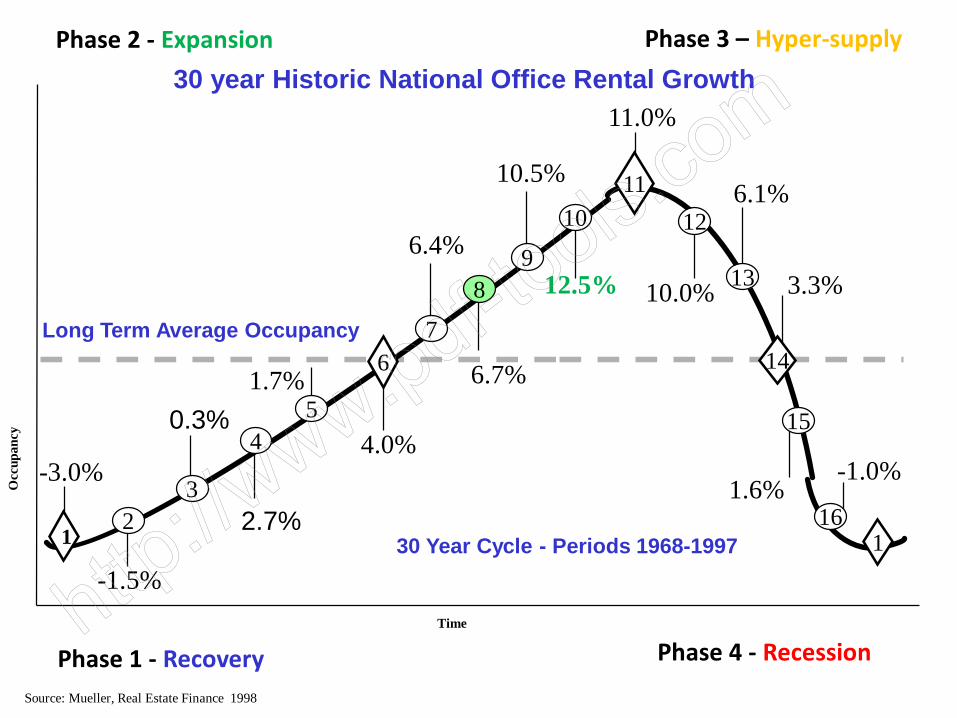
0.3%
2.7%
-3.0%
-1.5%
1.7%
4.0%
6.4%
11.0%
12.5%
10.5%
6.7%
-1.0%1.6%
3.3%
6.1%
10.0%
30 year Historic National Office Rental Growth
30 Year Cycle - Periods 1968-1997
Long Term Average Occupancy
Occ
upan
cy
Time
Phase 1 - Recovery
Phase 2 - Expansion
Phase 4 - Recession
Phase 3 – Hyper-supply
Source: Mueller, Real Estate Finance 1998
2
54
3
89
7
10
16
15
13
1
6
11
14
1
12
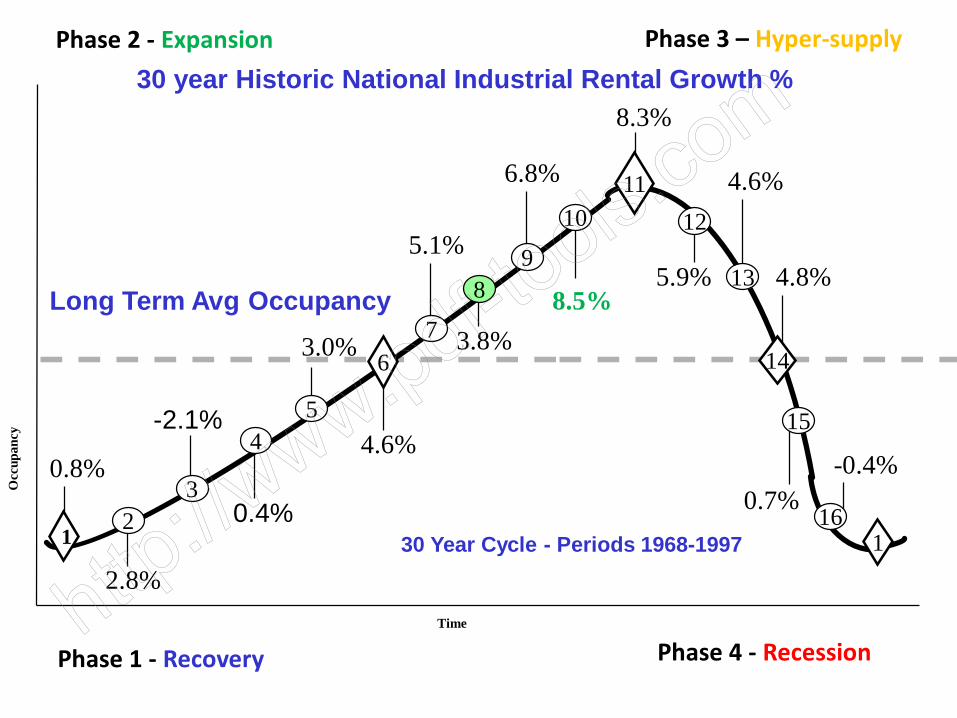
-2.1%
30 year Historic National Industrial Rental Growth %
0.4%0.8%
2.8%
3.0%
4.6%
5.1%
8.3%
8.5%
6.8%
3.8%
-0.4%0.7%
4.8%
4.6%
5.9%
30 Year Cycle - Periods 1968-1997
Long Term Avg Occupancy
Occ
upan
cy
Time
Phase 1 - Recovery
Phase 2 - Expansion
Phase 4 - Recession
Phase 3 – Hyper-supply
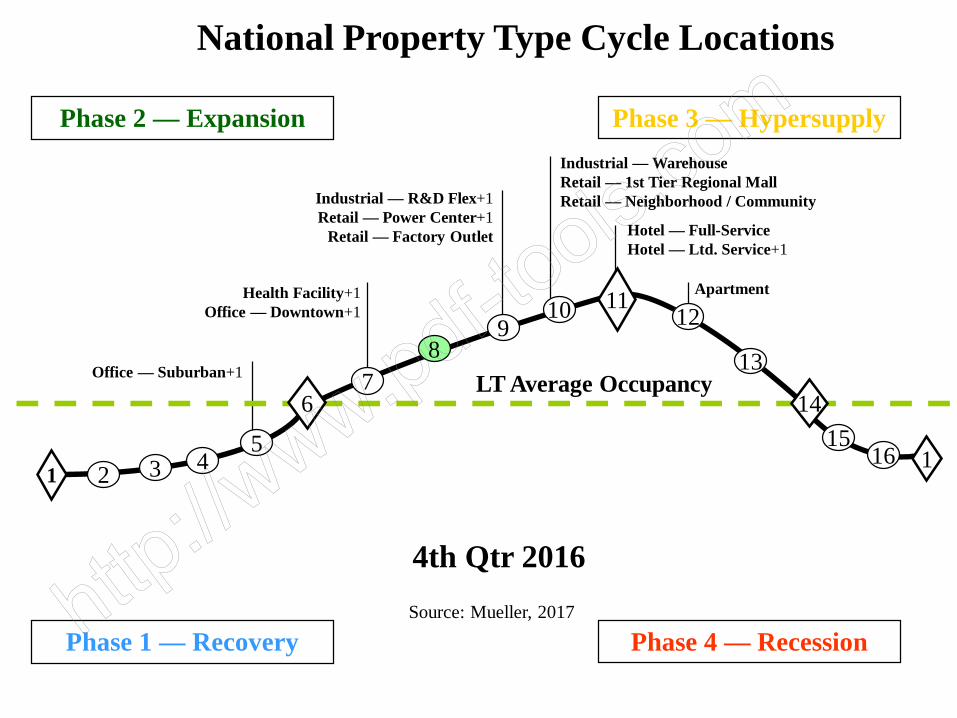
National Property Type Cycle Locations
4th Qtr 2016
LT Average Occupancy
Source: Mueller, 2017
Phase 2 — Expansion
Phase 1 — Recovery
Phase 3 — Hypersupply
Phase 4 — Recession
11
1467
89
10 12
13
1165421
15
Health Facility+1Office — Downtown+1
Office — Suburban+1
3
Industrial — WarehouseRetail — 1st Tier Regional MallRetail — Neighborhood / Community
Apartment
Hotel — Full-ServiceHotel — Ltd. Service+1
Industrial — R&D Flex+1Retail — Power Center+1
Retail — Factory Outlet
Houston
LT Average Occupancy
Source: Mueller, 2017
11
146
89
10 12
115
1654321
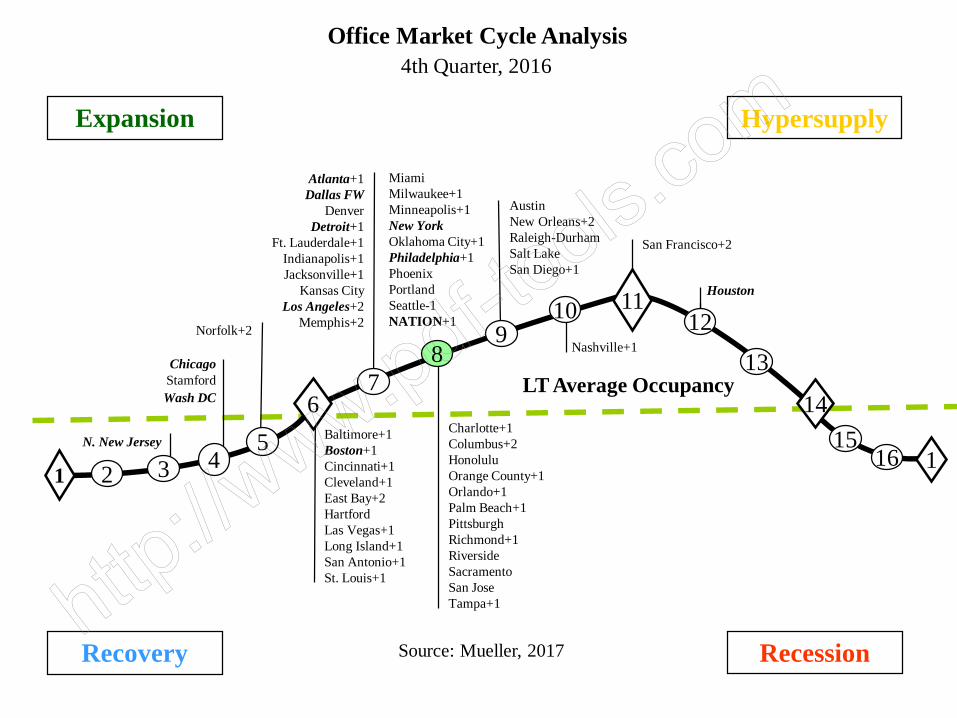
Office Market Cycle Analysis4th Quarter, 2016
713
N. New Jersey
Atlanta+1Dallas FW
DenverDetroit+1
Ft. Lauderdale+1Indianapolis+1Jacksonville+1
Kansas CityLos Angeles+2
Memphis+2
Charlotte+1Columbus+2HonoluluOrange County+1Orlando+1Palm Beach+1PittsburghRichmond+1RiversideSacramentoSan JoseTampa+1
AustinNew Orleans+2 Raleigh-DurhamSalt LakeSan Diego+1
Baltimore+1Boston+1Cincinnati+1Cleveland+1East Bay+2HartfordLas Vegas+1Long Island+1San Antonio+1St. Louis+1
ChicagoStamfordWash DC
Recovery Recession
Expansion Hypersupply
San Francisco+2
Nashville+1Norfolk+2
MiamiMilwaukee+1Minneapolis+1New YorkOklahoma City+1Philadelphia+1PhoenixPortlandSeattle-1NATION+1
BostonColumbus
Ft. LauderdaleIndianapolis
Las VegasLong Island+1
Source: Mueller, 2017
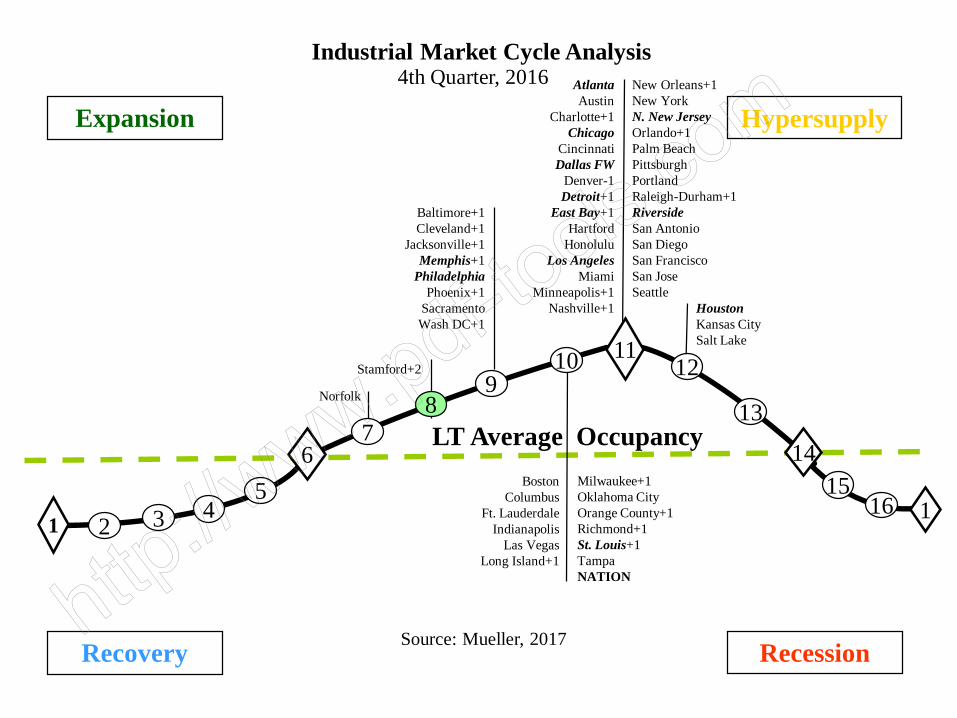
1467
8
10 12
13
115
1654321
LT Average Occupancy
Industrial Market Cycle Analysis
11Stamford+2
Baltimore+1Cleveland+1
Jacksonville+1Memphis+1
PhiladelphiaPhoenix+1
SacramentoWash DC+1
AtlantaAustin
Charlotte+1Chicago
CincinnatiDallas FW
Denver-1Detroit+1
East Bay+1Hartford
HonoluluLos Angeles
MiamiMinneapolis+1
Nashville+1
9
4th Quarter, 2016
Norfolk
HoustonKansas CitySalt Lake
Milwaukee+1Oklahoma CityOrange County+1 Richmond+1St. Louis+1TampaNATION
New Orleans+1New YorkN. New JerseyOrlando+1Palm BeachPittsburghPortlandRaleigh-Durham+1RiversideSan AntonioSan DiegoSan FranciscoSan JoseSeattle
Recovery Recession
Expansion Hypersupply
Source: Mueller, 2017
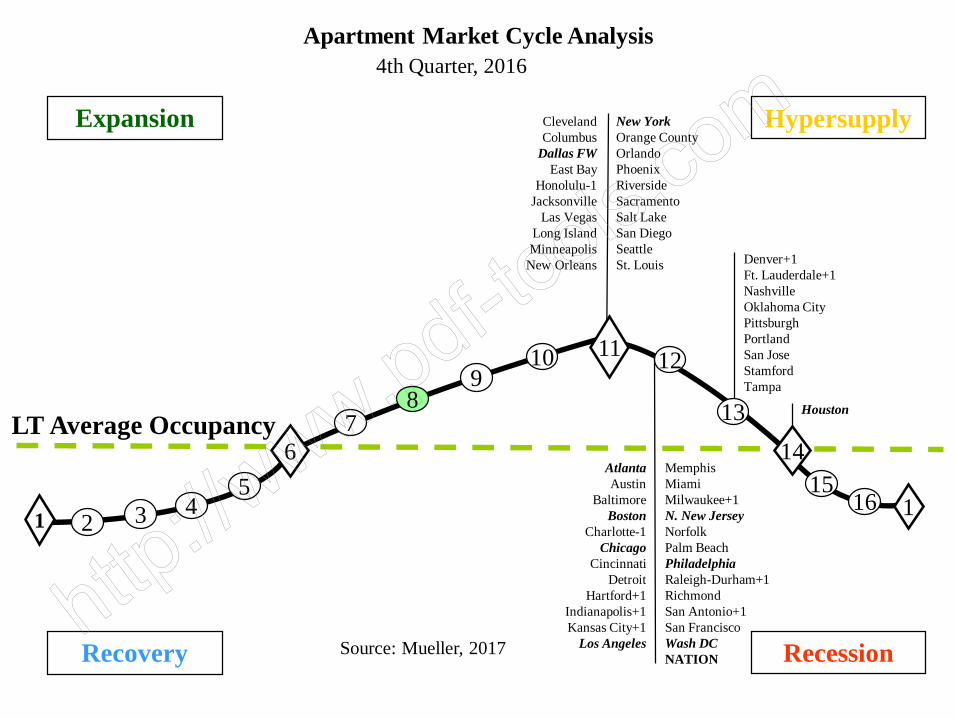
11
1467
89
10 12
115
1654
21
LT Average Occupancy
Apartment Market Cycle Analysis
13
ClevelandColumbus
Dallas FWEast Bay
Honolulu-1Jacksonville
Las VegasLong IslandMinneapolis
New Orleans
3
AtlantaAustin
BaltimoreBoston
Charlotte-1Chicago
CincinnatiDetroit
Hartford+1Indianapolis+1Kansas City+1
Los Angeles
New YorkOrange CountyOrlandoPhoenixRiversideSacramentoSalt LakeSan DiegoSeattleSt. Louis
4th Quarter, 2016
Denver+1Ft. Lauderdale+1NashvilleOklahoma CityPittsburghPortlandSan JoseStamfordTampa
MemphisMiamiMilwaukee+1N. New JerseyNorfolkPalm BeachPhiladelphiaRaleigh-Durham+1RichmondSan Antonio+1San FranciscoWash DCNATIONRecovery Recession
Expansion Hypersupply
Houston
Source: Mueller, 2017
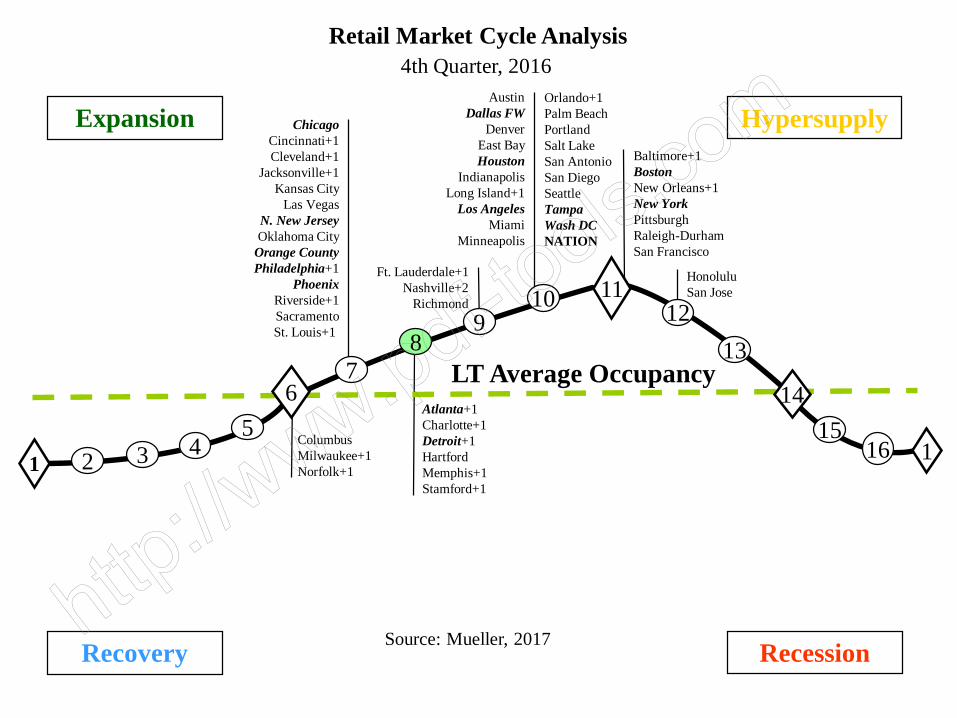
11
1467
89 12
13
115
165
4321
Retail Market Cycle Analysis
10
LT Average OccupancyAtlanta+1Charlotte+1Detroit+1HartfordMemphis+1Stamford+1
ChicagoCincinnati+1Cleveland+1
Jacksonville+1Kansas City
Las VegasN. New JerseyOklahoma City
Orange CountyPhiladelphia+1
PhoenixRiverside+1SacramentoSt. Louis+1
AustinDallas FW
DenverEast BayHouston
IndianapolisLong Island+1
Los AngelesMiami
Minneapolis
Baltimore+1BostonNew Orleans+1New YorkPittsburghRaleigh-DurhamSan Francisco
ColumbusMilwaukee+1Norfolk+1
Ft. Lauderdale+1Nashville+2
Richmond
4th Quarter, 2016
HonoluluSan Jose
Orlando+1 Palm BeachPortlandSalt Lake San AntonioSan DiegoSeattleTampaWash DCNATION
Recovery Recession
Expansion Hypersupply
Source: Mueller, 2017
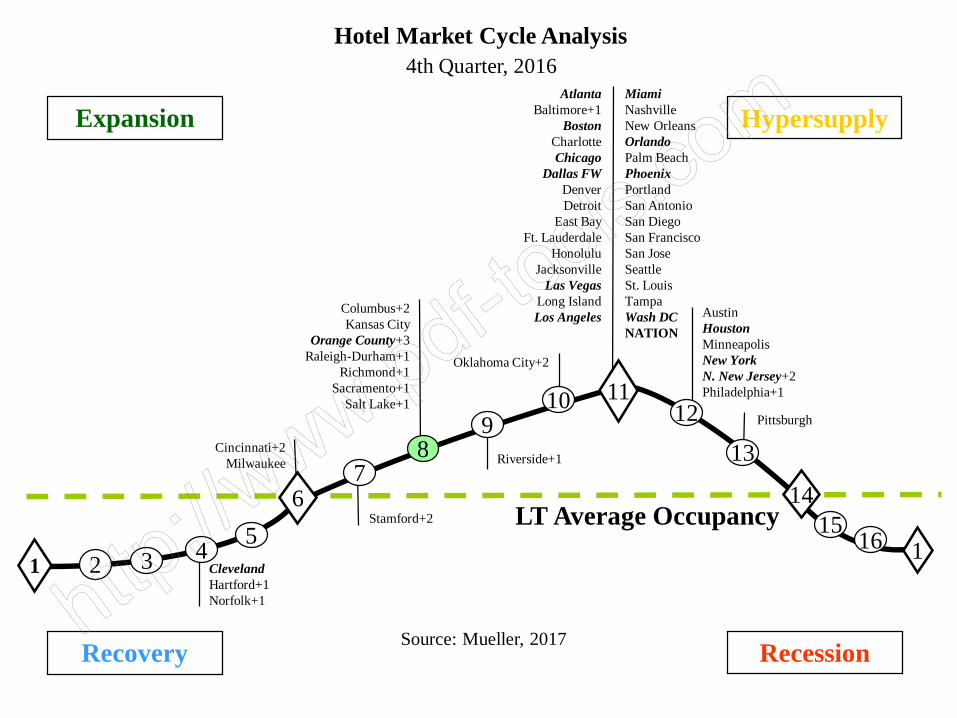
1467
89 12
13
115
1654321
1110
LT Average Occupancy
Hotel Market Cycle Analysis
Cincinnati+2Milwaukee
AtlantaBaltimore+1
BostonCharlotteChicago
Dallas FWDenverDetroit
East BayFt. Lauderdale
HonoluluJacksonville
Las VegasLong IslandLos Angeles Austin
HoustonMinneapolisNew YorkN. New Jersey+2Philadelphia+1
4th Quarter, 2016
Columbus+2Kansas City
Orange County+3Raleigh-Durham+1
Richmond+1Sacramento+1
Salt Lake+1Pittsburgh
MiamiNashvilleNew OrleansOrlandoPalm BeachPhoenixPortlandSan AntonioSan DiegoSan FranciscoSan JoseSeattleSt. LouisTampaWash DCNATION
ClevelandHartford+1Norfolk+1
Recovery Recession
Expansion Hypersupply
Oklahoma City+2
Riverside+1
Stamford+2
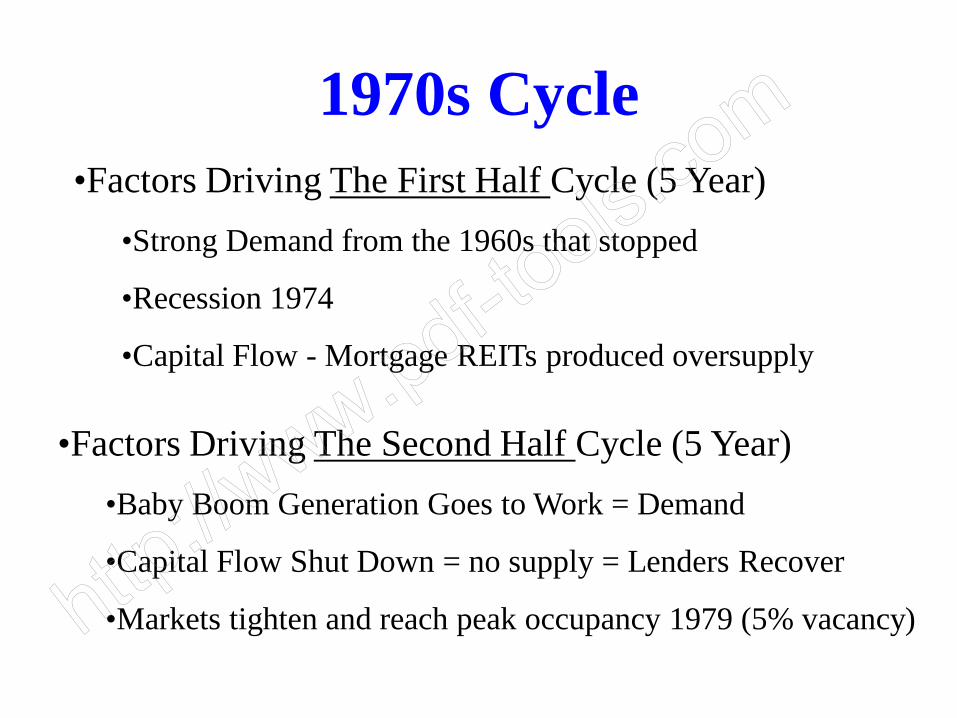
1970s Cycle•Factors Driving The First Half Cycle (5 Year)
•Strong Demand from the 1960s that stopped
•Recession 1974
•Capital Flow - Mortgage REITs produced oversupply
•Factors Driving The Second Half Cycle (5 Year)•Baby Boom Generation Goes to Work = Demand
•Capital Flow Shut Down = no supply = Lenders Recover
•Markets tighten and reach peak occupancy 1979 (5% vacancy)
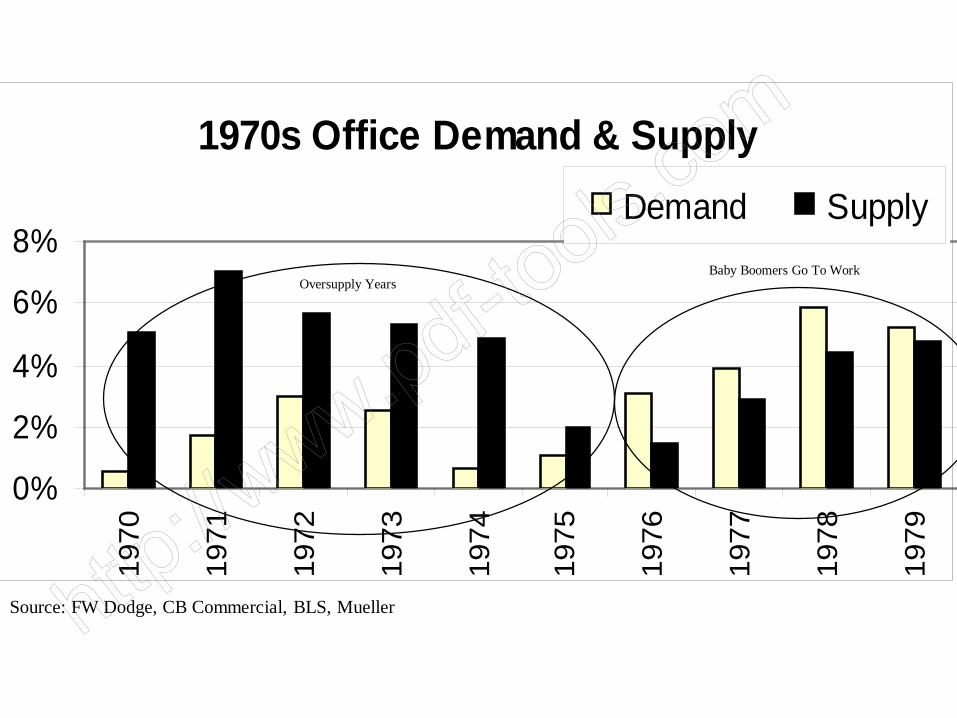
1970s Office Demand & Supply
0%
2%
4%
6%
8%
1970
1971
1972
1973
1974
1975
1976
1977
1978
1979
Demand Supply
Source: FW Dodge, CB Commercial, BLS, Mueller
Oversupply YearsBaby Boomers Go To Work
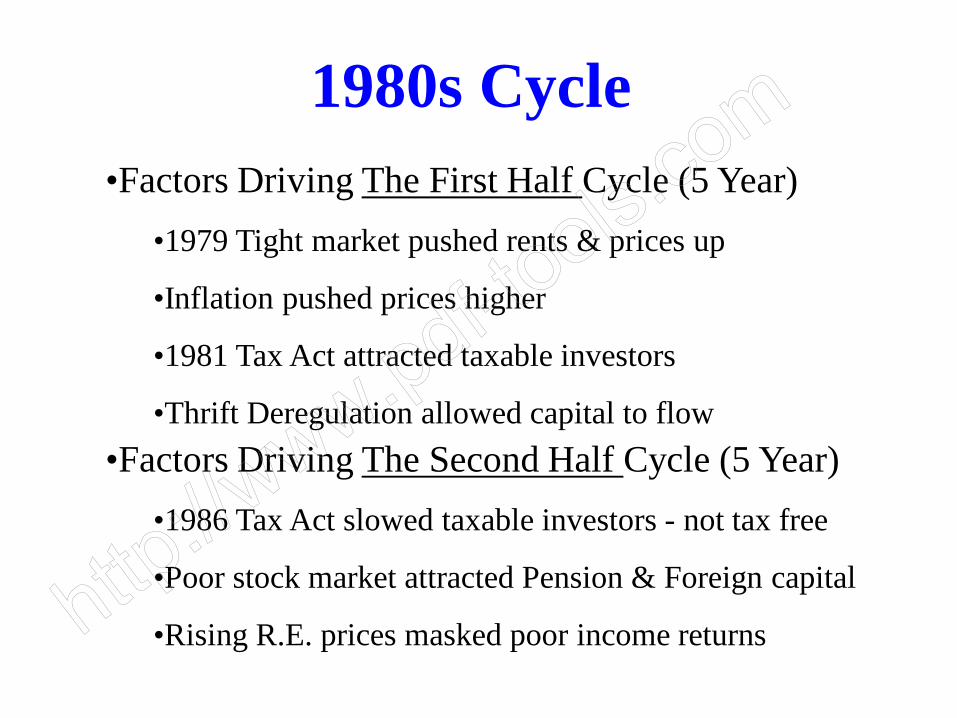
1980s Cycle•Factors Driving The First Half Cycle (5 Year)
•1979 Tight market pushed rents & prices up
•Inflation pushed prices higher
•1981 Tax Act attracted taxable investors
•Thrift Deregulation allowed capital to flow•Factors Driving The Second Half Cycle (5 Year)
•1986 Tax Act slowed taxable investors - not tax free
•Poor stock market attracted Pension & Foreign capital
•Rising R.E. prices masked poor income returns
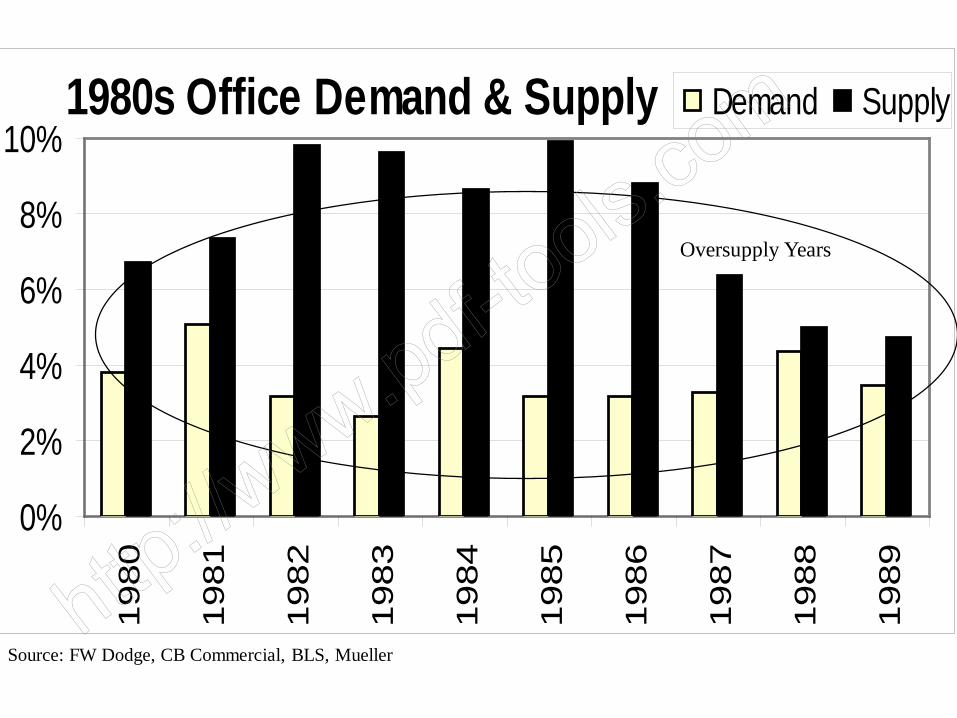
1980s Office Demand & Supply
0%
2%
4%
6%
8%
10%1980
1981
1982
1983
1984
1985
1986
1987
1988
1989
Demand Supply
Source: FW Dodge, CB Commercial, BLS, Mueller
Oversupply Years
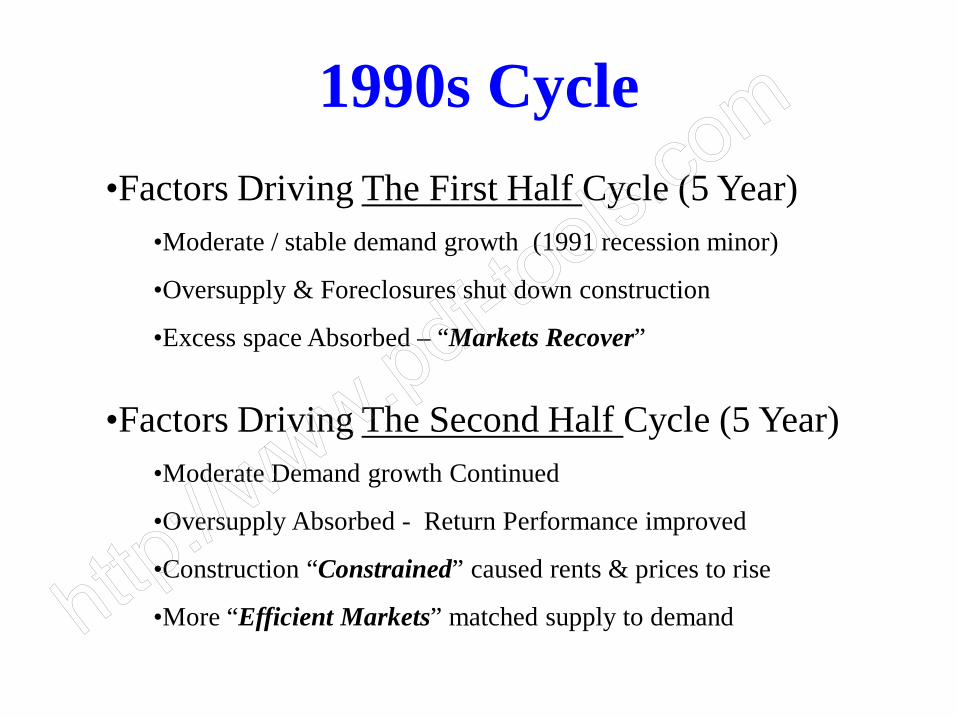
1990s Cycle•Factors Driving The First Half Cycle (5 Year)
•Moderate / stable demand growth (1991 recession minor)
•Oversupply & Foreclosures shut down construction
•Excess space Absorbed – “Markets Recover”
•Factors Driving The Second Half Cycle (5 Year)•Moderate Demand growth Continued
•Oversupply Absorbed - Return Performance improved
•Construction “Constrained” caused rents & prices to rise
•More “Efficient Markets” matched supply to demand
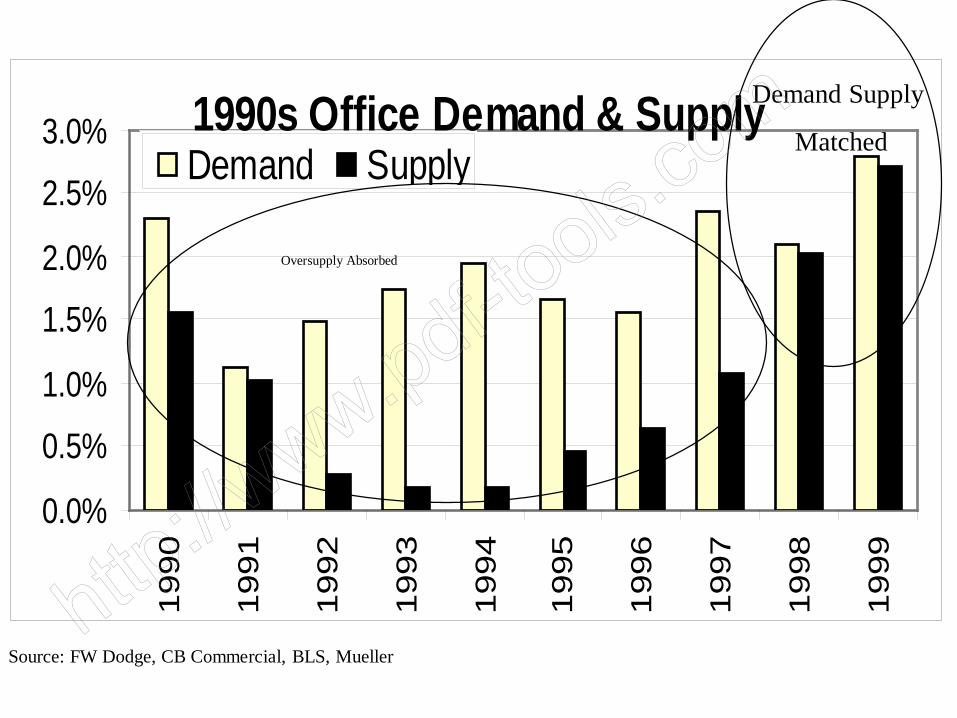
1990s Office Demand & Supply
0.0%
0.5%
1.0%
1.5%
2.0%
2.5%
3.0%19
90
1991
1992
1993
1994
1995
1996
1997
1998
1999
Demand Supply
Source: FW Dodge, CB Commercial, BLS, Mueller
Oversupply Absorbed
Demand Supply
Matched
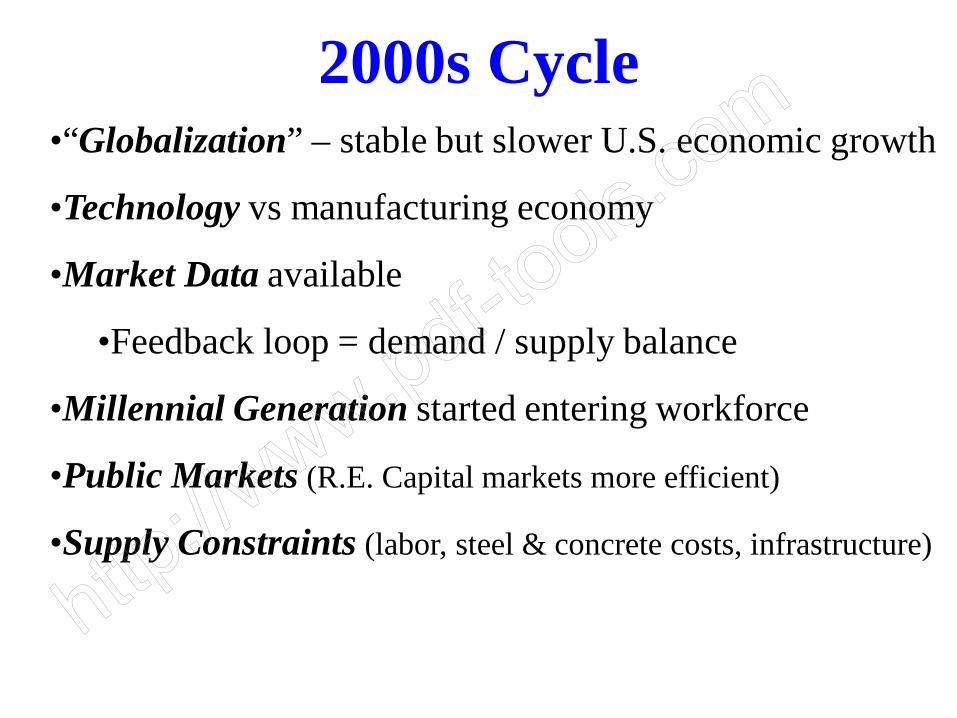
2000s Cycle•“Globalization” – stable but slower U.S. economic growth
•Technology vs manufacturing economy
•Market Data available
•Feedback loop = demand / supply balance
•Millennial Generation started entering workforce
•Public Markets (R.E. Capital markets more efficient)
•Supply Constraints (labor, steel & concrete costs, infrastructure)
-1.0%
-0.5%
0.0%
0.5%
1.0%
1.5%
2.0%
2.5%
3.0%
2000 2001 2002 2003 2004 2005 2006 2007 2008 2009 2010
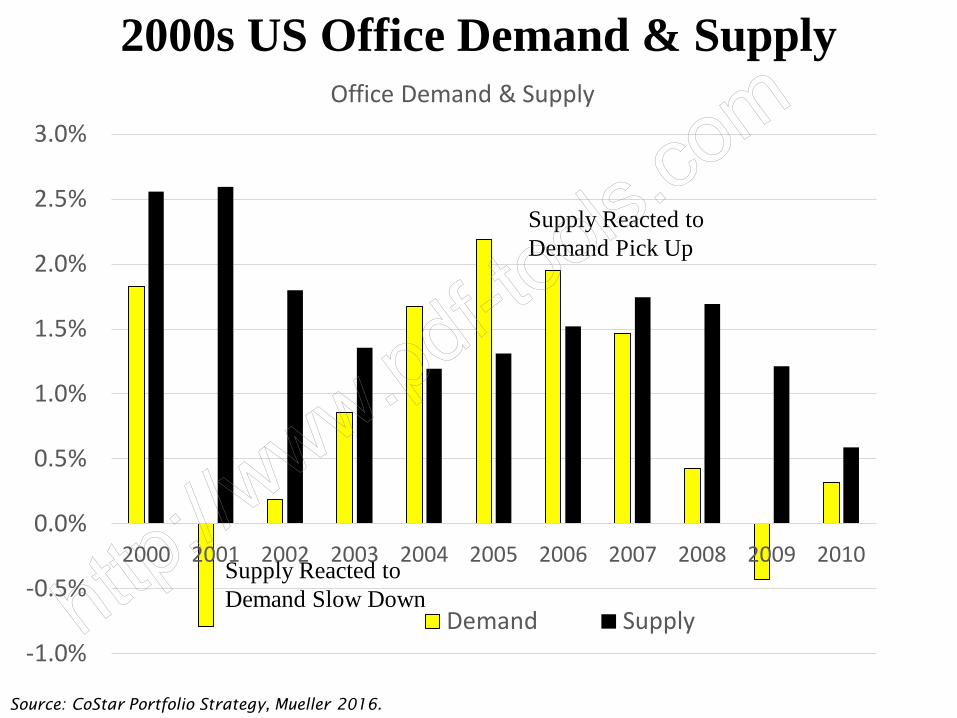
Office Demand & Supply
Demand Supply
Supply Reacted to Demand Slow Down
2000s US Office Demand & Supply
Supply Reacted to Demand Pick Up
Source: CoStar Portfolio Strategy, Mueller 2016.
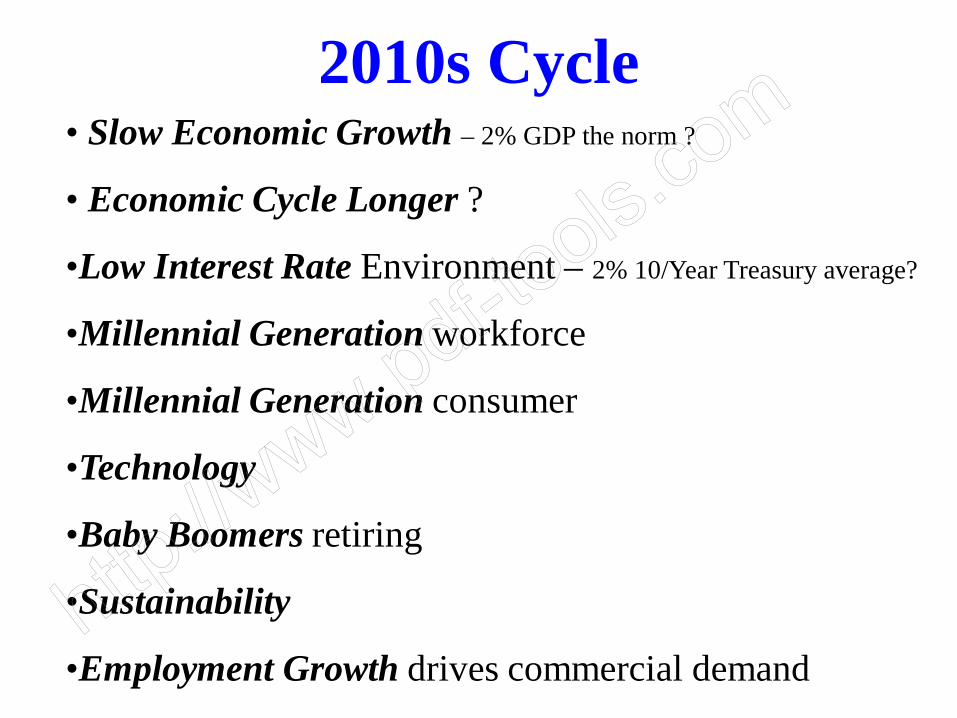
2010s Cycle• Slow Economic Growth – 2% GDP the norm ?
• Economic Cycle Longer ?
•Low Interest Rate Environment – 2% 10/Year Treasury average?
•Millennial Generation workforce
•Millennial Generation consumer
•Technology
•Baby Boomers retiring
•Sustainability
•Employment Growth drives commercial demand
Source: Costar Portfolio Strategy, January 2015
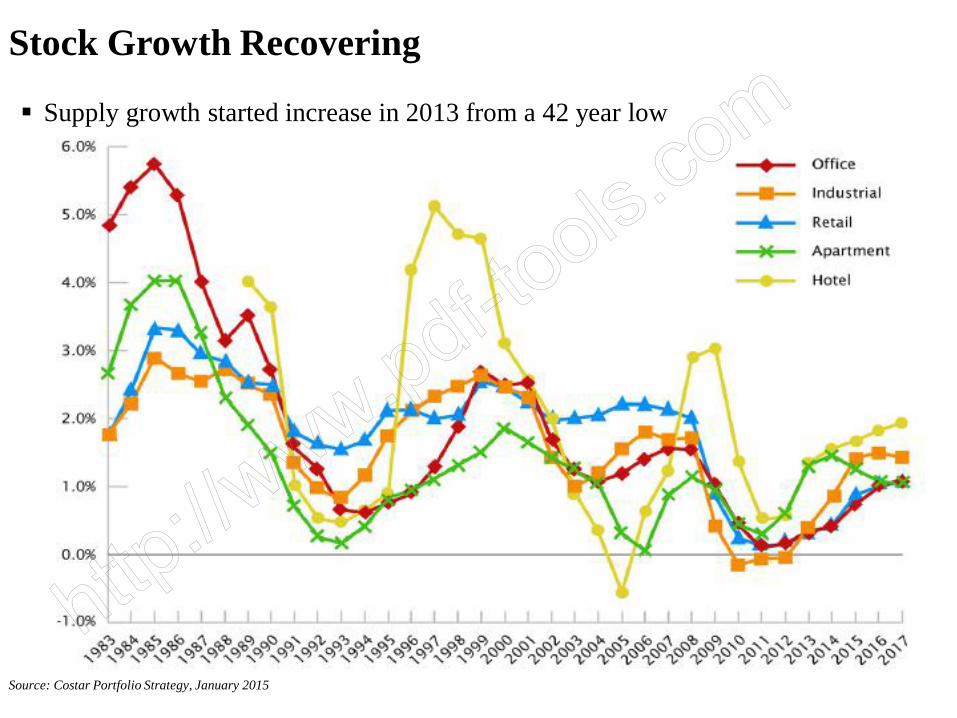
Stock Growth Recovering
Supply growth started increase in 2013 from a 42 year low
0.0%
0.2%
0.4%
0.6%
0.8%
1.0%
1.2%
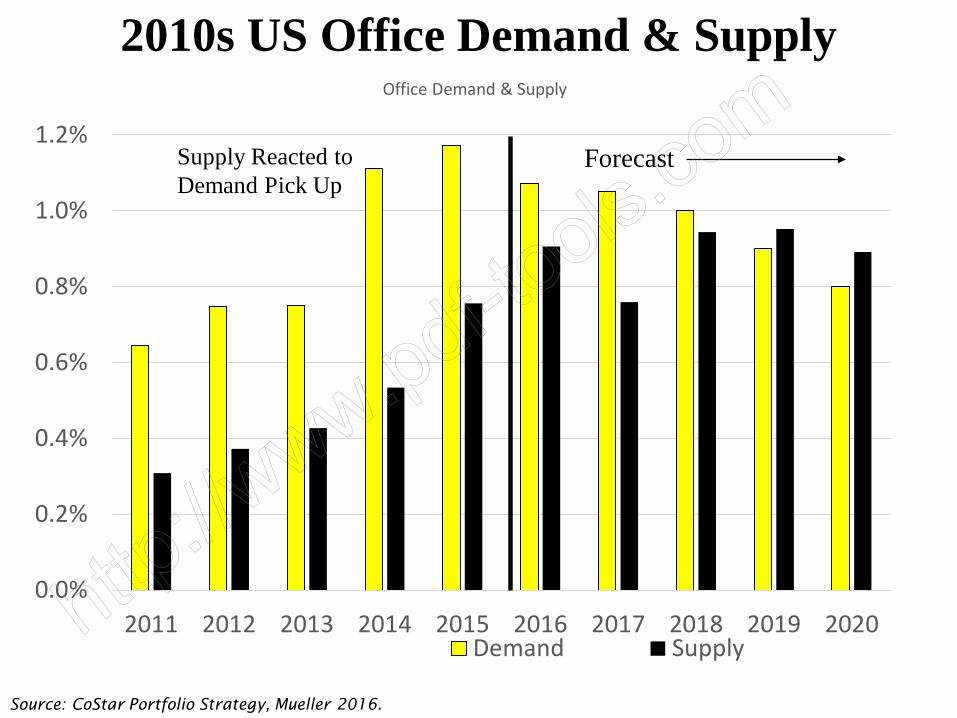
2011 2012 2013 2014 2015 2016 2017 2018 2019 2020
Office Demand & Supply
Demand Supply
2010s US Office Demand & Supply
Supply Reacted to Demand Pick Up
Source: CoStar Portfolio Strategy, Mueller 2016.
Forecast
Rec
essi
on
Rec
essi
on
Rec
essi
on
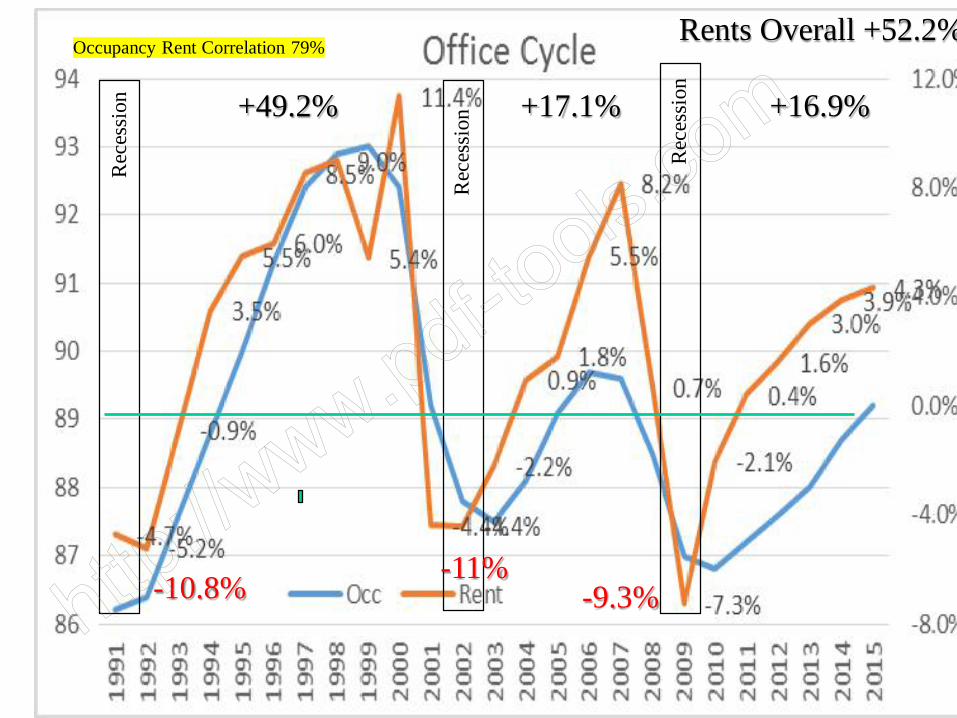
Occupancy Rent Correlation 79%
-10.8% -11%-9.3%
+16.9%+17.1%+49.2%
Rents Overall +52.2%
Source: Mueller, 2017
11
1467
89
10 12
13
115
164321
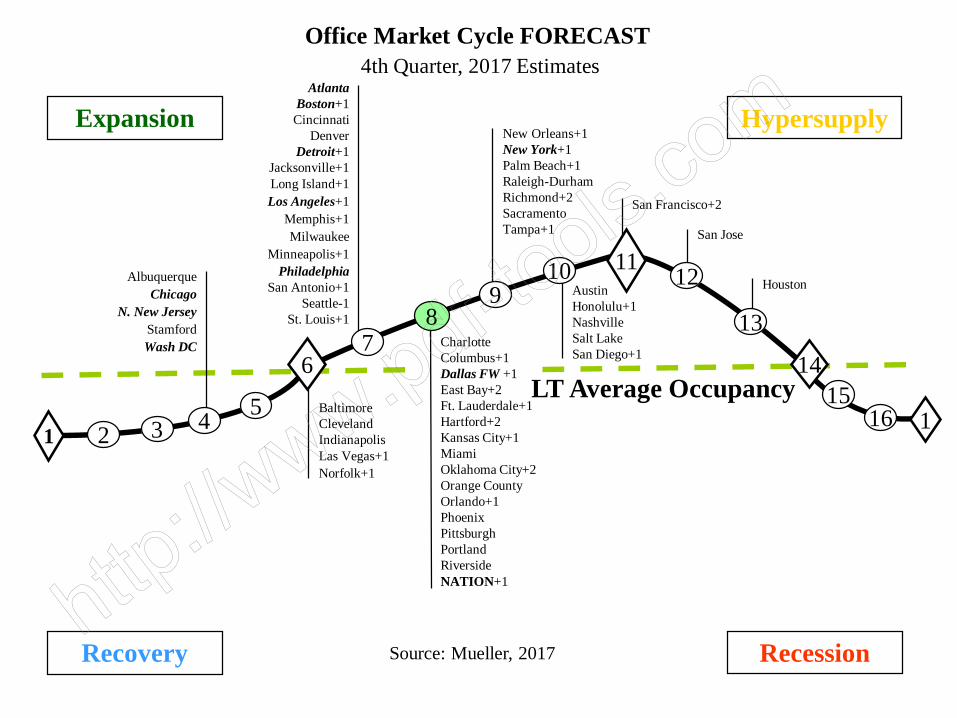
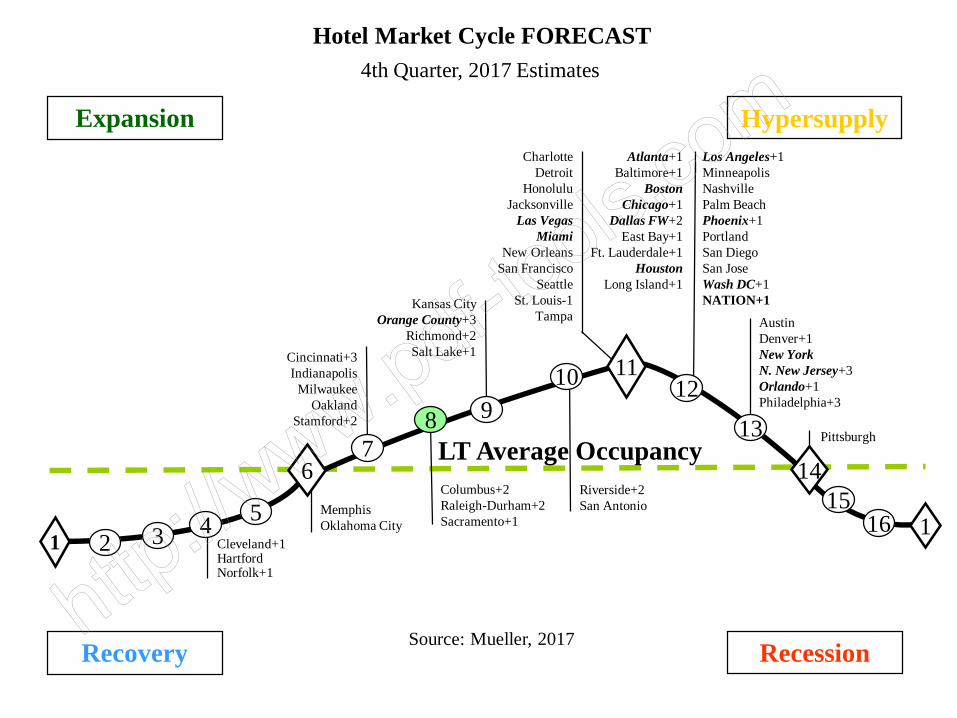
4th Quarter, 2017 Estimates
LT Average Occupancy
Office Market Cycle FORECAST
Houston
CharlotteColumbus+1Dallas FW +1East Bay+2 Ft. Lauderdale+1Hartford+2 Kansas City+1MiamiOklahoma City+2Orange CountyOrlando+1Phoenix PittsburghPortlandRiversideNATION+1
BaltimoreClevelandIndianapolisLas Vegas+1Norfolk+1
5
AustinHonolulu+1NashvilleSalt LakeSan Diego+1
New Orleans+1New York+1Palm Beach+1Raleigh-DurhamRichmond+2SacramentoTampa+1 San Jose
AlbuquerqueChicago
N. New JerseyStamfordWash DC
AtlantaBoston+1Cincinnati
DenverDetroit+1
Jacksonville+1Long Island+1Los Angeles+1
Memphis+1Milwaukee
Minneapolis+1Philadelphia
San Antonio+1Seattle-1
St. Louis+1
Recovery Recession
Expansion Hypersupply
San Francisco+2
Rec
essi
on
Rec
essi
on
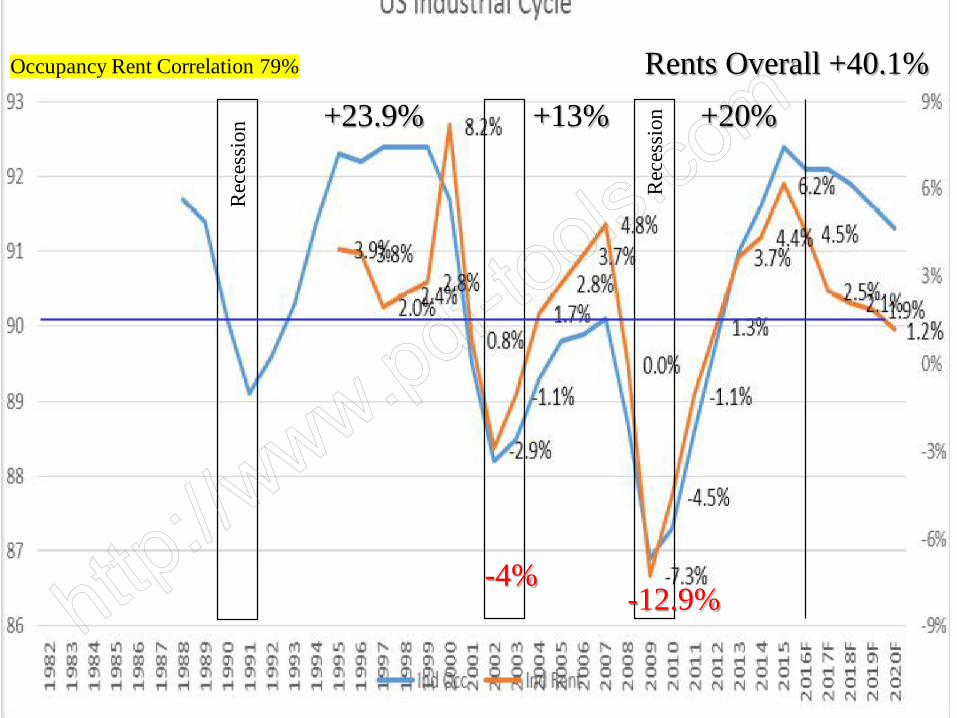
Occupancy Rent Correlation 79%
-4%-12.9%
+20%+13%+23.9%Rents Overall +40.1%
Source: Mueller, 2017
11
14
89
10 12
13
115
16531
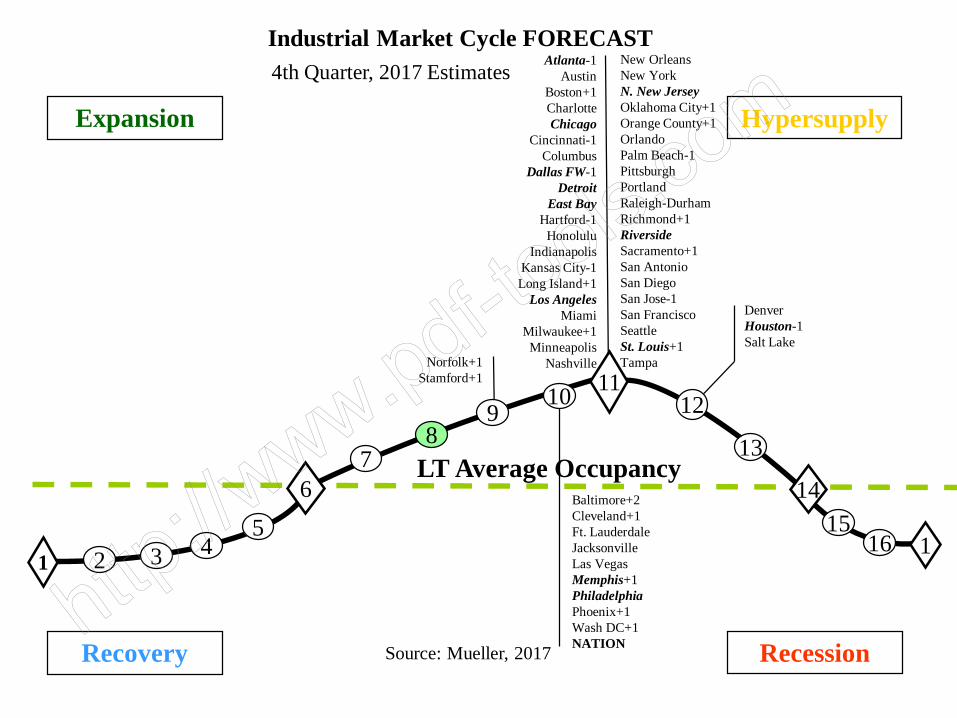
LT Average Occupancy
Industrial Market Cycle FORECAST
42
76 Baltimore+2
Cleveland+1Ft. LauderdaleJacksonvilleLas VegasMemphis+1PhiladelphiaPhoenix+1Wash DC+1 NATION
Atlanta-1Austin
Boston+1CharlotteChicago
Cincinnati-1Columbus
Dallas FW-1Detroit
East BayHartford-1
HonoluluIndianapolis
Kansas City-1Long Island+1
Los AngelesMiami
Milwaukee+1Minneapolis
Nashville
DenverHouston-1Salt Lake
4th Quarter, 2017 Estimates
Norfolk+1Stamford+1
New OrleansNew YorkN. New JerseyOklahoma City+1Orange County+1OrlandoPalm Beach-1PittsburghPortlandRaleigh-DurhamRichmond+1RiversideSacramento+1San AntonioSan DiegoSan Jose-1San FranciscoSeattleSt. Louis+1Tampa
Recovery Recession
Expansion Hypersupply
Rec
essi
on
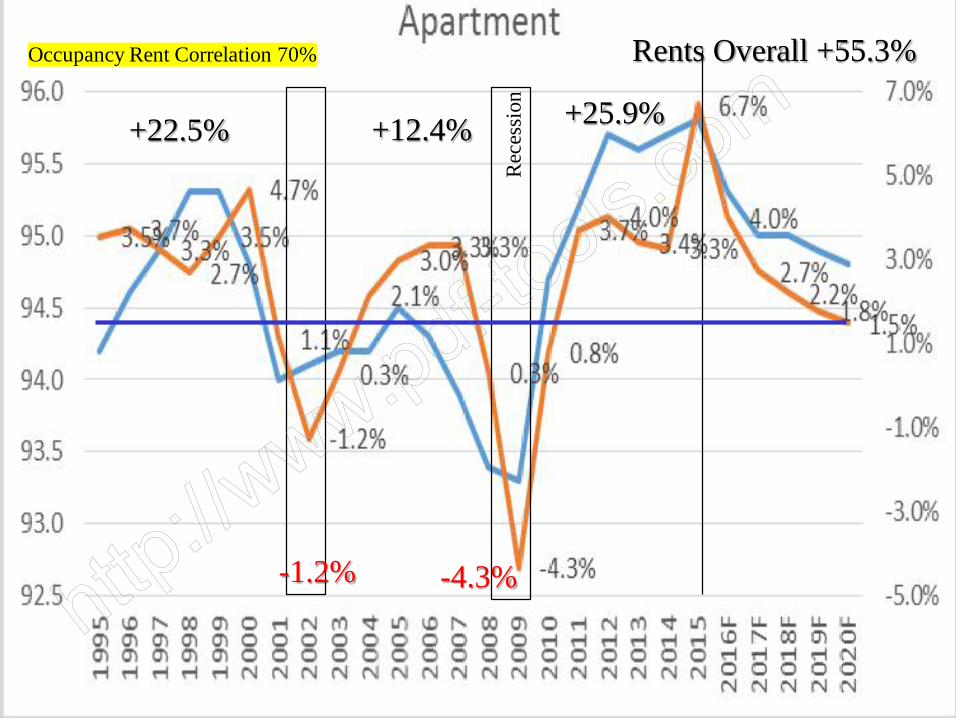
Occupancy Rent Correlation 70%
-1.2% -4.3%
+25.9%+12.4%+22.5%
Rents Overall +55.3%
Source: Mueller, 2017
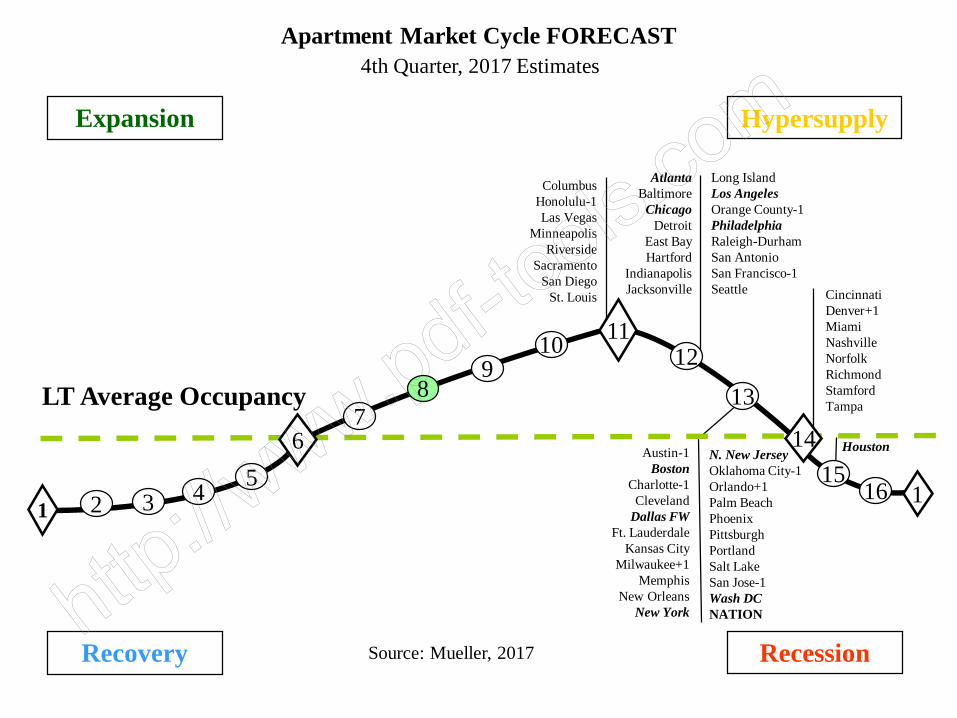
11
146
89
10 12
115
164321
LT Average Occupancy
Apartment Market Cycle FORECAST
5
7
CincinnatiDenver+1MiamiNashvilleNorfolkRichmondStamfordTampa
Austin-1Boston
Charlotte-1Cleveland
Dallas FWFt. Lauderdale
Kansas CityMilwaukee+1
MemphisNew Orleans
New York
ColumbusHonolulu-1Las Vegas
MinneapolisRiverside
SacramentoSan Diego
St. Louis
13
4th Quarter, 2017 Estimates
N. New JerseyOklahoma City-1Orlando+1Palm BeachPhoenixPittsburghPortlandSalt LakeSan Jose-1Wash DCNATION
AtlantaBaltimore
ChicagoDetroit
East BayHartford
IndianapolisJacksonville
Houston
Long Island Los AngelesOrange County-1PhiladelphiaRaleigh-DurhamSan AntonioSan Francisco-1Seattle
Recovery Recession
Expansion Hypersupply
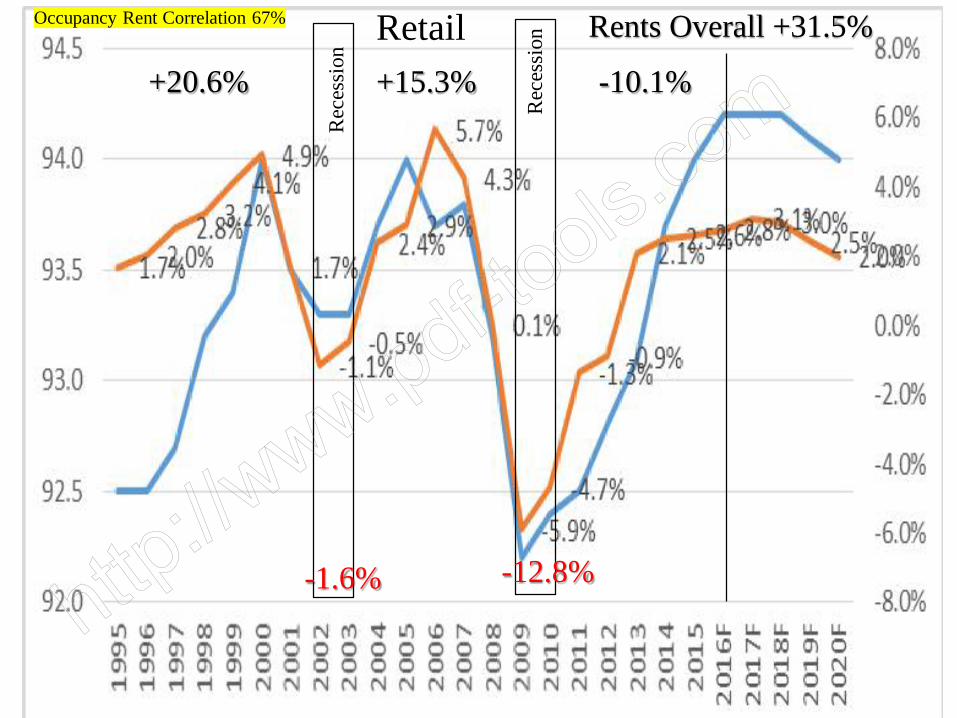
Rec
essi
on
Rec
essi
on
Occupancy Rent Correlation 67%
-1.6% -12.8%
-10.1%+15.3%+20.6%
Rents Overall +31.5%Retail
Source: Mueller, 2017
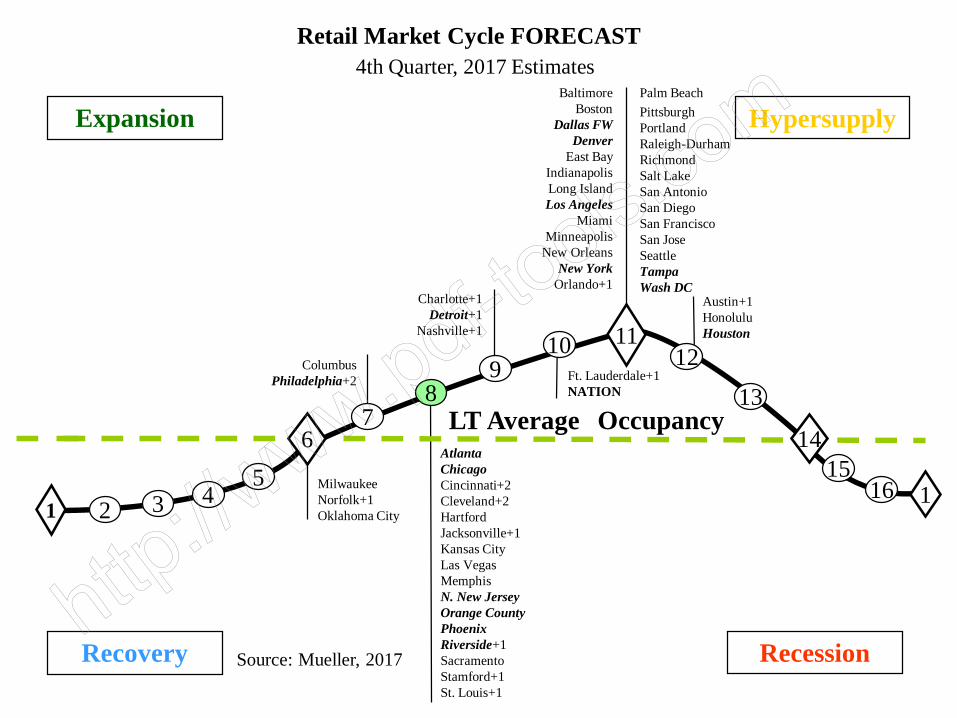
11
147
910 12
13
115
164321
LT Average
Retail Market Cycle FORECAST
6Occupancy
MilwaukeeNorfolk+1Oklahoma City
ColumbusPhiladelphia+2
AtlantaChicagoCincinnati+2Cleveland+2HartfordJacksonville+1Kansas CityLas Vegas MemphisN. New JerseyOrange CountyPhoenixRiverside+1SacramentoStamford+1St. Louis+1
Ft. Lauderdale+1NATION
5
8
Palm BeachPittsburghPortlandRaleigh-DurhamRichmondSalt LakeSan AntonioSan DiegoSan FranciscoSan JoseSeattleTampaWash DC
4th Quarter, 2017 Estimates
Austin+1HonoluluHouston
Recovery Recession
Expansion Hypersupply
Charlotte+1Detroit+1
Nashville+1
BaltimoreBoston
Dallas FWDenver
East BayIndianapolisLong IslandLos Angeles
MiamiMinneapolis
New OrleansNew York
Orlando+1
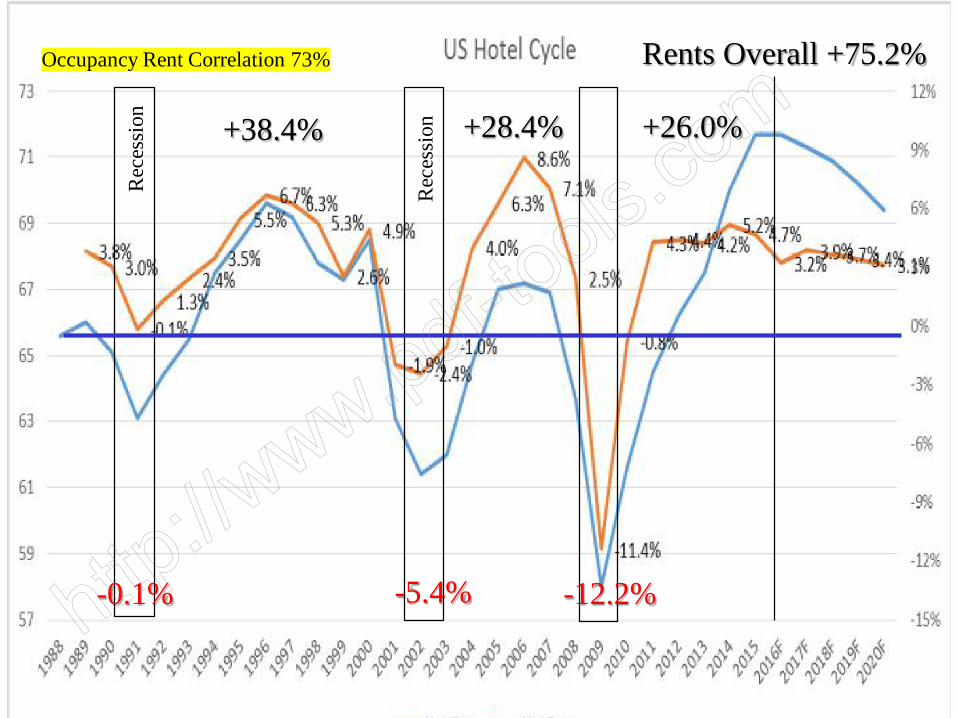
Rec
essi
on
Rec
essi
on
Occupancy Rent Correlation 73%
-0.1% -5.4%
+26.0%+28.4%+38.4%
Rents Overall +75.2%
-12.2%
Cleveland+1HartfordNorfolk+1
LT Average Occupancy
Source: Mueller, 2017
11
1467
8 910 12
13
115
1654321
Hotel Market Cycle FORECAST
MemphisOklahoma City
Cincinnati+3Indianapolis
MilwaukeeOakland
Stamford+2
Los Angeles+1MinneapolisNashvillePalm BeachPhoenix+1PortlandSan DiegoSan JoseWash DC+1NATION+1
Riverside+2San Antonio
CharlotteDetroit
HonoluluJacksonville
Las VegasMiami
New OrleansSan Francisco
SeattleSt. Louis-1
Tampa
4th Quarter, 2017 Estimates
AustinDenver+1New YorkN. New Jersey+3Orlando+1 Philadelphia+3
Columbus+2Raleigh-Durham+2Sacramento+1
Pittsburgh
Recovery Recession
Expansion Hypersupply
Kansas CityOrange County+3
Richmond+2Salt Lake+1
Atlanta+1Baltimore+1
BostonChicago+1
Dallas FW+2East Bay+1
Ft. Lauderdale+1Houston
Long Island+1
Financial Cycle
$Capital$ Flows affect Prices
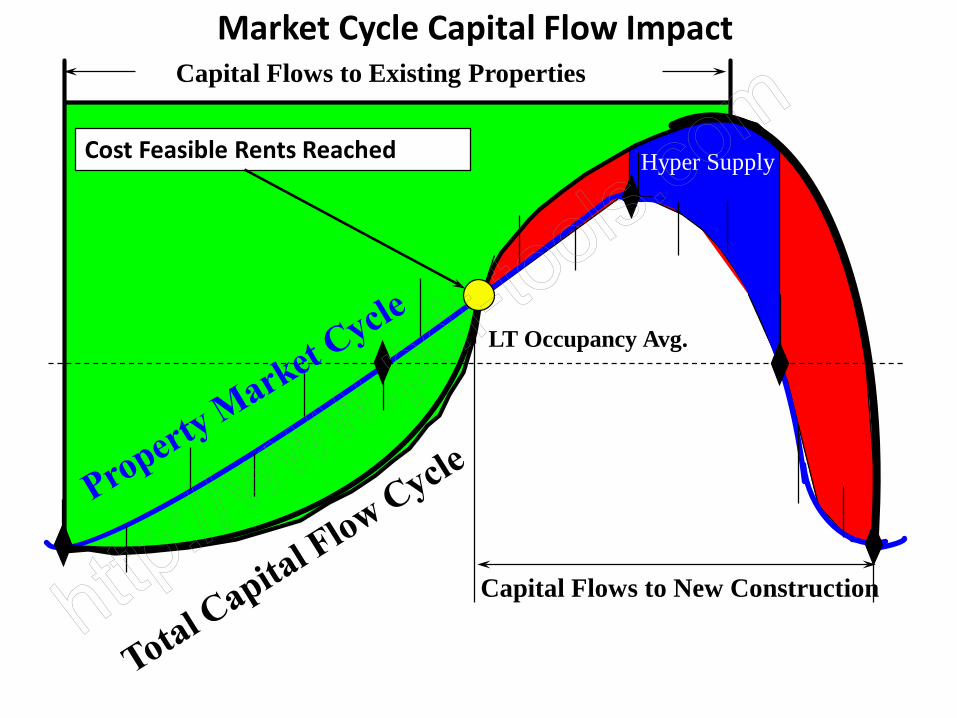
Hyper Supply
LT Occupancy Avg.
Market Cycle Capital Flow ImpactCapital Flows to Existing Properties
Capital Flows to New Construction
Cost Feasible Rents Reached
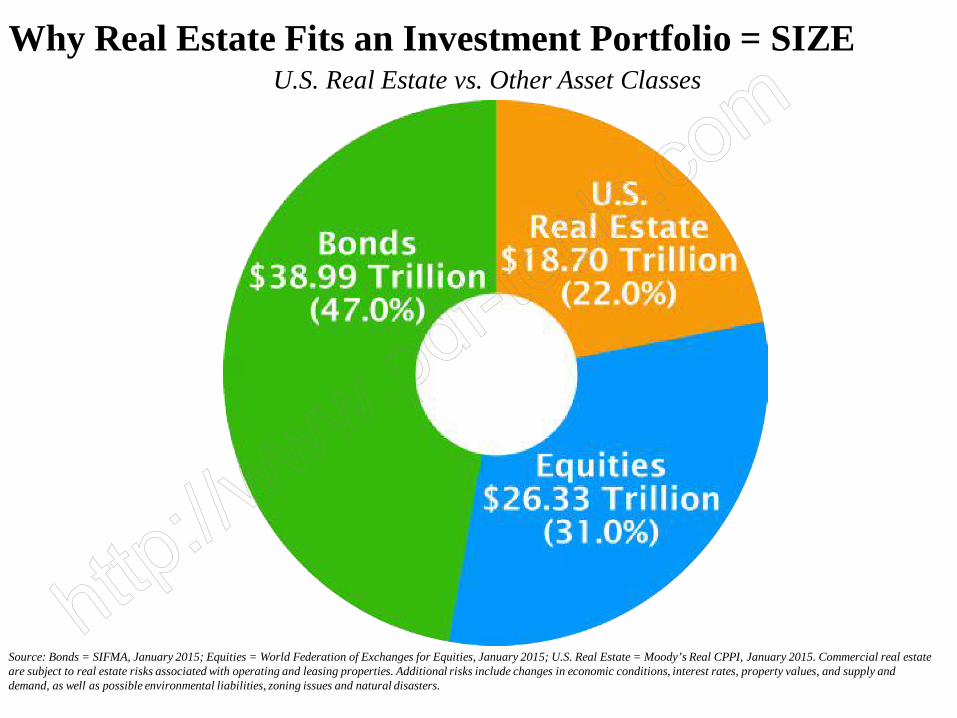
Source: Bonds = SIFMA, January 2015; Equities = World Federation of Exchanges for Equities, January 2015; U.S. Real Estate = Moody’s Real CPPI, January 2015. Commercial real estate are subject to real estate risks associated with operating and leasing properties. Additional risks include changes in economic conditions, interest rates, property values, and supply and demand, as well as possible environmental liabilities, zoning issues and natural disasters.
U.S. Real Estate vs. Other Asset ClassesWhy Real Estate Fits an Investment Portfolio = SIZE
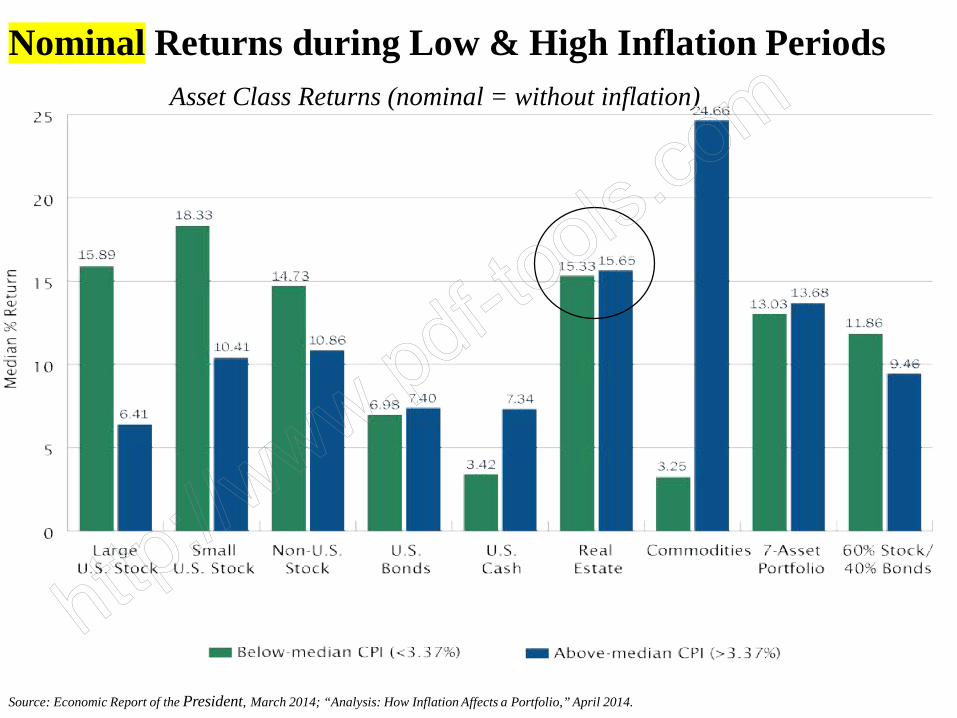
Nominal Returns during Low & High Inflation Periods
Source: Economic Report of the President, March 2014; “Analysis: How Inflation Affects a Portfolio,” April 2014.
Asset Class Returns (nominal = without inflation)
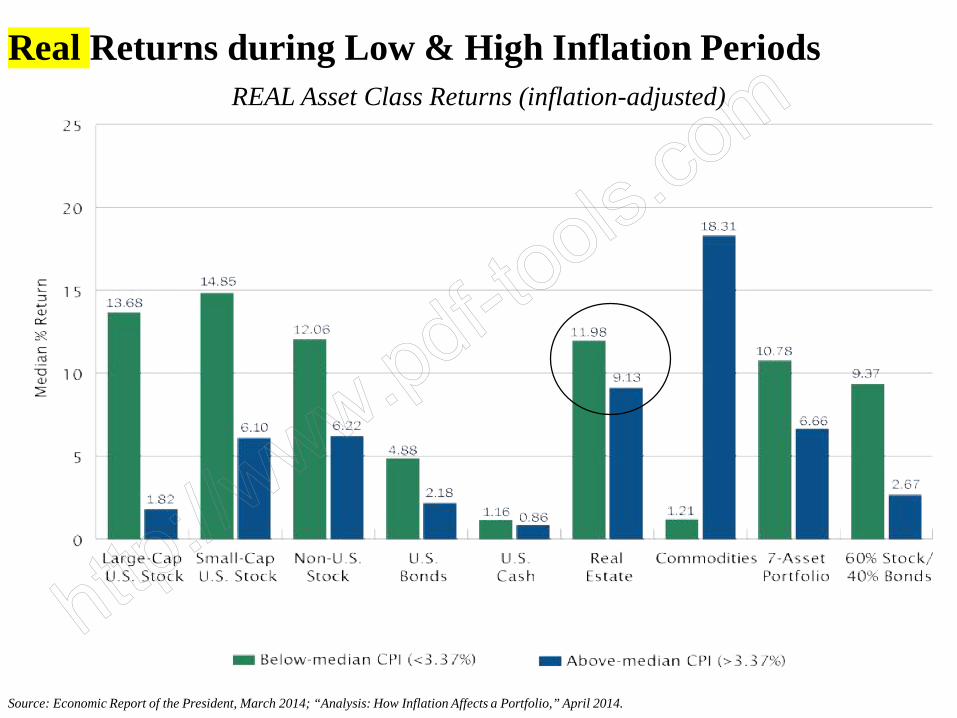
Real Returns during Low & High Inflation Periods
Source: Economic Report of the President, March 2014; “Analysis: How Inflation Affects a Portfolio,” April 2014.
REAL Asset Class Returns (inflation-adjusted)
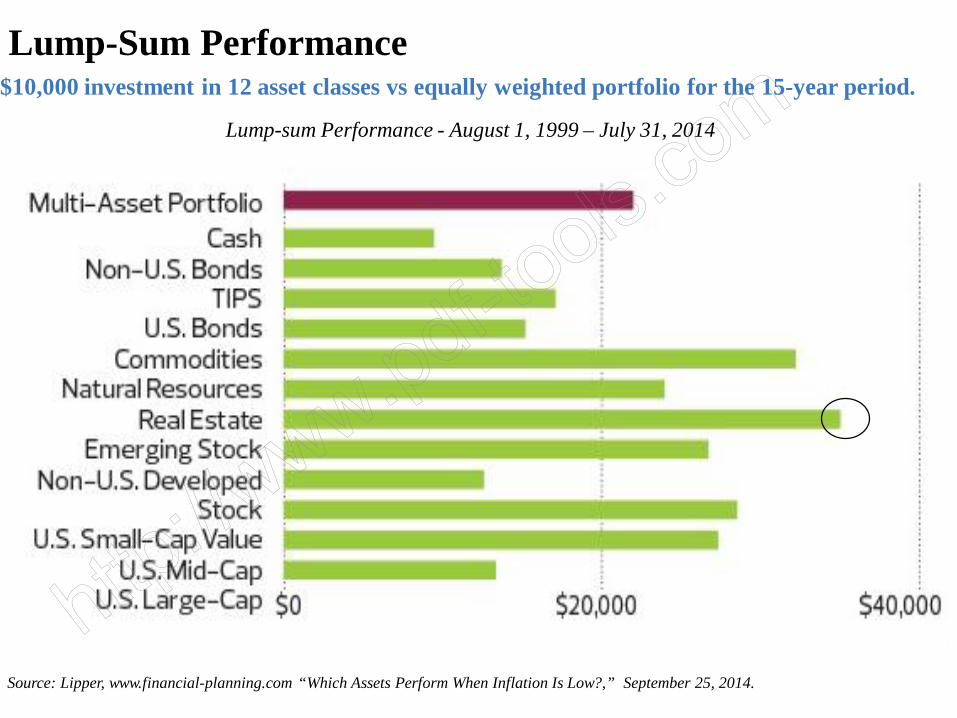
Lump-Sum Performance
Source: Lipper, www.financial-planning.com “Which Assets Perform When Inflation Is Low?,” September 25, 2014.
Lump-sum Performance - August 1, 1999 – July 31, 2014
$10,000 investment in 12 asset classes vs equally weighted portfolio for the 15-year period.
1.00
3.00
5.00
7.00
9.00
11.00
13.00
15.00
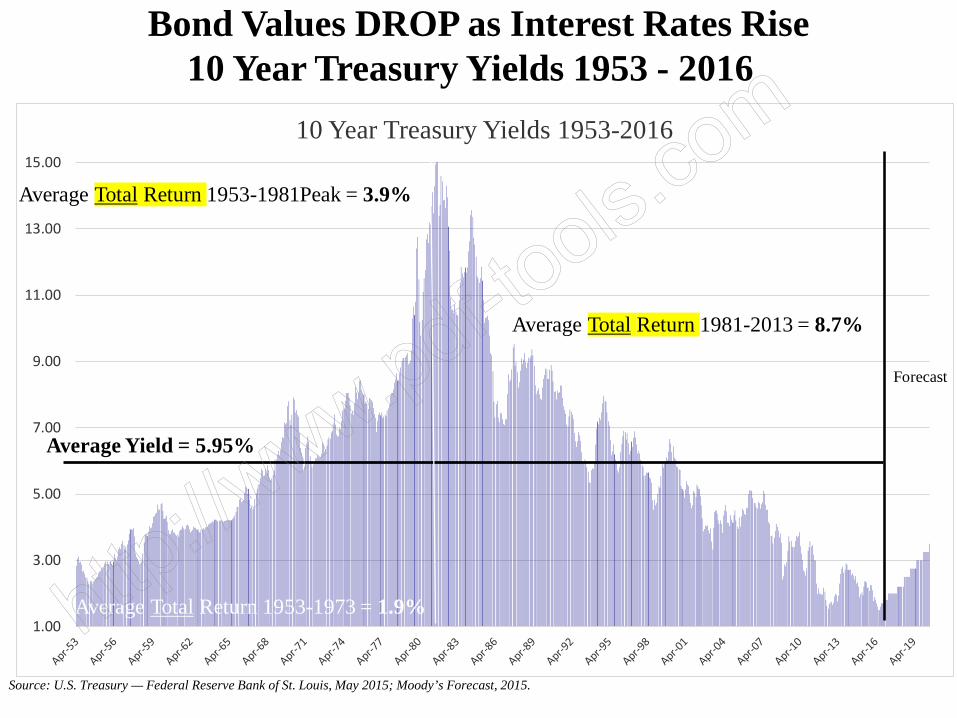
10 Year Treasury Yields 1953-2016
Source: U.S. Treasury — Federal Reserve Bank of St. Louis, May 2015; Moody’s Forecast, 2015.
Average Total Return 1981-2013 = 8.7%
Average Total Return 1953-1973 = 1.9%
Average Total Return 1953-1981Peak = 3.9%
Average Yield = 5.95%
Forecast
Bond Values DROP as Interest Rates Rise10 Year Treasury Yields 1953 - 2016e
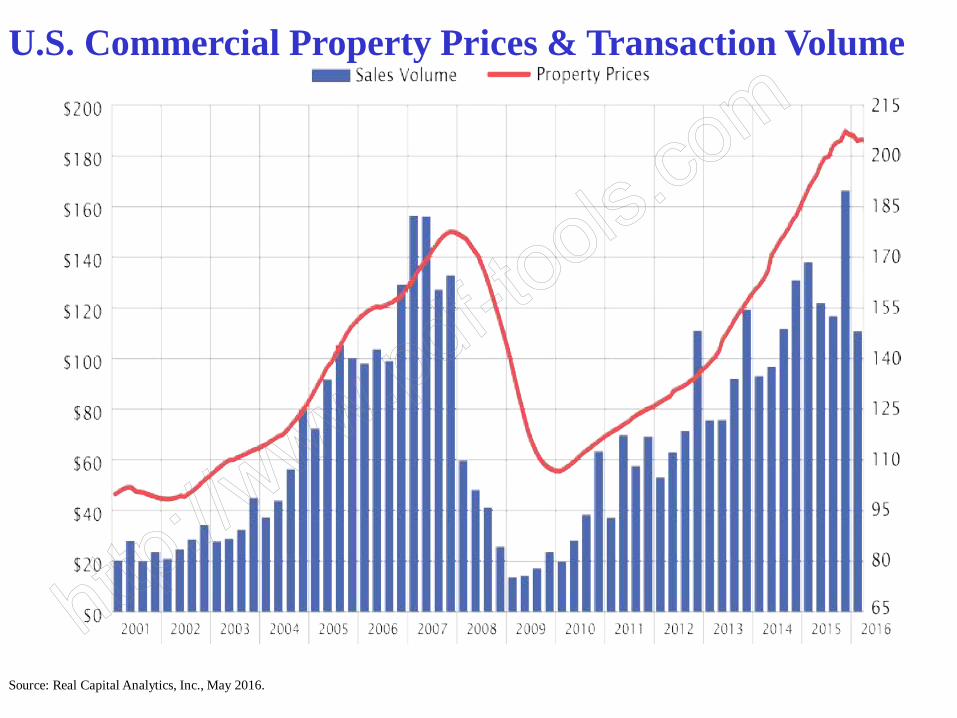
U.S. Commercial Property Prices & Transaction Volume
Source: Real Capital Analytics, Inc., May 2016.
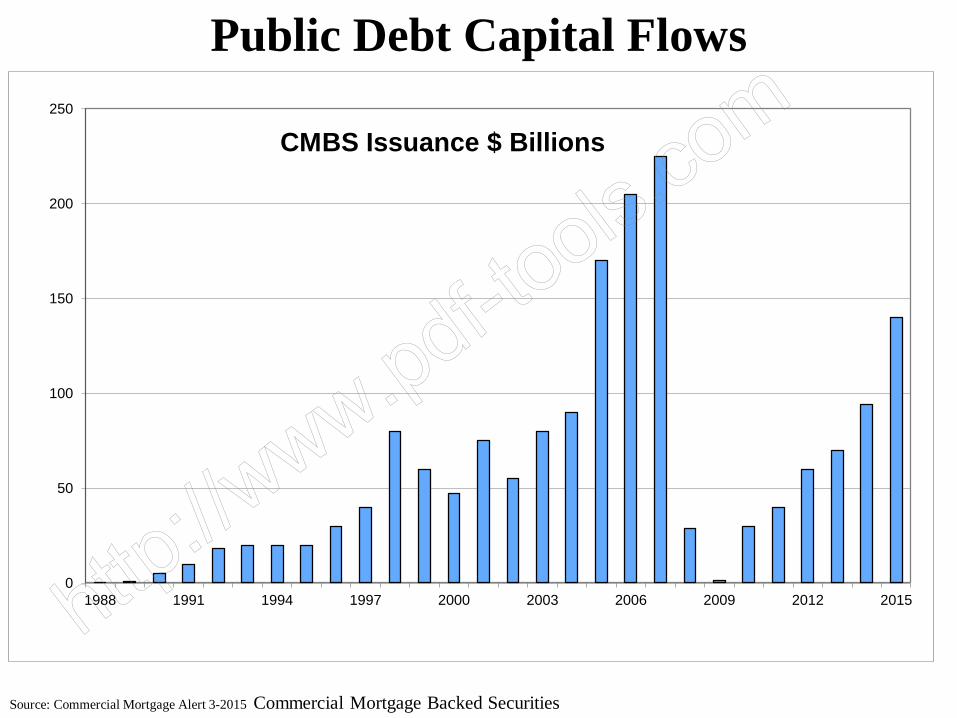
Source: Commercial Mortgage Alert 3-2015 Commercial Mortgage Backed Securities
Public Debt Capital Flows
0
50
100
150
200
250
1988 1991 1994 1997 2000 2003 2006 2009 2012 2015
CMBS Issuance $ Billions
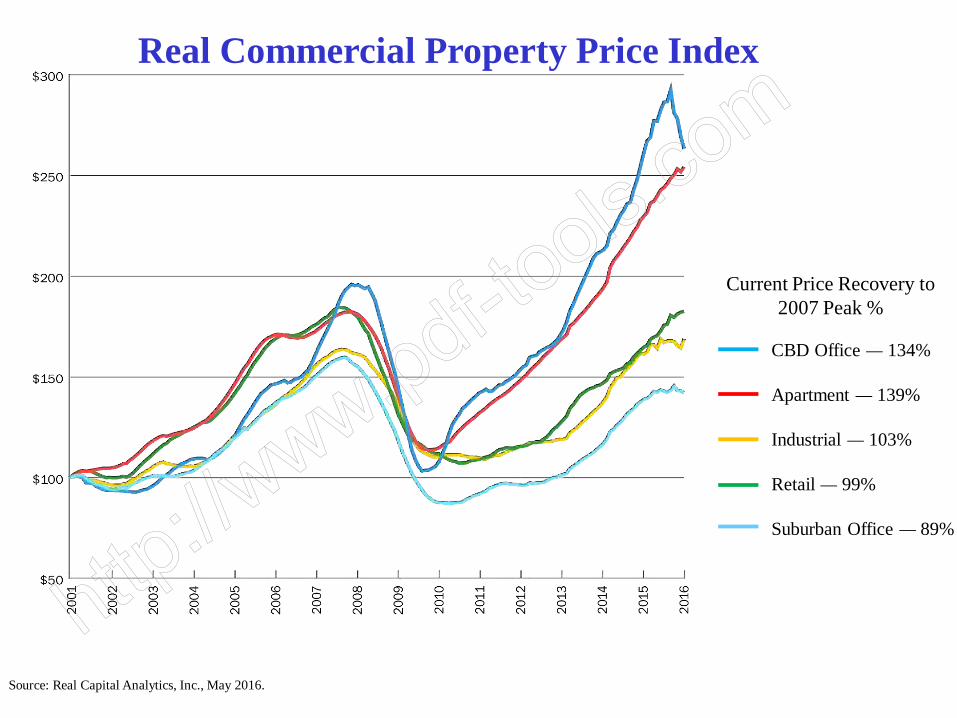
Real Commercial Property Price Index
Source: Real Capital Analytics, Inc., May 2016.
Current Price Recovery to 2007 Peak %
CBD Office — 134%
Apartment — 139%
Industrial — 103%
Retail — 99%
Suburban Office — 89%
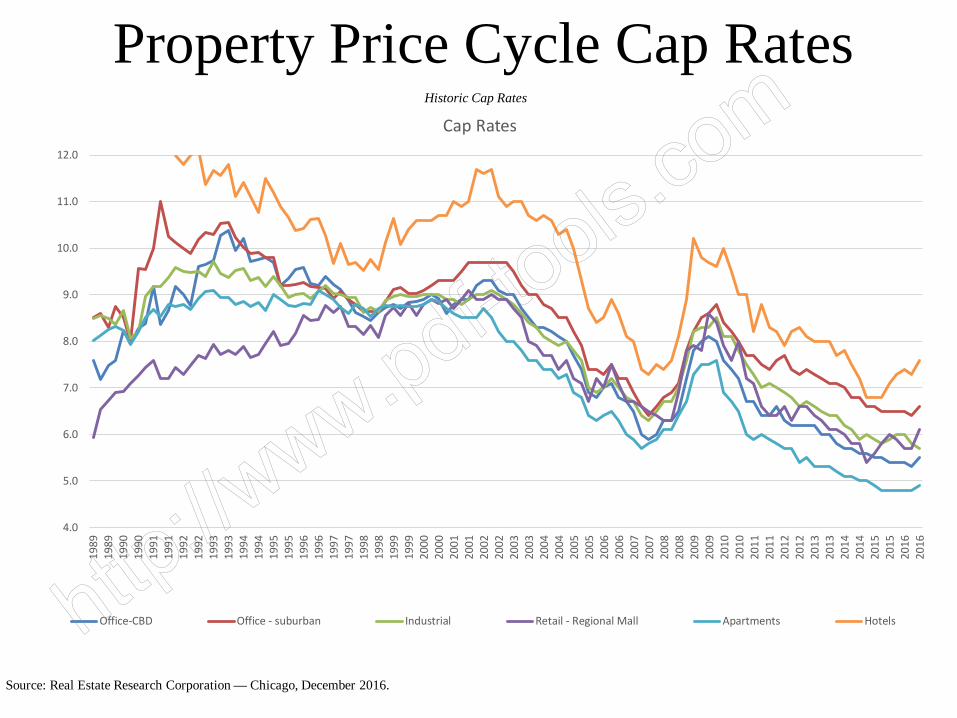
Property Price Cycle Cap RatesHistoric Cap Rates
Source: Real Estate Research Corporation — Chicago, December 2016.
4.0
5.0
6.0
7.0
8.0
9.0
10.0
11.0
12.0
1989
1989
1990
1990
1991
1991
1992
1992
1993
1993
1994
1994
1995
1995
1996
1996
1997
1997
1998
1998
1999
1999
2000
2000
2001
2001
2002
2002
2003
2003
2004
2004
2005
2005
2006
2006
2007
2007
2008
2008
2009
2009
2010
2010
2011
2011
2012
2012
2013
2013
2014
2014
2015
2015
2016
2016
Cap Rates
Office-CBD Office - suburban Industrial Retail - Regional Mall Apartments Hotels
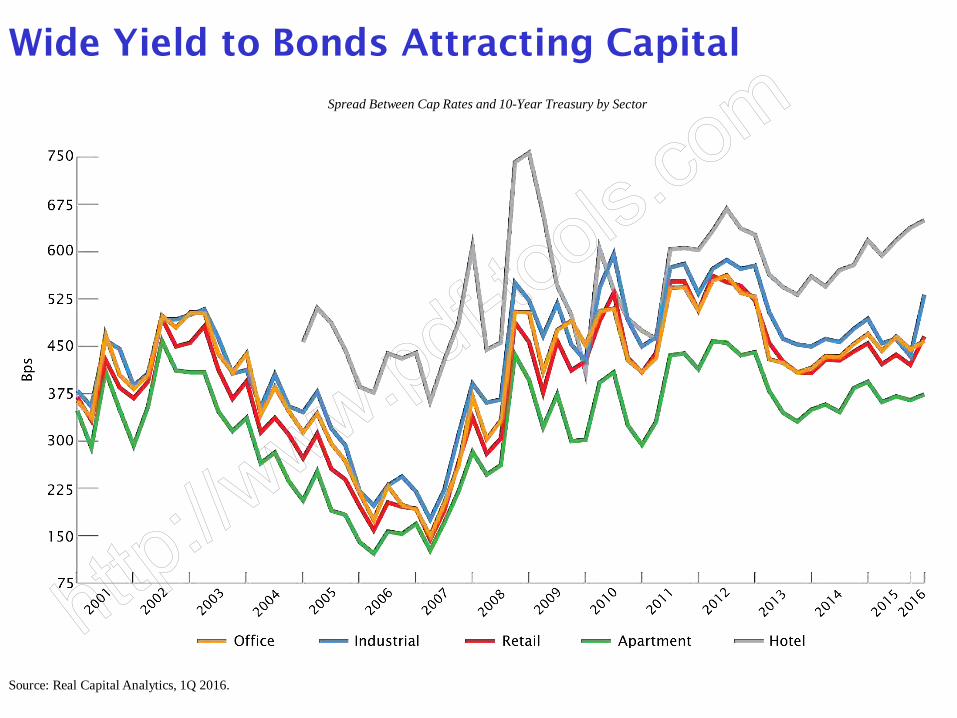
Wide Yield to Bonds Attracting CapitalSpread Between Cap Rates and 10-Year Treasury by Sector
Source: Real Capital Analytics, 1Q 2016.
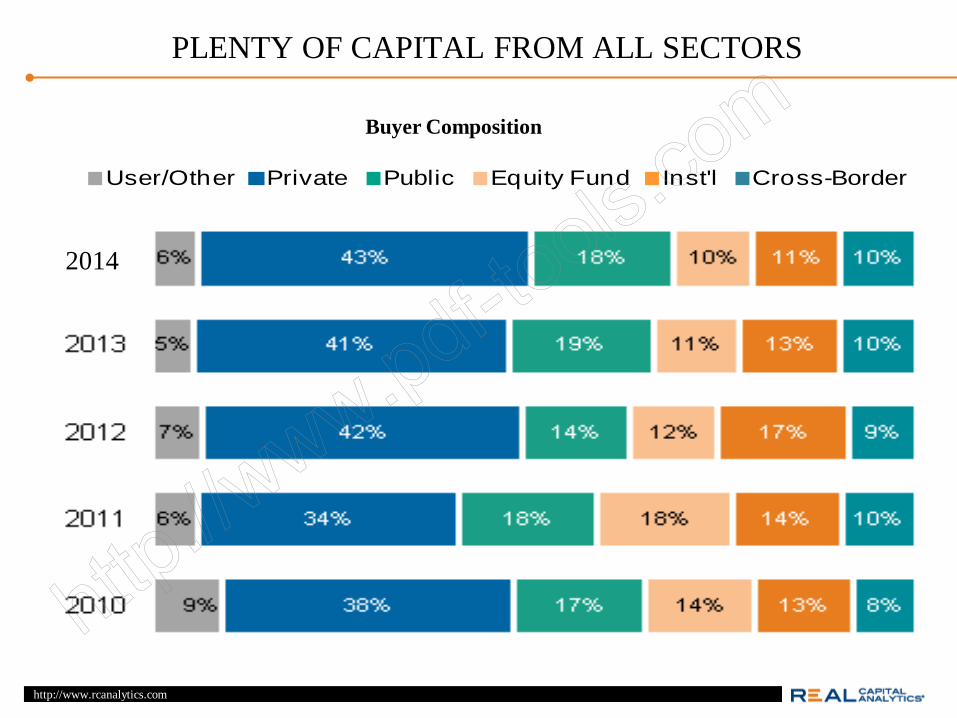
PLENTY OF CAPITAL FROM ALL SECTORS
Buyer Composition
User/Other Private Public Equity Fund Inst'l Cross-Border
http://www.rcanalytics.com
2014
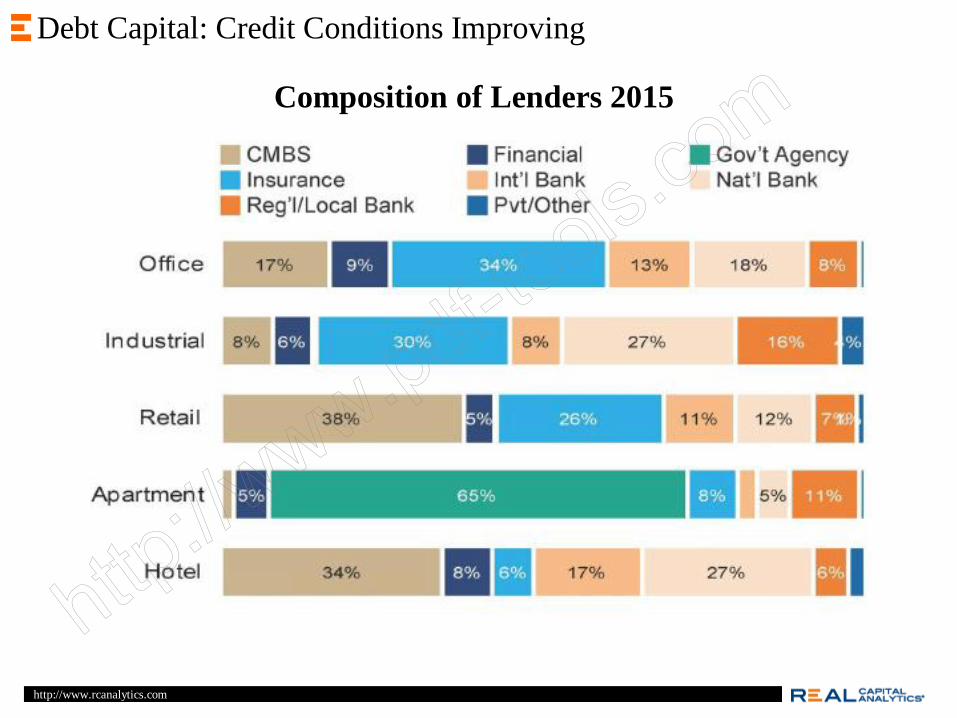
Composition of Lenders 2015
http://www.rcanalytics.com
Debt Capital: Credit Conditions Improving
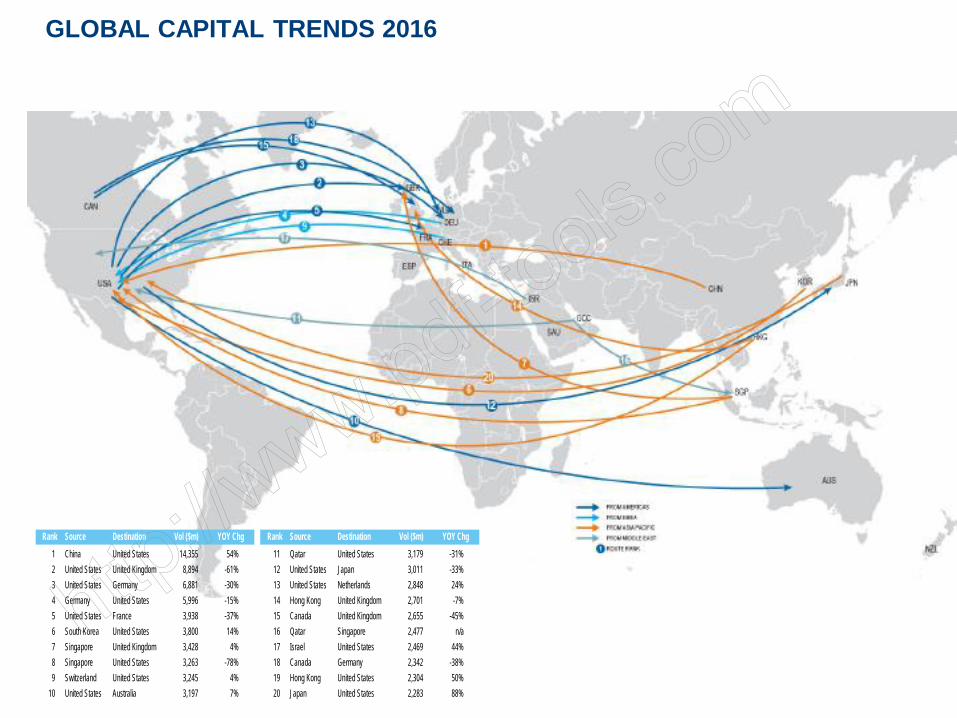
GLOBAL CAPITAL TRENDS 2016
Rank Source Destination Vol ($m) YOY Chg Rank Source Destination Vol ($m) YOY Chg1 China United States 14,355 54% 11 Qatar United States 3,179 -31%2 United States United Kingdom 8,894 -61% 12 United States Japan 3,011 -33%3 United States Germany 6,881 -30% 13 United States Netherlands 2,848 24%4 Germany United States 5,996 -15% 14 Hong Kong United Kingdom 2,701 -7%5 United States France 3,938 -37% 15 Canada United Kingdom 2,655 -45%6 South Korea United States 3,800 14% 16 Qatar Singapore 2,477 n/a7 Singapore United Kingdom 3,428 4% 17 Israel United States 2,469 44%8 Singapore United States 3,263 -78% 18 Canada Germany 2,342 -38%9 Switzerland United States 3,245 4% 19 Hong Kong United States 2,304 50%
10 United States Australia 3,197 7% 20 Japan United States 2,283 88%
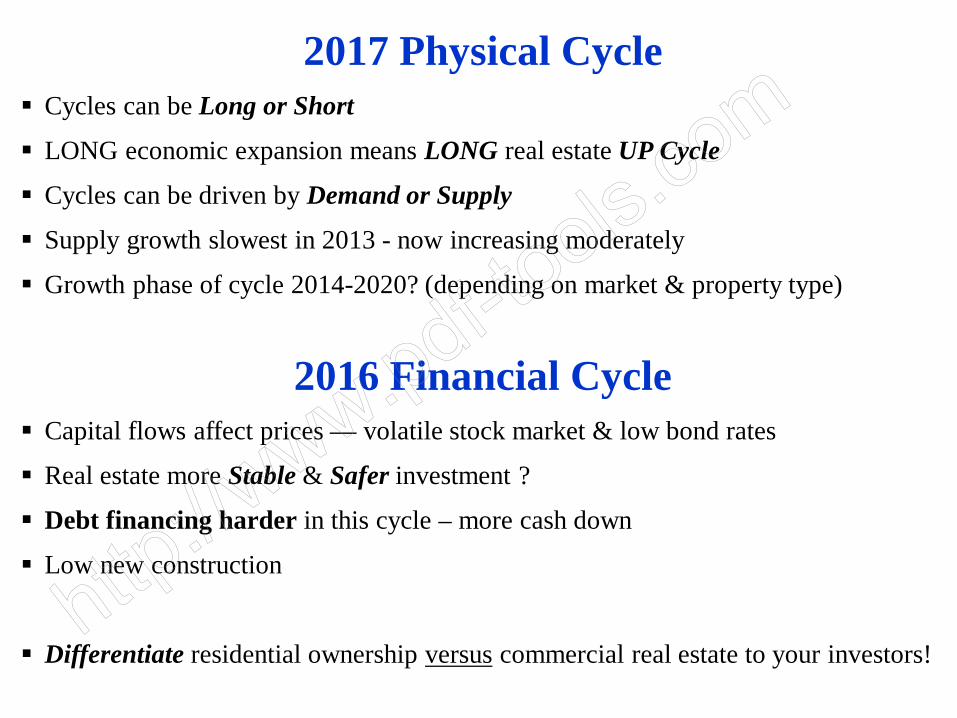
2008 Physical and Financial Cycle2017 Physical Cycle Cycles can be Long or Short
LONG economic expansion means LONG real estate UP Cycle
Cycles can be driven by Demand or Supply
Supply growth slowest in 2013 - now increasing moderately
Growth phase of cycle 2014-2020? (depending on market & property type)
2016 Financial Cycle Capital flows affect prices — volatile stock market & low bond rates
Real estate more Stable & Safer investment ?
Debt financing harder in this cycle – more cash down
Low new construction
Differentiate residential ownership versus commercial real estate to your investors!

QUESTIONS?
Topics Covered
Economic Fundamentals5 key Macro Economic Drivers of Real Estate PerformanceEconomic Base Analysis
Real Estate Physical Cycle FundamentalsDemand for Real Estate Supply of Real EstateOccupancy CyclesRent Cycles
Real Estate Financial Cycle FundamentalsInterest RatesCapital FlowsBuyersReal Estate PricesCap Rates


![Monetary Policy and Real Estate Prices: A Disaggregated ... · PDF fileReal Estate Prices: A Disaggregated Analysis for Switzerland ... Dupor [2005] analyzes in ... A Disaggregated](https://img.pdfslide.us/doc/110x75/5a79a5d87f8b9ae1468d0da8/monetary-policy-and-real-estate-prices-a-disaggregated-estate-prices-a-disaggregated.jpg)