Embed Size (px)
Citation preview
.
.
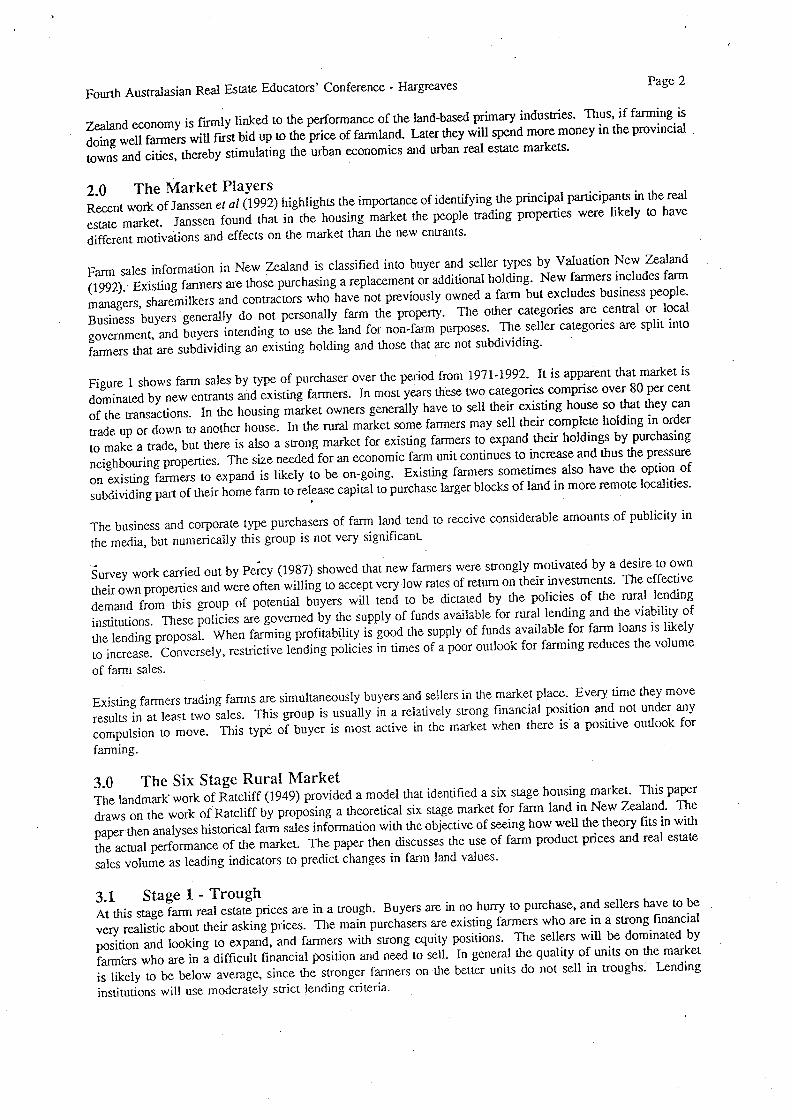
Fourth AUStralasian Real Estate Educators' ConferenceAuckland University, 26th-28th January 1994
Real Estate Cycles - A Rural PerspectiveR. V. (Bob) Hongreoves BS, MBA
Associate ProfessorProperty Studies Deportment, Massey University
Palmerston North, New Z8010nd
Keywords:buyers.
Abstract
This paper proposes a liteore!icol six 5108e 71,701 real estate ringrket. The owl or argues I arm eIhe rural ringrket is likely 10 lead 701her nun log Ihe genero! economy.
The paper exanzines the hypothesis Ihot cyclicoljl"CIMoiions in rural real esioie Innrkets ore sirongly linke 10Ihe overseas coriumdiiy prices. To Jest ihis hypoihesis Ihe remitonship between willful prices and dairy formprices ore exo?nined by using a tiring series dojo. The paper also jus!s the second hypothesis that dairy formturnover roles ore a leading indicator in delerinining dairy formprices dad mmvemen!s in Ihe rea es!ate cyc e.The mum Innrket players in the rural market ore ideni;fied and the ofeci dyexisiingfor, 71ers Iroding properliesis discussed.
The poper concludes Ih@Ithe theoretical nudeldoes gener@!!yin in wiih Ihe ac!"o1 markeipedornmnpe grid thatform formover roles ore on important leading indicator when predicting changes in the price offgrin land.
real estate cycles, rural real estate, New Zealand,
1.0 IntroductionIn his keynote address to the Real Estate Educators' Conference in Sydney, Lusht (1993) challenged real estateresearchers to further investigate real estate cycles. This paper provides an introductory rural perspective to eLushi challenge.
The value offarm land can be defined as the present worth of the rights to the future income from the property.The future income from fanTiland comes from the annual cash flows and changes in the value of the properlyover time. In New Zealand the annual cash flows 10 faniiland move up and down in response to fluctuationsin the exportprices for the main farm commodities: wool, meat and milk products. Farming car ows are soinfluenced by the fluctuating interest rate component in debt servicing costs.
Developing an understanding of the cyclicalbehaviour of real estate markets provides an on-going challenge orproperty practitioners and is an essential part of the valuation process. Furthermore, the most success u prope yinvestors are likely to be those with the ability to buy during cyclicaldowntums in the market and 10 sell duringboom times.
The traditional view is that real estate cycles lag the general business cycle. This view has been fomiulated byanalysing urban property markets such as housing. However, the urban lag effectis unlikey to o true orfarm land in New Zealand, because commodity prices in the farming sector are largely driven by export priceson the world markeL Recent evidence, under a relatively free-marketregime, suggests that the rural real estatemarketleads rather than lags the general New Zealand business cycle. This is because the health of the ew
farm nunover rates, fanTiincome, farm
.
.
,
Page 2Real Estale Educators' Conference - HargreavesFourth AUStralasian
zealandGCOnO'y' lad. Laithewills ridmOremOnGyinlheprovinciajzealanGCO y ff lad. Laterthe willspendmoremoneyinlheprovjncjajwns and cities, thereby stimulating the urban economics and LIT an rea es
2.0TheMarketPlayers ..R nt work of Janssen at o1(1992) highlights the imponmiceofidentifying e prtncip . pain 'p .
tale market. Janssen found that in the housing market the peop e ti'a ing p pedifferent motivations and effects on the market than the new entrants.
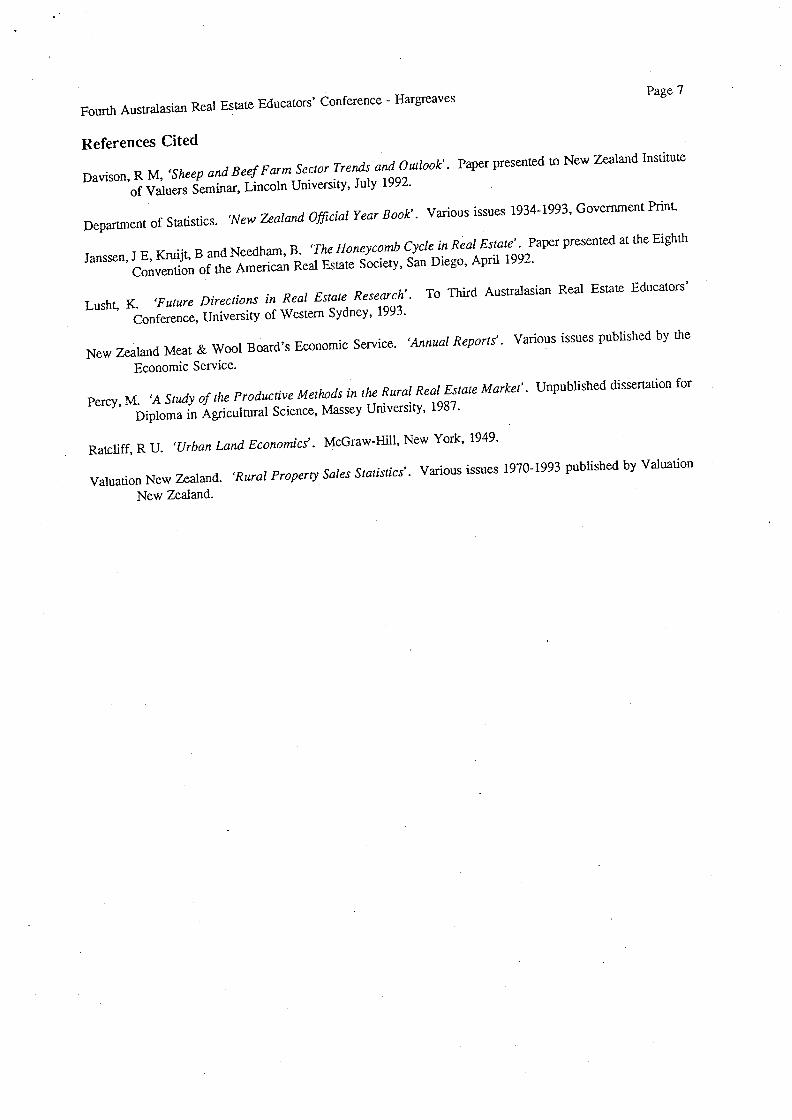
Fom sales infomiation in New Zealand is classified into buyer an se er ype y(1992). Existing farmers are those purchasing a replacement or additiona o 'rig.managers, sharemilkers and contractors who have riot previous y o\\nBusinessbuyers generally do notpersonally farm the property. Go e govemment, and buyers intending to use the land for non-farm purposes.
f ers that are subdividing an existing holding and those that are not su i\i ' g.
Fiurelshowsfamisalesbytypeofpurchaseroveriheperiodfrom I .. pP.dominated by new entrants and existing farmers, In most years ese two c gof then'ansactions. futilehousingmarketownersgenerally haveio se eir gtrade up or down to another house. In the ruml marketsome armers may s10 make a trade, but there is also a strong market for existing famers to expneighbouring properties. The size needed for an economic farm unit con 'onexisthigfannersioexpandislikelytobeon-going. Existing armersso ..subdividing part of their home fanrito release capital 10 purchase arger or
The business and corporate type purchasers of farm land lend to receive consi orthe media, but numerically this group is not very significanL
^un, ey work carried out by Percy (1987) showed that new farmers were strong y 4191iva ytheirownproperties andwereoftenwilling to accept\, erylow Tales o returno . .demandfromthisgroupofpotentialbuyerswilliendtobedictaie y GPo" ..institutions. Thesepolicies are governed by tilesupplyoffundsavailabe orrur gthe lending proposal. When farming profitability is good the supp y o un sloincrease. Conversely, restrictive lending policies innmesofapooroutoo gof fann sales.
Existing farmersiradingfruTnsaresimultaneouslybu>, ersandseUersin Ginar e p 01results in at leasttwo sales. This group is usually in a relatively strong Inarici 00. " ..compulsion 10 move. This typeofbuyeris most active in themar etw en p ",farming.
3.0 The Six StageRuralMarketThe landmarkwork of Ratcliff(1949) provided a modelthatideniified a six stage housiqg mar 61. is p pedrawsontheworkofRatcliffbyproposingaihcoreticalsixstagemarket or arm ..paperenanay drealestate
sales volume as leading indicators 10 predict changes in farm land values.
3.1 Stagel-TroughAllhisstagefanTirealeslatepricesareinatrough. Buyersarein no uny p ,ve realistic about their asking prices. The main purchasers are existing armers w
sinon and looking to expand, and farmers with strong equity positions.f brs who are in a difficultfinancialposition and need 10 sell. In genera e qu Iy ois likely 10 be below average, since the stronger farrriers on the better unitsinstitutions will use moderately strict lending CTiicria.
,
.
,
Real Estate Educators' Conference - HargreavesFourth AUSiralasian
The firstindication of an upturn in the market willbe an expectation of an improvemen i pThis is most likely to be signalled by higher export prices being realised for woo , mea or ini p
3.2 Stage2-UpturnThere will be an improvement in farm profitability resulting from improved product prices, r uciions in inrates and cost structure, taxation incentives, increased subsidies for fanning, improvemen in ' gtechnology, trade negotiations, or a combination of two or more of the a ve 00 ors.
The volume of farm sales will increase before the price of farm land rises. This is because e unso sine ofarms on the market have 10 be absorbed before land prices will rise. The vendors associate wi e misostock will generally be conditioned 10 selling out under expectations formulated wing tage
Lending criteria will be relaxed over that prevailing in Stage I, since increased profitabi'Iy nomi y means epurchasers do riot require the same amount of equity capital.
3.3 Stage3-BoomThere is a major escalation in both farm ruinover Tares and the price of fanriland. In some case prices mayincrease 34 percent per month. The time that farms are on the marketis very short Auctions are requen yused as a selling 1001. The quality of farms on the marketimproves as vendors who do not ave 10 se areencouraged to cash in on the high prices. Above average operators use this opportunity 10 ITa e up o afann.
High prices for farm products means that farmers are spending money on deve opment an consumer gThe now-on effect from this spending firststimulates the rural towns and then the economies in e arger dies.
Lending institutions have a surplus offunds for lending and relax their nonnallending guide mes. or on erscompete for new business as farm lending is seen 10 be a low risk parr of their po o '0.
A number of public farmingCity investors gel caught up in the general euphoria and scramble to buy farms.companies and syndicates are formed to caprure this city money.
Buyers are less selective about the type of properties they purchase, and a larger I an norma num er o pproperties change hands.
Large numbers of farms are purchased for conversion 10 a 'higher and better use'.
3.4 Stage4-PeakDemand becomes saturated and the volume offarm sales sums 10 drop off. Investors perceive at e conenprices of farm land only offer a modest relum on capital and there are other more attractive invesunenopportunities.
Lending institutions sum to tighten their lending ctiteria. To keep prices up vendors offer more attractive co ssuch as low interest vendor mortgages or deferred payment schemes. The time taken to sell farms 16ngiliens,and the poorer farms are very difficult to sell at current prices.
The outlook for farm commodity prices is less certain than daring Stage 3. Syndicates and pub ic armingcompanies are SIiU being promoted.
3.5 Stages-DownturnFann profitability declines due to a downturn in farm product prices, or increasing farm costs. erause inOSvendors SIiU have expectations forrnulated during the upturn phase the farm turnover rate sharply contracts.few vendors are under financial pressure and have to reduce asking prices 10 meet the new marketleve . ervendors take their farms off the market because they are riot in any hurry to sell and will wait or e nextupturn.
Page 3
,
.
Page 4Real Estate Educators' Conference - Hargrea\. esFourth AUStralasian
3.6Stage6-Recession k
I continues 10 exceed demand, and buyers are very selective. iy '
bottomed out before re-entering the market.
i, ,titutionsWigG y Forth 6.16ndersdonojwjshjobeassocjajedwjthne alive publicity that can occur with mortgagee s us o rur
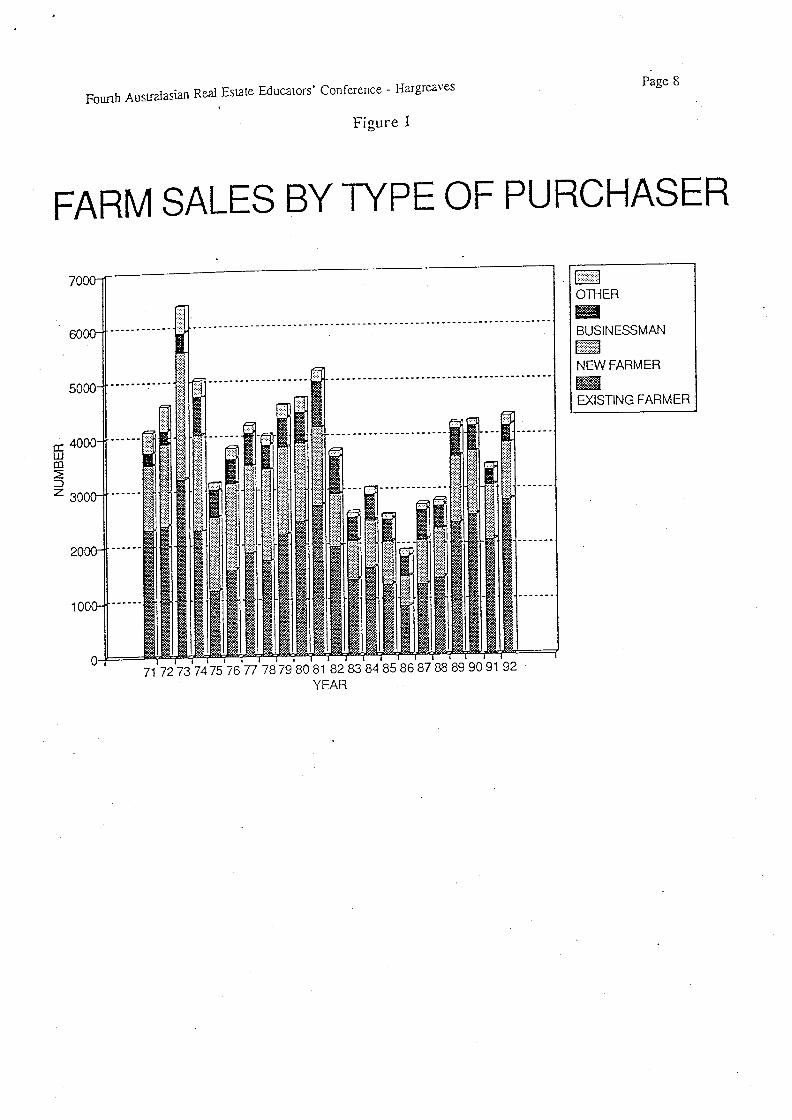
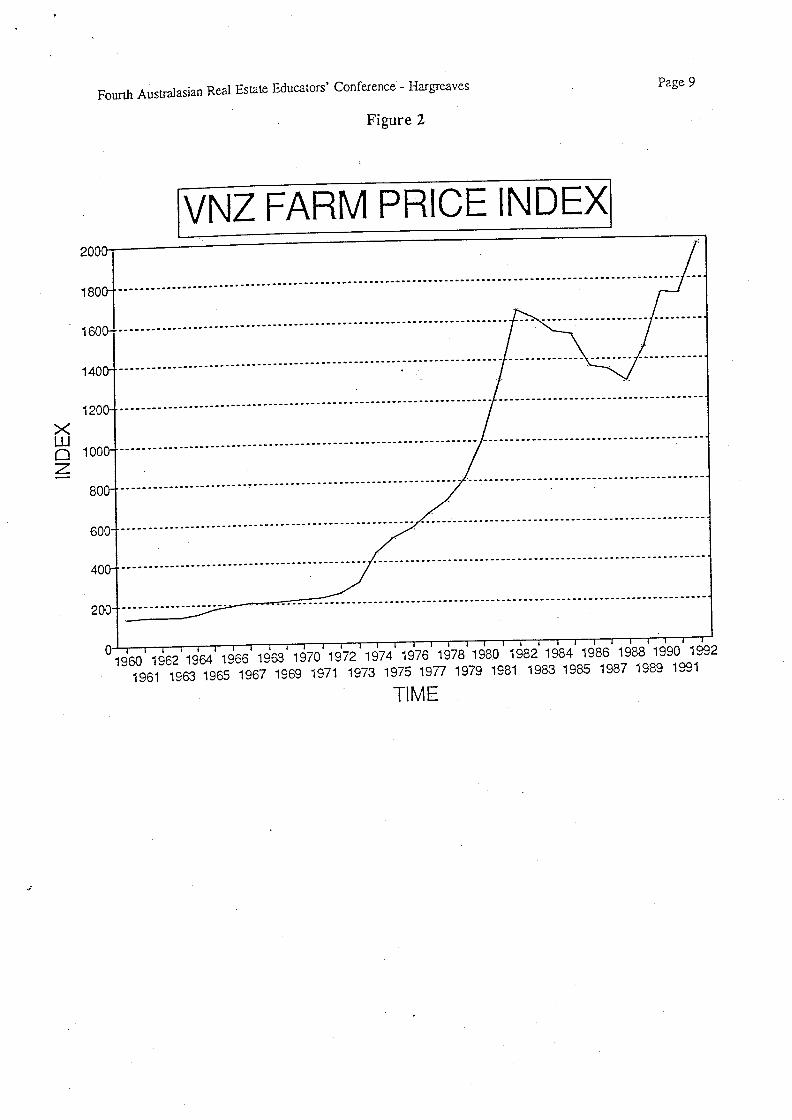
4.0 The PatternofRuralCyclesF' ore2 showsthechanges in the Valuation New Zealand fanTiprice in ex o pf oresareexpressedinnominaltermsanddonotshowanobviousc> p , 'ex Tossed in real terms, and the effects of inflation are reino\e , onFi ure 3 represents the same data sho\\, n in 1001/6mis. It is noticeapeaksoccurr ''g'ar' '', ,i, , akandasomewhatslowerdeclineleadingiothetrough.After achieving a major peak in 1982 the market was in sleep co 'nedeclinecanbeaiti'ibutedtoamajorresmicturirigoftheNew an coo y ..eSuited initiefloatingoftheNewZealanddollar, as wellastheremova o y
to fanning.
Forecasting the futurelengthofruralrealestatecyclesisadifficu 11as . p peightyearC) Ifth akaidtrouhs, sincefulureeconomicconditionsmay be significanUy different to those in the past.
5.0 The FactorslnnuencingRuralMarketsThe eneraltheory of realestaie cycles discussed in Section 3.1-3.6 can simp iithemteraction offarm productprices, farm turnover rates and arm r es p 'the shortrun, increased farm profitability is most Iikcly 10 occur aus p p'Increased product prices v. ,11/16ad 10 an increased volume of farm sa es, an ithat real estate prices are shorUy 10 move up. Bidding up the price o rea esrerunis and profitabili^, for new entrants causing the volume o sa us 10 0pis a signal that the market is nearly readng.
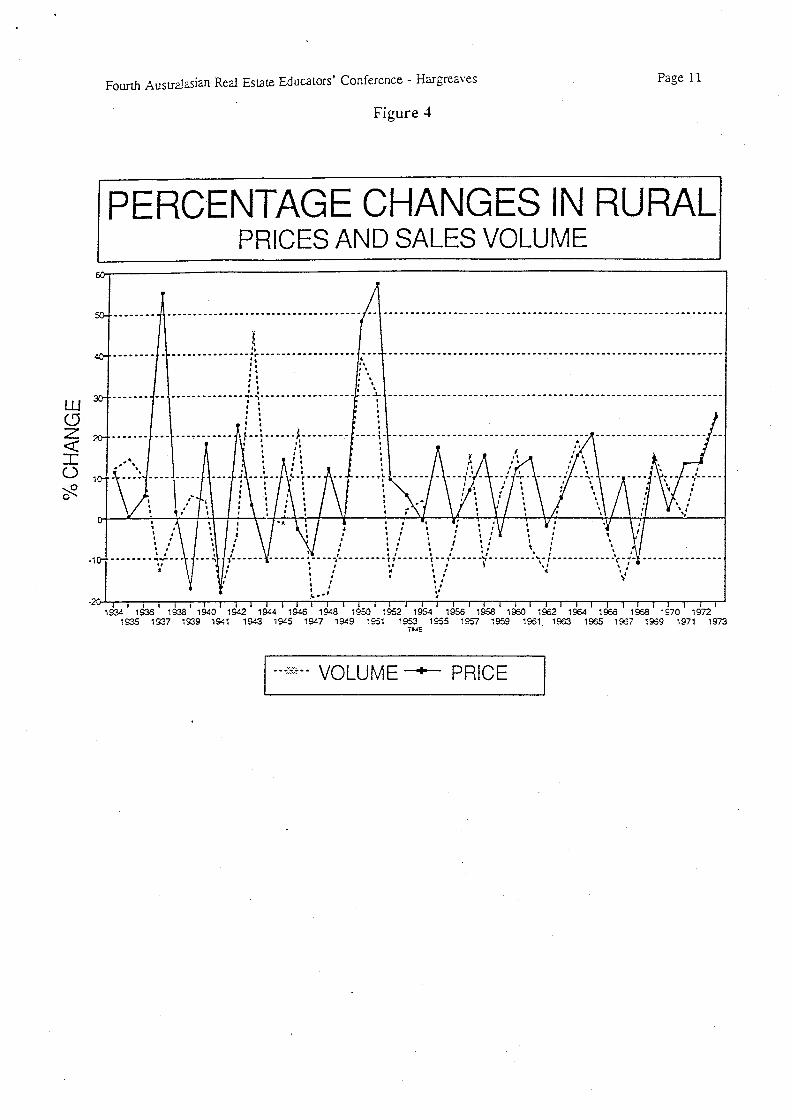
To test the turnover versus price relationship, the annual percenta, e c gaverages61nngpriceshavebeengraphedo\. erthe40yearperi INewZealandOfficialYearbook(1992)series. .Theserelationshipsareshownin igure ,modelstheaciualperformanceofihemodelappearsiobequitevaria e. p ,riddtrringthe 1960'schangesin sales\, o1umeoccurredaboutoneyear ore g ,
average selling price. Past government intervention in the mar 61 wingthat the price of land was controlled at 1942 values. In an e ort 10 ini 're isIation many potential vendors kept their properties off the mar 61. i
ears 'ust before, and just after, the legislation was artificially high.
6.0 RealEstateSub-MarketsThe eneralised view of the cyclical fluctuations in rural rea estate presthe fact that the rural market actually comprises of a series of sub-mar eeach other. For example, the marketfor dairy farms has been recenUy showipg SITon^ up pthe markeifor kiwifruit orchards has strong downward pressure. ie e p 'to the rice of kiwifruit, there is a substitution effect in real estate w en 'wi ruida' farms. Similarly, high milk prices have encouraged conversions o sodair>, ing.
Page 5Real Estate Educators' Conference - HargreavesFourth AUStralasian
Markets can be fomiersegmentedby location, whether the unitis economic, the overa qua 'Iy o p pe ,and size characteristics.
6.1 The Dairy Farmsub-MarketDany farm data has also been used to explore the relationship between the prices at armers rmilk and the price they pay for farms. Dairy foms have been chosen because onica y ami income is erylargely from the sale of just one item (milk). Most of the other major farming types have a wider pro!Iuce ini\,d this makes this analysis more complicated: the price of sheep meat may have been going up w ie isfalling and woolis static.
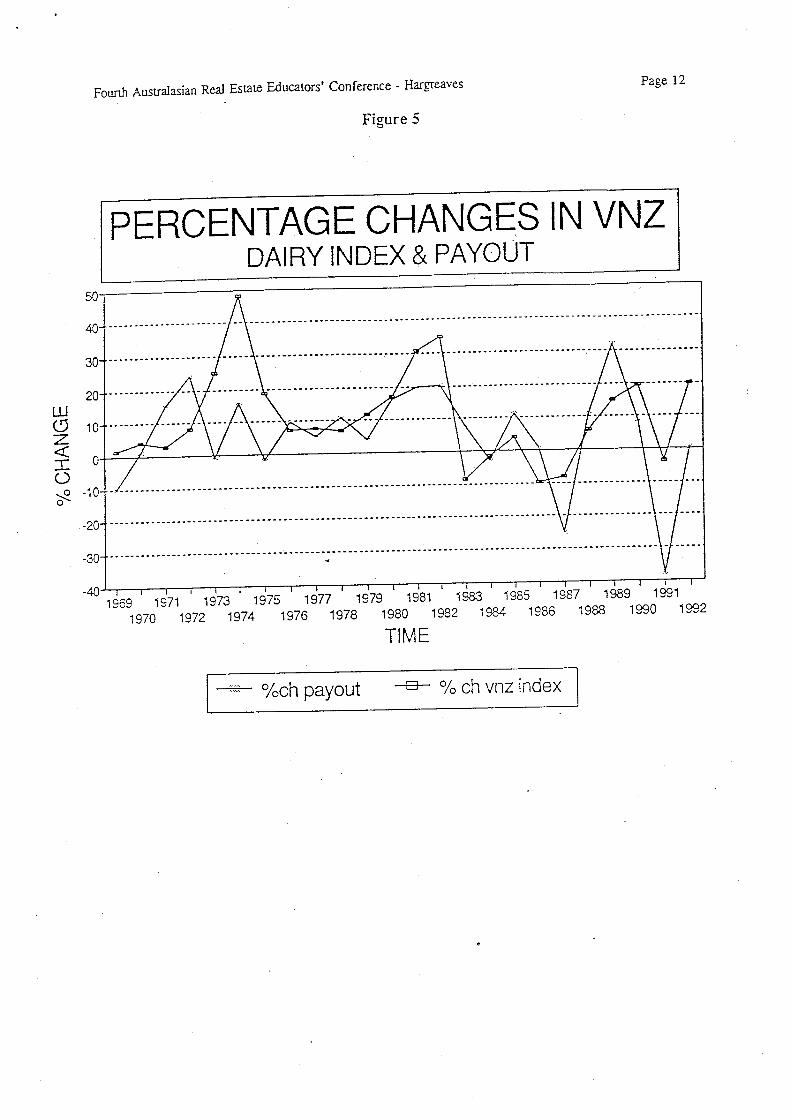
Figure 5 shows percentage changes in dairy farm milk solids payout and percentage changes in the VNZ dairyfarm index over time. It is apparent that changes in payout do lead to changes in price, ut as expecare a number of other variables that also influence the equation. New Zealand has a 66 year e ection cyc e,and the large percentage price changes in 1974 and 1981 are parriaUy a result of government slimu ajion o eeconomy in election years'
Government intervention in the market place through the now defunct Dairy Prices Fixing Authority a so athe effectof}jiniting the amount milk solids payout could be moved either up or down from one yearto the nexLDuring this period percentage changes in the milk price were less than percentage c anges in e price o aSince 1984 we have had a more free market approach, and product prices have fluctuated more than the priceof dairy farm land. This is an expected result, since, when farmers formulate a view o uture incomes, eyshould not rely just on the income from one or two years'
There is also the substitution effect, in that the land most suitable for dairy fanning is also likely 10 be suita efor other intensive livestock enterprises. For example, deer farming, race horse studs, and maize gowing acompete with dairying for good quality flat land in the North Island. In the 1970's maize growing wassometimes a more profitable use than dairying for land in the Walkato region.
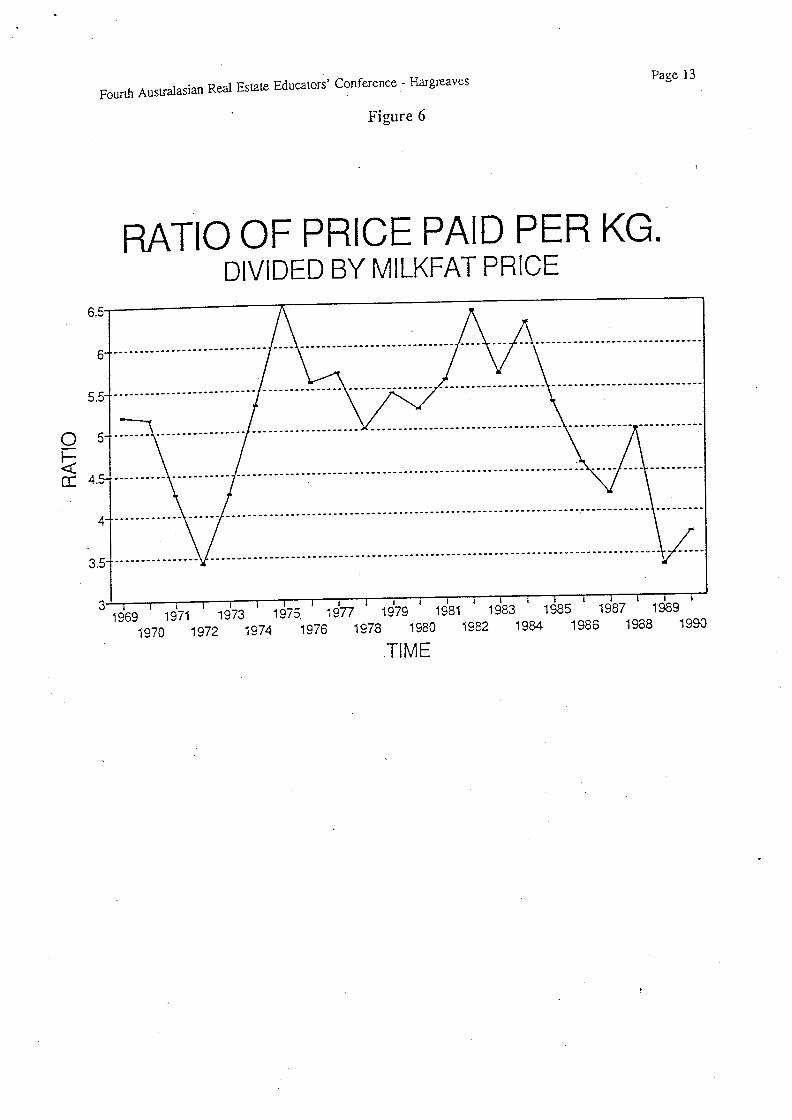
Dairy fanners use the price paid per kilogram of milk solids as the benchmark indicator. This is the equiv Gritof a gross income multiplier. This multiplier is expressed in Figure 6, which shows the ratio of the price palper kilogram divided by the price per kilogram. Over a 20 year period from 1969 this ratio has averagapproximately 5. To provide consistency the payoutfigure used is the payoutfrom the Dairy Board 10 in ivi uDairy Companies. From a buyer's perspective the bestiime to purchase is when the multiplier is ow. igmultipliers indicate a longer payback period for the initial invesunent.
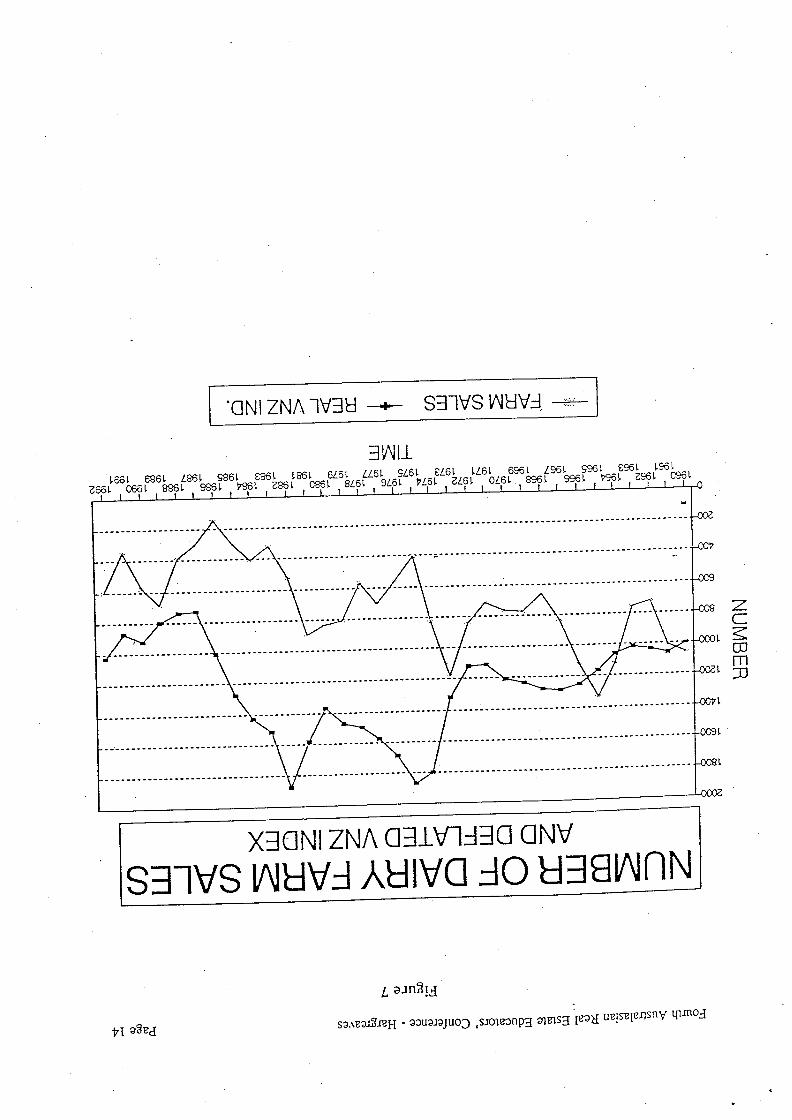
The tomover hypothesis outlined under 6.0 was also applied 10 an examination of the relationship between dairyfarm tumoverrates and price changes to dairy farms. This analysis is shown in Figure 7 and generaUy supportsthe view that dairy farm turnover Tales peak about a year before land prices peak. Similarly, at the trough partof the cycle, upturns in the turnover rates occur before land prices have reached the bottom of the cycle. Dairyfarm prices are expressed using a donated Valuation New Zealand Dany Farm index set at an arbitrary figureof 1000 in 1960. The gradual decline in the number of dairy farms sold over the period 1960-1992 is simplya reflection of the fact that the population of dairy farmers is gradually decreasing as the size of an economicunit keeps increasing.
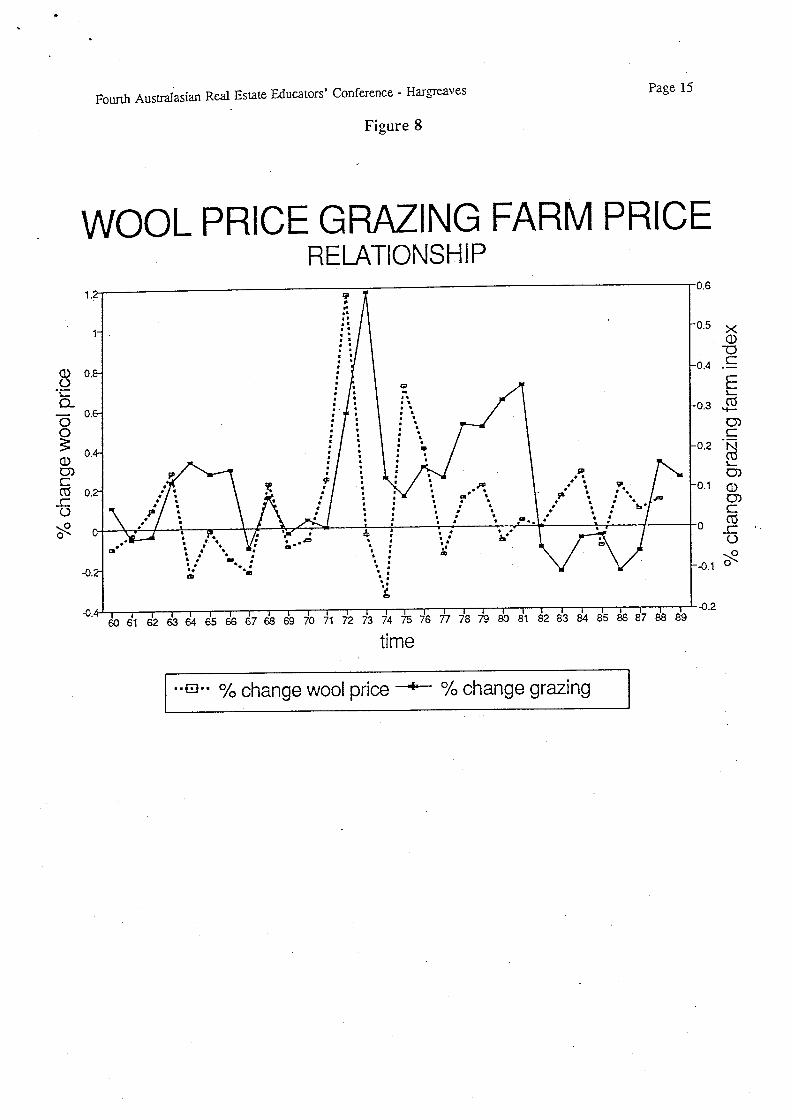
6.7 The Sheep andBeefSub-MarketSheep and beef farming is the dominant form of land use throughout New Zealand. This type of activity isfound over a wide range of soulypes, topography and climatic conditions. Valuation New Zealand classify theeasier country as fattening units and the more difficult country as grazing units. The New Zealand Meat andWool Board Economic Service (1990) use a similar, but more detailed, classification system.
Figure 8 shows the percentage changes in wool prices and in real VNZ Grazing Farm indices over the 30 yearperiod since 1960.
Page 6Real Estate Educators' Conference - HargreavesFoorth AUSiralasian
nt thatche linkage between wool prices and grazing arm v ues 'I'kaebetweenmjlkprjcesanddajryfarm. This is riotsurprisingSinC6W y f fsheep and beeffarrners. n rincomes.
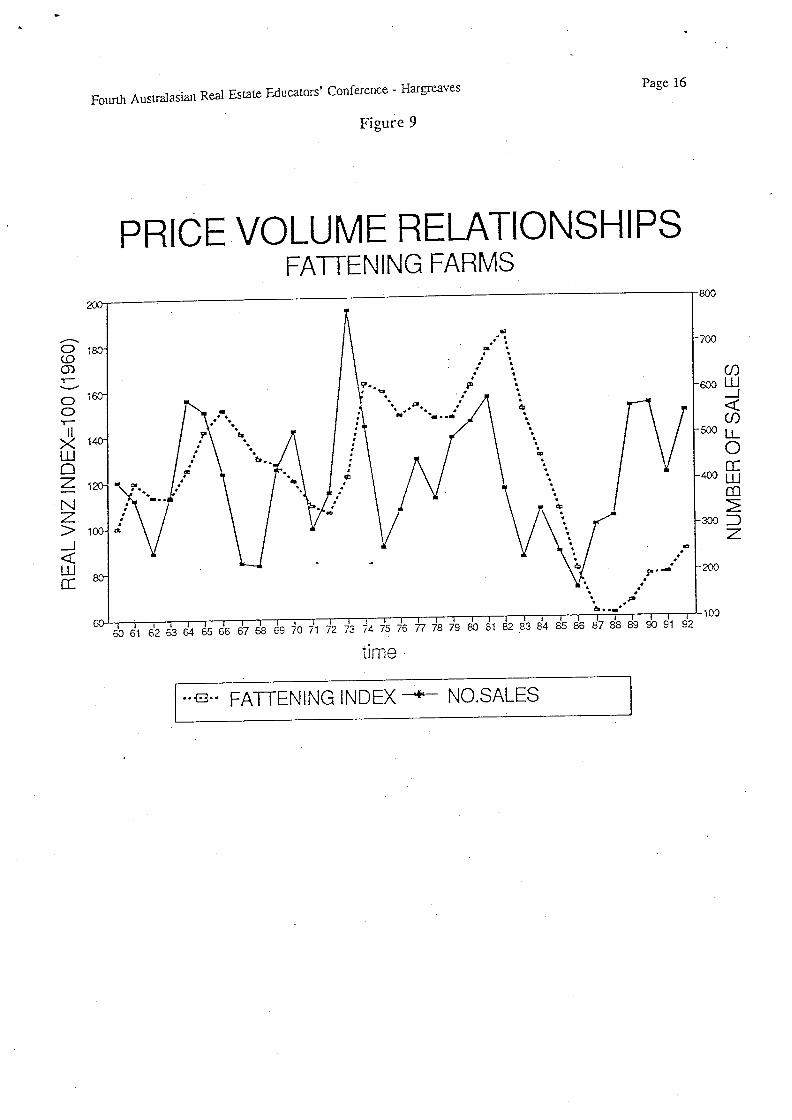
filesIrongreati""' IhN ZealandMeatandWoolBoard'SEConomicThe S O g 992, in datacom itedbytheNewZGalandMGatandWoolBoard'SEConomjcS ice. Figure9 shows the relationship between the fattening armZealandlndexforfattening farms. Onceagain tornoverraiesappear g10 predict changes in land values.
7.0SummaryandConclusions ..Th author has proposed a six stageruralrealestaie cycle that is as of urbanrealestatebyRatcliff. Thekeyruialmarketplayersareien ..astrodersisviewedasbeinganimporianidimensioninte\OUmG hd led b the banks are also seen as playing a key role in delemiining
year.
I nation has tended 10 disguise the actual ups and downs in e prope yexpress .' I'kilobedrivenmainlybythechangesloexportfarmcommodity
prices. Thisrea' P N zealandisnowrelativelyfreeofgovemmentintervention, and the price signals observed by farmers are gener y
This paper highlights the importance of using arm turnover re usrt rices. According 10thedata, whichisanalysedonanannu ,
a year before farmprice movements. urnoverrand market downturns.
.
.
.
Real Estate Educators' Conference - HargreavesFourth AUSiralasian
References CitedPaper presented to New Zealand Institute
Davison, RM, ep -,, 1,11992.Various issues 1934-1993, Government Print.'New Zealand Ofi'iciol year Book'.Depamnent of Statistics.
Janssen, IE, Kruiit, a' ' s ., t, sanDiego, April1992-Educators'To Third AUStralasian Real EstateTurnre Directions in Reo! Estate Rese@rc '.Lusht, K. urure I
Various issues published by the'Annual Reports'.N W Zealand Meat & Wool Board's Economic erviEconomic Service.
Unpublished dissertation forpercy, M. 'Ast"dyQfi^ rO , u, iversity, 1987.
McGraw-Hill, New York, 1949.'Urban Land Econoniics'.Ratsliff, R U.
Various issues 1970-1993 published by ValuationRural Properly Soles SICiis!ics'.Valuation New Zealand.New Zealand.
Page 7
.
Fourth Austinlasian
FARMSALESBYTYPEOFPURCHASER
Real Estate Educaiors' Conference - Hargrea\'es
Finure I
70
60....-.......
50-- ;
a
I:c 4000
............
----.-......----.
LLlco^D
z 300
......
-!................
---..........-.....-..---..........
....-.
$^
~.
20
. . :\,
'*.
* -;
a
.
*
,*,
.*,
. . .
......
10
1:6
.......................
.-....
Page 8
o
.
,
......................
J
.
........-.
.,
*:
71 72 73 7475 76 77 7879 80 81 82 83 84 85 86 87 88 89 90 91 ,2
..........
-- ;
OTHER
aBUSINESSMAN
NEWFARMER
^EXISTING FARMER
xi
.............
-- *-----I
.......
...,
....
*.*..
a
*;$
,
*,
:4a
;t
YEAR
.
Fourth Austinlasian Real Estate Educators' Conference - Hargreaves
Figure 2
200
180
VNZ FARM PRICE INDEX
160
140
><LLl.Z
120
100
.^
800
600
400
200
Page 9
1960 1962 1064 1966 1968 1970 1972 1974 1976 1978 1980 1982 1984 1986 ,~ vv1961/963t965 1967 1969 1971 1973 1975 1977 1979 1,811983,985 v ,
TIME
.
,
.
.
Fouli AUStralasian Real Estate Educators' Conference - 116. rgreaves
Figure 3
2.
VNZ FARM PRICE INDEX(REAL)
2.
2
>< I.LU.Z- I.
.
I.
I.
Page 10
19'0 1962 1964 1966 1968 1970 1972 1974 1976 1978 1980 1982 1984 198 , ,1961 1963 1965 1967 1969 1971 1973 1975 1977 tv79 1981 1983 19
TIME
FoorLh AUStra!asian Real Estate Educators Conference - Hargrea\es
Fioure 4
PERCENTAGE CHANGES IN RURALPRICESANDSALESVOLUME
LU<. 17Z<::Co
~~!^
................................... ..
........."""F""""""""'
............... .................
----------- I--.------ -------.-
..... .... , ... r. . L. ,... ..
,,*,,
.,
, ,. .,, ,,. , ,, . .. , ,, , .
........-. F. .. ...\,,,
.,
I.,
. . J. .
......
1934 1935 1938 1940 1942 19c4 1946 1948 1950 1952 1954 1956 1958 1960 1952 1964 ,955 1958 ,970 19721935 1937 1939 19<1 1943 a945 ,947 1949 ,951 1953 1955 1957 1959 1961 1963 1955 1967 1959 1971 1973
TUE
Page 11
....... . ... . .. .. . ....., .. . .... .... . ... .......
""" """""".""""',,...... I. .,......*...........,.......""'r"' """""""'
VOLUME+- PRICE
,
Fourth AUStralasian Real Estate Educators' Conference - Hargreaves
Figure 5
PERCENTAGE CHANGES INVNZDAIRYINDEX& PAYOUT
50
40
30
20
LL!<. 9 10Z<^ oo,!^ -10
-20
-30
-40
................-...... .-
..................... .....
............. - .
......... ...... . ....
.--......-.........--......-
.............-...............
..-.....-.
......-......
.............................
.. ...... .....-..
............................
^
19'9 1971 1973 1975 1977 1979 1981 1983 198 v1970 1972 1974 1976 1978 1980 1982 1984 I'S , ,,
TIME
Page 12
...................
.............
.............
..-...... ............. .
^,". ch payout
...............
...... . ....
^=--.F~,
9, ". ch vnz index
.
,
,
armAustralasianRealEstateEducators' on erence- gitFigure 6
RATIO OF PRICE PAID PIER KG.DIVIDED BY MILKFAT PRICE
6.5
6...-......
5.5
O 5
DC 4.
...... .....
I--.<
.......
.... ...........
... .....
4..........................
3.5 ................
3 I I
1969 1971 1973 1975. 1977 1979 1981 1983 1985 191970 1972 1974 1976 1978 1980 t, 82 1984 198 ,,
TIME
Page 13
.........................
........................
............................
..... .... ..........
.
,
1651 6861 L86L 9861 8''' ' ~\ 9c~L PL6L azsL oz6L 8961' 996L he61 ZS6L, ,
'. NI ZNA TV;^\:! ^.--
^V\IIJ_
SEI^Vs V\I^{V=I.
SI^~IVSXE^ONIZNA O^LV~1.1^. ONVVV^V=I A^^IVC =10 ^'El^IVVf~IN
............-...
^{ gaga
-
L aJn:;!.!I
s9, \goJ3JeH - 9000/01uoo ,stoleonp^ coglS3 189^{
ZC;^::00in33
urnse!ensnv nunoa
.
.
.
.
.
Fourth Austinlasian
WOOLPRICEGR. AZING FARM PRICERELATIONSHIP
Real Estate Educators' Conference - Hargrea\'es
Figure 8
I.
^; .L-
Q. .-Ooo
^:coDJ.CT3 0..CQ
o
\
,,,........... .. .. .. .
....................,..
., .. ., .. .
P I.
P
<).
.,0
..
,
.
4>
., ..
60 61 62 63 64 65 66 67 68 69 70 71 72 73 74 75 76 77 78 79 80 81 82 83 84 85 86 87 88 89
Page 15
..........,...............
,
.
e..,... .. .
..,...
.
.....
.
...
..,.,..
91
.
a. .a
.. . on
.......
91. change wool price +~' ^/, change grazing
.
... ., .. ., ., .
..........
... %,....,,,..
P
.
..
Ifa
06
time
0.5
.. .
..
P \* .
.
.
^
P
><cot^C
IEL. .
CGL, -.
DJC
04
,
0.3
. .
;...
.
^.
.
.
0.2 ;'
F
0.1
I. -.
DJ
coDJC<13.,=o
o
4). I\
4i. 2
.
.
Fouli AUStralasian Real Estate
PRICEVOLUME RELATIONSHIPSFATTENING FARMS
Educators' Conference - Hargrea\, es
Figure 9
I~\
01<0coT~\-,.
ooT~~
11>< ILU.Z
I\!Z>I.
<LLlI^
,
.
.
?
a
.
.
b
^
Page 16
60 61 62 63 64 65 66 67 68 69 70 71 72 73
q~
~
.
P
^
.
.
,
....
5.
.. . .. FATTENING INDEX -*- No, sALES
"
~4 75 76 77 78 79 80 81 82 83 84 85 85 87 88 89 90 91 92
time
800
,
700
~
co600 U_I.<co
500 LLoDC
400 LLiCD
:^300 D
Z
a,
...
a. ..
F'~
,
P,
.
200
100