Embed Size (px)
Citation preview
CONNECT WITH CAEP | www.CAEPnet.org | Twitter: @CAEPupdates
Re-visioning: Future of the EPP Annual Report (Focus Group)
Jennifer E. Carinci, CAEP Richard Rice, CAEP
Spring 2015 CAEP Conference – 4-9-15
CONNECT WITH CAEP | www.CAEPnet.org | Twitter: @CAEPupdates
Attendees participated in a focus group to shape the future of the EPP Annual Report
• CAEP staff detailed common questions from EPPs on the 2014 and 2015 EPP Annual reports See slides 4-38 for an overview of 2014 results and feedback
• CAEP staff listened to feedback on how to improve the
user experience, use, and usefulness of EPP Annual reports for 2016 and beyond See next slide for questions asked of attendees If you were unable to attend the focus group and would like to share
your thoughts on any of the questions on slide 3, please email [email protected] and [email protected]
CONNECT WITH CAEP | www.CAEPnet.org | Twitter: @CAEPupdates
Focus Group Questions If you would like to share your thoughts on any of the questions below, please email [email protected] and [email protected]
• What is most important for CAEP to ask about in the EPP Annual Report?
• What info do you already gather that is not asked about on the EPP Annual Report?
• Is there a way for CAEP to ask better questions about data that you do collect for the EPP Annual Report?
• What would make the EPP Annual Report more useful to you?
• How do you use the technical guide for the EPP Annual Report?
• Is there another form of assistance that would be helpful to you in completing the EPP Annual Report?
• Do you have an ideal vision for what the EPP and/or Annual Report should look like? • • What information do you think should be included in the CAEP Annual Report?

CONNECT WITH CAEP | www.CAEPnet.org | Twitter: @CAEPupdates
Provider Annual Reporting: Where We are and Where We are Headed
Jennifer E. Carinci, CAEP
Fall 2014 CAEP Conference – 10-1-14
NOTE: The following presentation has been archived from the Fall 2014 CAEP Conference, as the Spring session focused on gathering feedback.
CONNECT WITH CAEP | www.CAEPnet.org | Twitter: @CAEPupdates
Agenda
• Annual Report Introduction • Eight Annual Measures • Evidence • Results from the 2014 EPP Annual Report • Feedback Survey Results • Looking Ahead • Q &A
CONNECT WITH CAEP | www.CAEPnet.org | Twitter: @CAEPupdates
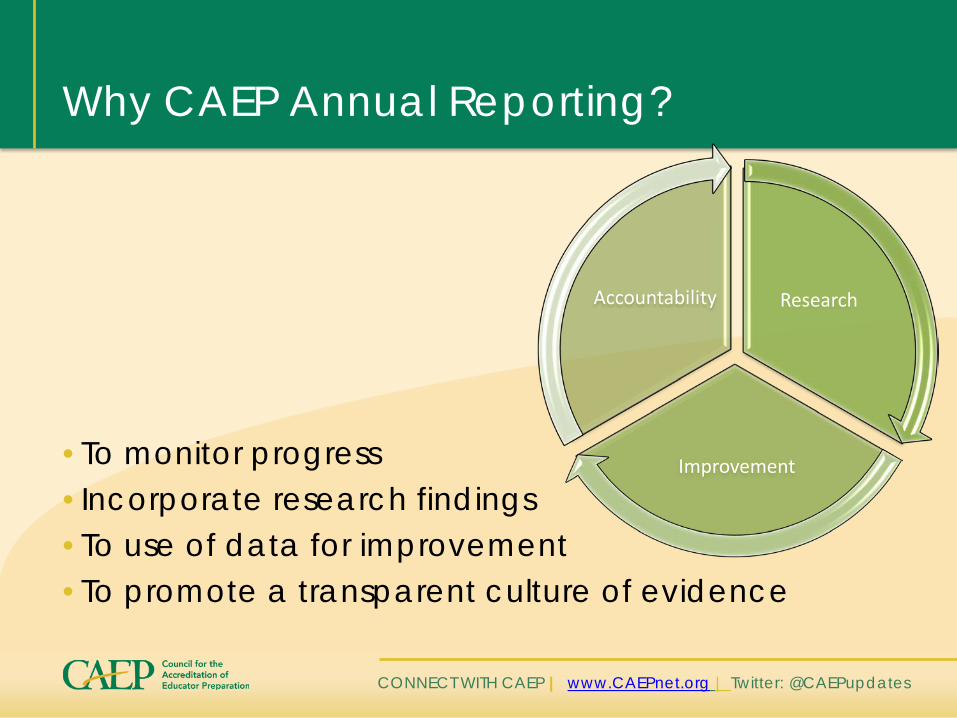
Why CAEP Annual Reporting?
• To monitor progress • Incorporate research findings • To use of data for improvement • To promote a transparent culture of evidence
Research
Improvement
Accountability
CONNECT WITH CAEP | www.CAEPnet.org | Twitter: @CAEPupdates
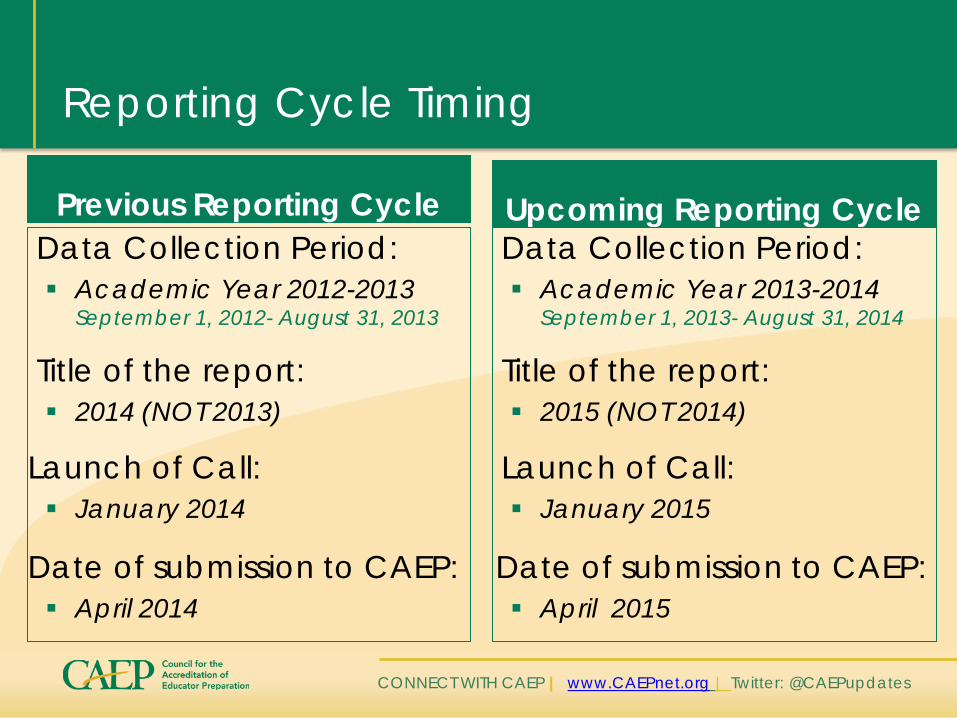
Reporting Cycle Timing
Data Collection Period: Academic Year 2012-2013
September 1, 2012- August 31, 2013
Title of the report: 2014 (NOT 2013)
Launch of Call: January 2014
Date of submission to CAEP: April 2014
Upcoming Reporting Cycle Data Collection Period: Academic Year 2013-2014
September 1, 2013- August 31, 2014
Title of the report: 2015 (NOT 2014)
Launch of Call: January 2015
Date of submission to CAEP: April 2015
Previous Reporting Cycle
CONNECT WITH CAEP | www.CAEPnet.org | Twitter: @CAEPupdates
Who Should Complete the Report?
By CAEP Board policy, these reports are a required part of accreditation and the information contained in them is readily available on each EPP’s website. A missed annual report submission could result in the revoking of accreditation
Everyone!
CONNECT WITH CAEP | www.CAEPnet.org | Twitter: @CAEPupdates
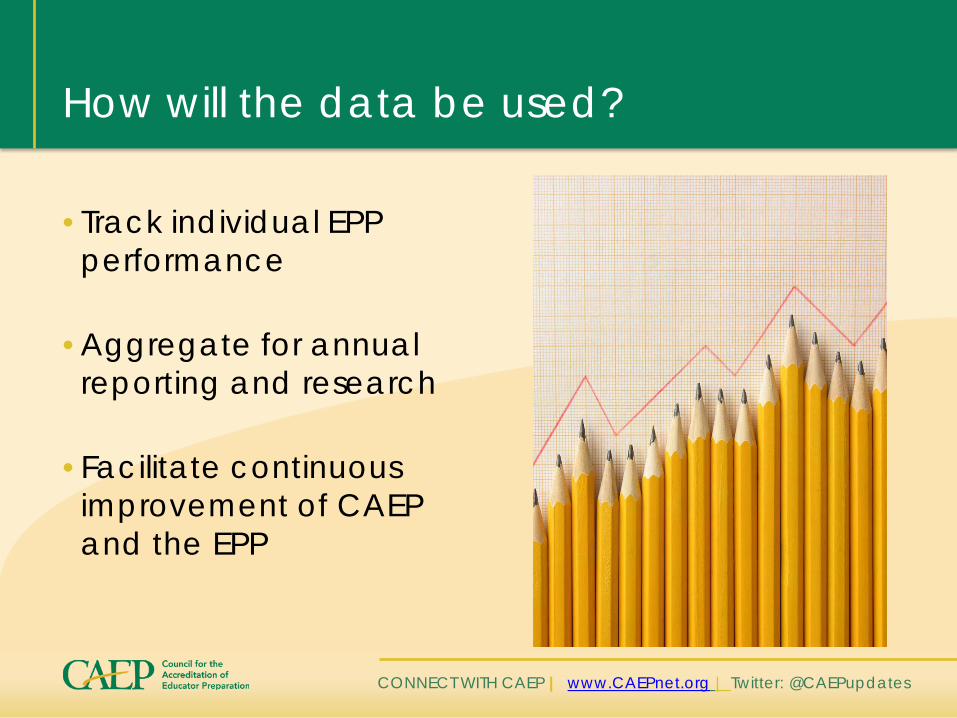
How will the data be used?
• Track individual EPP performance
• Aggregate for annual reporting and research
• Facilitate continuous improvement of CAEP and the EPP
CONNECT WITH CAEP | www.CAEPnet.org | Twitter: @CAEPupdates
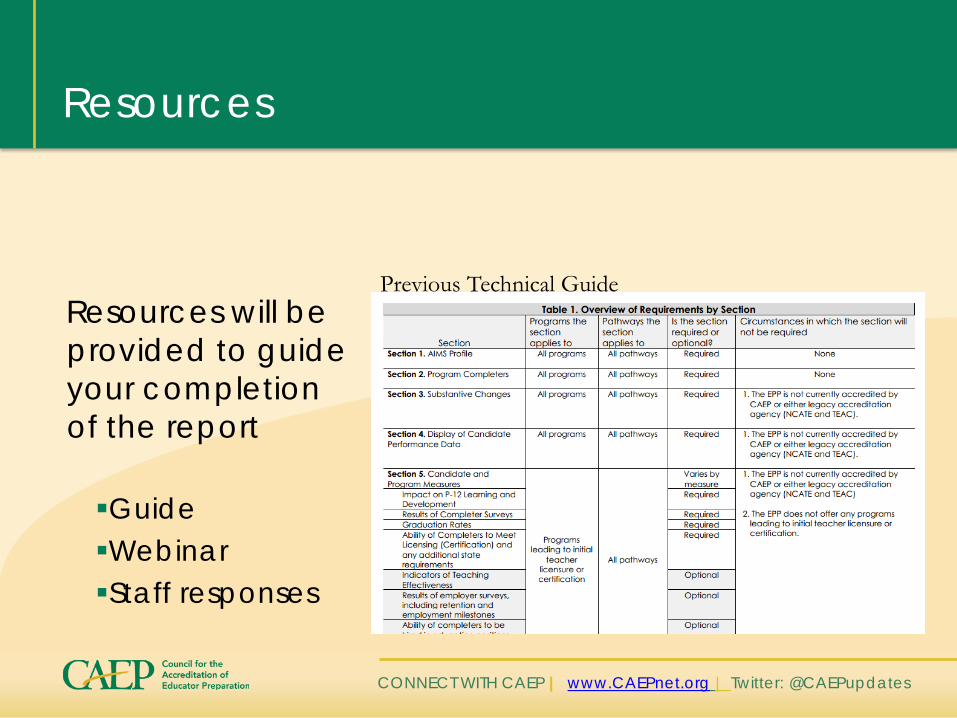
Resources
Resources will be provided to guide your completion of the report Guide Webinar Staff responses
Previous Technical Guide
CONNECT WITH CAEP | www.CAEPnet.org | Twitter: @CAEPupdates
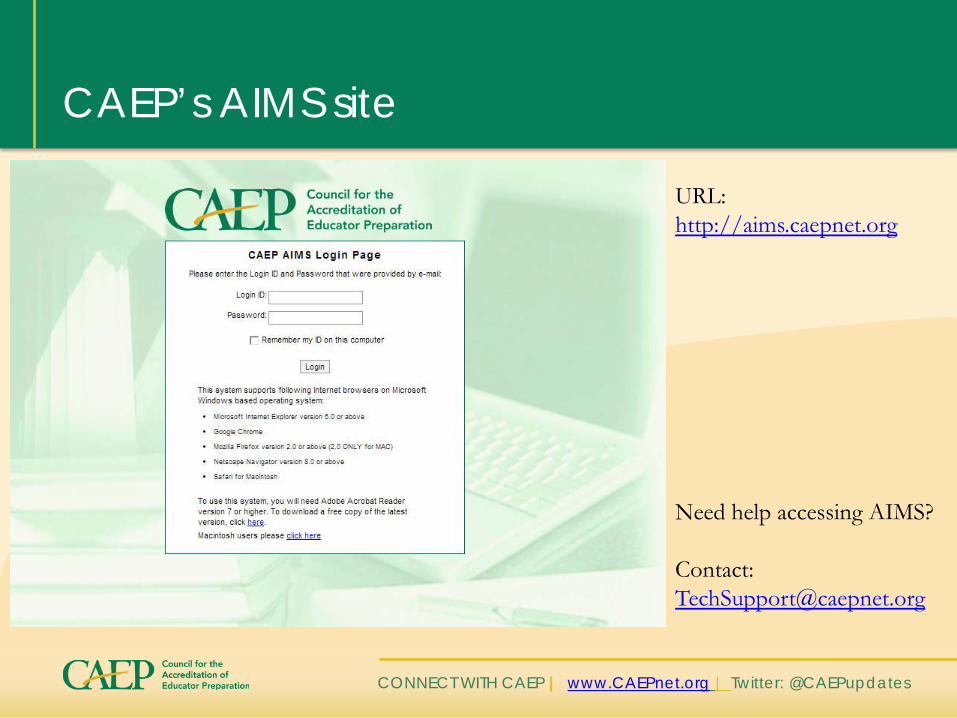
CAEP’s AIMS site
URL: http://aims.caepnet.org Need help accessing AIMS? Contact: [email protected]
CONNECT WITH CAEP | www.CAEPnet.org | Twitter: @CAEPupdates
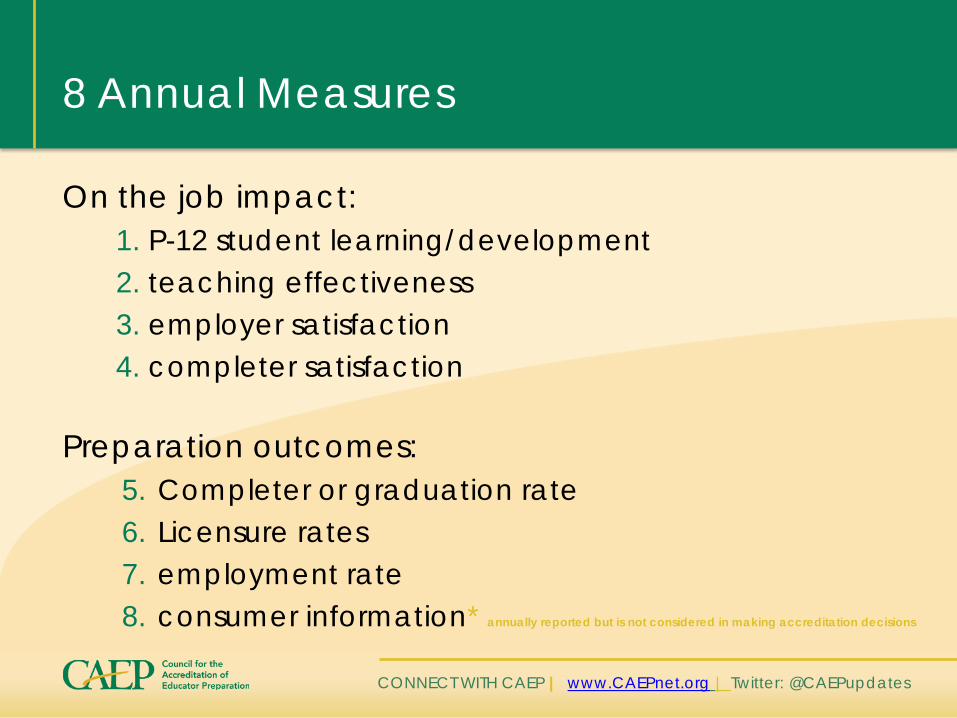
8 Annual Measures
On the job impact: 1. P-12 student learning/development 2. teaching effectiveness 3. employer satisfaction 4. completer satisfaction
Preparation outcomes: 5. Completer or graduation rate 6. Licensure rates 7. employment rate 8. consumer information* annually reported but is not considered in making accreditation decisions
CONNECT WITH CAEP | www.CAEPnet.org | Twitter: @CAEPupdates
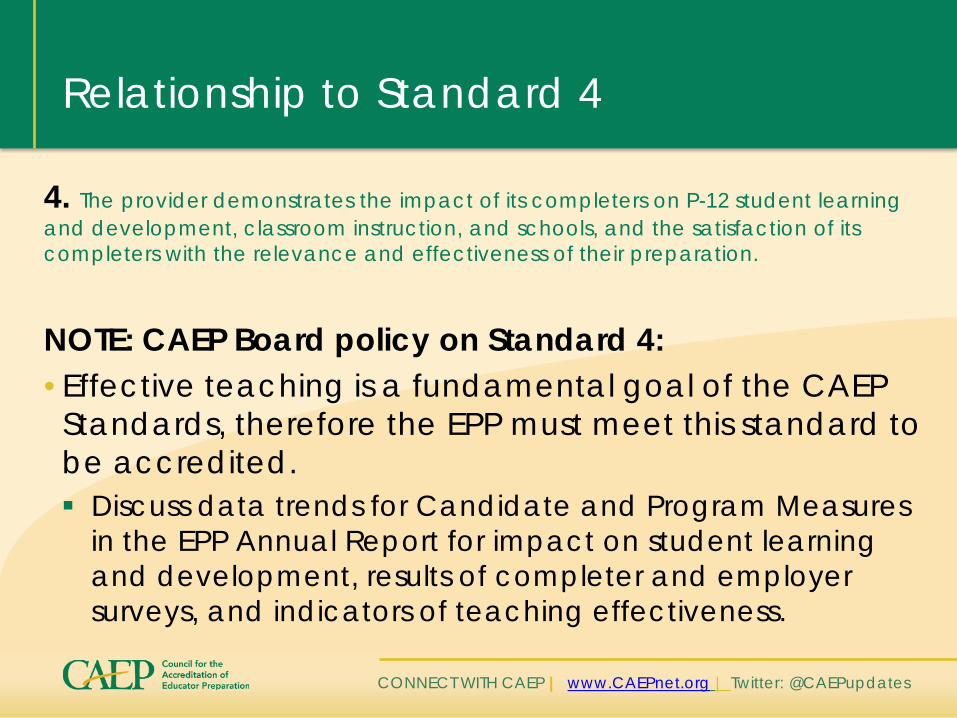
Relationship to Standard 4
4. The provider demonstrates the impact of its completers on P-12 student learning and development, classroom instruction, and schools, and the satisfaction of its completers with the relevance and effectiveness of their preparation.
NOTE: CAEP Board policy on Standard 4: • Effective teaching is a fundamental goal of the CAEP
Standards, therefore the EPP must meet this standard to be accredited. Discuss data trends for Candidate and Program Measures
in the EPP Annual Report for impact on student learning and development, results of completer and employer surveys, and indicators of teaching effectiveness.
CONNECT WITH CAEP | www.CAEPnet.org | Twitter: @CAEPupdates
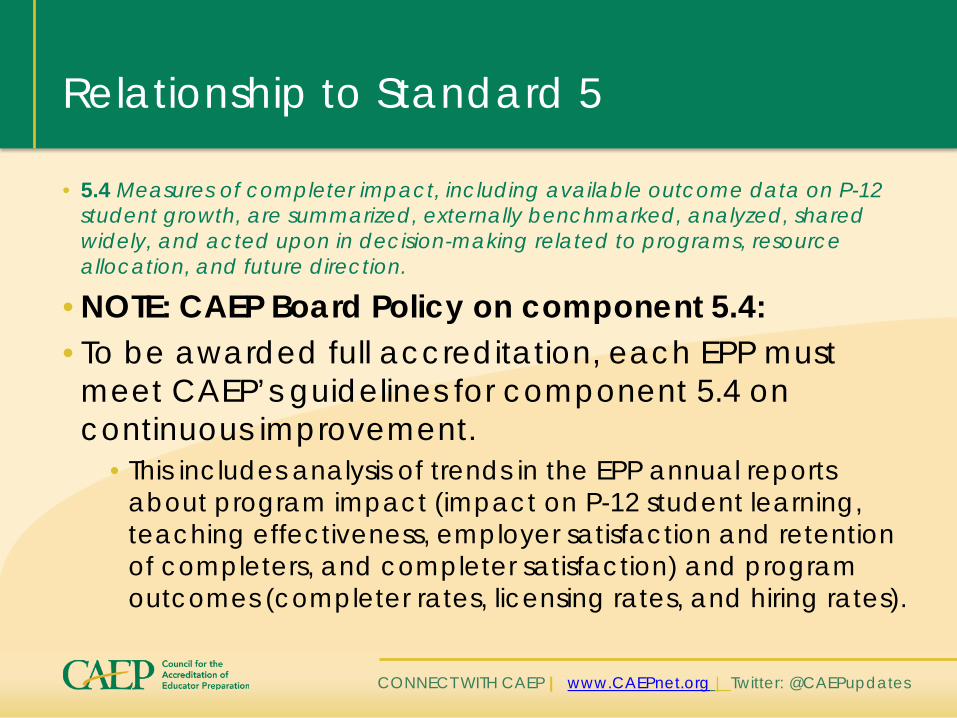
Relationship to Standard 5
• 5.4 Measures of completer impact, including available outcome data on P-12 student growth, are summarized, externally benchmarked, analyzed, shared widely, and acted upon in decision-making related to programs, resource allocation, and future direction.
• NOTE: CAEP Board Policy on component 5.4: • To be awarded full accreditation, each EPP must
meet CAEP’s guidelines for component 5.4 on continuous improvement.
• This includes analysis of trends in the EPP annual reports about program impact (impact on P-12 student learning, teaching effectiveness, employer satisfaction and retention of completers, and completer satisfaction) and program outcomes (completer rates, licensing rates, and hiring rates).
CONNECT WITH CAEP | www.CAEPnet.org | Twitter: @CAEPupdates
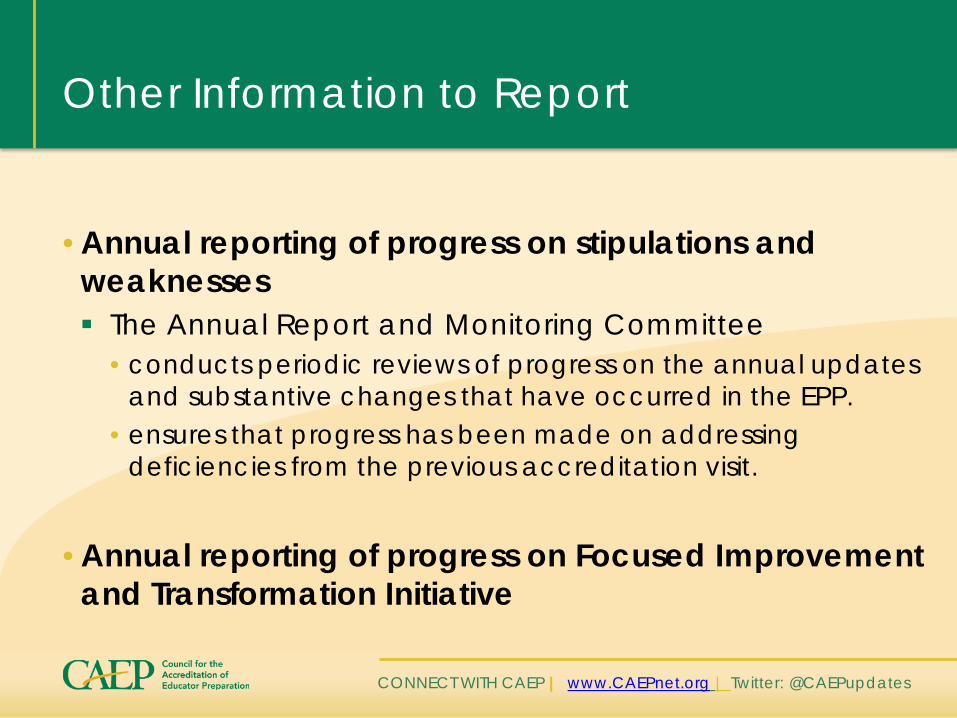
Other Information to Report
• Annual reporting of progress on stipulations and
weaknesses The Annual Report and Monitoring Committee
• conducts periodic reviews of progress on the annual updates and substantive changes that have occurred in the EPP.
• ensures that progress has been made on addressing deficiencies from the previous accreditation visit.
• Annual reporting of progress on Focused Improvement
and Transformation Initiative
CONNECT WITH CAEP | www.CAEPnet.org | Twitter: @CAEPupdates
Public Disclosure and Transparency of Accreditation Information (Policy XXXIX)
• EPPs to post links to candidate performance data and
other information (including Title II data) prominently on your homepage.
• Access to this information is a public service and should be geared to public understanding of the performance of the candidates in your preparation programs
• When displaying data, the EPP is responsible for considering candidate confidentiality.
CONNECT WITH CAEP | www.CAEPnet.org | Twitter: @CAEPupdates
Display of Candidate Performance Data
• Provide a link that demonstrates candidate performance data are public-friendly and prominently displayed on the school, college, or department of education homepage.
• Additional links can be added.
CONNECT WITH CAEP | www.CAEPnet.org | Twitter: @CAEPupdates
Examples of Data to Display
• Results of state licensure exams • Results of employer and/or graduate surveys • Average GPAs of program completers • Retention rates in preparation programs and in the
teaching field • Job placement rates • Value-added or growth model data on teacher
effectiveness • Graduation rates
CONNECT WITH CAEP | www.CAEPnet.org | Twitter: @CAEPupdates
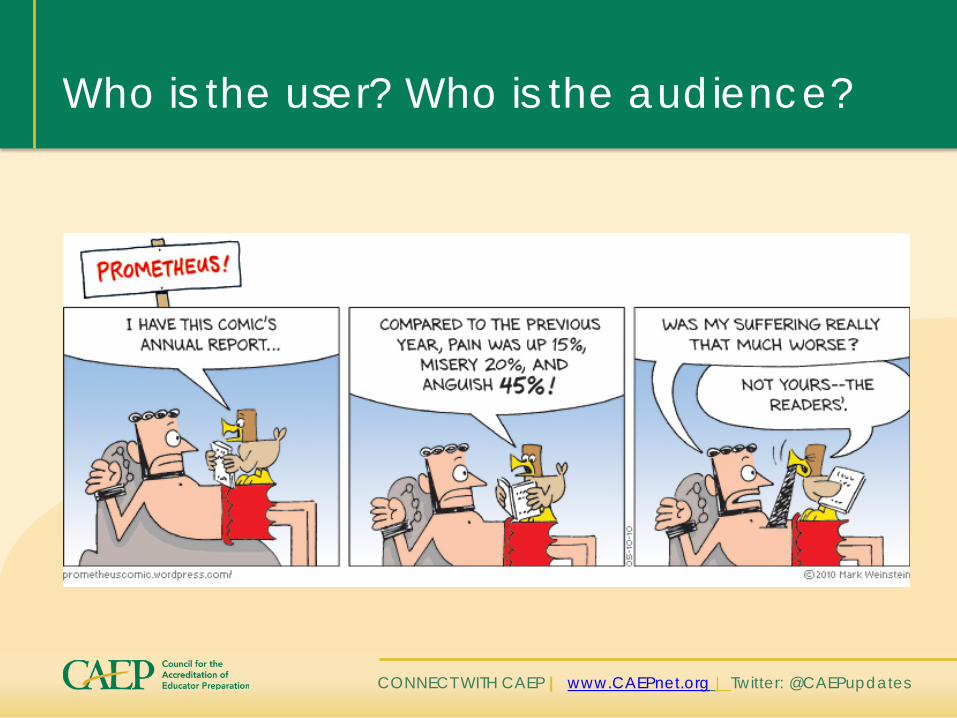
Who is the user? Who is the audience?
CONNECT WITH CAEP | www.CAEPnet.org | Twitter: @CAEPupdates
2014 EPP Annual Report Results
CONNECT WITH CAEP | www.CAEPnet.org | Twitter: @CAEPupdates
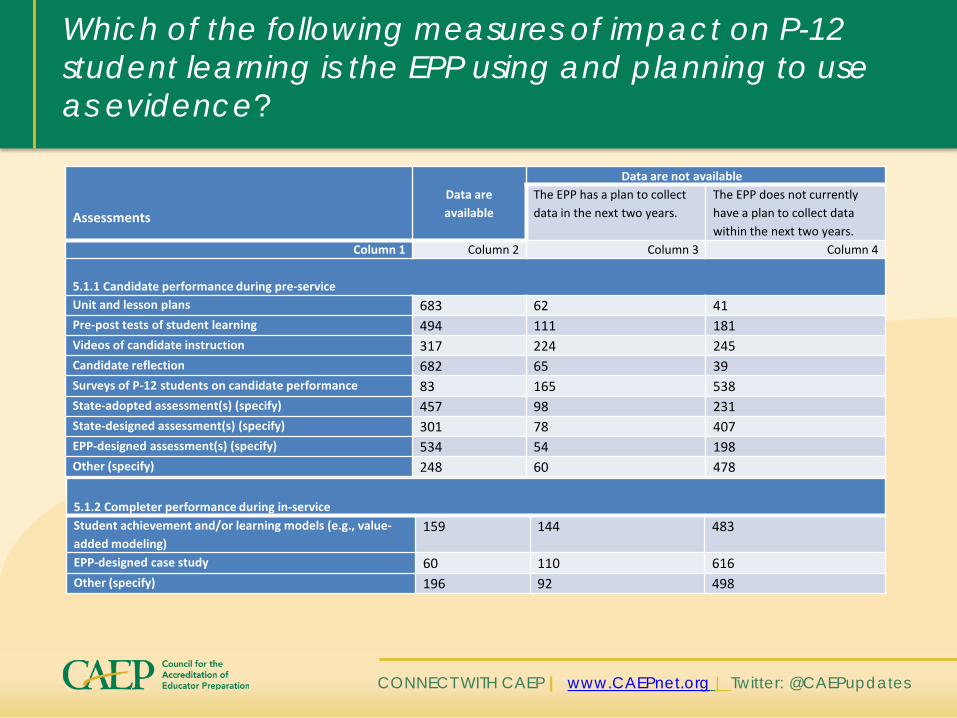
Which of the following measures of impact on P-12 student learning is the EPP using and planning to use as evidence?
5.1.2 Completer performance during in-service Student achievement and/or learning models (e.g., value-added modeling)
159 144 483
EPP-designed case study 60 110 616 Other (specify) 196 92 498
Assessments
Data are available
Data are not available The EPP has a plan to collect data in the next two years.
The EPP does not currently have a plan to collect data within the next two years.
Column 1 Column 2 Column 3 Column 4 5.1.1 Candidate performance during pre-service Unit and lesson plans 683 62 41 Pre-post tests of student learning 494 111 181 Videos of candidate instruction 317 224 245 Candidate reflection 682 65 39 Surveys of P-12 students on candidate performance 83 165 538 State-adopted assessment(s) (specify) 457 98 231 State-designed assessment(s) (specify) 301 78 407 EPP-designed assessment(s) (specify) 534 54 198 Other (specify) 248 60 478
CONNECT WITH CAEP | www.CAEPnet.org | Twitter: @CAEPupdates
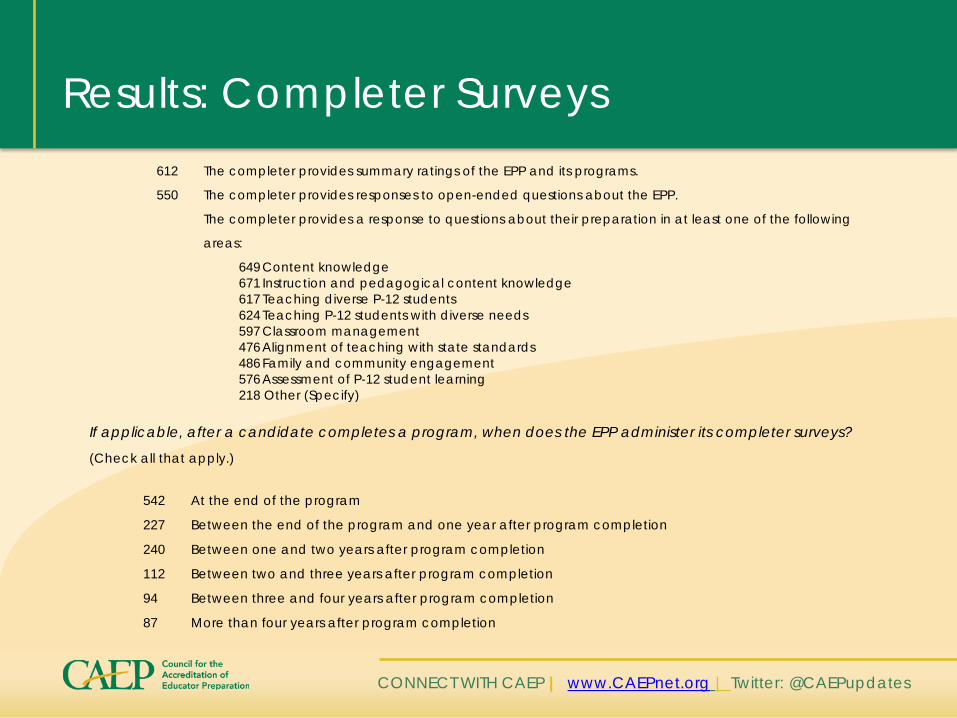
Results: Completer Surveys 612 The completer provides summary ratings of the EPP and its programs.
550 The completer provides responses to open-ended questions about the EPP.
The completer provides a response to questions about their preparation in at least one of the following
areas:
649 Content knowledge 671 Instruction and pedagogical content knowledge 617 Teaching diverse P-12 students 624 Teaching P-12 students with diverse needs 597 Classroom management 476 Alignment of teaching with state standards 486 Family and community engagement 576 Assessment of P-12 student learning 218 Other (Specify)
If applicable, after a candidate completes a program, when does the EPP administer its completer surveys?
(Check all that apply.)
542 At the end of the program
227 Between the end of the program and one year after program completion
240 Between one and two years after program completion
112 Between two and three years after program completion
94 Between three and four years after program completion
87 More than four years after program completion
CONNECT WITH CAEP | www.CAEPnet.org | Twitter: @CAEPupdates
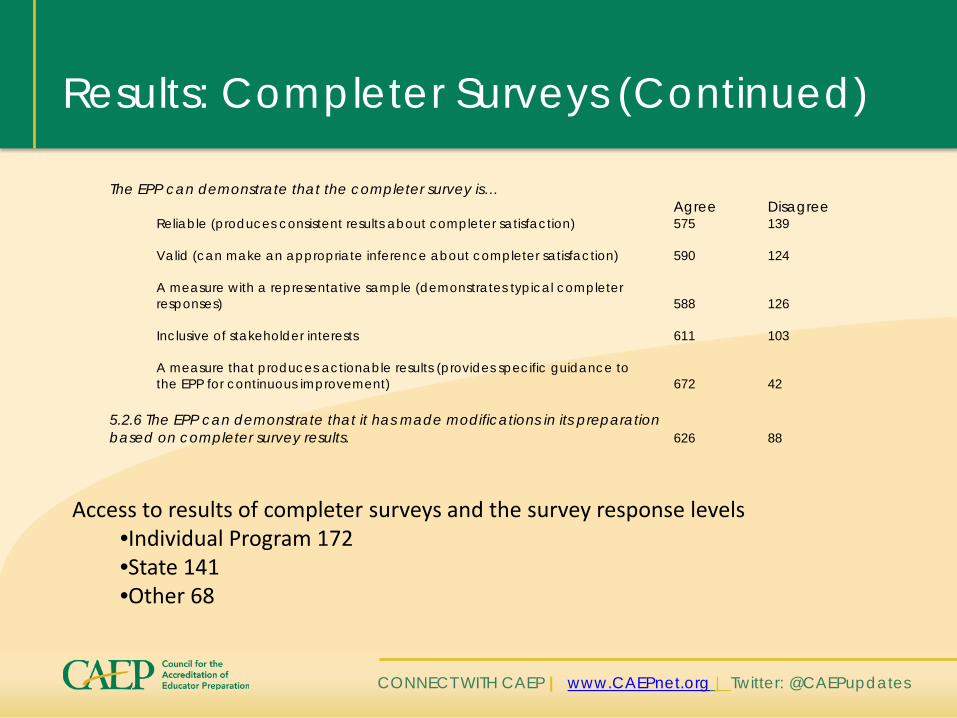
Results: Completer Surveys (Continued)
The EPP can demonstrate that the completer survey is… Agree Disagree Reliable (produces consistent results about completer satisfaction) 575 139 Valid (can make an appropriate inference about completer satisfaction) 590 124 A measure with a representative sample (demonstrates typical completer responses) 588 126
Inclusive of stakeholder interests 611 103 A measure that produces actionable results (provides specific guidance to the EPP for continuous improvement) 672 42
5.2.6 The EPP can demonstrate that it has made modifications in its preparation based on completer survey results. 626 88
Access to results of completer surveys and the survey response levels •Individual Program 172 •State 141 •Other 68
CONNECT WITH CAEP | www.CAEPnet.org | Twitter: @CAEPupdates
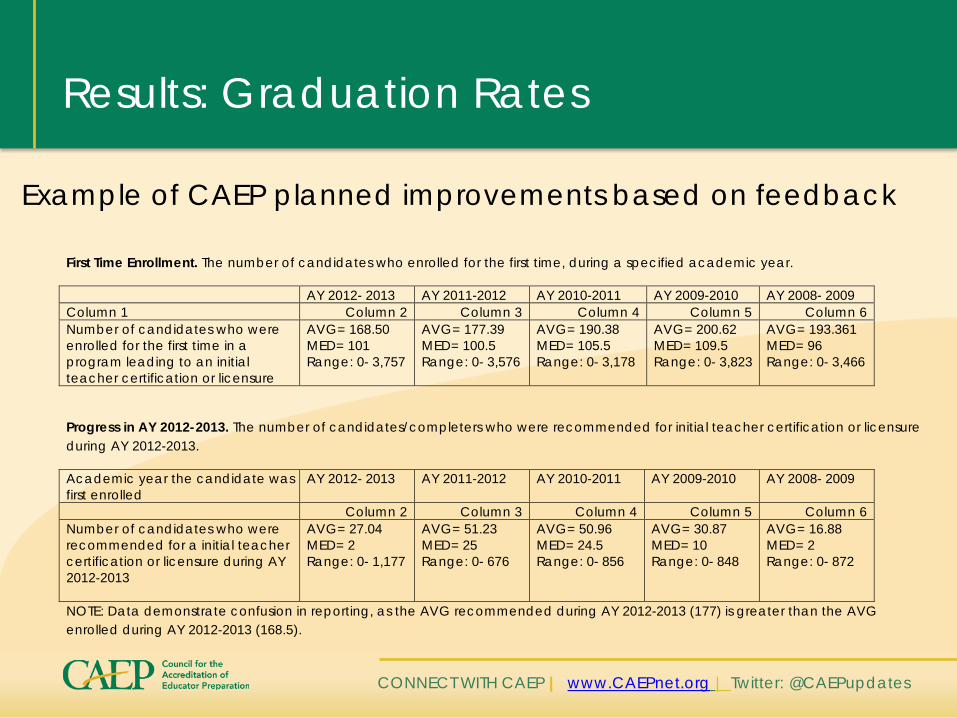
Results: Graduation Rates
Example of CAEP planned improvements based on feedback
First Time Enrollment. The number of candidates who enrolled for the first time, during a specified academic year.
AY 2012- 2013 AY 2011-2012 AY 2010-2011 AY 2009-2010 AY 2008- 2009 Column 1 Column 2 Column 3 Column 4 Column 5 Column 6 Number of candidates who were enrolled for the first time in a program leading to an initial teacher certification or licensure
AVG= 168.50 MED= 101 Range: 0- 3,757
AVG= 177.39 MED= 100.5 Range: 0- 3,576
AVG= 190.38 MED= 105.5 Range: 0- 3,178
AVG= 200.62 MED= 109.5 Range: 0- 3,823
AVG= 193.361 MED= 96 Range: 0- 3,466
Progress in AY 2012-2013. The number of candidates/completers who were recommended for initial teacher certification or licensure during AY 2012-2013.
Academic year the candidate was first enrolled
AY 2012- 2013 AY 2011-2012 AY 2010-2011 AY 2009-2010 AY 2008- 2009
Column 2 Column 3 Column 4 Column 5 Column 6 Number of candidates who were recommended for a initial teacher certification or licensure during AY 2012-2013
AVG= 27.04 MED= 2 Range: 0- 1,177
AVG= 51.23 MED= 25 Range: 0- 676
AVG= 50.96 MED= 24.5 Range: 0- 856
AVG= 30.87 MED= 10 Range: 0- 848
AVG= 16.88 MED= 2 Range: 0- 872
NOTE: Data demonstrate confusion in reporting, as the AVG recommended during AY 2012-2013 (177) is greater than the AVG enrolled during AY 2012-2013 (168.5).
CONNECT WITH CAEP | www.CAEPnet.org | Twitter: @CAEPupdates
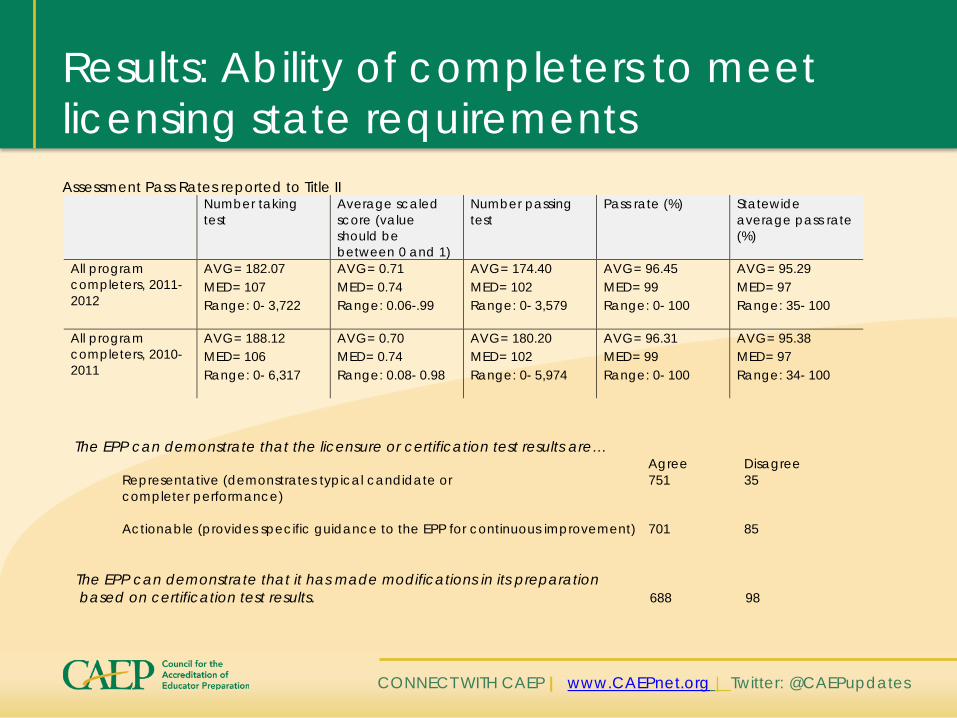
Results: Ability of completers to meet licensing state requirements Assessment Pass Rates reported to Title II
Number taking test
Average scaled score (value should be between 0 and 1)
Number passing test
Pass rate (%) Statewide average pass rate (%)
All program completers, 2011-2012
AVG= 182.07 MED= 107 Range: 0- 3,722
AVG= 0.71 MED= 0.74 Range: 0.06-.99
AVG= 174.40 MED= 102 Range: 0- 3,579
AVG= 96.45 MED= 99 Range: 0- 100
AVG= 95.29 MED= 97 Range: 35- 100
All program completers, 2010-2011
AVG= 188.12 MED= 106 Range: 0- 6,317
AVG= 0.70 MED= 0.74 Range: 0.08- 0.98
AVG= 180.20 MED= 102 Range: 0- 5,974
AVG= 96.31 MED= 99 Range: 0- 100
AVG= 95.38 MED= 97 Range: 34- 100
The EPP can demonstrate that the licensure or certification test results are… Agree Disagree
Representative (demonstrates typical candidate or 751 35 completer performance) Actionable (provides specific guidance to the EPP for continuous improvement) 701 85
The EPP can demonstrate that it has made modifications in its preparation based on certification test results. 688 98

CONNECT WITH CAEP | www.CAEPnet.org | Twitter: @CAEPupdates
Results: Indicators of teaching effectiveness
Assessments
Data are available
Data are not available The EPP has a plan to collect data in the next two years.
The EPP does not currently have a plan to collect data within the next two years.
Column 1 Column 2 Column 3 Column 4 Completer performance during in-service Surveys of P-12 students on completer performance 45 104 491 School district-level teacher evaluation 108 117 412 Employer observations 71 93 473 Employer surveys 369 159 116 EPP-designed case study 31 97 499 Other (specify) 81 43 219
CONNECT WITH CAEP | www.CAEPnet.org | Twitter: @CAEPupdates
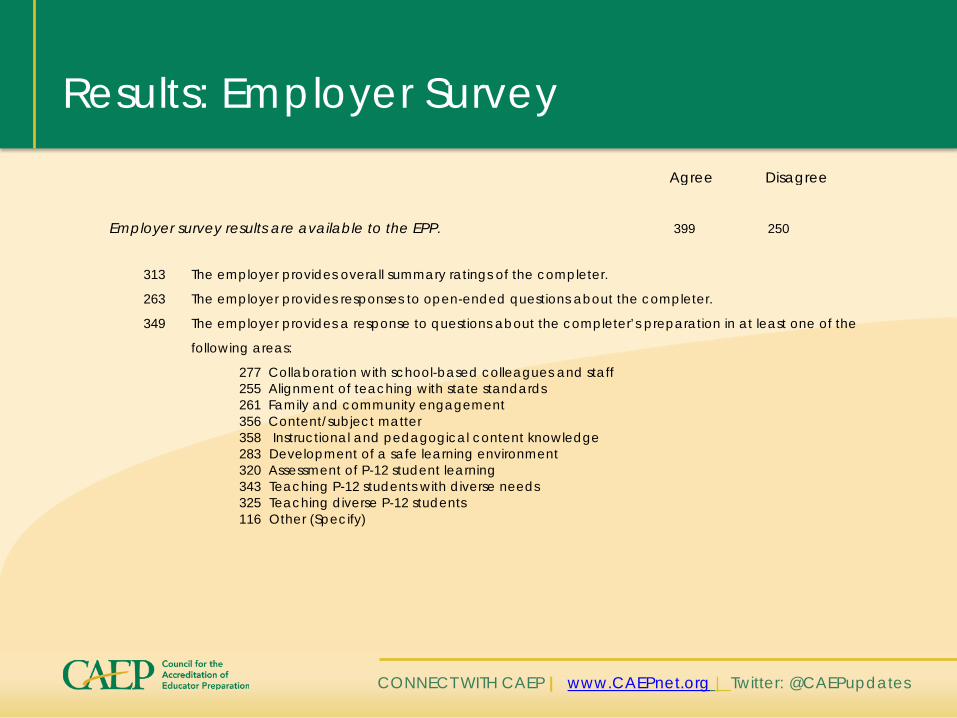
Results: Employer Survey
Employer survey results are available to the EPP. 399 250
Agree Disagree
313 The employer provides overall summary ratings of the completer.
263 The employer provides responses to open-ended questions about the completer.
349 The employer provides a response to questions about the completer’s preparation in at least one of the
following areas:
277 Collaboration with school-based colleagues and staff 255 Alignment of teaching with state standards 261 Family and community engagement 356 Content/subject matter 358 Instructional and pedagogical content knowledge 283 Development of a safe learning environment 320 Assessment of P-12 student learning 343 Teaching P-12 students with diverse needs 325 Teaching diverse P-12 students 116 Other (Specify)
CONNECT WITH CAEP | www.CAEPnet.org | Twitter: @CAEPupdates
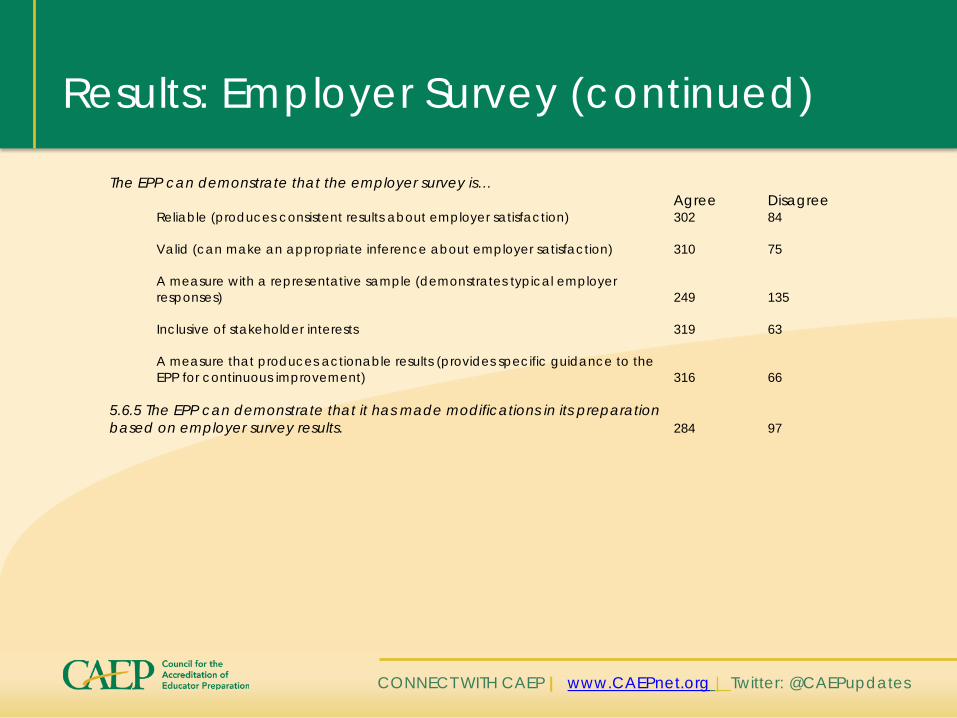
Results: Employer Survey (continued)
The EPP can demonstrate that the employer survey is… Agree Disagree Reliable (produces consistent results about employer satisfaction) 302 84 Valid (can make an appropriate inference about employer satisfaction) 310 75 A measure with a representative sample (demonstrates typical employer responses) 249 135
Inclusive of stakeholder interests 319 63 A measure that produces actionable results (provides specific guidance to the EPP for continuous improvement) 316 66
5.6.5 The EPP can demonstrate that it has made modifications in its preparation based on employer survey results. 284 97
CONNECT WITH CAEP | www.CAEPnet.org | Twitter: @CAEPupdates
Feedback Survey
• Survey sent to EPPs that submitted on-time reports • 290 (32%) report preparers returned the survey • Open for a two-week period (June 25 - July 11)
Thank you for your feedback!
CONNECT WITH CAEP | www.CAEPnet.org | Twitter: @CAEPupdates
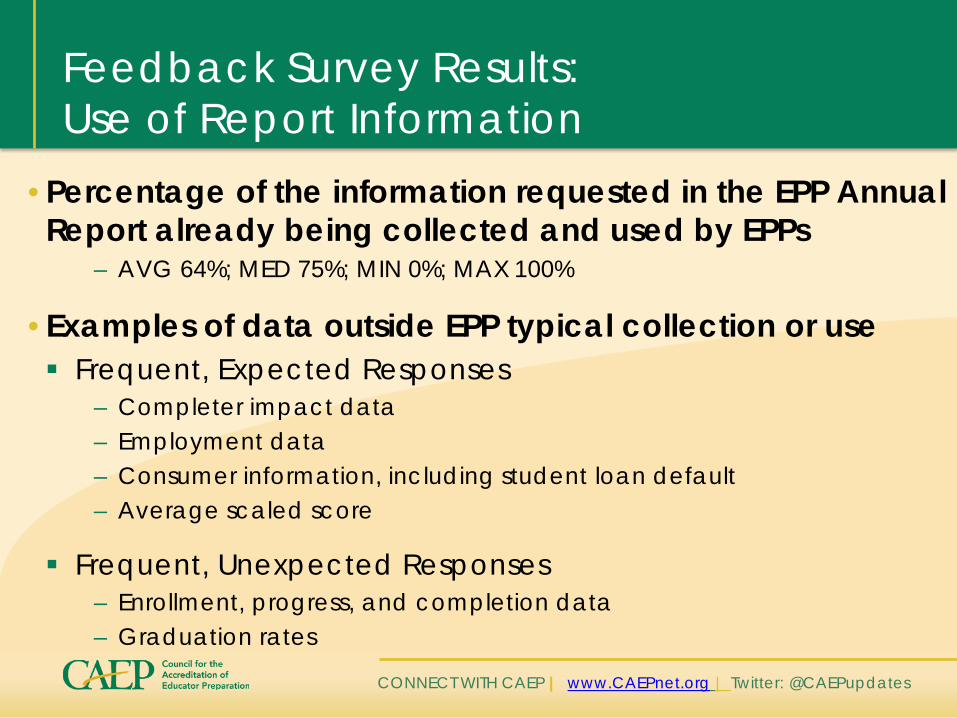
Feedback Survey Results: Use of Report Information
• Percentage of the information requested in the EPP Annual Report already being collected and used by EPPs
– AVG 64%; MED 75%; MIN 0%; MAX 100%
• Examples of data outside EPP typical collection or use Frequent, Expected Responses
– Completer impact data – Employment data – Consumer information, including student loan default – Average scaled score
Frequent, Unexpected Responses – Enrollment, progress, and completion data – Graduation rates
CONNECT WITH CAEP | www.CAEPnet.org | Twitter: @CAEPupdates
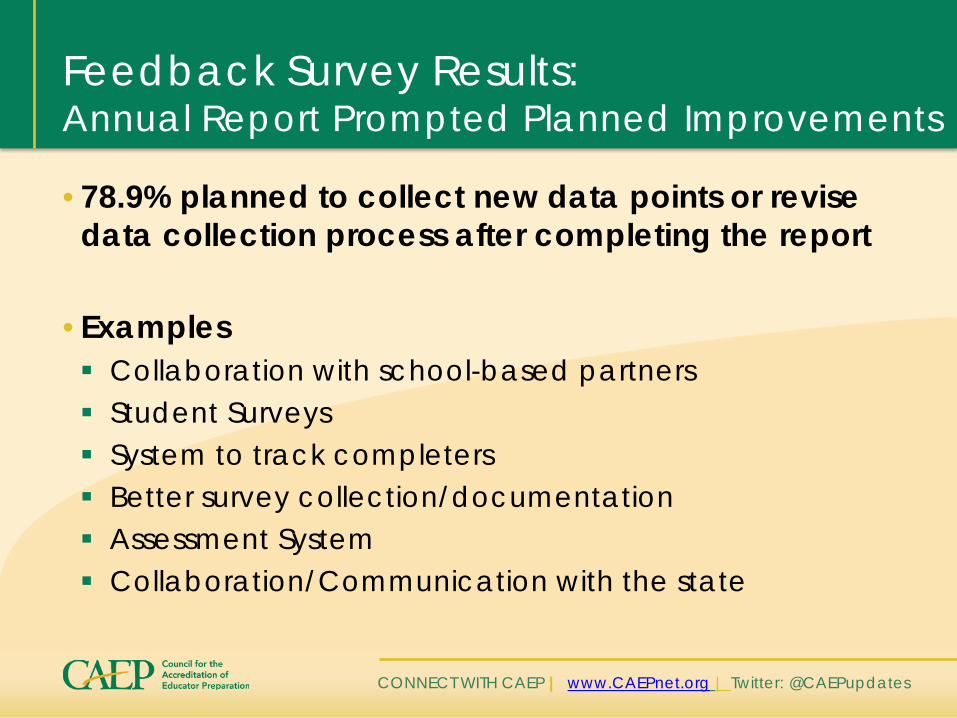
Feedback Survey Results: Annual Report Prompted Planned Improvements
• 78.9% planned to collect new data points or revise data collection process after completing the report
• Examples Collaboration with school-based partners Student Surveys System to track completers Better survey collection/documentation Assessment System Collaboration/Communication with the state
CONNECT WITH CAEP | www.CAEPnet.org | Twitter: @CAEPupdates
Feedback Survey Results: Use by CAEP for Continuous Improvement
• How confident are you that you responded correctly to this section?
• Is there anything CAEP should keep in mind when interpreting data from this section?
• How can CAEP improve this section for next year?
• What are examples of data that you collect and/or use that were not requested in the EPP Annual Report?
CONNECT WITH CAEP | www.CAEPnet.org | Twitter: @CAEPupdates
2015 EPP Annual Report
When launched in 2015, access the template in AIMS at
http://aims.caepnet.org
For questions:
CONNECT WITH CAEP | www.CAEPnet.org | Twitter: @CAEPupdates
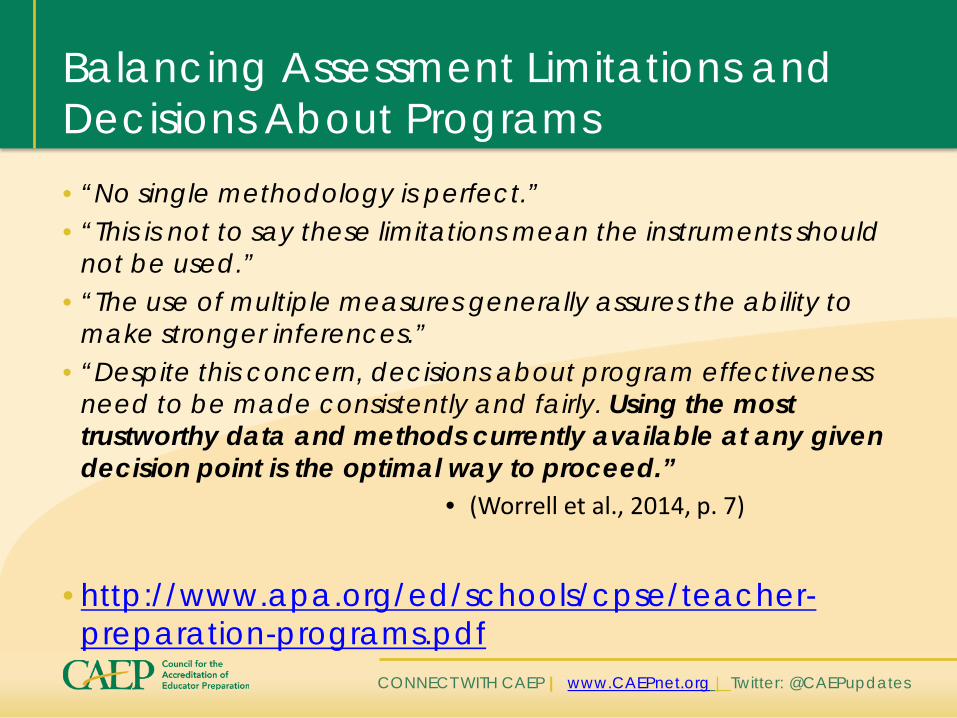
Balancing Assessment Limitations and Decisions About Programs • “No single methodology is perfect.” • “This is not to say these limitations mean the instruments should
not be used.” • “The use of multiple measures generally assures the ability to
make stronger inferences.” • “Despite this concern, decisions about program effectiveness
need to be made consistently and fairly. Using the most trustworthy data and methods currently available at any given decision point is the optimal way to proceed.”
• (Worrell et al., 2014, p. 7)
• http://www.apa.org/ed/schools/cpse/teacher-
preparation-programs.pdf
CONNECT WITH CAEP | www.CAEPnet.org | Twitter: @CAEPupdates
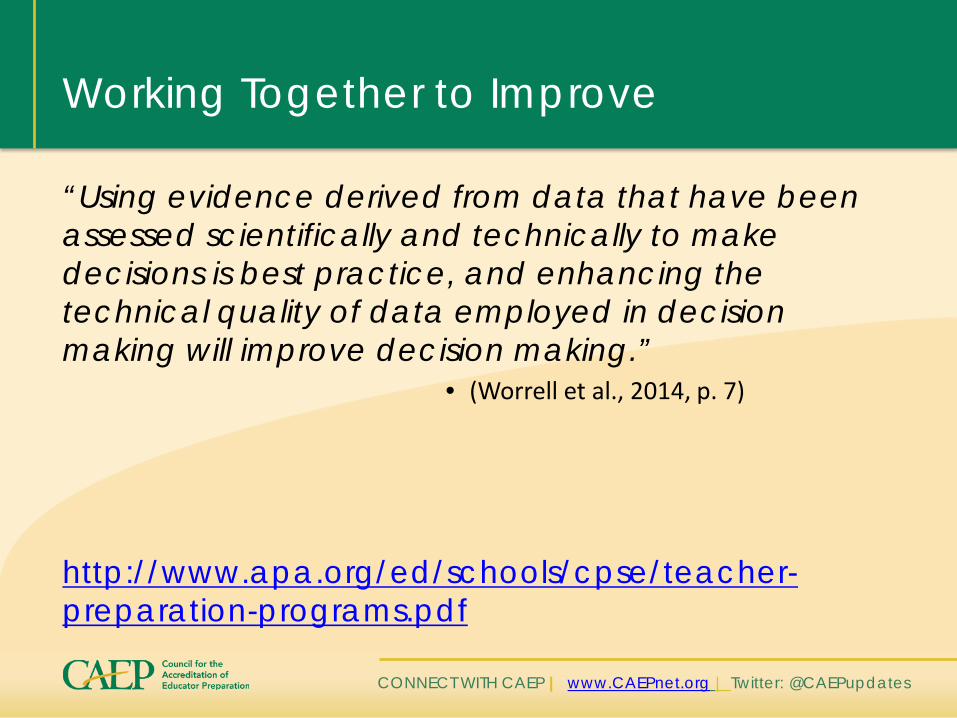
Working Together to Improve
“Using evidence derived from data that have been assessed scientifically and technically to make decisions is best practice, and enhancing the technical quality of data employed in decision making will improve decision making.”
• (Worrell et al., 2014, p. 7)
http://www.apa.org/ed/schools/cpse/teacher-preparation-programs.pdf
CONNECT WITH CAEP | www.CAEPnet.org | Twitter: @CAEPupdates
Upcoming
• Over the next few years, CAEP will review the data EPPs are able to collect both on their own and through their state data systems, and will create norms and benchmarks with designations of particular performance levels or changes as flags for a closer look. Information from these reports on accredited providers will be presented in aggregated form in recurring CAEP publications.
CONNECT WITH CAEP | www.CAEPnet.org | Twitter: @CAEPupdates
Moving Forward
User Friendly Measures= Better and Stronger
• Emphasis on utility for provider moving providers forward use for research and improvement moving the field forward
CONNECT WITH CAEP | www.CAEPnet.org | Twitter: @CAEPupdates
Questions?
• Jennifer E. Carinci
Director of Research, Innovation, and Data Strategy [email protected]
• Richard Rice Accreditation Associate [email protected]