Embed Size (px)
Citation preview

Rapid survey for tigers and other large mammals SM Bentayan and SM Dangku, South Sumatra
May 2007
By T. Maddox, D. Priatna, J. Smith, E. Gemita & A. Salampessy
ZSL Wildlife Survey Report

2
3
Contents Acknowledgements.................................................................................................................................5 Executive summary.................................................................................................................................6 Ringkasan eksekutif................................................................................................................................7 Aims and objectives................................................................................................................................8
Aim.....................................................................................................................................................8 Objectives...........................................................................................................................................8
Location.................................................................................................................................................9 Methods...............................................................................................................................................11
Survey framework .............................................................................................................................11 Survey training..................................................................................................................................12 Pre-surveys.......................................................................................................................................12 Analytical framework..........................................................................................................................12 Sampling protocol..............................................................................................................................13 Foot transects...................................................................................................................................13 Camera trapping................................................................................................................................14 Interviews.........................................................................................................................................15 Survey effort .....................................................................................................................................15
Results.................................................................................................................................................16 Species richness...............................................................................................................................16 Species composition..........................................................................................................................16 Occupancy estimates........................................................................................................................21
Detection probability.......................................................................................................................21 Probability of occurrence ................................................................................................................23
Relative abundance...........................................................................................................................25 Distribution........................................................................................................................................30
Habitat variability............................................................................................................................30 Spatial distribution..........................................................................................................................31
The Tiger Population .........................................................................................................................37 Tiger abundance............................................................................................................................37 Threats..........................................................................................................................................37 Human conflict...............................................................................................................................37
Questionnaire survey.........................................................................................................................39 Background ...................................................................................................................................39 Attitudes towards wildlife.................................................................................................................40 Attitudes towards conservation and the environment ........................................................................42
Recommendations................................................................................................................................43 A framework for conservation.............................................................................................................43
The importance of a general framework...........................................................................................43 The importance of a landscape perspective .....................................................................................43 The importance of a holistic approach .............................................................................................43 Information-based action ................................................................................................................44 Stakeholder-based action ...............................................................................................................45 Protection-based action..................................................................................................................48
Required capacity for implementation .................................................................................................49 Field capacity.................................................................................................................................49 Survey equipment..........................................................................................................................49 Technical training...........................................................................................................................49 Mapping ........................................................................................................................................49 Law enforcement ...........................................................................................................................49
Priority actions..................................................................................................................................50 Information-based actions...............................................................................................................50 Stakeholder influence–based actions...............................................................................................50 Protection–based actions................................................................................................................51

4
Rekomendasi yang diprioritaskan .......................................................................................................52 Kegiatan yang didasarkan pada informasi........................................................................................52 Kegiatan yang didasarkan pada kerja sama dengan masyarakat.......................................................52 Kegiatan yang didasarkan pada perlindungan..................................................................................53
Appendices..........................................................................................................................................54 Measuring habitat structure................................................................................................................54 Calculating adjusted species richness.................................................................................................55 Species lists......................................................................................................................................56 Questionnaire....................................................................................................................................58
5
Acknowledgements • This study was commissioned and hosted by BKSDA South Sumatra (SUMSEL)
• The study was generously funded by Conoco Phillips, with additional assi stance provided by
individual Environmental and GIS staff and the field staff at the Bentayan and Rebonjiro fields.
• Permission for expatriate Zoological Society of London (ZSL) staff to carry out research in Indonesia is provided by LIPI
• Funding for ZSL in Indonesia is provided by 21st Century Tiger
• Fieldwork was carried out by members of:
o BKSDA Jambi o ZSL o Indonesian biology graduate volunteers
• With additional assistance from
o Wildlife Conservation Society Indonesia Programme (WCS-IP)
• The cooperation of the people living around Bentayan and Dangku is gratefully acknowledged.
6
Executive summary SM Bentayan and SM Dangku are two Suaka Margasatwa nature reserves in South Sumatra, Indonesia, administered by the BKSDA South Sumatra. In 2006 Conoco Phillips agreed to fund a rapid survey of each site to determine whether tigers sti ll l ived in the area. The Zoological Society of London (ZSL) was subcontracted to lead the survey, with fieldwork conducted by members of the BKSDA, ZSL and volunteer parties. The surveys were conducted in March/April 2006 (Bentayan) and August/September 2006 (Dangku), with funding provided to operate for twenty days in each site. Although tigers were the focal subject, surveys were conducted to record all medium to large terrestrial mammals and threats. Each survey was conducted using three survey methods. Foot transects were walked in a sample of 29 4km2 cells in Bentayan and 28 4km2 cells in Dangku to measure species diversity, detection probabilities and thus occupancy values for key species, and to measure relative abundance through encounter rates. Camera traps were then set up in the same sampling framework, providing supplementary data on species diversity and relative abundance. 128 questionnaire surveys were conducted simultaneously with the wildlife surveys with respondents l iving inside the two reserves. Bentayan and Dangku both retain an important role in species conservation. Of the two, Dangku has the highest conservation value, containing several critically endangered Sumatran tigers as well as several other species of high conservation importance including clouded leopard, marbled cat, sun bear and tapir. Dangku also shows the lower level of threat from human activity, with about one third to a half of the park consisting of reasonable wildlife habitat. However, Dangku also recorded the higher rates of threat encounters, with the largest concentrations on the four edges of the remaining forest block. On the northern and southern borders, there has been large scale clearing for oil palm. However, within the interior (and where the wildlife was at the highest concentrations) there were particularly high levels of ‘pioneer’ threats. Hunting, including tiger traps, was prevalent with no attempts made to hide these activities. Many small patches within the forest were being cleared ready for burning when sufficiently dry. If not checked, these pioneer activities will rapidly lead to large scale clearing and permanent settlement. Bentayan contains very little good wildlife habitat following the fires of 1997 and the resulting influx of people. However, it does contain endangered Asian elephants which occupy a small area to the north of the reserve and probably range to the north east of the reserve. Tapir and sun bear are also present in the same areas. Much of Bentayan is already cleared and, in many cases, planted and settled, making solutions much harder to find. Threats were more or less constantly high throughout the reserve except for the small area where wildlife concentrations were highest. Bentayan may well represent what Dangku will look like in a few short years. Potential for human-wildlife conflict is high in both reserves, with much evidence of crop raiding and even damage to buildings by elephants in Bentayan and two human deaths in Dangku shortly after the survey. Encounters with people and wildlife were frequently at the same points in both reserves, both on camera trap films and on foot transects. The people living in both reserves tend to be newcomers to the area. Most are aware they live in protected areas, colonising only after they perceived the reserves to have lost their value (particularly Bentayan). Attitudes towards wildlife show little aesthetic or moral value attached – most are classed as pests, dangerous or unknown, although understanding of the laws that protect them appears to be widespread. Attitudes towards the forest vary depending on whether describing personal perceptions or ‘official’ functions. On a personal level most people see the forests as a site for opening new land and planting crops. On an official level, most understand the function of forests to be for conservation. There is l ittle feeling of personal responsibility for conservation, with most seeing it as the role of the government, or unknown parties. The key recommendations following the report are to take swift action in both reserves to counter the various threats recorded. In Dangku, pioneer threats can sti ll be prevented from leading to permanent settlements. In Bentayan, the remaining habitat used by all wildlife needs to be secured as soon as possible. Action should be conducted within a larger framework, both looking at conservation in the landscape as a whole (neither Bentayan nor Dangku is large enough to support sustainable large mammal populations on their own) and conducting a range of activities to support protection measures, including setting up monitoring programmes and working with landscape stakeholders.
7
Ringkasan eksekutif SM. Bentay an dan SM. Dangku merupakan dua suaka margasatwa di Sumatera Selatan, Indonesia, yang dlkelola oleh Balai Konserv asi Sumber Daya Alam (BKSDA) Sumatera Selatan. Pada tahun 2006, Conoco Phillips sepakat untuk membiay ai suatu survey cepat, untuk menetukan apakah harimau Sumatera masih ada di kedua suaka margasatwa tersebut. Zoological Society of London (ZSL) telah dipercaya untuk memimpin survey, selanjutnya kegiatan lapangan dilaksanakan oleh staf-staf dari BKSDA Sumsel dan ZSL, serta beberapa sukarelawan. Surv ey telah dilaksanakan dalam bulan Maret/April 2006 (Bentay an) dan Agustus/September 2006 (Dangku), dengan dana y ang tersedia untuk pelaksanaan survey selama 20 hari di masing-masing kawasan. Meskipun harimau merupakan subjek utama, survey dilakukan untuk mencatat semua mammalia berukuran sedang sampai besar serta ancaman-ancamanny a. Setiap survey dilakukan dengan mrnggunakan tiga cara. Suatu transek jalan kaki telah dijalankan dalam satu sampel sel-sel y ang luas totalnya 29 4km2 di Bentayan dan 28 4km2 di Dangku untuk mengukur kelimpahan spesies, probabilitas pendeteksian dan kemudian nilai-nilai okupansi untuk spesies-spesies kunci, serta untuk mengukur kelimpahan relatif spesies melalui laju perjumpaan. Kemudian perangkat kamera trap dipasang di dalam kerangka sampling y ang sama, y ang dapat meny ediakan data tambahan dalam keragaman spesies serta kelimpahan relatif. Selain itu, 128 kuisioner juga dilakukan secara simultan dengan surv ey satwa liar dengan responden y ang tinggal di dalam kedua suaka margasatwa tersebut. Bentay an dan Dangku keduany a memiliki peran y ang penting dalam konservasi spesies. Dari keduanya, Dangku memiliki nilai konserv asi y ang paling tinggi, mengandung beberapa ekor harimau Sumatra yang statusny a kritis juga beberapa spesies yang lain y ang memiliki kepentingan konservasi tinggi termasuk macan dahan, kucing batu, beruang madu dan tapir. Dangku juga menunjukkan tingkat ancaman dari kegiatan manusia y ang lebih rendah, dengan sepertiga sampai setengah dari luas kawasan terdiri dari habitat satwa liar y ang lay ak. Namun, Dangku juga mencatat laju perjumpaan ancaman y ang lebih tinggi, dengan konsentrasi tetinggi pada keempat sisi dari blok hutan y ang masih tersisa. Pada batas-batas di sebelah utara dan selatan, pembukaan lahan berskala besar untuk perkebunan sawit sudah jelas. Tetapi, pada bagian dalam (dan dimana satwaliar pada konsentrasi y ang paling tinggi) dimana disana terdapat terutama ancaman-ancaman pionir pada tingkat y ang tinggi. Perburuan liar, termasuk jerat harimau telah umum dan dengan terang-terangan. Bany ak bagian-bagian kecil di dalam hutan sedang dibuka dan siap untuk dibakar saat musim kering. Jika tidak dipantau, aktif itas-aktifitas pionir ini akan dengan cepat mengarah pada pembukaan lahan berskala besar dan pemukiman permanen. Bentay an mengandung sangat sedikit habitat satwa liar y ang baik setelah kebakaran hutan tahun 1997 y ang lalu. Namun demikian, kawasan ini mengandung gajah Asia yang menempati suatu areal yang kecil di utara suaka margasatwa dan kemungkinan daerah jelajahnya ke timur laut dari suaka margasatwa. Tapir dan beruang madu juga terdapat pada areal yang sama. Bany ak areal di dalam Bentayan sudah dibuka dan, pada banyak kasus, telah ditanami dan dihuni, membuat solusiny a semakin sulit ditemukan. Ancaman-ancaman lebih kurang tetap tinggi di seluruh kawasan kecuali pada suatu kawasan kecil dimana konsentrasi satwaliar paling tinggi. Bentay an mungkin merupakan representasi y ang baik pada Dangku seperti apa pada beberapa tahun mendatang. Potensi konf lik antara manusia dengan satwa liar tinggi di kedua kawasan, dengan bany ak bukti kerusakan tanaman pertanian dan bahkan kerusakan rumah oleh gajah di Bentay an dan dua kematian manusia diterkam harimau di Dangku segera setelah survey dilakukan. Perjumpaan dengan manusia dan satwa liar acapkali terjadi di lokasi yang sama, baik melalui kamera trap atau transek jalan kaki. Masy arakat y ang tinggal di kedua suaka margasatwa cenderung sebagai pendatang baru di kawasan tersebut. Kebany akan dari mereka sadar bahwa mereka tinggal di dalam kawasan lindung, mengkoloni hany a setelah percay a bahwa kawasan suaka margasatwa kehilangan nilainy a (terutama Bentay an). Mereka tidak menunjukkan apresiasi terhadap keindahan satwa liar, terlebih terhadap nilai moralnya. Kebanyakan satwa liar digolongkan sebagai hama, berbahay a atau sesuatu y ang tidak mereka ketahui, meskipun pemahaman tentang hukum-hukum yang melindungi satwa liar tersebut kelihatannya telah disebarluaskan. Sikap terhadap hutan berv ariasi tergantung pada persepsi perorangan atau f ungsi kedinasan. Pada tingkat perseorangan, umumnya masyarakt memandang hutan sebagai tempat untuk membuka lahan baru dan menanam tanaman pertanian. Pada tingkat kedinasan, umumny a masyarakat faham akan f ungsi hutan untuk konserv asi. Terdapat perasaan y ang rendah akan tanggung jawab perorangan untuk konserv asi, dengan kebanyakan dari mereka memandangnya sebagai peran pemerintah atau pihak-pihak yang tidak diketahui. Rekomendasi-rekomendasi utama yang terlampir sesudah laporan ini adalah untuk mengambil aksi yang cepat di kedua kawasan suaka margasatwa untuk mengimbangi berbagai ancaman yang telah dicatat. Di Dangku, ancaman pionir masih dapat dicegah dari mengarah ke pemukiman permanen. Di Bentay an, habitat y ang tersisa y ang digunakan oleh satwa liar perlu untuk diamankan secepat mungkin. Aksi harus dilakukan dalam kerangka y ang lebih besar, dengan melihat konservasi pada bentang alam secara keseluruhan (baik Bentay an atau Dangku tidak cukup besar untuk mendunkung populasi mammalia besar secara berkelanjutan dengan sendirinya) dan melakukan aktifitas-aktif itas untuk mendukung pengukuran perlindungan, termasuk merancang program-program pemantauan dan bekerjasama dengan para pihak yang ada pada bentang alam.
8
Aims and objectives
Aim The aim of the survey was to identify whether tigers were sti ll living in two protected areas and to provide recommendations on their conservation.
Objectives
• To determine species richness in each site
• To identify other large mammals of conservation importance present in the study area
• To identify the key threats to conservation in each area
• To identify the spatial extent and relative abundance of species living in each site
• To collect as much information as possible on any tigers detected in either site
• To investigate the role of local communities in conservation within each site
• To make recommendations on how conservation can be improved
9
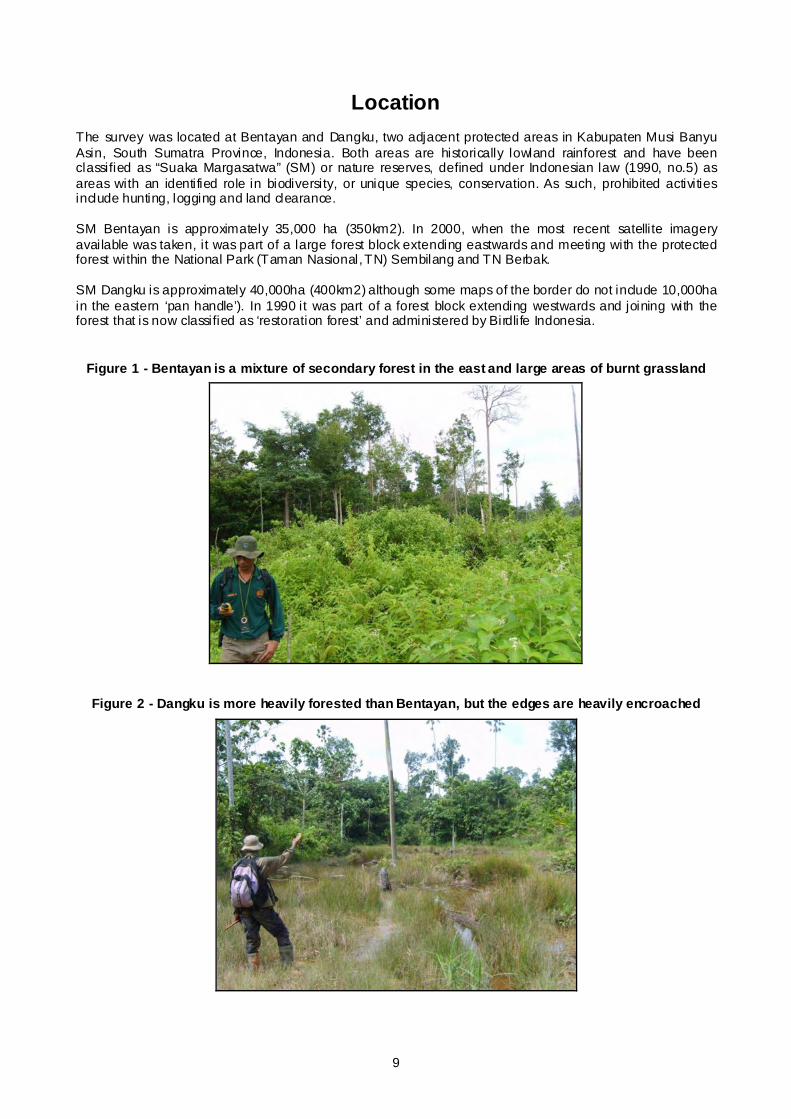
Location The survey was located at Bentayan and Dangku, two adjacent protected areas in Kabupaten Musi Banyu Asin, South Sumatra Province, Indonesia. Both areas are historically lowland rainforest and have been classified as “Suaka Margasatwa” (SM) or nature reserves, defined under Indonesian law (1990, no.5) as areas with an identified role in biodiversity, or unique species, conservation. As such, prohibited activities include hunting, logging and land clearance. SM Bentayan is approximately 35,000 ha (350km2). In 2000, when the most recent satellite imagery available was taken, it was part of a large forest block extending eastwards and meeting with the protected forest within the National Park (Taman Nasional, TN) Sembilang and TN Berbak. SM Dangku is approximately 40,000ha (400km2) although some maps of the border do not include 10,000ha in the eastern ‘pan handle’). In 1990 it was part of a forest block extending westwards and joining with the forest that is now classified as ‘restoration forest’ and administered by Birdlife Indonesia.
Figure 1 - Bentayan is a mixture of secondary forest in the east and large areas of burnt grassland
Figure 2 - Dangku is more heavily forested than Bentayan, but the edges are heavily encroached
10
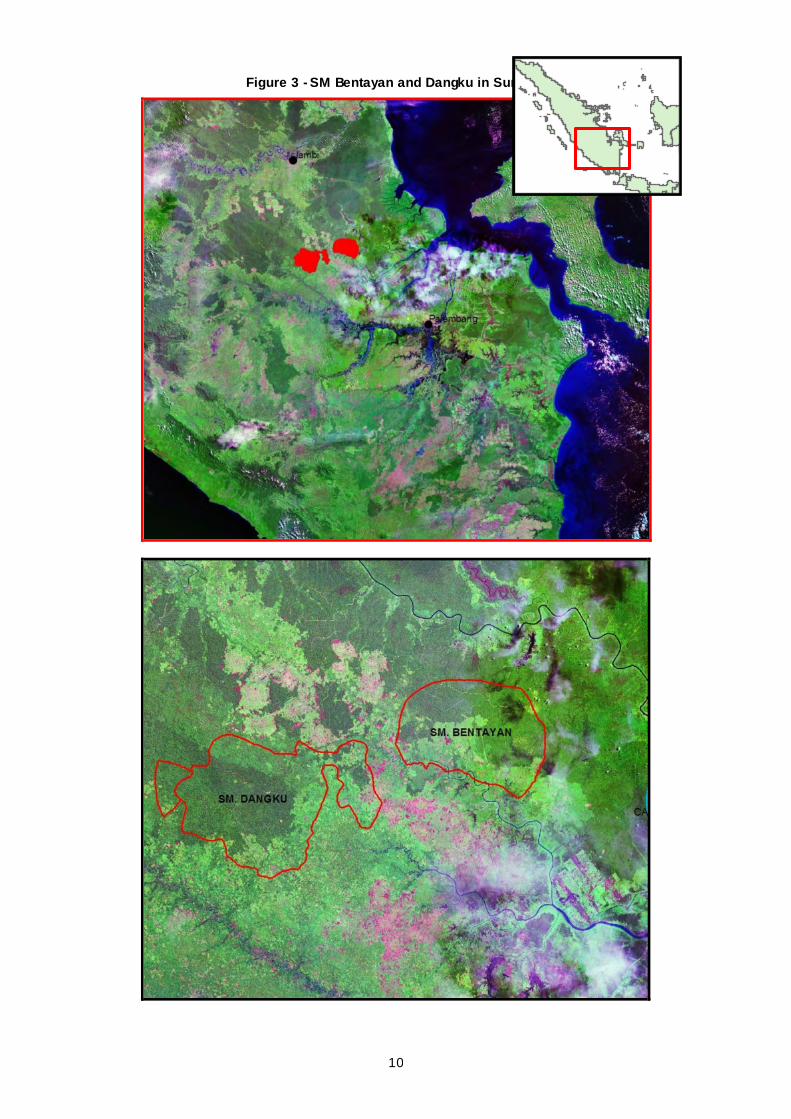
Figure 3 - SM Bentayan and Dangku in Sumatra
11
Methods
Survey framework The survey was meant to be a rapid snapshot of each reserve, primarily to establish if tigers were present or not. Each survey was allocated funds for 20 days for completion, with ten BKSDA scouts available at any one time. ZSL survey teams stayed in the field for the duration of the survey. BKSDA survey teams operated on a ten day rota.
• 23-26 November 2005 – Pre-survey, SM. Bentayan • 13-16 December 2005 – Pre-survey, SM. Dangku • 06 March 2006 – KSDA SUMSEL training • 07-28 March 2006 – Transect and interview survey, SM Bentayan south • 15-25 March 2006 – Camera trap survey SM. Bentayan south, transect and interview survey in SM
Bentayan north • 26 Mar-22 Apr 2006 – Camera trap survey in SM. Bentayan north • 15-16 August 2006 –KSDA SUMSEL training • 22-26 August 2006 – ZSL preparation, Dangku • 31 August - 20 September 2006 – Transect and interview survey, Dangku • 08 September -02 October 2006 – Camera trap survey, Dangku • November 2006 – April 2007 – Analysis
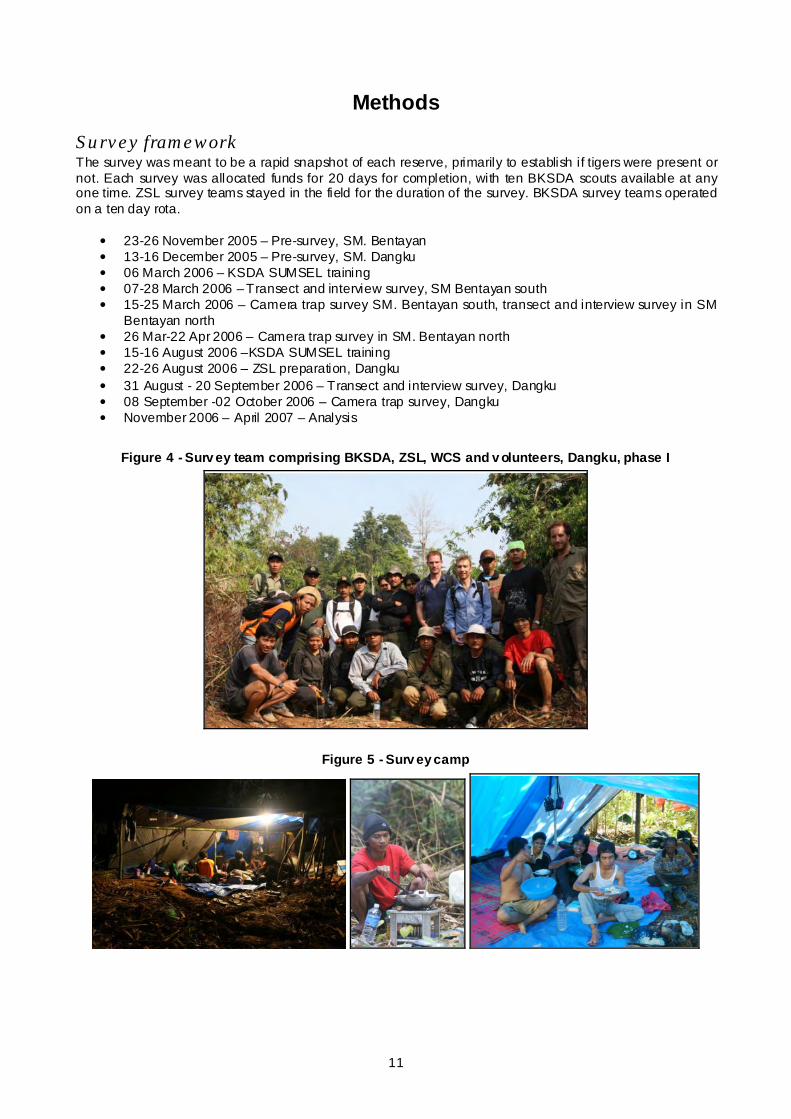
Figure 4 - Surv ey team comprising BKSDA, ZSL, WCS and v olunteers, Dangku, phase I
Figure 5 - Surv ey camp
12
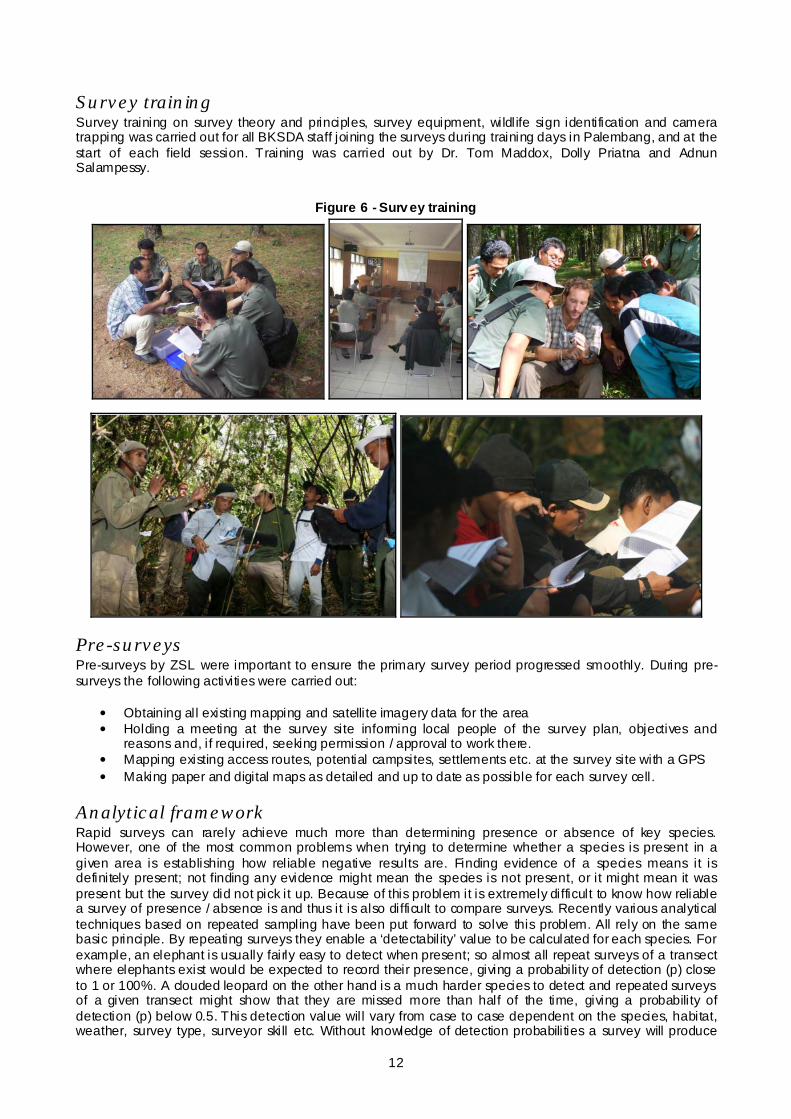
Survey training Survey training on survey theory and principles, survey equipment, wildlife sign identification and camera trapping was carried out for all BKSDA staff joining the surveys during training days in Palembang, and at the start of each field session. Training was carried out by Dr. Tom Maddox, Dolly Priatna and Adnun Salampessy.
Figure 6 - Surv ey training
Pre-surveys Pre-surveys by ZSL were important to ensure the primary survey period progressed smoothly. During pre-surveys the following activities were carried out:
• Obtaining all existing mapping and satellite imagery data for the area • Holding a meeting at the survey site informing local people of the survey plan, objectives and
reasons and, if required, seeking permission / approval to work there. • Mapping existing access routes, potential campsites, settlements etc. at the survey site with a GPS • Making paper and digital maps as detailed and up to date as possible for each survey cell.
Analytical framework Rapid surveys can rarely achieve much more than determining presence or absence of key species. However, one of the most common problems when trying to determine whether a species is present in a given area is establishing how reliable negative results are. Finding evidence of a species means it is definitely present; not finding any evidence might mean the species is not present, or it might mean it was present but the survey did not pick it up. Because of this problem it is extremely difficult to know how reliable a survey of presence / absence is and thus it is also difficult to compare surveys. Recently various analytical techniques based on repeated sampling have been put forward to solve this problem. All rely on the same basic principle. By repeating surveys they enable a ‘detectabil ity’ value to be calculated for each species. For example, an elephant is usually fairly easy to detect when present; so almost all repeat surveys of a transect where elephants exist would be expected to record their presence, giving a probability of detection (p) close to 1 or 100%. A clouded leopard on the other hand is a much harder species to detect and repeated surveys of a given transect might show that they are missed more than half of the time, giving a probability of detection (p) below 0.5. This detection value will vary from case to case dependent on the species, habitat, weather, survey type, surveyor skill etc. Without knowledge of detection probabilities a survey will produce
13
simple ‘naïve’ estimates of species occupancy. For example, if 30% of areas revealed presence of tigers, the naïve occupancy estimate for tigers is 0.3 but with no measure of how accurate this is. However, if repeats of surveys show that in fact tigers are only detected 70% of the time when they are present, the naïve occupancy estimate can be adjusted to give a final probability of occupancy (Psi) that accounts for tigers that probably were present but were missed together with confidence levels that show how accurate the estimate is. This not only improves the value of the estimates but also allows comparison with other surveys. Estimates can then be improved further by modelling the effect of various covariates, if data are sufficient. The number of samples and repeats required to get confident estimates is a matter of debate and varies by species, however, as a general rule of thumb, there should be over 60 samples and at least four replicates of each.
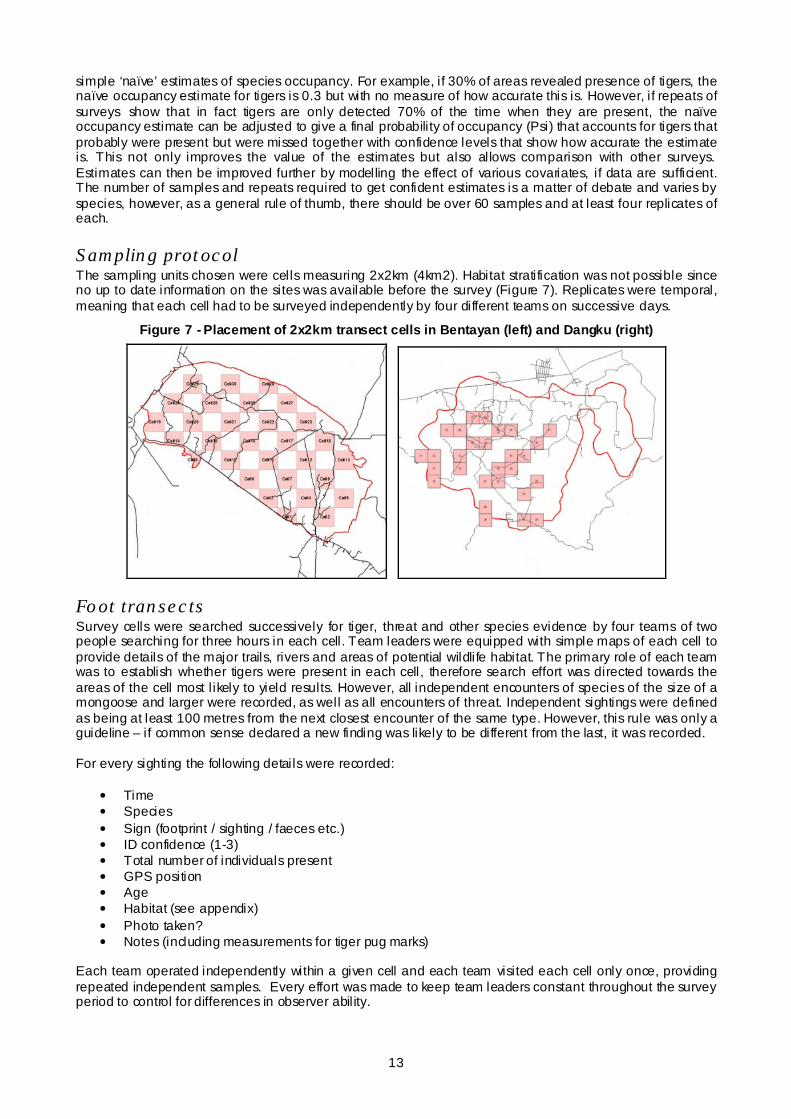
Sampling protocol The sampling units chosen were cells measuring 2x2km (4km2). Habitat stratification was not possible since no up to date information on the sites was available before the survey (Figure 7). Replicates were temporal, meaning that each cell had to be surveyed independently by four different teams on successive days.
Figure 7 - Placement of 2x2km transect cells in Bentayan (left) and Dangku (right)
Foot transects Survey cells were searched successively for tiger, threat and other species evidence by four teams of two people searching for three hours in each cell. Team leaders were equipped with simple maps of each cell to provide details of the major trails, rivers and areas of potential wildlife habitat. The primary role of each team was to establish whether tigers were present in each cell, therefore search effort was directed towards the areas of the cell most l ikely to yield results. However, all independent encounters of species of the size of a mongoose and larger were recorded, as well as all encounters of threat. Independent sightings were defined as being at least 100 metres from the next closest encounter of the same type. However, this rule was only a guideline – if common sense declared a new finding was likely to be different from the last, it was recorded. For every sighting the following details were recorded:
• Time • Species • Sign (footprint / sighting / faeces etc.) • ID confidence (1-3) • Total number of individuals present • GPS position • Age • Habitat (see appendix) • Photo taken? • Notes (including measurements for tiger pug marks)
Each team operated independently within a given cell and each team visited each cell only once, providing repeated independent samples. Every effort was made to keep team leaders constant throughout the survey period to control for differences in observer abil ity.
14
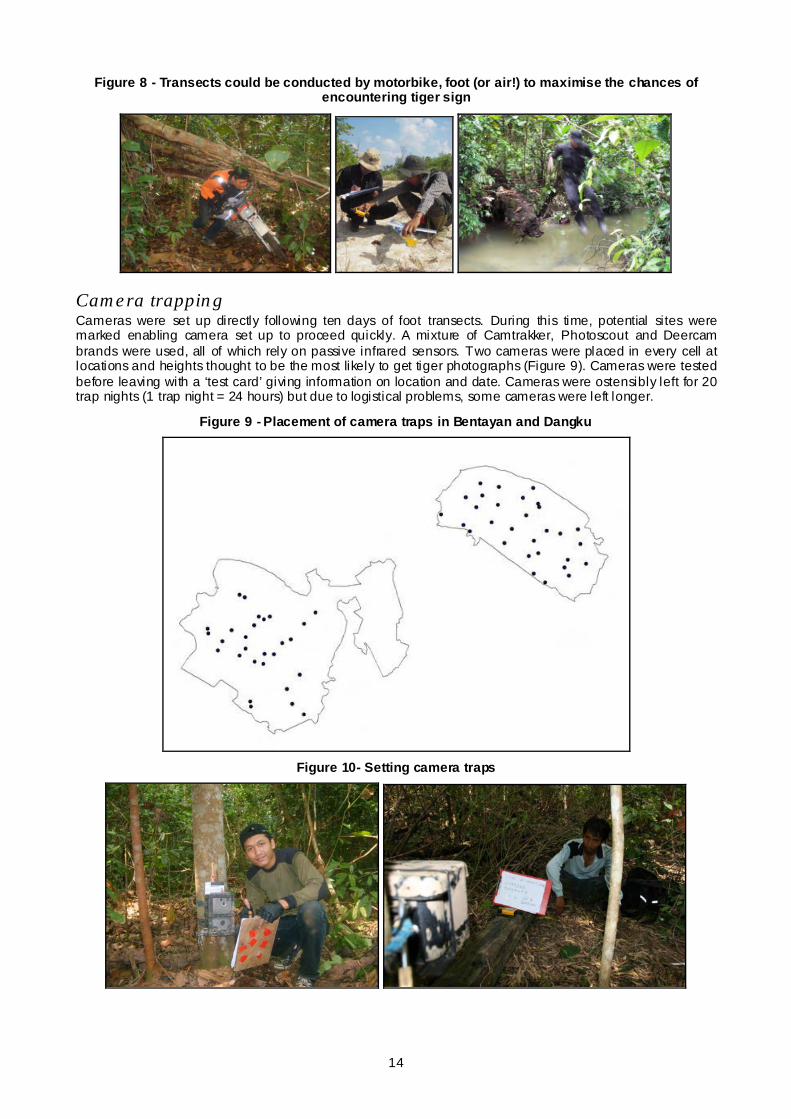
Figure 8 - Transects could be conducted by motorbike, foot (or air!) to maximise the chances of encountering tiger sign
Camera trapping Cameras were set up directly following ten days of foot transects. During this time, potential sites were marked enabling camera set up to proceed quickly. A mixture of Camtrakker, Photoscout and Deercam brands were used, all of which rely on passive infrared sensors. Two cameras were placed in every cell at locations and heights thought to be the most likely to get tiger photographs (Figure 9). Cameras were tested before leaving with a ‘test card’ giving information on location and date. Cameras were ostensibly left for 20 trap nights (1 trap night = 24 hours) but due to logistical problems, some cameras were left longer.
Figure 9 - Placement of camera traps in Bentayan and Dangku
Figure 10- Setting camera traps

15
Interviews Interviews were conducted by a separate team with anyone found inside the reserves. In general, household heads were targeted. Questions were asked to determine the respondent’s approximate wealth, attitudes towards conservation and wildlife and to the authorities that run it.
Figure 11 - Interviewing reserve residents
Survey effort In total, 1392 hours of search effort were conducted, resulting in 1660 encounters with wildlife, threats or signs, nearly 50% of which were wildlife tracks. 43 camera traps were also set up in 58 locations, resulting in 886 photographs, 526 of which were wildlife. The interview survey questioned 128 respondents.
16
Results
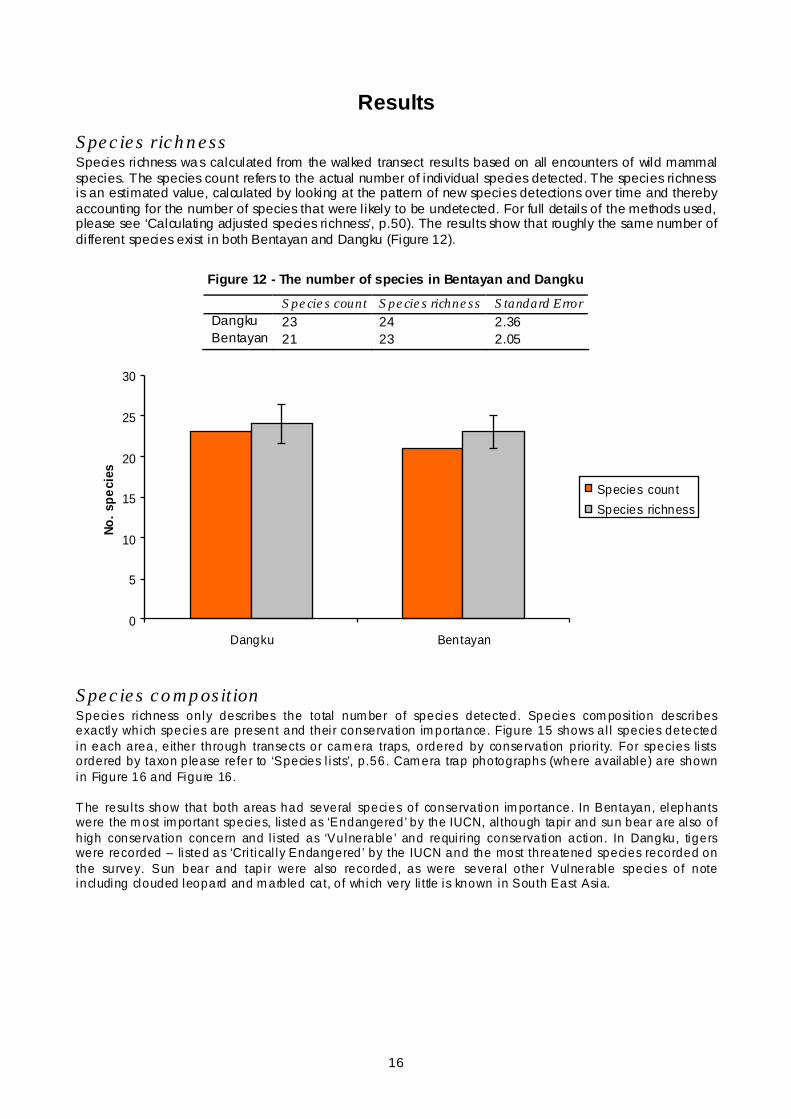
Species richness Species richness wa s calculated from the walked transect results based on all encounters of wild mammal species. The species count refers to the actual number of individual species detected. The species richness is an estimated value, calculated by looking at the pattern of new species detections over time and thereby accounting for the number of species that were likely to be undetected. For full details of the methods used, please see ‘Calculating adjusted species richness’, p.50). The results show that roughly the same number of different species exist in both Bentayan and Dangku (Figure 12).
Figure 12 - The number of species in Bentayan and Dangku
Species count Species richness Standard Error Dangku 23 24 2.36 Bentayan 21 23 2.05
0
5
10
15
20
25
30
Dangku Bentayan
No. s
peci
es
Species count
Species richness
Species composition Species richness only describes the total num ber of species detected. Species com posi tion describes exactly which species are present and thei r conservation im portance. Figure 15 shows al l species detected in each area, e ither through transects or cam era traps, ordered by conservation priori ty. For species lists ordered by taxon please refer to ‘Species l ists’, p.56. Cam era trap photographs (where available) are shown in Figure 16 and Figure 16. T he resul ts show that both areas had several species of conservation im portance. In Bentayan, elephants were the m ost im portant species, listed as ‘Endangered’ by the IUCN, al though tapi r and sun bear are also of h igh conservation concern and l isted as ‘Vulnerable ’ and requi ring conservation action. In Dangku, tigers were recorded – listed as ‘Cri tical ly Endangered’ by the IUCN and the most threatened species recorded on the survey. Sun bear and tapi r were also recorded, as were several other Vulnerable species of note including clouded leopard and m arbled cat, of which very li ttle is known in South East Asia.
17
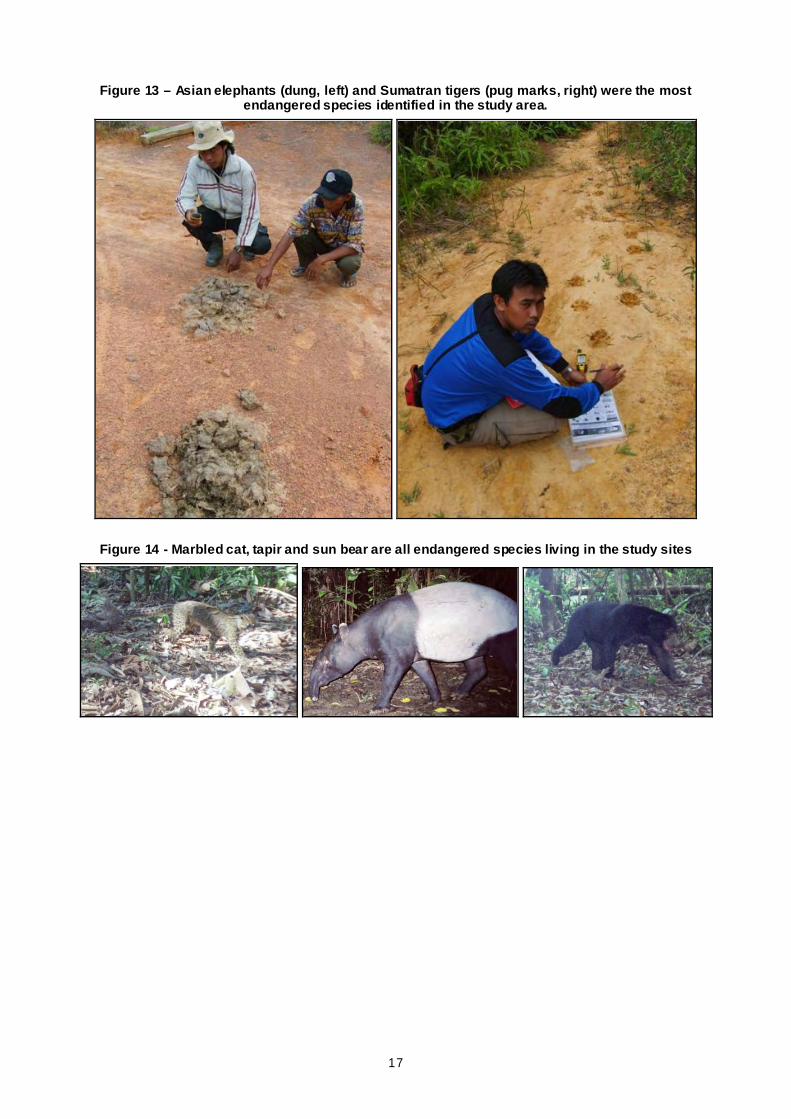
Figure 13 – Asian elephants (dung, left) and Sumatran tigers (pug marks, right) were the most endangered species identified in the study area.
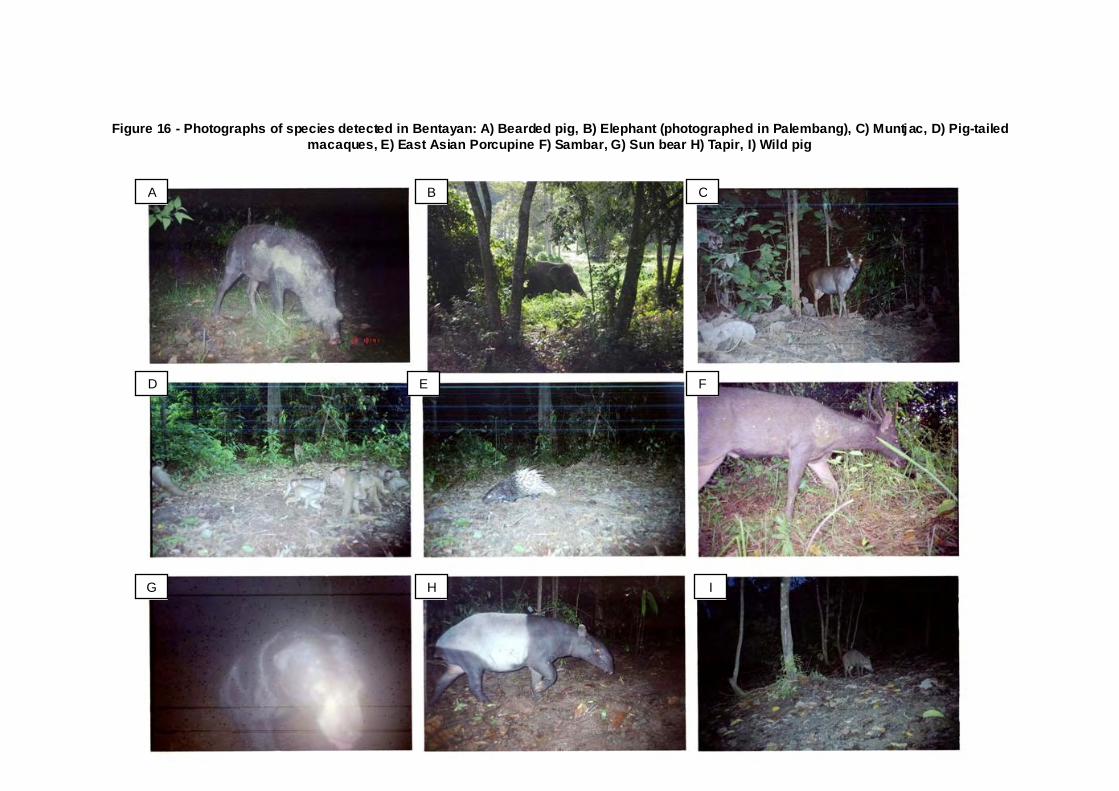
Figure 14 - Marbled cat, tapir and sun bear are all endangered species living in the study sites

18
Figure 15 - Species detected in Bentayan and Dangku ordered by conservation priority
Latin name Common name IUCN Red list category Indonesi an s tatus CITES Appendix Bentayan Dangku
Transects Photos Transects Photos
Panthera tigris ssp. Sumatrae Tiger Critically Endangered Protected I Y Y
Elephas maxi mus Asian elephant Endangered Protected I Y N N
Cuon alpinus Dhole Endangered Protected II Y N
Neofelis nebulosa Clouded leopard Vulner able Protected I Y N Y N
Pardofelis marmorata Marbled cat Vulner able Protected I N N N Y
Tapirus indicus Malayan tapir Vulner able Protected I Y Y Y Y
Helarctos malayanus Sun bear Vulner able* Protected I / II Y Y Y Y
Macaca nemestrina Pig tailed macaque Vulner able Protected II Y Y Y Y
Hystrix brachyura East Asian porcupine Vulner able Protected Not listed Y Y Y N
Hylobates agilis Agile gibbon Near threatened Protected I Y N Y N
Symphal angus syndac tylus Siamang Near threatened Protected I Y N Y N Manis javanica Pangolin Near threatened Protected II Y N N N
Presbytis melal ophos Banded langur Near threatened Protected II N N Y N
Macaca fascicularis Long tailed macaque Near threatened Not protected II Y Y Y Y
Prionailurus bengalensis Leopard cat Leas t concern Protected II Y Y Y Y Cervus unicolor Sambar Leas t concern Protected Not listed Y Y Y Y
Muntiacus muntj ak Muntjac Leas t concern Protected Not listed Y Y Y Y
Tragulus napu Greater mouse deer Leas t concern Protected Not listed Y N Y N
Martes flavigula Yellow thr oated marten Leas t concern Not protected III Y N Y N
Paradoxurus her maphroditus Common palm ci vet Leas t concern Not protected III Y N Y Y
Sus barbatus Bearded pig Leas t concern Not protected Not listed Y Y N N
Sus scrofa Pig (wild) Leas t concern Not protected Not listed Y Y Y Y Trichys fasciculate Long tailed porcupine Leas t concern Not protected Not listed Y N N N
Viverra tangalunga Malay Civet Leas t concern Not protected Not listed Y N Y N
19
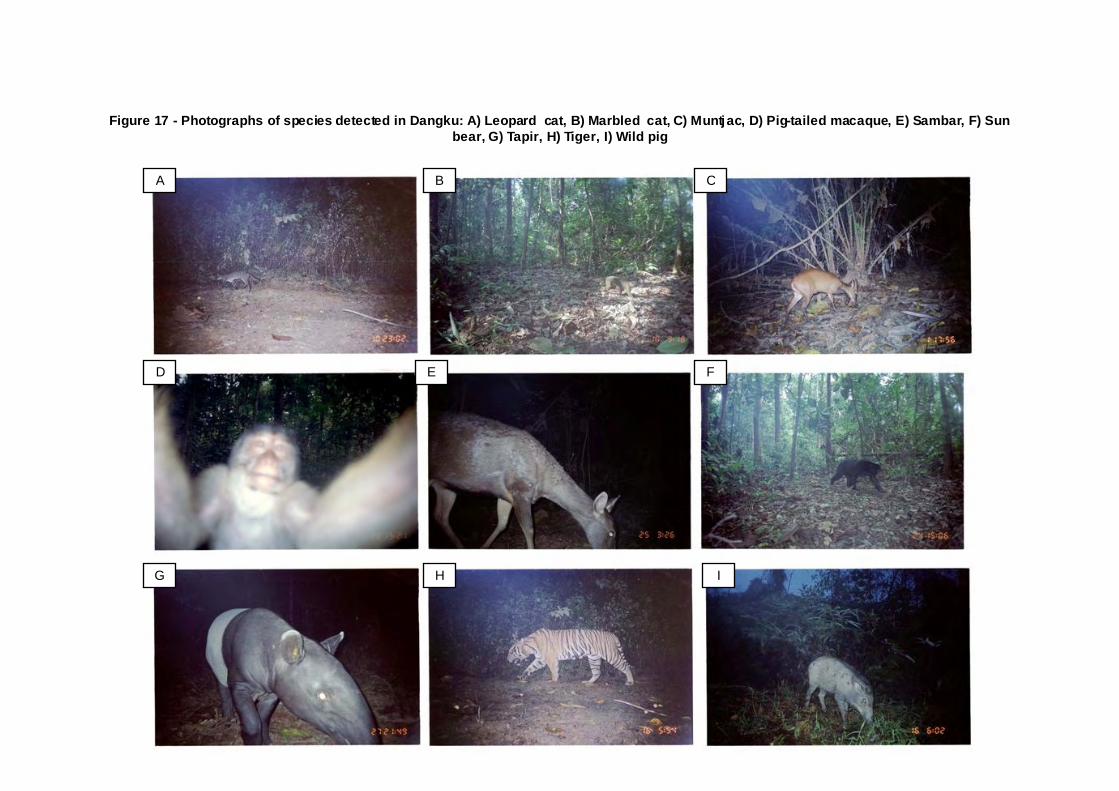
Figure 16 - Photographs of species detected in Bentayan: A) Bearded pig, B) Elephant (photographed in Palembang), C) Muntjac, D) Pig-tailed macaques, E) East Asian Porcupine F) Sambar, G) Sun bear H) Tapir, I) Wild pig
A
I H G
F E D
C B
20
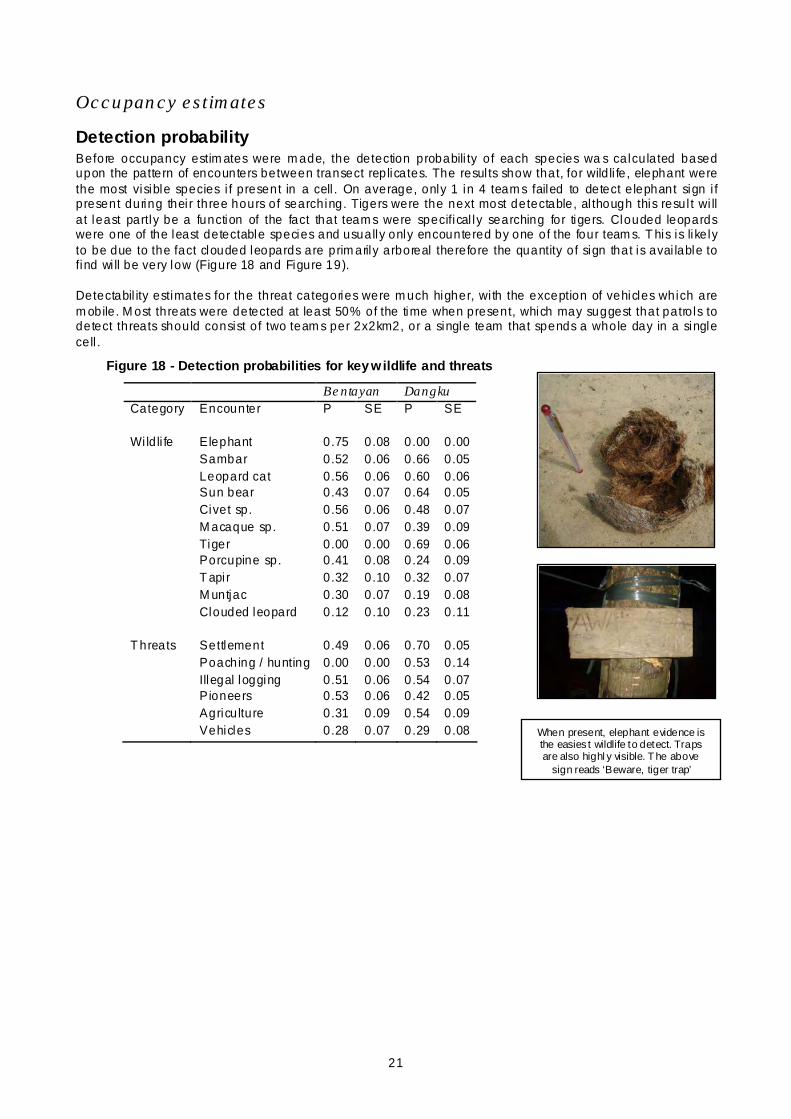
Figure 17 - Photographs of species detected in Dangku: A) Leopard cat, B) Marbled cat, C) Muntjac, D) Pig-tailed macaque, E) Sambar, F) Sun bear, G) Tapir, H) Tiger, I) Wild pig
A
I H G
F E D
C B
21
Occupancy estimates
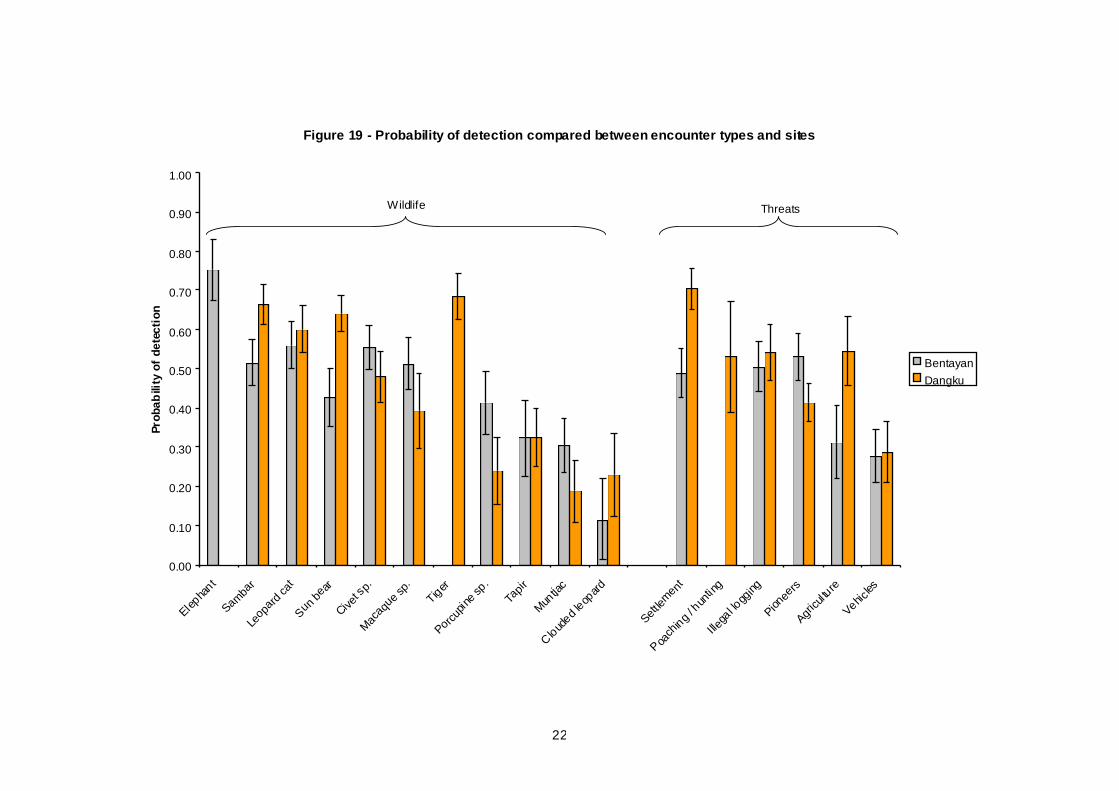
Detection probability Before occupancy estim ates were m ade, the detection probabili ty of each species wa s calculated based upon the pattern of encounters between transect replicates. The resul ts show that, for wild li fe, elephant were the most visible species i f present in a cell . On average, only 1 in 4 team s failed to detect e lephant sign i f present during thei r three hours of searching. Tigers were the next most detectable, al though this resul t wi ll a t least partly be a function of the fact that team s were specifical ly searching for tigers. Clouded leopards were one of the least detectable species and usually only encountered by one of the four team s. T his is like ly to be due to the fact clouded leopards are prim arily arboreal therefore the quantity of sign that is avai lable to find wi ll be very low (Figure 18 and Figure 19). Detectabil ity estimates for the threat categories were m uch higher, wi th the exception of vehicles which are m obile. M ost threats were detected at least 50% of the time when present, which may suggest that patro ls to detect threats should consist of two team s per 2x2km2, or a single team that spends a whole day in a single cell .
Figure 18 - Detection probabilities for key wildlife and threats
Bentayan Dangku Category Encounter P SE P SE Wi ld li fe Elephant 0.75 0.08 0.00 0.00 Sambar 0.52 0.06 0.66 0.05 Leopard cat 0.56 0.06 0.60 0.06 Sun bear 0.43 0.07 0.64 0.05 Civet sp. 0.56 0.06 0.48 0.07 M acaque sp. 0.51 0.07 0.39 0.09 Tiger 0.00 0.00 0.69 0.06 Porcupine sp. 0.41 0.08 0.24 0.09 T api r 0.32 0.10 0.32 0.07 M untjac 0.30 0.07 0.19 0.08 Clouded leopard 0.12 0.10 0.23 0.11 T hreats Settlement 0.49 0.06 0.70 0.05 Poaching / hunting 0.00 0.00 0.53 0.14 Illegal logging 0.51 0.06 0.54 0.07 Pioneers 0.53 0.06 0.42 0.05 Agriculture 0.31 0.09 0.54 0.09 Vehicles 0.28 0.07 0.29 0.08
When present, elephant evidence is the easies t wildlife to detect. Traps are also highl y visible. T he above
sign reads ‘Beware, tiger trap’
22
Figure 19 - Probability of detection compared between encounter types and sites
0.00
0.10
0.20
0.30
0.40
0.50
0.60
0.70
0.80
0.90
1.00
Elepha
ntSamba
rLe
opard
cat
Sun bear
Civet s
p.Mac
aque s
p.
TigerPorcu
pine sp
.
Tapir
Muntja
cCloud
ed leop
ard
Settlem
ent
Poach
ing / hun
ting
Illega
l logg
ingPion
eers
Agricu
l ture
Vehicles
Prob
abili
ty o
f de
tect
ion
BentayanDangku
Wildlife Threats
23
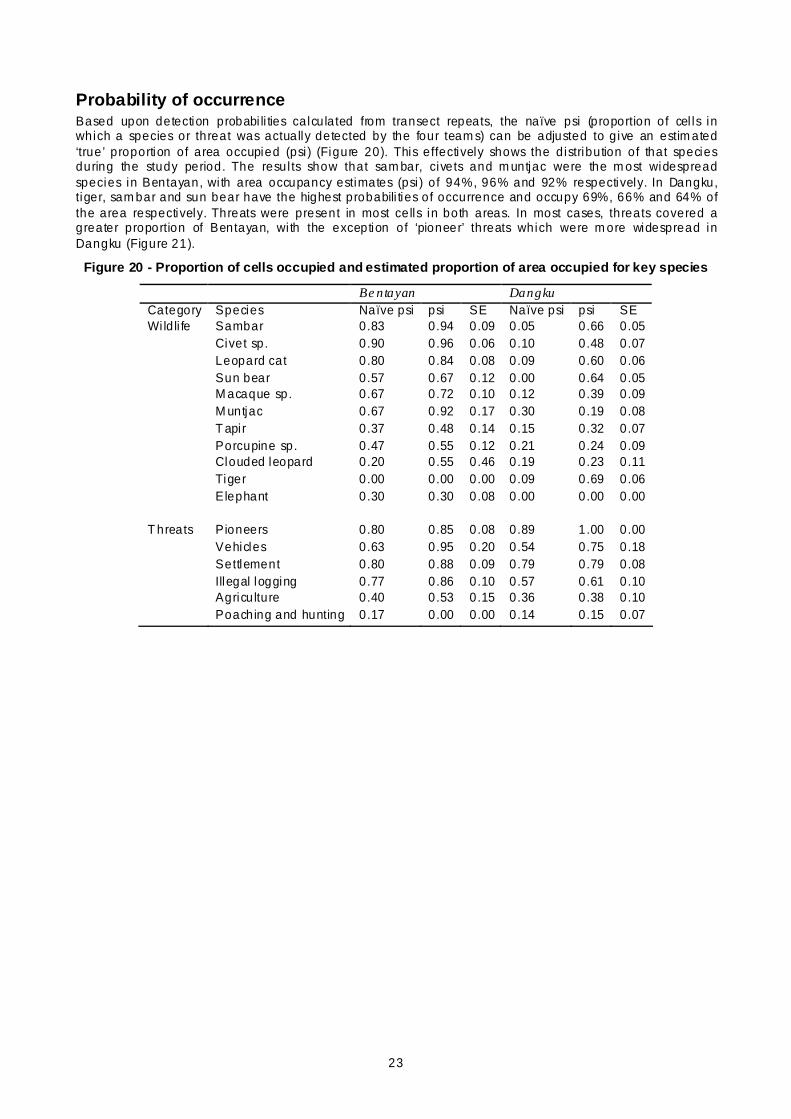
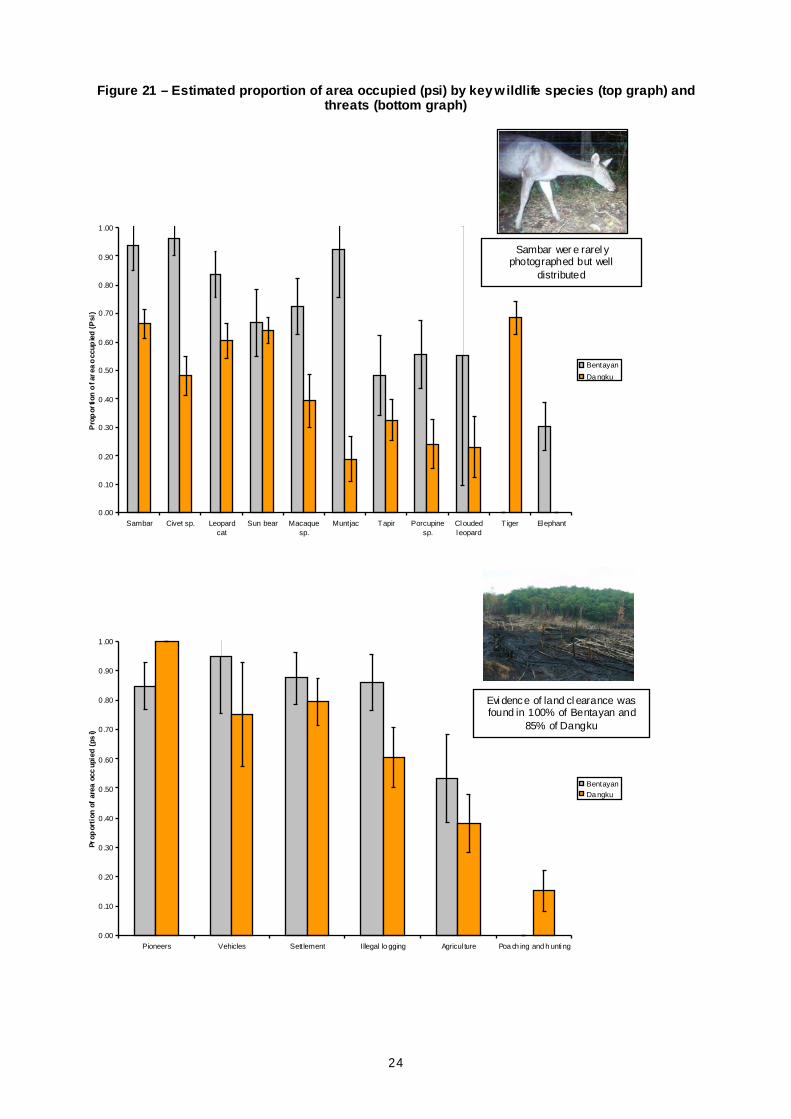
Probability of occurrence Based upon detection probabi li ties calculated from transect repeats, the naïve psi (proportion of cel ls in which a species or threat was actually detected by the four team s) can be adjusted to g ive an estim ated ‘true’ proportion of area occupied (psi ) (Figure 20). This effectively shows the distribution of that species during the study period. The resul ts show that sam bar, civets and m untjac were the m ost widespread species in Bentayan, wi th area occupancy estimates (psi ) of 94%, 96% and 92% respectively. In Dangku, tiger, sam bar and sun bear have the highest probabili ties of occurrence and occupy 69%, 66% and 64% of the area respectively. Threats were present in most cells in both areas. In most cases, threats covered a greater proportion of Bentayan, wi th the exception of ‘pioneer’ threats which were m ore widespread in Dangku (Figure 21).
Figure 20 - Proportion of cells occupied and estimated proportion of area occupied for key species
Bentayan Dangku Category Species Naïve psi psi SE Naïve psi psi SE Wi ld li fe Sambar 0.83 0.94 0.09 0.05 0.66 0.05 Civet sp. 0.90 0.96 0.06 0.10 0.48 0.07 Leopard cat 0.80 0.84 0.08 0.09 0.60 0.06 Sun bear 0.57 0.67 0.12 0.00 0.64 0.05 M acaque sp. 0.67 0.72 0.10 0.12 0.39 0.09 M untjac 0.67 0.92 0.17 0.30 0.19 0.08 T api r 0.37 0.48 0.14 0.15 0.32 0.07 Porcupine sp. 0.47 0.55 0.12 0.21 0.24 0.09 Clouded leopard 0.20 0.55 0.46 0.19 0.23 0.11 Tiger 0.00 0.00 0.00 0.09 0.69 0.06 Elephant 0.30 0.30 0.08 0.00 0.00 0.00 T hreats Pioneers 0.80 0.85 0.08 0.89 1.00 0.00 Vehicles 0.63 0.95 0.20 0.54 0.75 0.18 Settlement 0.80 0.88 0.09 0.79 0.79 0.08 Illegal logging 0.77 0.86 0.10 0.57 0.61 0.10 Agriculture 0.40 0.53 0.15 0.36 0.38 0.10 Poaching and hunting 0.17 0.00 0.00 0.14 0.15 0.07
24
Figure 21 – Estimated proportion of area occupied (psi) by key wildlife species (top graph) and threats (bottom graph)
0 .00
0 .10
0 .20
0 .30
0 .40
0 .50
0 .60
0 .70
0 .80
0 .90
1 .00
Sambar Civet sp. Leopardcat
Sun bear Macaquesp.
Muntjac Tapir Porcupinesp.
Cloudedleopard
Tiger Elephant
Pro
por
tion
of a
rea
occ
upie
d (P
si)
Bentayan
Da ngku
0 .00
0 .10
0 .20
0 .30
0 .40
0 .50
0 .60
0 .70
0 .80
0 .90
1 .00
Pioneers Vehicles Settlement Illegal lo gging Agricul ture Poa ch ing and h unti ng
Prop
orti
on o
f ar
ea o
ccup
ied
(ps
i)
BentayanDa ngku
Evi dence of land cl earance was found in 100% of Bentayan and
85% of Dangku
Sambar wer e rarel y photographed but well
distributed
25
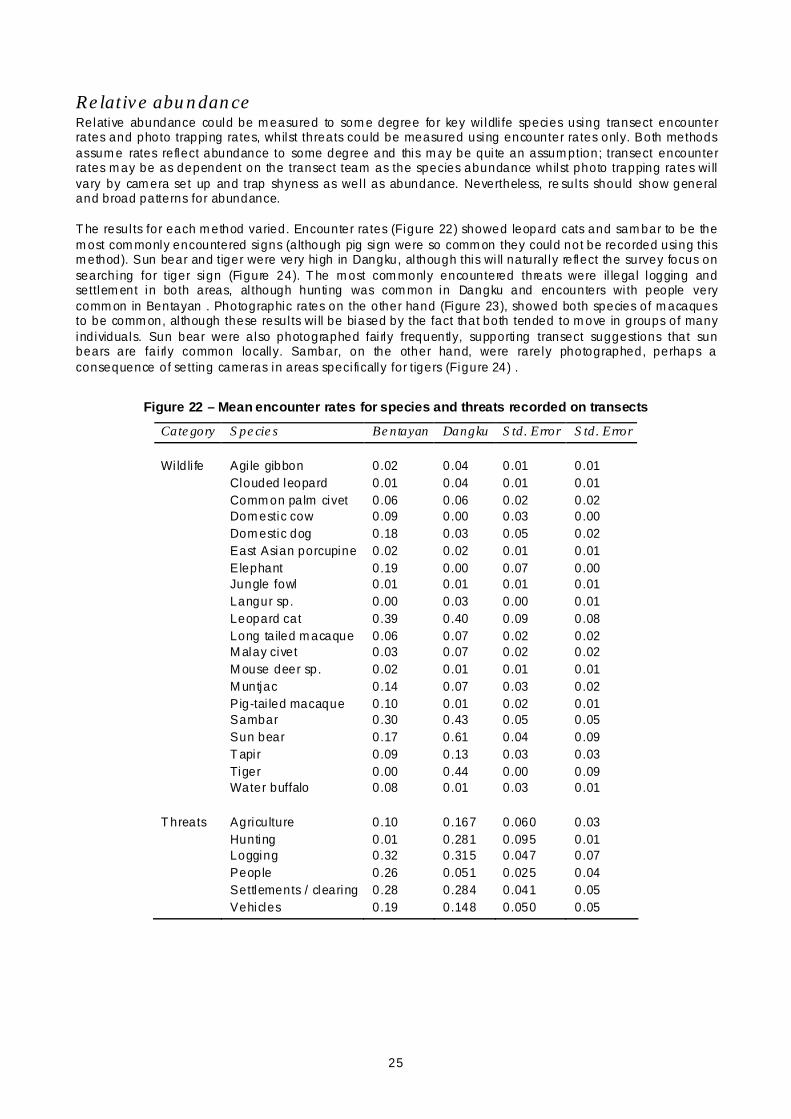
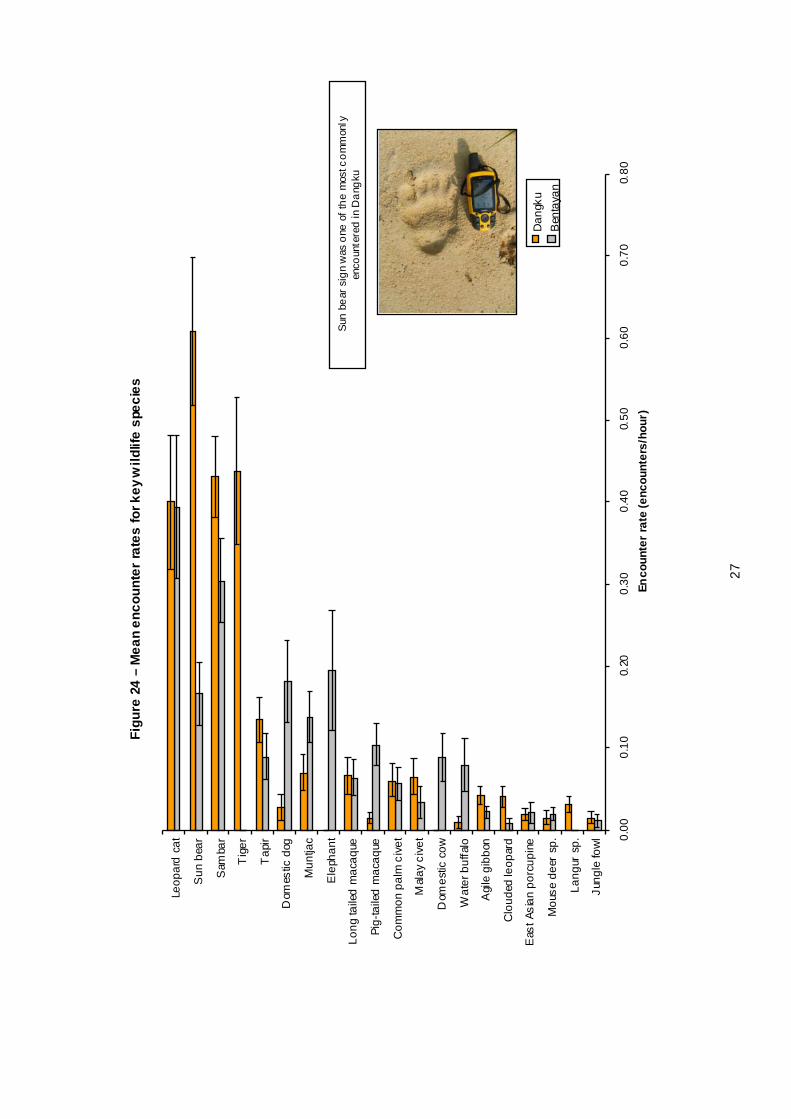
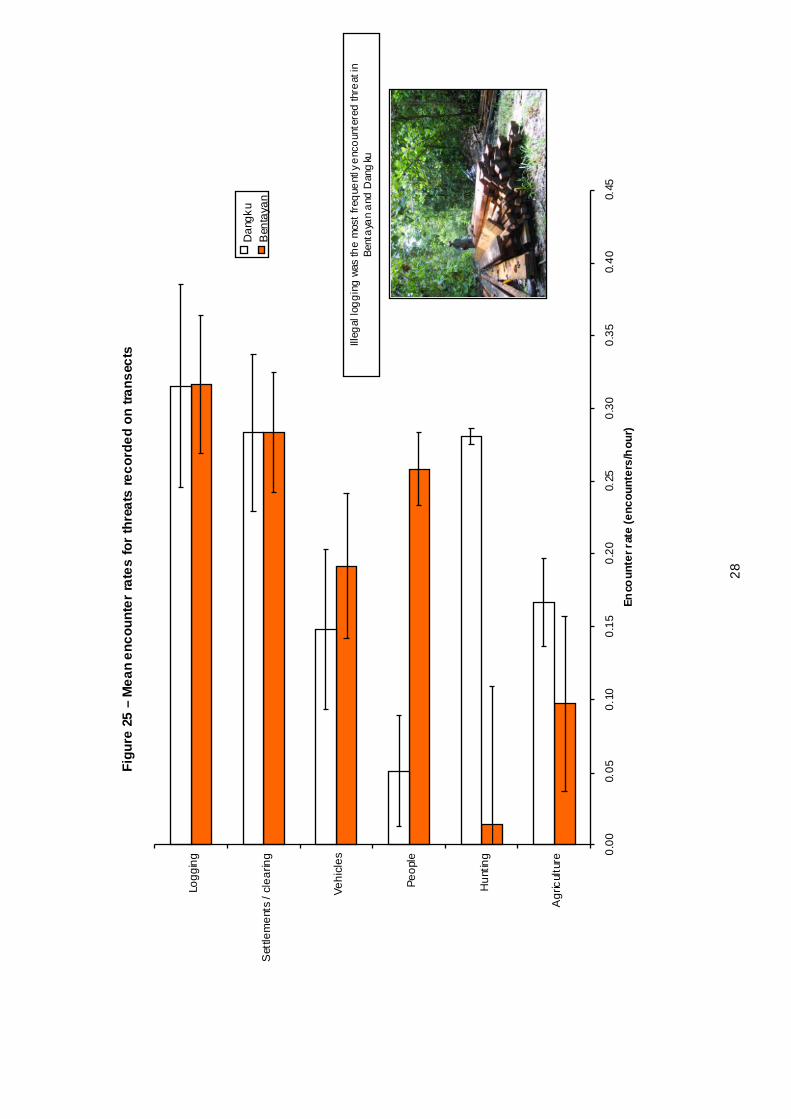
Relative abundance Relative abundance could be m easured to som e degree for key wi ldli fe species using transect encounter rates and photo trapping rates, whilst threats could be measured using encounter rates only. Both methods assum e rates reflect abundance to some degree and this m ay be qui te an assum ption; transect encounter rates m ay be as dependent on the transect team as the species abundance whilst photo trapping rates wi ll vary by cam era set up and trap shyness as wel l as abundance. Nevertheless, re sul ts should show general and broad patterns for abundance. T he resul ts for each m ethod varied. Encounter rates (Figure 22) showed leopard cats and sam bar to be the m ost com monly encountered signs (a lthough pig sign were so comm on they could not be recorded using this m ethod). Sun bear and tiger were very high in Dangku, al though this wi ll natural ly reflect the survey focus on searching for tiger sign (Figure 24). T he m ost com monly encountered threats were il legal logging and settlem ent in both areas, al though hunting was com mon in Dangku and encounters wi th people very comm on in Bentayan . Photographic rates on the other hand (Figure 23), showed both species of m acaques to be comm on, al though these resul ts wi ll be biased by the fact that both tended to m ove in groups of many individuals. Sun bear were also photographed fai rly frequently, supporting transect suggestions that sun bears are fa i rly common locally. Sambar, on the other hand, were rarely photographed, perhaps a consequence of setting cameras in areas speci fically for tigers (Figure 24) .
Figure 22 – Mean encounter rates for species and threats recorded on transects
Category Species Bentayan Dangku Std. Error Std. Error Wi ld li fe Agi le gibbon 0.02 0.04 0.01 0.01 Clouded leopard 0.01 0.04 0.01 0.01 Comm on palm civet 0.06 0.06 0.02 0.02 Dom estic cow 0.09 0.00 0.03 0.00 Dom estic dog 0.18 0.03 0.05 0.02 East Asian porcupine 0.02 0.02 0.01 0.01 Elephant 0.19 0.00 0.07 0.00 Jungle fowl 0.01 0.01 0.01 0.01 Langur sp. 0.00 0.03 0.00 0.01 Leopard cat 0.39 0.40 0.09 0.08 Long ta iled m acaque 0.06 0.07 0.02 0.02 M alay civet 0.03 0.07 0.02 0.02 M ouse deer sp. 0.02 0.01 0.01 0.01 M untjac 0.14 0.07 0.03 0.02 Pig-tai led macaque 0.10 0.01 0.02 0.01 Sambar 0.30 0.43 0.05 0.05 Sun bear 0.17 0.61 0.04 0.09 T api r 0.09 0.13 0.03 0.03 Tiger 0.00 0.44 0.00 0.09 Water buffalo 0.08 0.01 0.03 0.01 T hreats Agriculture 0.10 0.167 0.060 0.03 Hunting 0.01 0.281 0.095 0.01 Logging 0.32 0.315 0.047 0.07 People 0.26 0.051 0.025 0.04 Settlements / clearing 0.28 0.284 0.041 0.05 Vehicles 0.19 0.148 0.050 0.05

26
Figure 23 - Photo trapping rates for species photographed in Bentayan and Dangku
Bentayan (495 trap nights) Dangku (573 trap nights) Average Banded langur 0.00 0.17 0.09 Comm on palm civet 0.00 0.17 0.09 M arbled cat 0.00 0.17 0.09 Jungle fowl 0.20 0.00 0.10 Leopard cat 0.20 0.52 0.36 M otorbike 0.20 0.70 0.45 Sambar 0.40 0.52 0.46 Tiger 0.00 1.22 0.61 M alayan tapi r 1.41 0.87 1.14 M untjac 0.61 1.75 1.18 East Asian porcupine 2.42 0.00 1.21 Sun bear 1.01 1.57 1.29 Person(unknown) 2.42 3.14 2.78 Long-tailed macaque 3.23 2.97 3.10 Pigs (wi ld and bearded) 11.72 6.63 9.17 Pig-tai led macaque 25.66 19.72 22.69
27
Figu
re 2
4 –
Mea
n en
coun
ter
rate
s fo
r key
wild
life
spec
ies
0.00
0.10
0.20
0.30
0.40
0.50
0.60
0.70
0.80
Jung
le fo
wl
Lang
ur s
p.
Mou
se d
eer
sp.
Eas
t Asi
an p
orcu
pine
Clo
uded
leop
ard
Agi
le g
ibbo
n
Wat
er b
uffa
lo
Dom
estic
cow
Mal
ay c
ivet
Com
mon
pal
m c
ivet
Pig-
taile
d m
acaq
ue
Long
taile
d m
acaq
ue
Ele
phan
t
Mun
tjac
Dom
estic
dog
Tap
ir
Tig
er
Sam
bar
Sun
bea
r
Leop
ard
cat
Enco
unte
r ra
te (e
ncou
nter
s/ho
ur)
Dan
gku
Ben
taya
n
Sun
be
ar s
ign
was
one
of
the
mos
t co
mm
only
en
coun
tere
d in
Da
ngku
28
Figu
re 2
5 –
Mea
n en
coun
ter
rate
s fo
r th
reat
s re
cord
ed o
n tra
nsec
ts
0.00
0.05
0.10
0.15
0.20
0.25
0.30
0.35
0.40
0.45
Agr
icul
ture
Hun
ting
Peop
le
Vehi
cles
Set
tlem
ents
/ cl
earin
g
Logg
ing
Enco
unte
r rat
e (e
ncou
nter
s/h
our)
Dan
gku
Ben
taya
n
Illeg
al lo
gg
ing
was
the
mos
t fr
eque
ntly
enc
oun
tere
d th
reat
in
Ben
taya
n a
nd D
ang
ku

29
Figu
re 2
6 - R
elat
ive
abun
danc
e of
spe
cies
bas
ed o
n ov
eral
l pho
to tr
appi
ng r
ates
0.00
5.00
10.0
015
.00
20.0
025
.00
30.0
0
Ban
ded
lang
ur
Com
mon
pal
m c
ivet
Mar
bled
cat
Jung
le fo
wl
Leop
ard
cat
Mot
orbi
ke
Sam
bar
Tig
er
Mal
ayan
tapi
r
Mun
tjac
Eas
t Asi
an p
orcu
pine
Sun
bea
r
Per
son(
unkn
own)
Long
-taile
d m
acaq
ue
Pig
s (w
ild a
nd b
eard
ed)
Pig
-taile
d m
acaq
ue
Trap
ping
rat
e (p
hoto
s / 1
00 tr
ap n
ight
s)
Ave
rage
Da
ngku
(57
3 tr
ap n
igh
ts)
Ben
taya
n (4
95 t
rap
nig
hts)
Pig
-tai
led
mac
aque
s w
ere
the
mos
t ph
otog
rap
hed
spec
ies
in b
oth
sit
es
30
Distribution
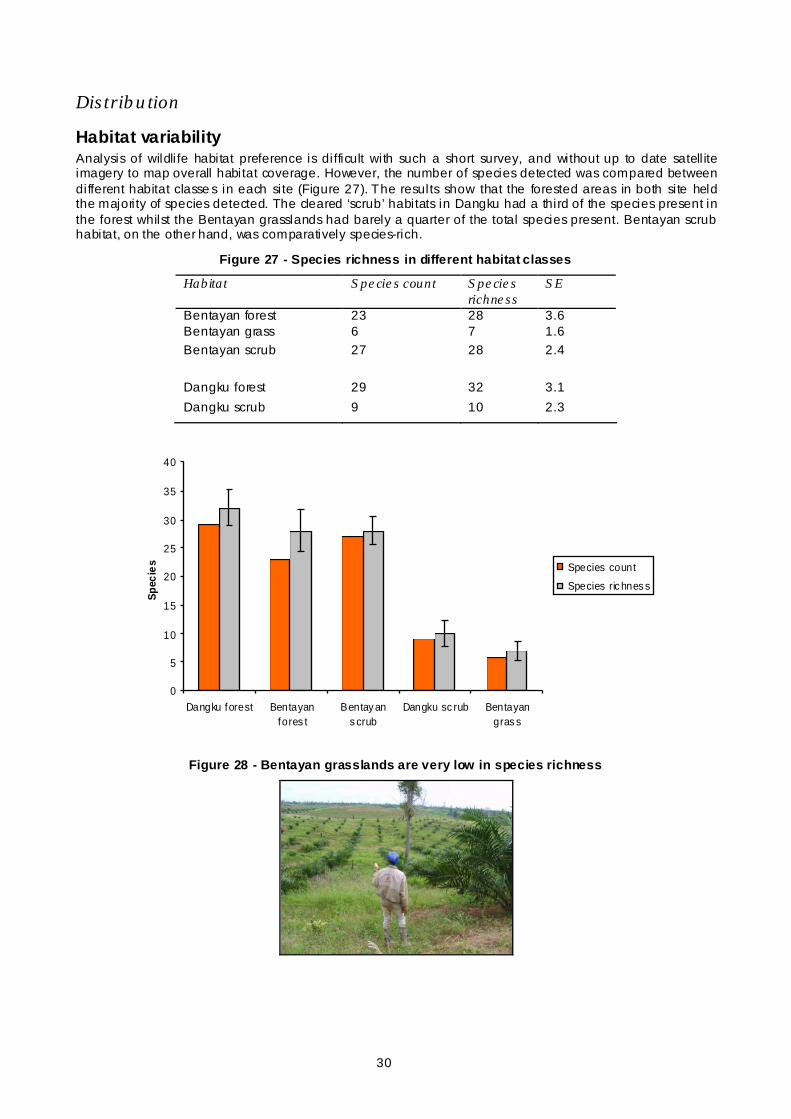
Habitat variability Analysis of wildli fe habitat preference is difficult with such a short survey, and without up to date satell ite imagery to map overall habitat coverage. However, the number of species detected was compared between different habitat classe s in each site (Figure 27). The results show that the forested areas in both site held the majority of species detected. The cleared ‘scrub’ habitats in Dangku had a third of the species present in the forest whilst the Bentayan grasslands had barely a quarter of the total species present. Bentayan scrub habitat, on the other hand, was comparatively species-rich.
Figure 27 - Species richness in different habitat classes
Habitat Species count Species richness
SE
Bentayan forest 23 28 3.6 Bentayan grass 6 7 1.6 Bentayan scrub 27 28 2.4
Dangku forest 29 32 3.1
Dangku scrub 9 10 2.3
0
5
10
15
20
25
30
35
40
Dangku forest Bentayanfores t
Bentay ans crub
Dangku sc rub Bentayangras s
Spec
ies Species count
Species ric hnes s
Figure 28 - Bentayan grasslands are very low in species richness
31
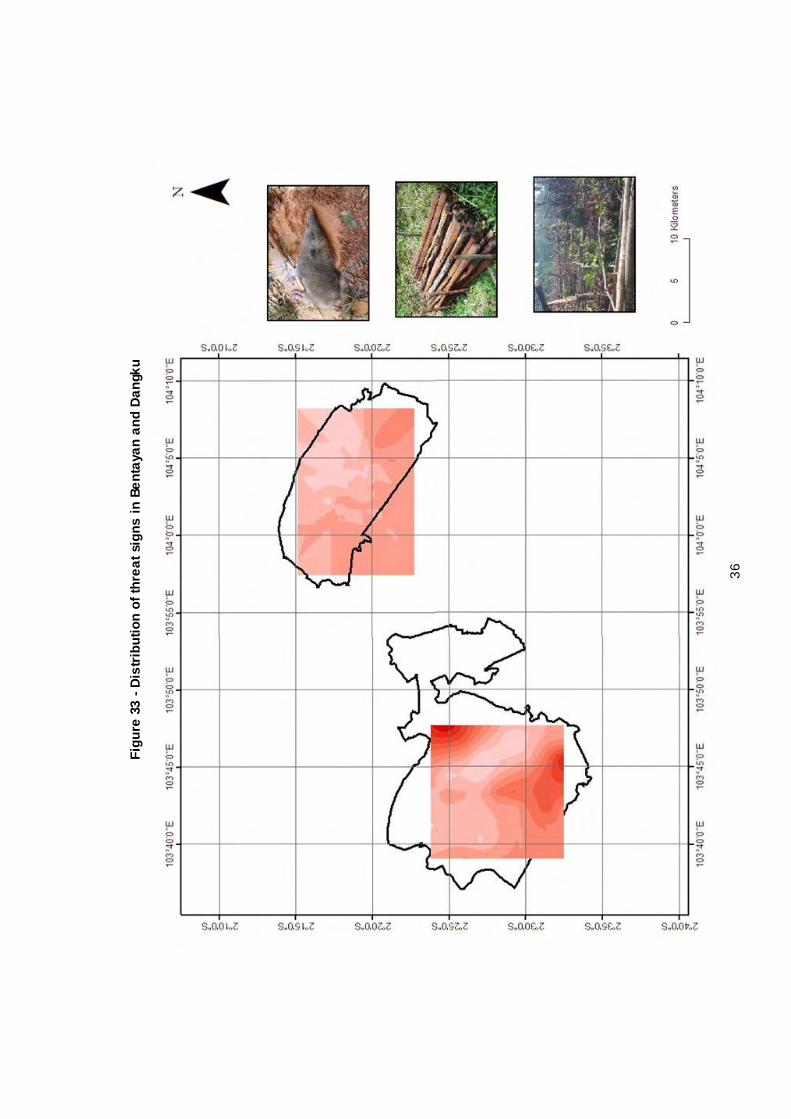
Spatial distribution Spatial distribution of key species and threats was mapped using encounter rates (independent encounters / hour) calculated for each cell . The results were then interpolated using standard kriging methods to produce contour maps of distribution (Figure 29 to Figure 33). Whilst encounter rates can only be an approximation for abundance, the maps do show key areas within each reserve that should be priori tised in any conservation effort. For species maps, a relative measure of threat level was also overlaid. This was calculated by plotting the average of encounter rates for all threat activities (logging, settlement, hunting etc.) for each cell and plotting using proportional symbology. For elephants in Bentayan, encounters were restricted to a small area in the north of the reserve. Relating distribution to threat levels in Bentayan is difficult since threats were fairly uniformly high across the reserve, however i t should be noted that the areas elephants were detected was one of few areas with relatively lower threats. In addition to this, elephants were known to have caused damage in vil lages to the north west and also to the south of the park outside the survey period. With the north west of the reserve bordered by commercial oil palm, the expectation is that the elephants are ranging out of the reserve to the north east where, historically, there was forest extending to the coast (Figure 29). For tigers in Dangku, the areas with the highest encounter rates were all centred in the area that appears as forest on the latest satelli te imagery. The area to the south where threat levels were high (primari ly due to land clearing and oil palm) was completely devoid of tigers. The distribution closely matched the threat levels, with higher threats closing in from all directions and compressing the remaining tigers into a small area. Conflict with humans in such circumstances would not be surprising. For bears and tapirs, encounter rates showed similar patterns to tigers and elephants, with the north / north eastern section of Bentayan with lower threat levels showing the highest levels of activity for both, and the central, forested part of Dangku also showing more signs than the fringes. The only exception was sun bear distribution in Dangku which was more uniform across the reserve, leading to an unclear interpolation. This could indicate sun bears are more resi lient to disturbance than tigers and tapirs (Figure 31, Figure 32). Threats were widespread in Bentayan, leading to a fairly uniform interpolation. However, in Dangku, the main concentrations of threat sign were to the east and south of the main forest block (Figure 33).

32
Figu
re 2
9 - D
istr
ibut
ion
of e
leph
ant s
ign
in B
enta
yan
map
ped
with
rela
tive
aver
age
thre
at v
alue
s

33
Figu
re 3
0 - D
istr
ibut
ion
of ti
ger s
ign
in D
angk
u m
appe
d w
ith r
elat
ive
aver
age
thre
at v
alue
s

34
Figu
re 3
1 - D
istr
ibut
ion
of s
un b
ear s
ign
in B
enta
yan
and
Dan
gku
map
ped
with
rel
ativ
e av
erag
e th
reat
val
ues

35
Figu
re 3
2 - D
istr
ibut
ion
of ta
pir s
ign
in B
enta
yan
and
Dan
gku
map
ped
with
rel
ativ
e av
erag
e th
reat
val
ues
36
Figu
re 3
3 - D
istr
ibut
ion
of th
reat
sig
ns in
Ben
taya
n an
d D
angk
u

37
The Tiger Population
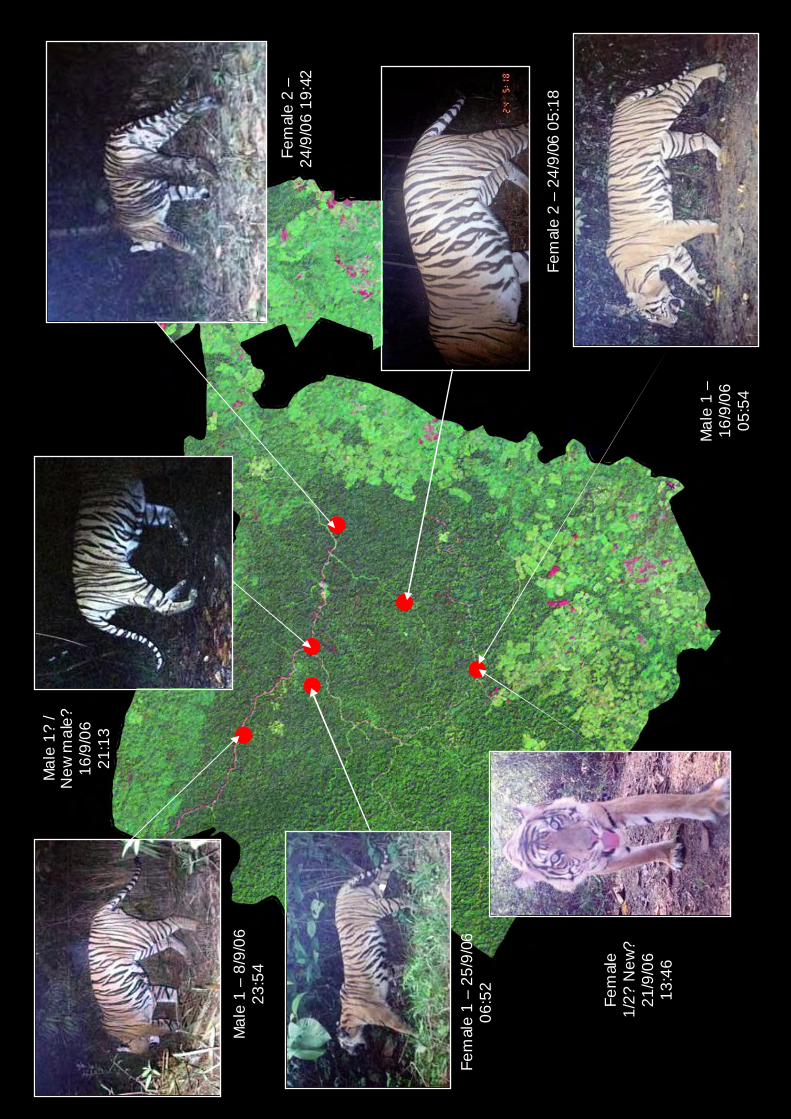
Tiger abundance To properly research a tiger population, an intensive camera trapping study needs to be carried out over 2-3 months with paired cameras and a sufficient area to obtain sufficient trapping rates for capture mark recapture analysis. Since this option was not available for a restricted rapid survey, a robust estimate of the tiger population is not possible. However, using the photographs obtained, several conclusions can be made. Firstly, tigers can be individually identified by their stripe patterns. This allows photographs of the same side to be matched (see tiger summary below) and thus the absolute minimum of tigers recorded to be calculated. Based upon the seven photos obtained during the Dangku survey, we can therefore confidently state that at least three different tigers were identified (one male, two females) based upon left sided photos. The right sided photo of a male was taken very close to the left sided photo, therefore i t is likely this is the same individual (males are terri torial and two are not generally found in the same area). The final front-sided photo could not be matched to the other photos, although it looks l ike a young animal, probably female. We can therefore say that three, possibly four tigers are definitely present in Dangku. For an area the size of Dangku there are unlikely to be many more that we did not photograph within the reserve, however i t is strongly suspected that the population is contiguous with tigers l iving outside the park to the west and north west. The trapping rate for tigers in Dangku (1.2 photos / 100 trap nights) is fairly high – approximately double the rate recorded in a survey in the same year of the Birdli fe Harapan restoration area, although whether trapping rates are indicative of densities is a discussion fraught with controversy. Based on this very l imited information we would guess that a proper study of the tiger population would reveal a density in the region of 2-3 tigers / 100km2.
Threats Tigers generally suffer from three primary threats: direct persecution, prey availabil ity and habitat availabili ty. In Dangku direct threats to tigers were very high, including the discovery of a clearly marked deadfall tiger trap. Even snares not designed for tigers can sti ll be lethal, since they can become entangled and the snare continues to tighten even if broken away from its anchor. Indirect threats through limited prey abundance were of a lesser concern; sambar, a key prey i tem, appeared fairly well distributed across the area and pigs were very abundant. Habitat clearance was the greatest longer term threat. As the distribution maps clearly show, the area of habitat sti ll used by tigers and other species in Dangku is restricted to a portion of forest in the middle, with high threat encroachment on al l sides. T igers are fairly adaptable species and do not need pristine forest to survive, but they cannot live in completely cleared areas or oil palm.
Human conflict Shortly after the survey was completed, two reports of tigers ki l ling people were reported around Dangku. This was not a surprising outcome. The tiger habitat is extremely restricted and human activity within the reserve is very high. Decreasing habitat availabili ty will be forcing humans and tigers closer together and dispersing tigers, particularly young males, have very few options of where they can go.
Figure 34 - People and a tiger, photographed by the same camera on the same day at the same location w ithin Dangku
38
Fem
ale
1 –
25/9
/06
06:5
2
Fem
ale
2 –
24/9
/06
05:1
8
Fem
ale
2 –
24/9
/06
19:4
2
Mal
e 1
– 16
/9/0
6 05
:54
Mal
e 1
– 8/
9/06
23
:54
Fem
ale
1/2?
New
? 21
/9/0
6 13
:46
Mal
e 1?
/ N
ew m
ale?
16
/9/0
6 21
:13

39
Don't own anything
25%
Car4%
Motorbike34%
TV11%
Bicyc le26%
Cow / buffalo
6%
G oa ts4%
Chicke ns7 4%
Don't own livestock
1 6%
<568%
6-1016%
11-156%
16-202%
>218%
Questionnaire survey
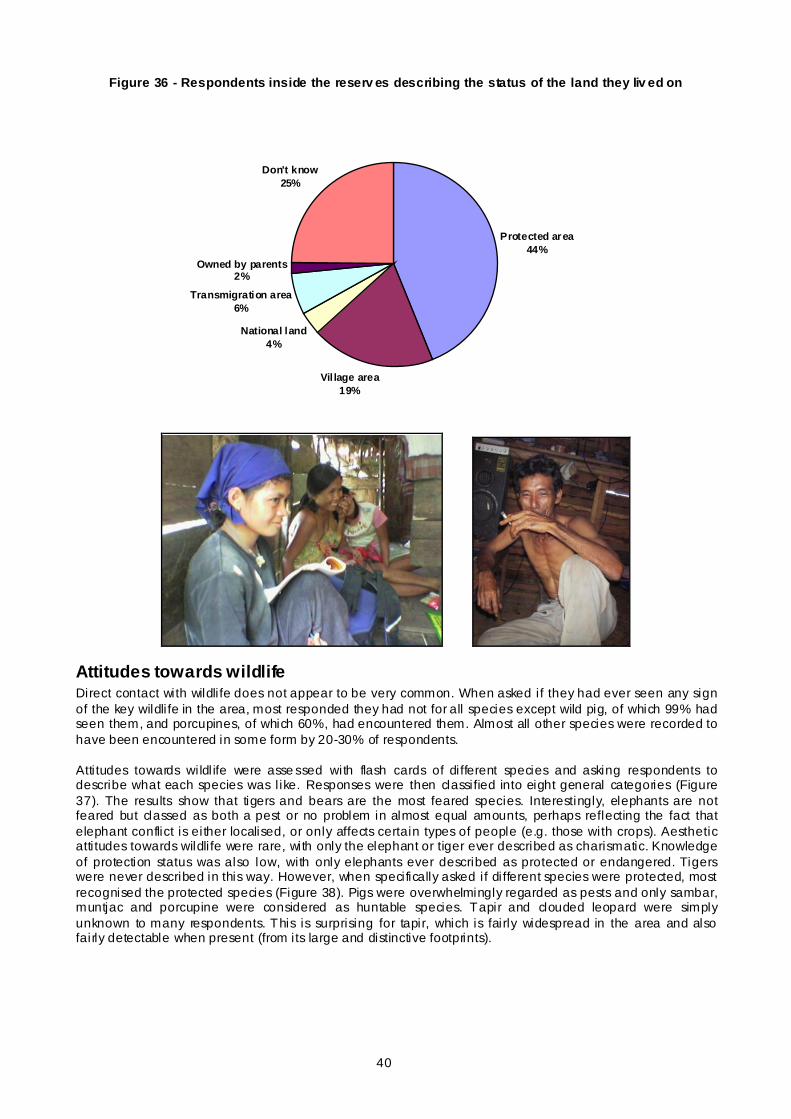
Background Since wealth is a difficult question to ask directly, respondents were asked about posse ssions and livestock to get a general view of the local economy. The results show that in general, respondents in and around Bentayan and Dangku are very poor, with almost no one owning a car and only a third able to afford a motorbike. Most people do own livestock but i t is overwhelmingly small stock, with only 6% owning cows or buffalo (Figure 35). Most people interviewed were newcomers to the area, with nearly 70% arriving in the last five years. Many stated they had moved to the area following the fires in the late 1990s which cleared lots of land. In an effort to understand why people were l iving inside protected areas, but without directly challenging people, respondents were asked to describe the status of the land they lived on. Surprisingly nearly half stated i t was a protected area. Another quarter claimed it belonged to family, the village or the government and the final quarter stated they did not know. Pushing respondents further, they explained that although they knew it was a protected area in name, the fires in the late 1990s had destroyed its value as a reserve and so therefore they were only occupying unproductive land.
Figure 35 - Approximate measures of wealth across respondents from Dangku and Bentayan (top) and time spent living in the area (bottom)
40
Figure 36 - Respondents inside the reserv es describing the status of the land they liv ed on
Protected area44%
Vil lage area19%
National land4%
Transmigration area6%
Owned by parents2%
Don't know25%
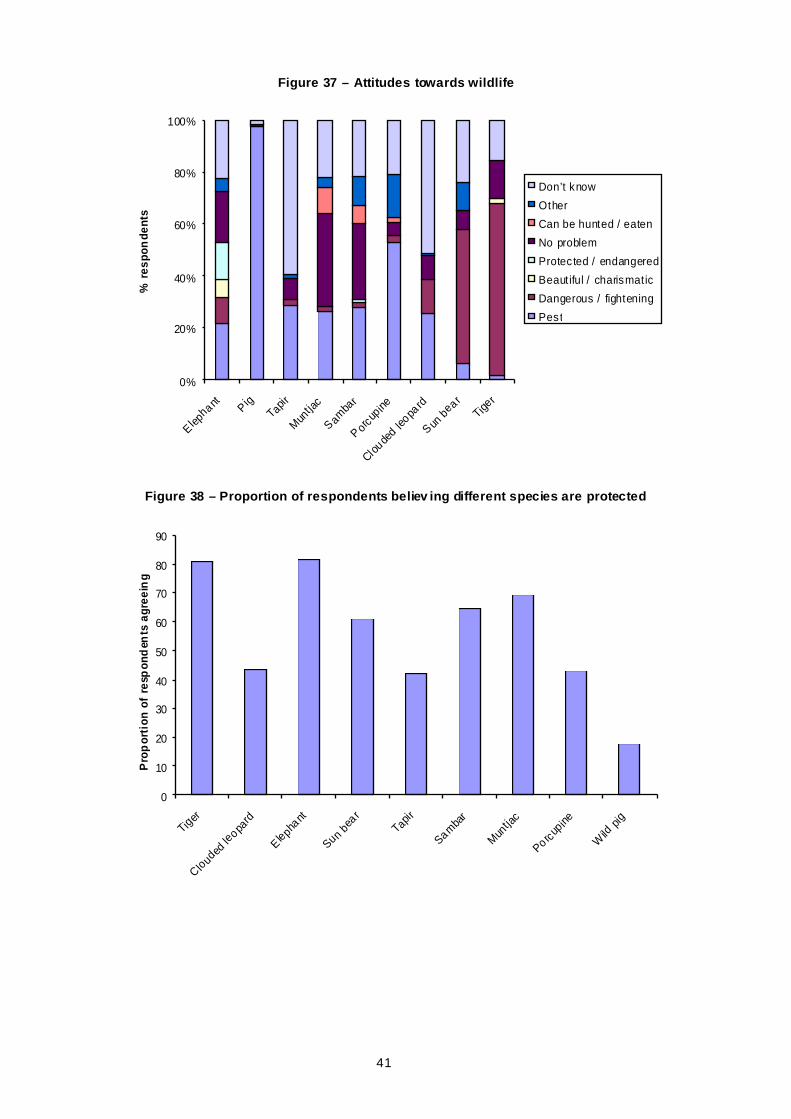
Attitudes towards wildlife Direct contact with wildli fe does not appear to be very common. When asked if they had ever seen any sign of the key wildli fe in the area, most responded they had not for all species except wild pig, of which 99% had seen them, and porcupines, of which 60%, had encountered them. Almost all other species were recorded to have been encountered in some form by 20-30% of respondents. Atti tudes towards wildl ife were asse ssed with flash cards of different species and asking respondents to describe what each species was l ike. Responses were then classified into eight general categories (Figure 37). The results show that tigers and bears are the most feared species. Interestingly, elephants are not feared but classed as both a pest or no problem in almost equal amounts, perhaps reflecting the fact that elephant conflict is either localised, or only affects certain types of people (e.g. those with crops). Aesthetic atti tudes towards wildli fe were rare, with only the elephant or tiger ever described as charismatic. Knowledge of protection status was also low, with only elephants ever described as protected or endangered. Tigers were never described in this way. However, when specifically asked if different species were protected, most recognised the protected species (Figure 38). Pigs were overwhelmingly regarded as pests and only sambar, muntjac and porcupine were considered as huntable species. Tapir and clouded leopard were simply unknown to many respondents. This is surprising for tapir, which is fairly widespread in the area and also fairly detectable when present (from its large and distinctive footprints).
41
Figure 37 – Attitudes towards wildlife
0%
20%
40%
60%
80%
100%
Elephant Pig
Tapi r
Muntja
c
S amba
r
P orcup
ine
Cloude
d leopa
rd
S un be
a rTige
r
% r
espo
nde
nts
Don’t know
Other
Can be hunted / eaten
No problem
Protected / endangered
Beautiful / charismatic
Dangerous / fightening
Pest
Figure 38 – Proportion of respondents believ ing different species are protected
0
10
20
30
40
50
60
70
80
90
Tiger
C louded
leopa
rd
Elephant
Sun bea
rTap
i r
Sambar
Muntja
c
Po rcup ine
Wild
pig
Pro
por
tion
of
resp
ond
ents
agr
eein
g
42
Forest and w ildlife conservat ion
8%
To protect against erosion and floods
10%
Water source5%
Clean air3%
Full of non-wood resources
5%
Potential for crops43%
Wood8%
Other2%
No opinion16%
Forest and wildlife conservation
35%
To protect against erosion and floods
7%
Water source, clean air6%
Resource for government to sell
8%
Potential for crops12%
Other2%
No opinion30%
Department of Forestry
28%
Local government11%
Government and the people
13%
Local people13%
No opinion35%
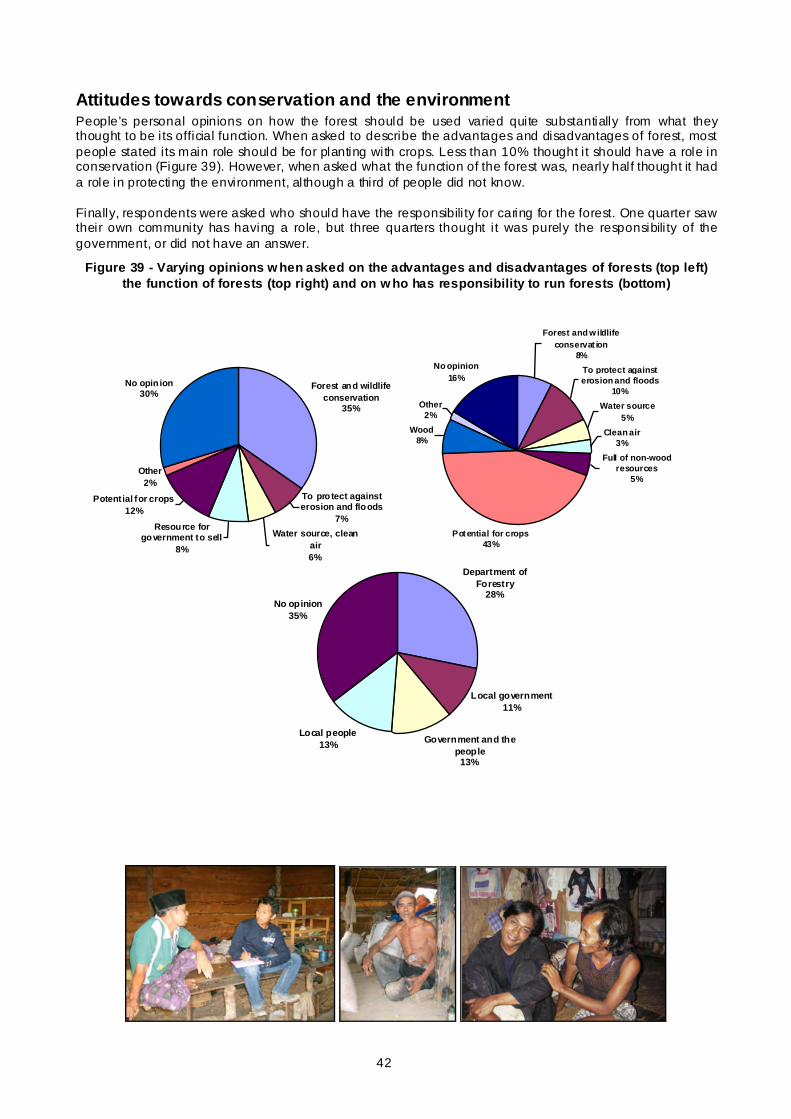
Attitudes towards conservation and the environment People’s personal opinions on how the forest should be used varied quite substantially from what they thought to be i ts official function. When asked to describe the advantages and disadvantages of forest, most people stated i ts main role should be for planting with crops. Less than 10% thought i t should have a role in conservation (Figure 39). However, when asked what the function of the forest was, nearly half thought it had a role in protecting the environment, although a third of people did not know. Finally, respondents were asked who should have the responsibili ty for caring for the forest. One quarter saw their own community has having a role, but three quarters thought i t was purely the responsibili ty of the government, or did not have an answer.
Figure 39 - Varying opinions w hen asked on the advantages and disadvantages of forests (top left) the function of forests (top right) and on w ho has responsibility to run forests (bottom)
43
Recommendations
A framework for conservation
The importance of a general framework The conservation issues in Bentayan and Dangku are complex with no single, simple solution. Whilst there are several key actions that should be taken immediately (see ‘Priori ty actions’, p50), i t is important that a general framework for tackl ing conservation programmes is developed first, with the priori ty steps contributing to the overall goals. A general approach to conservation around Bentayan and Dangku should take two factors into consideration:
1. Conservation has to be approached at a landscape level. It is not enough to consider only the conservation areas in isolation.
2. The whole range of activities relevant to conservation must be considered. A traditional, protection-based approach has its value, but results are only sustainable if part of a wider programme.
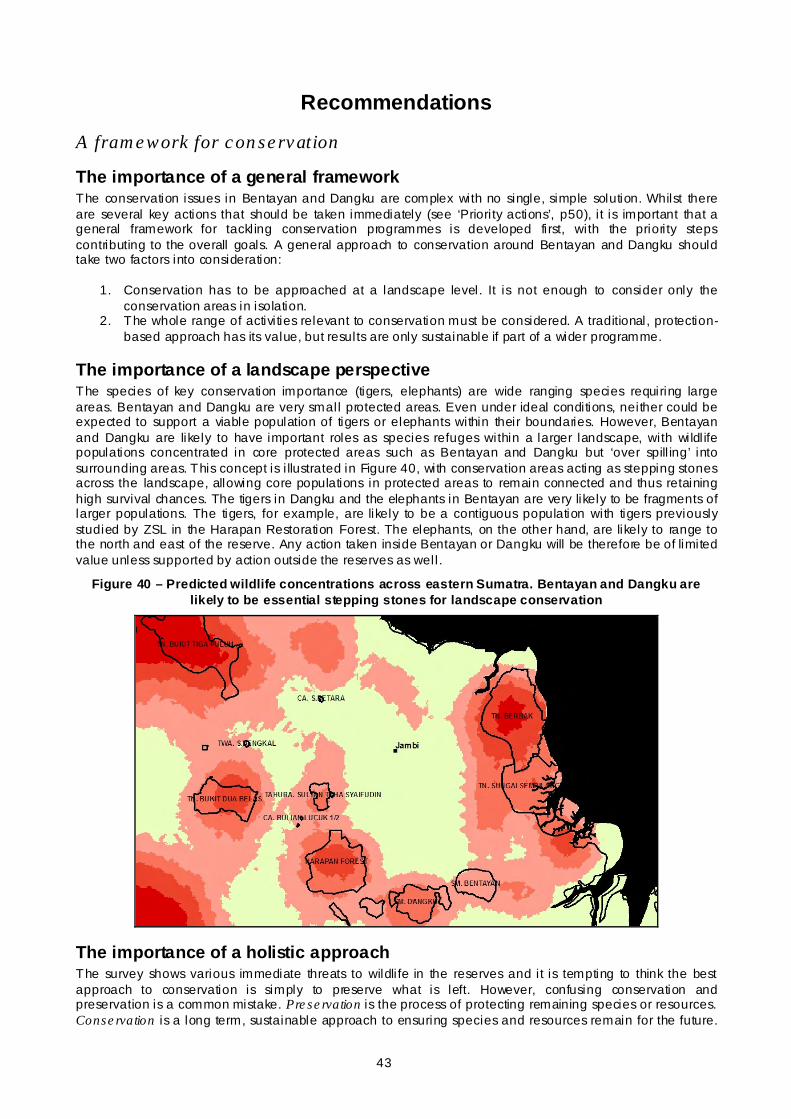
The importance of a landscape perspective The species of key conservation importance (tigers, elephants) are wide ranging species requiring large areas. Bentayan and Dangku are very small protected areas. Even under ideal conditions, neither could be expected to support a viable population of tigers or elephants within their boundaries. However, Bentayan and Dangku are likely to have important roles as species refuges within a larger landscape, with wildl ife populations concentrated in core protected areas such as Bentayan and Dangku but ‘over spill ing’ into surrounding areas. This concept is i llustrated in Figure 40, with conservation areas acting as stepping stones across the landscape, allowing core populations in protected areas to remain connected and thus retaining high survival chances. The tigers in Dangku and the elephants in Bentayan are very likely to be fragments of larger populations. The tigers, for example, are likely to be a contiguous population with tigers previously studied by ZSL in the Harapan Restoration Forest. The elephants, on the other hand, are likely to range to the north and east of the reserve. Any action taken inside Bentayan or Dangku will be therefore be of limited value unless supported by action outside the reserves as well .
Figure 40 – Predicted wildlife concentrations across eastern Sumatra. Bentayan and Dangku are likely to be essential stepping stones for landscape conservation
The importance of a holistic approach The survey shows various immediate threats to wildli fe in the reserves and it is tempting to think the best approach to conservation is simply to preserve what is left. However, confusing conservation and preservation is a common mistake. Preservation is the process of protecting remaining species or resources. Conservation is a long term, sustainable approach to ensuring species and resources remain for the future.

44
Preservation is an important component of conservation, but a robust conservation framework needs a more holistic approach than just concentrating on preserving what is left. A good conservation strategy should therefore cover the following three arenas:
• Information: Identifying the ecological and sociological issues at the root of the problems and thus priori ties, as well as monitoring change and evaluating success
• Stakeholder influence: Working with anyone who has an interest or influence on the area (local communities, local business, government) in order to reduce impacts and support change.
• Protection: Protecting the remaining habitat and wildli fe and breaking the chain of encroachment:
Information-based action Extend w ildlife / threat surv eys beyond the conserv ation areas
• Surveys have been carried out within the conservation areas but nothing is known of conservation status outside the reserves.
• It is almost definite that the larger species – tigers and elephants in particular – also live outside the conservation areas.
• Identifying the species occurring outside the reserves, and the habitats they occupy is vital for designing a landscape level conservation plan.
Extend w ildlife surveys to other taxa
• Medium to large mammals and key threats occupying the conservation areas have been identified in this report.
• It would also be valuable to carry out surveys of other taxa, including plants, birds, repti les, amphibians, small and arboreal mammals and insects.
Identify how much wildlife remains / Quantify threats
• The surveys carried out thus far identified presence / absence of key species and threats, with some measures of relative abundance
• Identifying densities of key species would be more difficult, and take more time, but for selected species would be very valuable
• Tigers and elephants, for example, will be living in small numbers. Identifying all individuals would allow detailed monitoring of population changes, and also be a valuable tool against hunting.
Identify the key env ironmental factors allow ing surv ival or associated w ith threats
• Whilst wildli fe surveys identify where species exist they don’t necessari ly identify why. Often wildl ife distribution is not clear to explain and does not necessari ly follow the most pristine habitats.
• Modell ing wildli fe values against a range of potential explanatory variables wil l allow key landscape features to be identified and protected. It will also allow wildli fe presence in un-surveyed areas to be predicted.
Identify how habitats can be managed to encourage conservation
• Changing habitats to facil itate conservation is a poorly understood field. In many cases just leaving areas to rehabili tate naturally is the best and cheapest option.
• However, outside conservation areas more effort is required to manage habitats for conservation. • Information is therefore required on how to make corridors to retain connectivity across the
landscape – how wide should they be, which species benefit, how they should be managed?
Identify w ildlife behav ioural traits facilitating surv ival • As well as environmental factors, wildli fe behaviour may also be important to explain distribution
across the landscape. For example, detailed knowledge on tiger behaviour may show positive or negative associations with human activity, unusual feeding patterns or other factors that will be too small to be picked up by general surveys.
• Wildli fe behaviour, especially for cryptic species such as tigers and elephants, general ly needs complicated and expensive equipment such as radio collars, although some research can be done with camera traps and other methods.

45
Monitor changes in w ildlife / threat patterns ov er time • Monitoring both wildl ife and threats is e ssential both to shift priorities as conditions change but also
to monitor the effects of any actions taken • Proving successful intervention justi fies the effort and enables further fundraising. Identifying failures
allow plans to be adjusted until success is achieved • Monitoring can be carried out continuously at a low level e.g. patrols can record wildli fe signs and
monitor relative abundance, or camera traps can be installed at low density and photo trapping rates monitored.
• Monitoring can also be carried out less frequently but more intensively, for example it would be recommended to repeat the survey described in this report every year using the same methods to get a series of detailed snapshots.
Figure 41 - Surveys need to be repeated annually by the BKSDA, using methods as similar as possible to this report to ensure comparability
Stakeholder-based action Identify local stakeholders
• Identifying who the key stakeholders are (local communities, companies controlling commercial concessions, government planning and protection bodies) is a vital first step.
• Theoretical ly stakeholders wil l primarily be those influencing land outside the reserves, however, local communities will probably be an important stakeholder within the reserves too i f they enter for resources or are affected by wildli fe coming out.
• The primary source of information wil l be governmental maps of concession holders, vi llage locations and statistics and regional plans.
Target gov ernmental stakeholders
• Governmental stakeholders are a crucial group to obtain support from. • Regional government is particularly important, and needs to be shown the results of the surveys and
persuaded that Bentayan and Dangku are important areas with a future, and that their future depends on appropriate action in the surrounding landscape.
• The police are another important body for supporting protection activities and law enforcement.
Target commercial stakeholders • Depending on the land use type, company policy and management decisions, commercial
concession holders can have a highly negative, neutral, or positive impact on local conservation. • A priori ty step is to identify companies that are having a negative impact, particularly those that are
doing so by breaching the law, such as companies that encroach into the conservation areas, or use outlawed methods such as burning for land clearance.
• After this, concentration can be turned to turning poor or neutral companies into companies that can have a positive effect on conservation.
• This is feasible because: o Commercial groups often hold concessions covering large amounts of land control led by
relatively few people, therefore relatively few decisions are required to make large changes. o Not al l businesse s necessari ly have a large negative impact on the environment. Forestry
and extraction industries can have a relatively small ‘environmental footprint’ i f managed
46
well . Even those with a large footprint, such as oi l palm, have options available for reducing this.
o Most large companies already have an ethical code of practice in place, and growing public awareness of environmental issues means that companies are increasingly considering environmental impacts in their business plans.
o Businesses have a strong potential for making a difference. Often budgets are higher than those available to the authorities with the responsibil ity for conservation and businesse s can also use experience on efficient project planning and implementation to ensure resources are used well .
• With a growing will to take action, the primary stumbling block is often lack of information about what needs to be done.
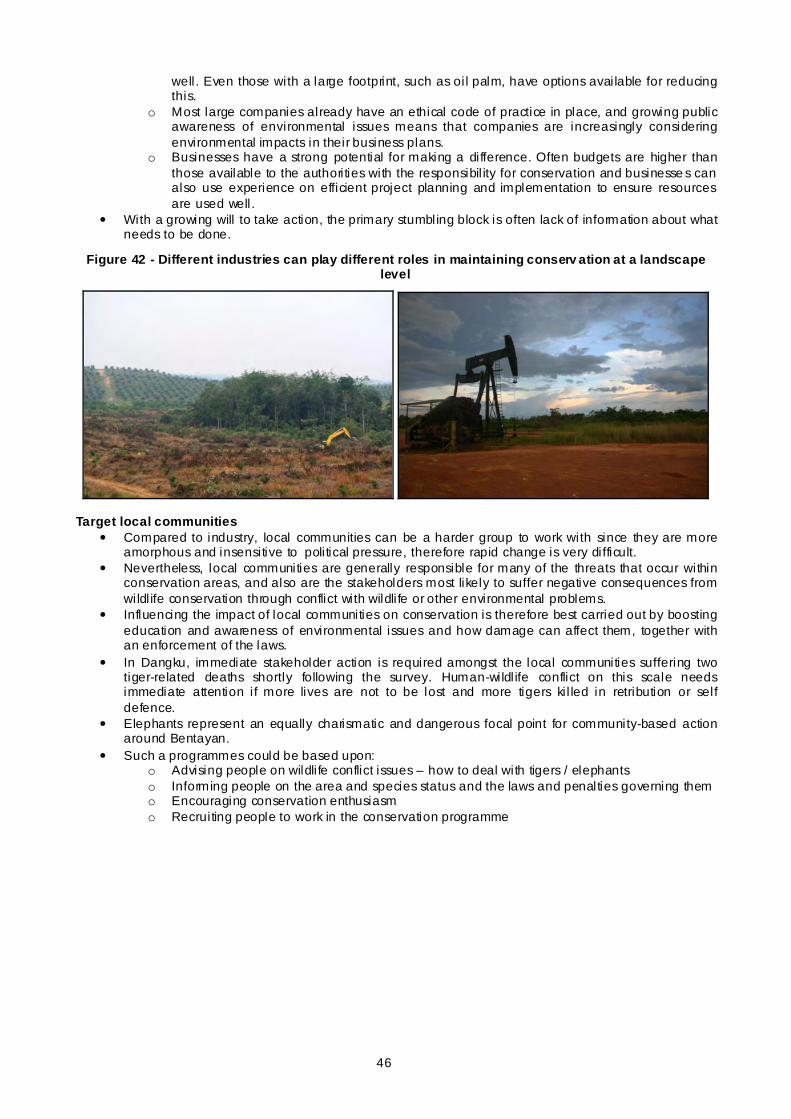
Figure 42 - Different industries can play different roles in maintaining conserv ation at a landscape level
Target local communities
• Compared to industry, local communities can be a harder group to work with since they are more amorphous and insensitive to poli tical pressure, therefore rapid change is very difficult.
• Nevertheless, local communities are generally responsible for many of the threats that occur within conservation areas, and also are the stakeholders most likely to suffer negative consequences from wildl ife conservation through conflict with wildli fe or other environmental problems.
• Influencing the impact of local communities on conservation is therefore best carried out by boosting education and awareness of environmental issues and how damage can affect them, together with an enforcement of the laws.
• In Dangku, immediate stakeholder action is required amongst the local communities suffering two tiger-related deaths shortly following the survey. Human-wildl ife conflict on this scale needs immediate attention i f more lives are not to be lost and more tigers ki l led in retribution or self defence.
• Elephants represent an equally charismatic and dangerous focal point for community-based action around Bentayan.
• Such a programmes could be based upon: o Advising people on wildli fe conflict issues – how to deal with tigers / elephants o Informing people on the area and species status and the laws and penalties governing them o Encouraging conservation enthusiasm o Recruiting people to work in the conservation programme

47
Figure 43 - Tigers (in Dangku) and elephants (in Bentayan) are ideal flagship species around w hich conservation awareness and action campaigns can be focussed
Figure 44 - Woman w ith store house destroyed by elephants in Bentayan. Help and advice on w ildlife conflict is essential
48
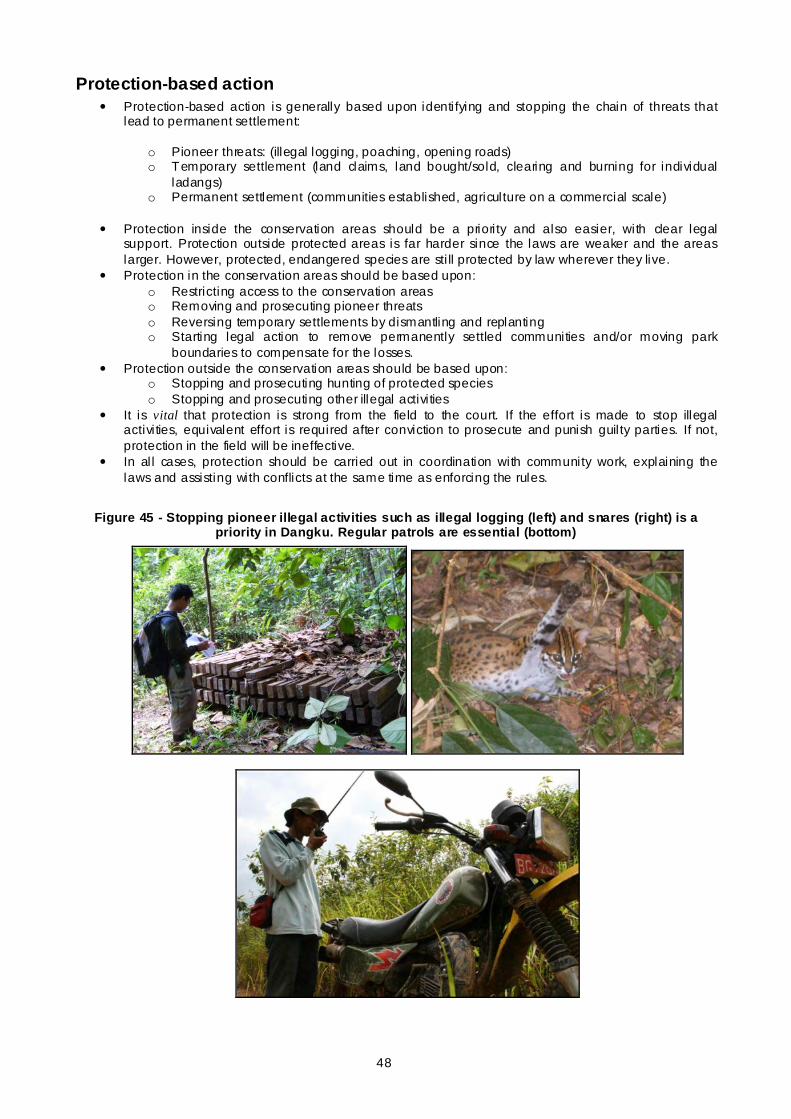
Protection-based action • Protection-based action is generally based upon identifying and stopping the chain of threats that
lead to permanent settlement:
o Pioneer threats: (illegal logging, poaching, opening roads) o Temporary settlement (land claims, land bought/sold, clearing and burning for individual
ladangs) o Permanent settlement (communities established, agriculture on a commercial scale)
• Protection inside the conservation areas should be a priori ty and also easier, with clear legal
support. Protection outside protected areas is far harder since the laws are weaker and the areas larger. However, protected, endangered species are sti ll protected by law wherever they live.
• Protection in the conservation areas should be based upon: o Restricting access to the conservation areas o Removing and prosecuting pioneer threats o Reversing temporary settlements by dismantling and replanting o Starting legal action to remove permanently settled communities and/or moving park
boundaries to compensate for the losses. • Protection outside the conservation areas should be based upon:
o Stopping and prosecuting hunting of protected species o Stopping and prosecuting other illegal activities
• It is vital that protection is strong from the field to the court. If the effort is made to stop illegal activities, equivalent effort is required after conviction to prosecute and punish guil ty parties. If not, protection in the field will be ineffective.
• In al l cases, protection should be carried out in coordination with community work, explaining the laws and assisting with conflicts at the same time as enforcing the rules.
Figure 45 - Stopping pioneer illegal activities such as illegal logging (left) and snares (right) is a priority in Dangku. Regular patrols are essential (bottom)

49
Required capacity for implementation Planning a framework for conservation and identifying priori ty steps is pointless i f the agency responsible for implementation does not have the required capacity for implementation. At present, the BKSDA South Sumatra is the organisation responsible for conservation inside and outside the reserves of Bentayan and Dangku, as well as across every other non-national park site in the province. Staff quali ty at BKSDA is good, as evidenced by staff conducting surveys, but the BKSDA does not have the full resources required to implement the recommendations in this report. The key areas where BKSDA requires additional capacity bui lding are:
Field capacity o At present, funding is not available for efficient protection of either reserve. o Infrastructure is urgently required at both sites, improving the central base station and instal ling
manned portals at every access point within the reserves. o Guard posts also require back up, therefore sufficient staff need to be on stand by at the base for
responses to border disputes. o Sufficient capacity is also required for regular patrolling and monitoring of both reserves. A
recommended minimum would be three teams of four for each reserve, each fully field equipped, with two within the field at any one time.
Survey equipment o Patroll ing and monitoring can be much more efficient with just a few small i tems of equipment o GPS are essential for navigation and accurate recording of findings. o Camera traps are cheap ($100 to buy, $10/month to run) and just a small number can be
permanently installed to allow long term monitoring.
Technical training o Surveys are not technical ly demanding but if not done correctly the information gathered can be
useless o Complete technical training for conducting surveys and using camera traps should be conducted
annually at least.
Mapping o One of the major restrictions at present is the lack of any up to date maps or imagery o Furthermore, the BKSDA has li ttle facili ty to deal with this information i f i t were available o Setting up a small GIS lab, with at least two trained members of staff, and regularly updated imagery
of sufficient scale (at least 30m resolution) will facili tate many of the research, monitoring and protection activities.
Law enforcement o At present the BKSDA do not have the resources to deal with significant threats, such as organised
il legal logging. Building law enforcement capacity is essential if such threats are to be countered. o This requires teams that are sufficiently informed on their rights and powers, together with back-up
from a field and head office if required. o This also requires capacity building for the process after arrests are made, to ensure that
prosecutions to lead to convictions.
50
Priority actions Once a broad framework for conservation in the region has been outlined, and the required capacity to implement identified, the priority steps for action should be identified for immediate action. Ideally actions should be implemented in Dangku and Bentayan together. Of the two areas, Dangku has the strongest conservation potential, and was the only site with tigers. However, Bentayan is more strongly threatened and was the only site with elephant evidence. Furthermore, i t provides a useful illustration of what Dangku will look l ike in three to five years. As explained in the general recommendations, isolated action in one area is unl ikely to be effective. Therefore, the priority recommendations have been selected from each conservation approach.
Information-based actions
1. Obtain up to date imagery One of the key l imitations of this survey was that the satell ite imagery available was several years out of date which, with rapid clearance rates, meant they did not represent the situation on the ground. Although the surveys identified areas where wildl ife were definitely present, there is l i ttle power to extrapolate these results to predict other areas of importance within and around the conservation areas without up to date habitat information. Obtaining recent (<1 year) satelli te (or equivalent) imagery of at least 30m resolution and using i t to identify further likely areas of value should therefore be a priori ty.
2. Wildlife and threat surveys outside Bentayan and Dangku This report contains most of the information required for immediate action within the conservation areas. However, the surveys did not cover any of the areas outside the conservation areas. Rapid surveys for habitat, wildl ife and threats to the north east of Bentayan and west of Dangku in particular should be carried out as soon as possible, ideally using new imagery to identify priori ty areas for surveying.
3. Establish monitoring programme As a ‘snapshot’ survey, this report can give no information on rates of change. However, the extent of threats recorded would indicate that change was happening quickly. Establishing a monitoring programme would quickly establish baseline information for the sites and highlight any changes, either highl ighting areas where further action is needed or showing the success of other measures introduced. The monitoring programme should be based on continuous, recording of wildli fe and threats from camera traps and combined protection / monitoring patrols. However, i t should also entail repeating the intensive survey described in this report on an annual basis to ensure there is an annual benchmark for comparison.
Stakeholder influence–based actions
4. Establish community conservation education and awareness scheme One of the findings of the report was that public awareness of conservation awareness issue s was low. Many people encroached into the conservation areas because they did not believe the areas sti ll had value, whilst wildl ife poaching in Dangku was conducted openly and without fear of prosecution. At the same time, serious human-wildl ife conflict was recorded in both areas. An education and awareness scheme could be used to tackle both issues, firstly informing
5. Identify key stakeholders around the conservation areas If conservation is to be identified beyond the boundaries of the conservation areas, the key sta keholders need to be identified. This will include vil lages, but also industry holding concessions in the area. Once key stakeholders have been identified then a plan can be made for approaching them and forming conservation partnerships.
6. Raise conservation area profile At present, Dangku and Bentayan are li ttle known conservation areas. Many people in the wider area have never heard of them. The results of this survey have shown both areas are of high interest for conservation and include a number of good photographs of high profile species. These results should be publicised widely in local and national press to e stablish the importance of the areas and increase support in protecting them for the future.
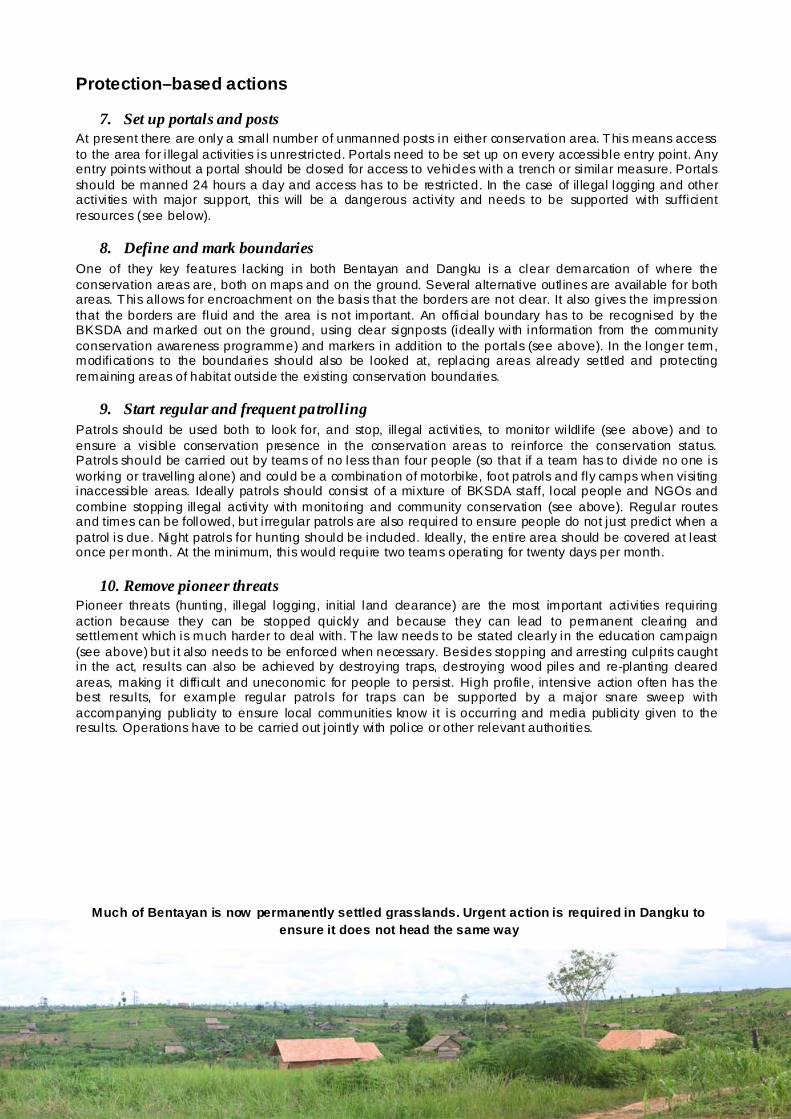
51
Protection–based actions
7. Set up portals and posts At present there are only a small number of unmanned posts in either conservation area. This means access to the area for i llegal activities is unrestricted. Portals need to be set up on every accessible entry point. Any entry points without a portal should be closed for access to vehicles with a trench or similar measure. Portals should be manned 24 hours a day and access has to be restricted. In the case of il legal logging and other activities with major support, this will be a dangerous activity and needs to be supported with sufficient resources (see below).
8. Define and mark boundaries One of they key features lacking in both Bentayan and Dangku is a clear demarcation of where the conservation areas are, both on maps and on the ground. Several alternative outl ines are available for both areas. This allows for encroachment on the basis that the borders are not clear. It also gives the impression that the borders are fluid and the area is not important. An official boundary has to be recognised by the BKSDA and marked out on the ground, using clear signposts (ideally with information from the community conservation awareness programme) and markers in addition to the portals (see above). In the longer term, modifications to the boundaries should also be looked at, replacing areas already settled and protecting remaining areas of habitat outside the existing conservation boundaries.
9. Start regular and frequent patrolling Patrols should be used both to look for, and stop, illegal activities, to monitor wildl ife (see above) and to ensure a visible conservation presence in the conservation areas to reinforce the conservation status. Patrols should be carried out by teams of no less than four people (so that if a team has to divide no one is working or travelling alone) and could be a combination of motorbike, foot patrols and fly camps when visiting inaccessible areas. Ideally patrols should consist of a mixture of BKSDA staff, local people and NGOs and combine stopping illegal activity with monitoring and community conservation (see above). Regular routes and times can be followed, but irregular patrols are also required to ensure people do not just predict when a patrol is due. Night patrols for hunting should be included. Ideally, the entire area should be covered at least once per month. At the minimum, this would require two teams operating for twenty days per month.
10. Remove pioneer threats Pioneer threats (hunting, illegal logging, initial land clearance) are the most important activities requiring action because they can be stopped quickly and because they can lead to permanent clearing and settlement which is much harder to deal with. The law needs to be stated clearly in the education campaign (see above) but i t also needs to be enforced when necessary. Besides stopping and arresting culprits caught in the act, results can also be achieved by destroying traps, destroying wood piles and re-planting cleared areas, making i t difficult and uneconomic for people to persist. High profile, intensive action often has the best results, for example regular patrols for traps can be supported by a major snare sweep with accompanying publicity to ensure local communities know it is occurring and media publicity given to the results. Operations have to be carried out jointly with pol ice or other relevant authorities.
Much of Bentayan is now permanently settled grasslands. Urgent action is required in Dangku to ensure it does not head the same way
52
Rekomendasi yang diprioritaskan Ketika kerangka kerja konservasi yang lebih luas pada level bentang alam sedang direncanakan, maka langkah-langkah prioritas untuk aksi harus diidentifikasi. Seperti yang telah dijelaskan dalam rekomendasi umum, aksi terpisah yang hanya dilakukan dalam satu kawasan sepertinya tidak akan efekti f. Oleh karenanya, rekomendasi-rekomendasi proiri tas telah dipil ih dari setiap pendekatan konservasi yang ada.
Kegiatan yang didasarkan pada informasi
1. Mendapatkan citra satelit terkini Salah satu keterbatasan dari survey ini adalah usia citra sateli t yang tersedia telah usang beberapa tahun, yang mana dengan laju pembukaan lahan yang cepat, maka citra sateli t tersebut tidak mewakili si tuasi terkini di lapangan. Meskipun dari survey telah teridentifikasi areal-areal dimana satwa liar pasti berada, namun tanpa informasi habitat yang terkini tidak ada kekuatan untuk mengekstrapolasi hasi l survey, untuk dapat memprediksi kawasan-kawasan penting lainnya di dalam dan sekitar kawasan konserva si. Jadi, mendapatkan citra sateli t (atau yang setara) terkini (<1 tahun) dengan resolusi paling tidak 30m, serta menggunakannya dalam mengidentifikasi nilai kawasan lebih lanjut harus diproiri taskan.
2. Survey satwa liar dan ancamannya di luar Bentayan dan Dangku Laporan ini memuat informasi yang paling diinginkan untuk aksi segera di dalam kawasan konservasi. Namun, survey ini tidak mencakup kawasan-kawa san di luar kawa san konserva si. Survey cepat khususnya di kawasan-kawasan sebelah timur laut Bentayan dan sebelah barat Dangku untuk mengetahui kondisi habitat, satwa liar serta ancaman-ancamannya harus di lakukan secepat mungkin, yang idealnya menggunakan citra sateli t yang baru untuk mengidentifikasi areal priori tas untuk disurvey.
3. Mendirikan program pemantauan Sebagai hasil survey permukaan saja, laporan ini tidak dapat memberikan informasi tentang laju perubahan. Namun demikian, ancaman-ancaman yang luas yang tercatat dapat mengindikasikan bahwa perubahan terjadi dengan sangat cepat. Mendirikan satu program pemantauan akan dengan cepat membentuk informasi dasar bagi kawasan-kawasan tersebut, serta menggaris-bawahi setiap perubahan, baik i tu areal-areal dimana aksi lebih lanjut diperlukan atau menunjukkan kesu ksesan dari kegitan-kegiatan lain yang telah di laksanakan. Program pemantauan harus di laksanakan secara kontinyu, mencatat satwa liar dan ancamannya melalui kamera trap serta dikomboinasikan dengan patrol i perlindungan /pemantauan. Namun demikian, harus juga melakukan pengulangan survey intensif setiap tahun yang telah dijelaskan dalam laporan ini, untuk memastikan bahwa didapat hasil tahunan untuk dibandingkan.
Kegiatan yang didasarkan pada kerja sama dengan masyarakat
4. Mendirikan pendidikan konservasi kemasyarakatan dan skema penyadartahuan Salah satu temuan dalam laporan adalah bahwa isu ke sadartahuan masyarakat tentang konservasi rendah. Banyak orang merambah ke dalam kawasan konservasi karena mereka tidak percaya bahwa kawasan masih memiliki ni lai, bahkan perburuan liar di dalam kawasan Dangku dilakukan secara terang-terangan dan tidak takut terhadap tuntutan. Pada saat yang sama, konflik antara satwa liar dengan manusia yang serius tercatat terdapat di dalam kedua kawasan. Satu skema pendidikan dan penyadartahuan dapat digunakan untuk mengatasi kedua isu tersebut.
5. Mengidentifikasi pihak kunci di sekitar kawasan konservasi Apabila konservasi akan dilaksanakan di luar batas-batas kawasan kon servasi, maka pihak-pihak kunci perlu diidentifikasi. Ini akan termasuk desa-desa, tetapi juga industri yang memiliki konsesi kawasan. Ketika pihak-pihak kunci telah diidentifikasi kemudian satu rencana dapat dibuat untuk mendekatinya serta membentuk suatu kemitraan konservasi.
6. Meningkatkan profil kawasan konservasi Saat ini, sebagai kawasan konservasi Dangku dan Bentayan kurang dikenal, dan umumnya masyarakat luas belum mengetahuinya. Hasil dari survey ini telah menunjukkan bahwa kedua kawasan memiliki ketertarikan yang tinggi bagi konservasi, dan menghasilkan sejumlah foto species kharismatik. Hasil-hasil tersebut layaknya harus dipublikasikan secara luas melalui media lokal dan nasional, untuk menginformasikan bahwa

53
kedua kawasan memiliki kepentingan, serta meningkatkan dukungan untuk perl indungan kedua kawasan di masa yang akan datang.
Kegiatan yang didasarkan pada perlindungan
7. Membangun portal dan pos jaga Saat ini hanya ada sedikit pos jaga yang tidak terawat di kedua kawasan konservasi. Ini artinya akse s akti fitas illegal ke dalam kawasan tidak terbatasi. Portal-portal perlu dibangun pada setiap jalan masuk ke dalam kawasan. Setiap jalan masuk yang tidak berportal harus ditutup bagi akses kendaraan dengan menggunakan parit atau sejenisnya. Portal harus di jaga 24 jam setiap hari dan akse s harus terbatas. Dalam ka sus penebangan liar dan kegiatan i llegal lainnya yang memiliki dukungan kuat, hal ini akan menjadi akti fitas yang berbahaya dan perlu didukung oleh sumber daya yang memadai (lihat di bawah).
8. Membatasi dan menandai batas Salah satu satu kelemahan utama di kawasan Bentayan dan Dangku adalah tidak jelasnya tanda-tanda batas kawa san konservasi, baik di atas peta maupun di lapangan. Terdapat beberapa peta yang berbeda untuk kedua kawasan. Hal ini memungkinkan bagi para perambah berdalih bahwa batas kawasan tidak jelas. Hal ini juga memberikan kesan bahwa batas kawasan berubah-ubah dan tidak penting. Suatu batas resmi harus ditentukan/dikenali oleh BKSDA dan harus ditandai di lapangan, menggunakan papan nama-papan nama yang jelas (idealnya dengan informasi dari program penyadartahuan konservasi kemasyarakatan), serta penanda sebagai tambahan pada portal (lihat di atas). Dalam jangka waktu yang lebih panjang, modifikasi pada batas harus juga dilihat, yaitu dengan mengganti areal yang sudah dimukimi masyarakat serta melindungi kawasan habitat yang tersisa di luar batas kawasan konservasi yang ada.
9. Memulai patroli rutin dan sering Patroli harus digunakan baik untuk mencari dan menghentikan akti fi tas-akti fi tas i llegal, untuk memantau satwa l iar (l ihat di atas) dan untuk memastikan keberadaan kegiatan konservasi di kedua kawasan untuk menegakkan status konservasi. Patroli harus dilakukan oleh tim yang tidak kurang dari empat orang (sehingga apabila anggota tim harus dibagi tidak seorangpun bekerja atau berjalan sendirian) dan dapat mengkombinasikan antara patroli jalan kaki, menggunakan motor, dan berkemah apabila sedang berpatroli di daerah yang tidak ada akse s. Idealnya patrol i harus terdiri dari gabungan antara staf BKSDA, masyarakat lokal dan LSM, serta mengkombinasikan antara menghentikan akti fi tas i llegal dengan pemantauan dan konserva si kemasyarakatan (lihat di atas). Jalur-jalur dan waktu yang reguler dapat dikuti , tetapi patroli yang sifatnya dadakan juga diharapkan untuk memastikan masyarakat tidak dapat memprediksi kapan patroli dilakukan. Patroli terhadap perburuan l iar di malam hari juga harus dilaksanakan. Idealnya, seluruh kawasan harus dilewati sedikitnya satu kali setiap bulan. Pada tahap minimal, maka akan dibutuhkan dua tim yang beroperasi selama 20 hari setiap bulam.
10. Memberantas ancaman-ancaman pionir Ancaman-ancaman pionir (perburuan, penebangan liar, pembukaan lahan awal) merupakan akti fi tas-akti fitas paling penting yang mengharapkan aksi, karena akti fi tas-akti fitas tersebut dapat dihentikan dengan cepat dan karena akti fi tas-akti fi tas tersebut juga dapat mengarah pada pembukaan lahan permanen serta pemukiman, yang mana akan lebih suli t untuk mengatasinya. Hukum harus dinyatakan dengan jelas dalam kampanye pendidikan (lihat di atas) tetapi juga perlu ditegakkan bila diperlukan. Selain menghentikan dan menahan para dalang yang tertangkap dalam operasi, hasil juga dapat dicapai dengan menghancurkan jerat-jerat, menghancurkan balok-balok kayu dan menanam kembali kawasan yang gundul, akan membuat sul i t dan tidak ekonomis bagi masyarakat yang tetap melakukannya. Aksi yang intensif dan berwibawa sering membuahkan hasil yang terbaik, sebagai contoh patroli rutin untuk mencari jerat satwa dapat didukung oleh penyisiran jerat dengan didampingi oleh publisitas untuk memastikan komunitas lokal mengetahuinya bahwa hal ini ada, dan pubikasi media diberikan hasilnya. Operasi harus di laksanakan bersama dengan polisi dan pihak yang berkepentingan lainnya.
Sebagian besar Bentayan sudah jadi alang alang. Dangku harus dilindungi. Kalau tidak, hal yang sama akan terjadi

54
Appendices
Measuring habitat structure Habitat structure was recorded using the Land Cover Classification System (LCCS). This is carried out by moving off the track into a representative sample of the surrounding habitat and recording the dominant vegetation of the upper storey and under-storey (if present) within a 10m radius using a hierarchical key to give a final binomial habitat classification (Figure 46) Classifications are always written hierarchically, thus an area with an upper storey of dense, tall trees and a lower storey of scattered ferns would be classed as ‘A/I’, not I/A. A shrubby area with no clear under-storey would be classed as just ‘E’.
Figure 46 - Land Cover Classification System (LCCS)
Step 1 (Vegetation type)
Step 2 (Vegetation type)
Step 3 (Cover estimation)
Key
closed >70% A open 20 - 70% B Trees (>5m)
sparse 1 - 20% C closed >70% D
open 20 - 70% E
Woody
Shrubs (<5m)
sparse 1 - 20% F
closed >70% G
open 20 - 70% H Forbs (fern-l ike)
sparse 1 - 20% I
closed >70% J open 20 - 70% K
Herbaceous
Graminoids (grass-l ike)
sparse 1 - 20% L

55
Calculating adjusted species richness In the species richness test s a Jacknife estimator (Burnham and Overton, 1979) of the M(h) model (Otis et al., 1978; White et al., 1982; Rexstad and Burnham, 1991), as implemented in the program SPECRICH2 (Hines, 1999), was used to estimate species richness for the overall si te and for each of the three dominant land cover classe s. Model, M(h), was developed for capture-recapture data derived from closed animal populations and is one of a suite of models implemented in programme CAPTURE (Otis et al., 1978; Rexstad and Burnham, 1991). Species richness can be computed using any appropriate model, but the use of M(h) follows (Boulinier et al., 1998a) and (Cam et al., 2000) and fi ts with the heterogeneity in species detection probabili ty reported here (Table 5). Species detection histories were compiled from the walked transects conducted in each of the 400 hectare survey cells. The number of species observed on exactly 1, 2. 3,…K survey cells provide the observed frequencies required to estimate species richness with the jacknife estimator for model M(h) (Burnham and Overton, 1979; Cam et al., 2000). Boulinier, T ., Nichols, J. D., Sauer, J. R., Hines, J. E. and Pollock, K. H. (1998a). Estimating species richness: the importance of heterogeneity in species detectabili ty. Ecology 79: 1018-1028.
Burnham, K. P. and Overton, W. S. (1979). Robust estimation of population size when capture probabili ties vary among animals. Ecology 60: 927-936.
Cam, E., Nichols, J. D., Sauer, J. R., Hines, J. E. and Flather, C. H. (2000). Relative species richness and community completeness: avian communities and urbanization in the mid-Atlantic states. Ecological Applications 10: 1196-1210.
Hines, J. E. (1999). SPECRICH2: Species richness estimation from species presence-absence data on multiple sample sites or occasions using model M(h) from program CAPTURE. USGS-PWRC.
Maddox, T. M., Priatna, D., Gemita, E. and Salampessy, A. (2007). Wildli fe conservation and oil palm. In ZSL Conservation Reports. London: Zoological Society of London.
Otis, D. L., Burnham, K. P., White, G. C. and Anderson, D. R. (1978). Statistical inference from capture data on closed animal populations. Wildli fe Monographs 62.
Rexstad, E. and Burnham, K. P. (1991). User's guide for interactive program CAPTURE. Abundance estimation of closed animal populations. Fort Collins, Colorado, USA: Colorado State University.
White, G. C., Anderson, D. R., Burnham, K. P. and Otis, D. L. (1982). Capture-recapture and removal methods for sampling closed populations. Los Alamos National Laboratory Publication.
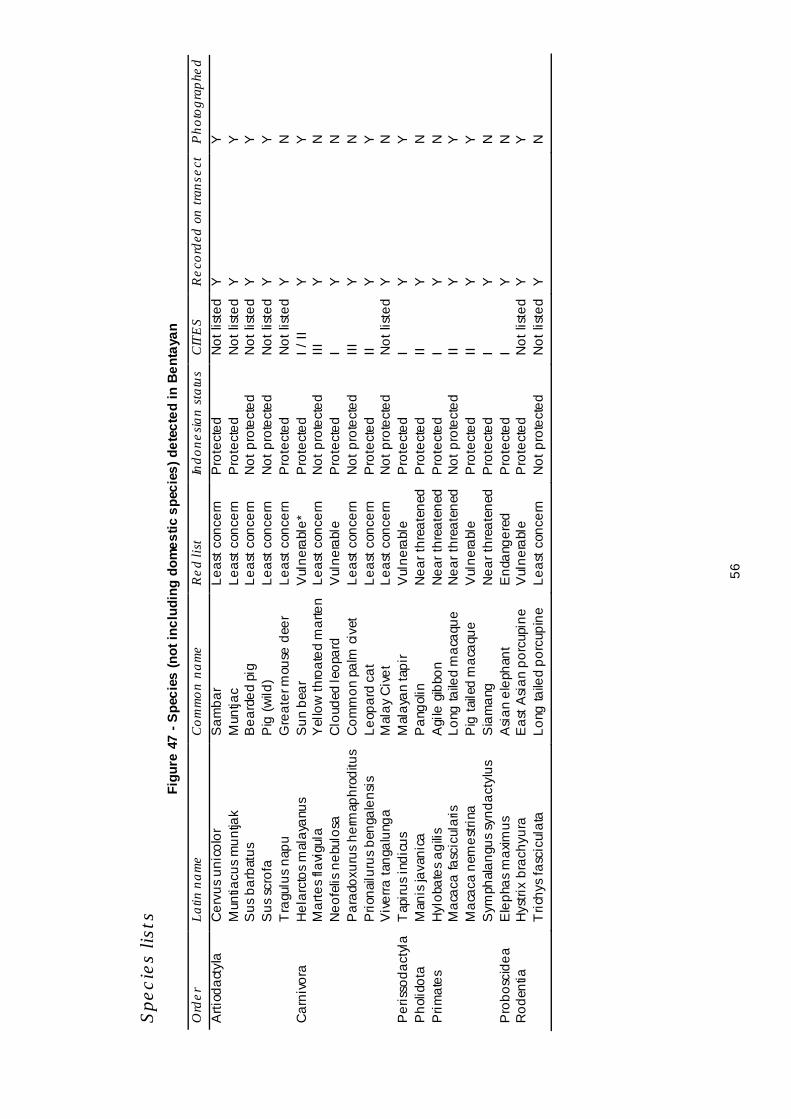
56
Spe
cies
list
s Fi
gure
47
- Spe
cies
(not
incl
udin
g do
mes
tic s
peci
es) d
etec
ted
in B
enta
yan
Ord
er
Latin
nam
e C
omm
on n
ame
Red
list
In
done
sian
stat
us
CIT
ES
R
ecor
ded
on tr
anse
ct
Pho
togr
aphe
d A
rtiod
acty
la
Cer
vus
unic
olor
S
amba
r Le
ast c
once
rn
Pro
tect
ed
Not
list
ed
Y
Y
M
untia
cus
mun
tjak
Mun
tjac
Leas
t con
cern
P
rote
cted
N
ot li
sted
Y
Y
Sus
bar
batu
s B
eard
ed p
ig
Leas
t con
cern
N
ot p
rote
cted
N
ot li
sted
Y
Y
Sus
scr
ofa
Pig
(wild
) Le
ast c
once
rn
Not
pro
tect
ed
Not
list
ed
Y
Y
T
ragu
lus
napu
G
reat
er m
ouse
dee
r Le
ast c
once
rn
Pro
tect
ed
Not
list
ed
Y
N
Car
nivo
ra
Hel
arct
os m
alay
anus
S
un b
ear
Vul
nera
ble*
P
rote
cted
I /
II
Y
Y
M
arte
s fla
vigu
la
Yel
low
thro
ated
mar
ten
Leas
t con
cern
N
ot p
rote
cted
III
Y
N
Neo
felis
neb
ulos
a C
loud
ed le
opar
d V
ulne
rabl
e P
rote
cted
I
Y
N
P
arad
oxur
us h
erm
aphr
oditu
s C
omm
on p
alm
civ
et
Leas
t con
cern
N
ot p
rote
cted
III
Y
N
Prio
nailu
rus
beng
alen
sis
Leop
ard
cat
Leas
t con
cern
P
rote
cted
II
Y
Y
V
iver
ra ta
ngal
unga
M
alay
Civ
et
Leas
t con
cern
N
ot p
rote
cted
N
ot li
sted
Y
N
P
eris
soda
ctyl
a T
apiru
s in
dicu
s M
alay
an ta
pir
Vul
nera
ble
Pro
tect
ed
I Y
Y
P
holid
ota
Man
is ja
vani
ca
Pan
golin
N
ear t
hrea
tene
d P
rote
cted
II
Y
N
Prim
ates
H
ylob
ates
agi
lis
Agi
le g
ibbo
n N
ear t
hrea
tene
d P
rote
cted
I
Y
N
M
acac
a fa
scic
ular
is
Long
taile
d m
acaq
ue
Nea
r thr
eate
ned
Not
pro
tect
ed
II Y
Y
Mac
aca
nem
estri
na
Pig
taile
d m
acaq
ue
Vul
nera
ble
Pro
tect
ed
II Y
Y
Sym
phal
angu
s sy
ndac
tylu
s S
iam
ang
Nea
r thr
eate
ned
Pro
tect
ed
I Y
N
P
robo
scid
ea
Ele
phas
max
imus
A
sian
ele
phan
t E
ndan
gere
d P
rote
cted
I
Y
N
Rod
entia
H
ystri
x br
achy
ura
Eas
t Asi
an p
orcu
pine
V
ulne
rabl
e P
rote
cted
N
ot li
sted
Y
Y
Tric
hys
fasc
icul
ata
Long
taile
d po
rcup
ine
Leas
t con
cern
N
ot p
rote
cted
N
ot li
sted
Y
N

57
Figu
re 4
8 - S
peci
es (n
ot in
clud
ing
dom
estic
spe
cies
) det
ecte
d in
Dan
gku
Ord
er
Latin
nam
e C
omm
on n
ame
Red
list
In
done
sian
stat
us
CIT
ES
Tr
anse
cts
Pho
tos
Arti
odac
tyla
C
ervu
s un
icol
or
Sam
bar
Leas
t con
cern
P
rote
cted
N
ot li
sted
Y
Y
Mun
tiacu
s m
untja
k M
untja
c Le
ast c
once
rn
Pro
tect
ed
Not
list
ed
Y
Y
S
us s
crof
a P
ig (w
ild)
Leas
t con
cern
N
ot p
rote
cted
N
ot li
sted
Y
Y
Tra
gulu
s na
pu
Gre
ater
mou
se d
eer
Leas
t con
cern
P
rote
cted
N
ot li
sted
Y
N
C
arni
vora
C
uon
alpi
nus
Dho
le
End
ange
red
Pro
tect
ed
II Y
N
Hel
arct
os m
alay
anus
S
un b
ear
Vul
nera
ble*
P
rote
cted
I /
II
Y
Y
M
arte
s fla
vigu
la
Yel
low
thro
ated
mar
ten
Leas
t con
cern
N
ot p
rote
cted
III
Y
N
Neo
felis
neb
ulos
a C
loud
ed le
opar
d V
ulne
rabl
e P
rote
cted
I
Y
N
P
anth
era
tigris
Ti
ger
Crit
ical
ly E
ndan
gere
d P
rote
cted
I
Y
Y
P
arad
oxur
us h
erm
aphr
oditu
s C
omm
on p
alm
civ
et
Leas
t con
cern
N
ot p
rote
cted
III
Y
Y
Par
dofe
lis m
arm
orat
a M
arbl
ed c
at
Vul
nera
ble
Pro
tect
ed
I N
Y
Prio
nailu
rus
beng
alen
sis
Leop
ard
cat
Leas
t con
cern
P
rote
cted
II
Y
Y
V
iver
ra ta
ngal
unga
M
alay
Civ
et
Leas
t con
cern
N
ot p
rote
cted
N
ot li
sted
Y
N
P
eris
soda
ctyl
a T
apiru
s in
dicu
s M
alay
an ta
pir
Vul
nera
ble
Pro
tect
ed
I Y
Y
P
rimat
es
Hyl
obat
es a
gilis
A
gile
gib
bon
Nea
r thr
eate
ned
Pro
tect
ed
I Y
N
Mac
aca
fasc
icul
aris
Lo
ng ta
iled
mac
aque
N
ear t
hrea
tene
d N
ot p
rote
cted
II
Y
Y
M
acac
a ne
mes
trina
P
ig ta
iled
mac
aque
V
ulne
rabl
e P
rote
cted
II
Y
Y
P
resb
ytis
mel
alop
hos
Ban
ded
lang
ur
Nea
r thr
eate
ned
Pro
tect
ed
II Y
N
Sym
phal
angu
s sy
ndac
tylu
s S
iam
ang
Nea
r thr
eate
ned
Pro
tect
ed
I Y
N
R
oden
tia
Hys
trix
brac
hyur
a E
ast A
sian
por
cupi
ne
Vul
nera
ble
Pro
tect
ed
Not
list
ed
Y
N
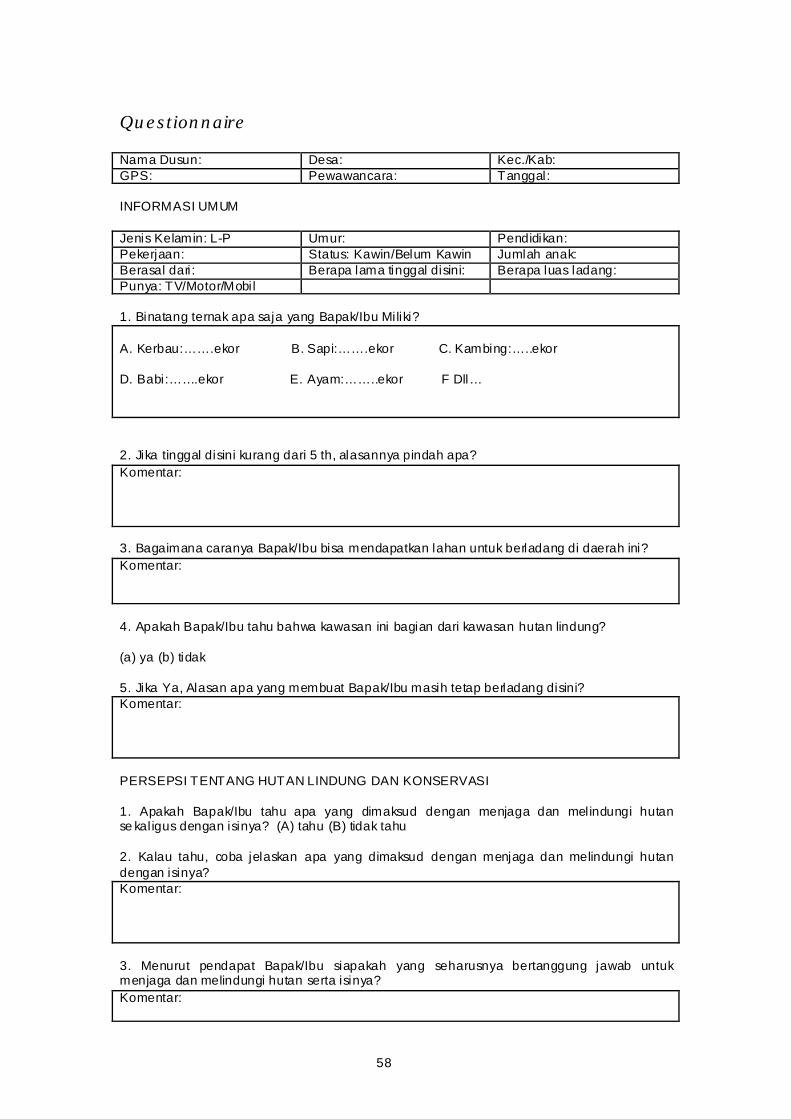
58
Questionnaire Nama Dusun: Desa: Kec./Kab: GPS: Pewawancara: Tanggal: INFORMASI UMUM Jenis Kelamin: L-P Umur: Pendidikan: Pekerjaan: Status: Kawin/Belum Kawin Jumlah anak: Berasal dari: Berapa lama tinggal disini: Berapa luas ladang: Punya: TV/Motor/Mobil 1. Binatang ternak apa saja yang Bapak/Ibu Miliki? A. Kerbau:…….ekor B. Sapi:…….ekor C. Kambing:…..ekor D. Babi:…….ekor E. Ayam:……..ekor F Dll… 2. Jika tinggal disini kurang dari 5 th, alasannya pindah apa? Komentar: 3. Bagaimana caranya Bapak/Ibu bisa mendapatkan lahan untuk berladang di daerah ini? Komentar: 4. Apakah Bapak/Ibu tahu bahwa kawasan ini bagian dari kawasan hutan lindung? (a) ya (b) tidak 5. Jika Ya, Alasan apa yang membuat Bapak/Ibu masih tetap berladang disini? Komentar: PERSEPSI TENTANG HUTAN LINDUNG DAN KONSERVASI 1. Apakah Bapak/Ibu tahu apa yang dimaksud dengan menjaga dan melindungi hutan se kaligus dengan isinya? (A) tahu (B) tidak tahu 2. Kalau tahu, coba jelaskan apa yang dimaksud dengan menjaga dan melindungi hutan dengan isinya? Komentar: 3. Menurut pendapat Bapak/Ibu siapakah yang seharusnya bertanggung jawab untuk menjaga dan melindungi hutan serta isinya? Komentar:
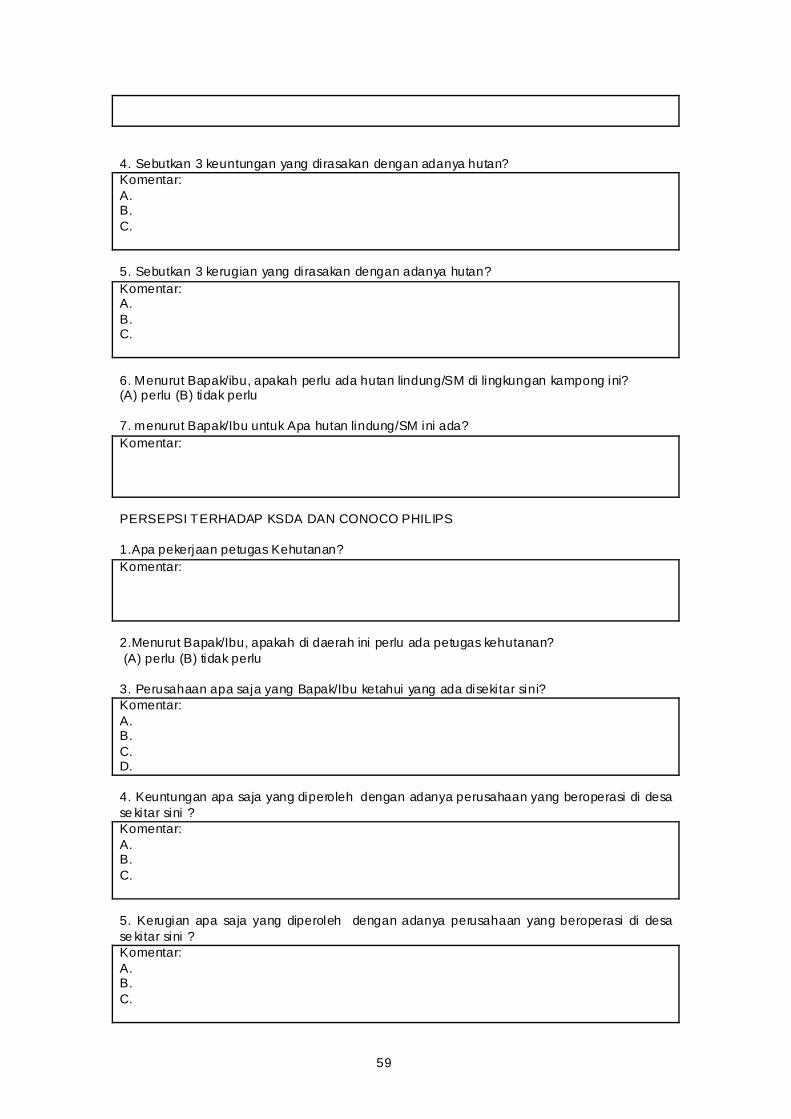
59
4. Sebutkan 3 keuntungan yang dirasakan dengan adanya hutan? Komentar: A. B. C. 5. Sebutkan 3 kerugian yang dirasakan dengan adanya hutan? Komentar: A. B. C. 6. Menurut Bapak/ibu, apakah perlu ada hutan lindung/SM di lingkungan kampong ini? (A) perlu (B) tidak perlu 7. menurut Bapak/Ibu untuk Apa hutan lindung/SM ini ada? Komentar: PERSEPSI TERHADAP KSDA DAN CONOCO PHILIPS 1.Apa pekerjaan petugas Kehutanan? Komentar: 2.Menurut Bapak/Ibu, apakah di daerah ini perlu ada petugas kehutanan? (A) perlu (B) tidak perlu 3. Perusahaan apa saja yang Bapak/Ibu ketahui yang ada disekitar sini? Komentar: A. B. C. D. 4. Keuntungan apa saja yang diperoleh dengan adanya perusahaan yang beroperasi di desa se kitar sini ? Komentar: A. B. C. 5. Kerugian apa saja yang diperoleh dengan adanya perusahaan yang beroperasi di desa se kitar sini ? Komentar: A. B. C.

60
4. Apa keuntungan bagi kampong/dusun dengan adanya perusahaan minyak? Komentar A. B. C. 5. Apa kerugian bagi kampong/dusun dengan adanya perusahaan minyak? Komentar A. B. C. SATWA LIAR 1.Menurut Bapak/Ibu ketahui, hewan liar apa saja yang ada di hutan sekitar kampong ini? Komentar: 2. Tolong kelompokan gambar-gambar hewan berdasarkan ke samaaannya (terserah Bapak/Ibu dalam mengelompokan kesamaan tersebut ) misalnya; buah yang rasanya asam satu kelompok atau makanan yang manis satu kelompok. 3. Menurut yang Bapak/Ibu ketahui, hewan liar apa saja yang ada di hutan sekitar kampong ini yang dilindungi undang-undang (tidak boleh ditangkap/diburu)? Photo
Nama Apa yang Bapak/Ibu ketahui tentang photo tersebut
Dilindungi? Kapan terakhir kal i l ihat langsung/Jejak?
INTERAKSI DENGAN HUTAN DAN PERBURUAN 1.Seberapa sering Bapak/Ibu pergi ke hutan? (A) sering (B) jarang (C) kadang-kadang (D) tidak pernah 2. Untuk tujuan apa Bapak/Ibu pergi ke hutan? Komentar: A B C 3.Pernahkah Bapak/Ibu berburu (A)ya (B) tidak 4. Kalau Ya, kenapa? Komentar :
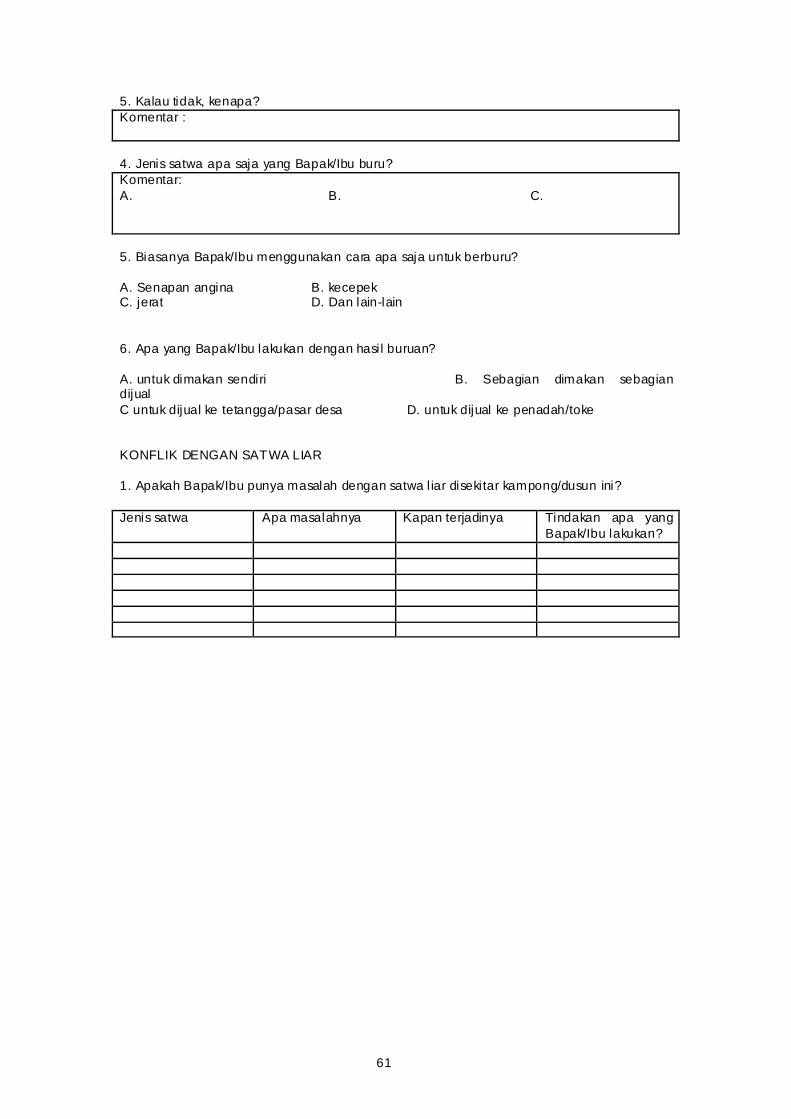
61
5. Kalau tidak, kenapa? Komentar : 4. Jenis satwa apa saja yang Bapak/Ibu buru? Komentar: A. B. C. 5. Biasanya Bapak/Ibu menggunakan cara apa saja untuk berburu? A. Senapan angina B. kecepek C. jerat D. Dan lain-lain 6. Apa yang Bapak/Ibu lakukan dengan hasil buruan? A. untuk dimakan sendiri B. Sebagian dimakan sebagian dijual C untuk dijual ke tetangga/pasar desa D. untuk dijual ke penadah/toke KONFLIK DENGAN SATWA LIAR 1. Apakah Bapak/Ibu punya masalah dengan satwa l iar disekitar kampong/dusun ini? Jenis satwa Apa masalahnya Kapan terjadinya Tindakan apa yang
Bapak/Ibu lakukan?