Embed Size (px)
Citation preview
Rapid Geospatial Assessment
Utilizing GIS to Assess Theories and Hypotheses Associated with Patterns of Global Terrorism
The Pennsylvania State University
GEOG 594A: Culminating Experiences in Geospatial Intelligence
Marshall Martin
May 10, 2011
Introduction
This project acknowledges the problem regarding the use of terrorism by non-state actors
throughout the past half century and seeks to establish patterns in accordance with related
theories posed from the academic and scholarly community. Geographic Information Systems
are utilized to visualize these patterns, specifically that of Redlands, California-based
Environmental Systems Research Institute’s ArcEditor/ArcGIS software suite. The following
sections will discuss the problem, hypotheses, evidence, and final evaluation of recent (since
1970) patterns of global terrorism outside of the Iraq and Afghanistan/Pakistan theaters which
constitute the major or ―mainstream‖ arenas of U.S. armed conflict in the Global War on
Terrorism (GWOT). This attempts to shed light on the truly global manifestation of terrorism
phenomena that it is not limited to a few trouble spots around the world or exclusively to
geographic extents such as the Middle East or Northern Ireland (Rock 2006). Maps used as
evidence in evaluation of the hypotheses are additionally included in the appendices at the
culmination of this report.
Problem Acknowledgement
Problem:
What are the recent patterns of global terrorism outside of the Iraq and Afghanistan theaters of
operation and could this indicate any future trends?
Related Question:
What variables such as seasonal effects, economic variables, and political conditions correlate to
influence these patterns and how can GIS be utilized to identify these relationships in a spatial
context?
Grounding
A. Background
In 2004, the authors of the U.S. State Department’s Patterns of Global Terrorism Report
acknowledged the possible shortcomings of Patterns issues in that the focus on statistical data or
―body counts‖ falls short of fully communicating the issue to U.S. policy-makers (Perl 2004).
Ralph Perl, a U.S. specialist in international affairs asks, “Would there be benefits to Congress
and the counter-terrorism policy community if the focus of Patterns reports was less on
presenting statistics and facts, and more on gaining meaning from the data?” (Perl 2004).
Herein, we will attempt to provide a solution to Perl’s question and what may be interpreted
as a challenge for analysts to provide data that is more meaningful to decision-makers. Other
scholars have brought it upon themselves to answer this question such as Rutgers University
researcher Danielle Rusnak—noting in a 2010 symposium brief that visualization of events helps
to communicate across multiple disciplines what is actually occurring in regards to terrorism
(Rusnak 2010). She contends that the ability to depict these events in a visually graphic manner
will aid in the forecasting of potential future attacks (Rusnak 2010).
At current, at least eight open source databases exist that provide quantitative statistical data
on past terrorist incidents worldwide. The National Institute of Justice identified seven of these
in 2008, most coming from major universities (National Institute of Justice 2008). The United
States’ National Counterterrorism Center also maintains its own open source database through its
Worldwide Incident Tracking System (NCTC 2011). This project will follow an existing method
of GIS analysis in counterterrorism described as taking ―advantage of the spatial analysis
functions of GIS to allow an analyst to assemble multiple layers of data and mine multiple
database tables to extract connections in space, in time or other relationships‖ (Can et al 2009).
Utilizing this technique will bring to life so-called ―body count‖ and statistical data from the
University of Maryland’s Global Terrorism Database that is joined to preexisting shapefiles.
Data from organizations such as the Center for Systemic Peace and related economic studies will
be cross-referenced with terrorism incident data in an attempt to validate or falsify three
hypotheses. The following section presents an overview of the geospatial aspects of the project
in terms of spaces.
B. Geospatial Aspects
(a) Life Space - This could provide a context for the data in terms of how its movement
trends/patterns. In other words do terrorist incidents seem to migrate and in what way from time
period x to time period y?
(b) Physical Space - This defines the physical context of the data. In other words, this analysis is
limited to the physical realm outside of the OEF/OIF theaters of operations and within other
nation-states and regions. In addition, is there a causal relationship between other phenomena in
the same physical space? A way to answer this question is by examining if two or more
hypotheses are linked. Physical space could further define a geographic extent in which the data
is clustered.
(c) Intellectual Space - The predicted or hypothesized pattern of the data could be said to exist in
intellectual space. To predict terrorist events to decrease or increase over time throughout a
region represents spatial patterns that are initially theoretical. Since this involves thinking of
space in the abstract, it could also be provide a framework for thinking of the spatial change in
these phenomena across time. The use of GIS and maps contained in the appendices to visualize
this problem represents intellectual space because it serves to graphically depict real events.
Hypotheses
This project will investigate several hypotheses formulated through research outside of the usual
theaters of focus (i.e. Iraq, Afghanistan, and Pakistan) in the global war on terrorism (GWOT)
These areas will include at least the select countries and regions in African continent, two sub-
regions of Europe, and select countries in South America. Selected geographic extents are due
in part that these constitute entities outside the primary epicenters of United States armed
conflict. Secondly, the author’s comparative lack of previous study of these regions can
facilitate an increased proficiency.
Hypothesis 1: If seasons have an effect on terrorist activities then we should see an
increase in incidents during the comparatively warmer months of the year.
Hypothesis 2: If greater political instability correlates to the use of terrorist
tactics then we should see a positive relationship between the two variables.
Hypothesis 3: If influence in the form of foreign direct investment can affect intrastate
economic conditions then we should see an inverse relationship between domestic
economic conditions and terrorist incidents (positive impact correlates to a decrease
in incidents and vice versa).
Further explained…
Hypothesis 1: This hypothesis stems from the temperature/aggression (T/A) theory that
finds a relationship between violent crime and increased temperature during the summer months
(Bauer et al 2004). This hypothesis is also based loosely around observed increased insurgent
activity in Afghanistan dubbed the "fighting season." Testing this hypothesis will require
utilizing terrorist incident data over three years specific to a non-equatorial region--Europe in
this case, because of its distinct seasons. If the hypothesis is valid with the T/A theory and
pattern of violence in Afghanistan over the summer months we should see an increased number
of incidents in the months from the March-September equinoxes compared to the rest of the year.
A spatial pattern showing no relationship or a decreased number of incidents between the March
and September equinoxes would falsify this hypothesis.
Hypothesis 2: This hypothesis investigates breakdown theory suggesting that political
instability would lead to an increase in terrorism incidents (Fahey 2010). Using state fragility
indices from the Center for Systematic Peace a positive relationship between terrorist incidents
and related aspects of political instability in the Horn of Africa and Southern Africa are
hypothesized. Such a relationship would serve to corroborate the breakdown theory. However,
competing hypotheses regarding the breakdown theory do exist and an inverse or neutral
relationship would serve to falsify the theory in question.
Hypothesis 3: This hypothesis represents somewhat of an economic twist on the
Accidental Guerilla theory posed by insurgency expert David Kilcullen that explains why
populations may lash out at foreign intervention (Kilcullen 2009). This will examine foreign
direct investment in developing nations of sub-Saharan Africa and their economic impact as to
whether they benefit (crowd in) domestic investment, have a neutral impact, or adversely affect
and displace (crowd out) domestic economies. A crowding out effect exhibited in conjunction
with increased terrorist incidents would validate this hypothesis while a spatially observed
opposite relationship would serve to falsify it.
Evidence
Evidence that will help validate or falsify the aforementioned hypotheses includes the following
spatial and aspatial data with sources in parentheses:
Preexisting evidence
1. World Shapefile (Sandvik 2009)
Relationship: All Hypotheses (as a reference to join tables)
2. Global Terrorism Incident Data for selected years (University of Maryland Global
Terrorism Database, START 2011)
Relationship: All Hypotheses
3. Foreign Direct Investment Table (Agosin et al 2005)
Relationship: Hypothesis 3
4. State Fragility Indices (Center for Systematic Peace 2011)
Relationship: Hypothesis 2
Derived Spatial Evidence
1. Thematic map (see appendices)
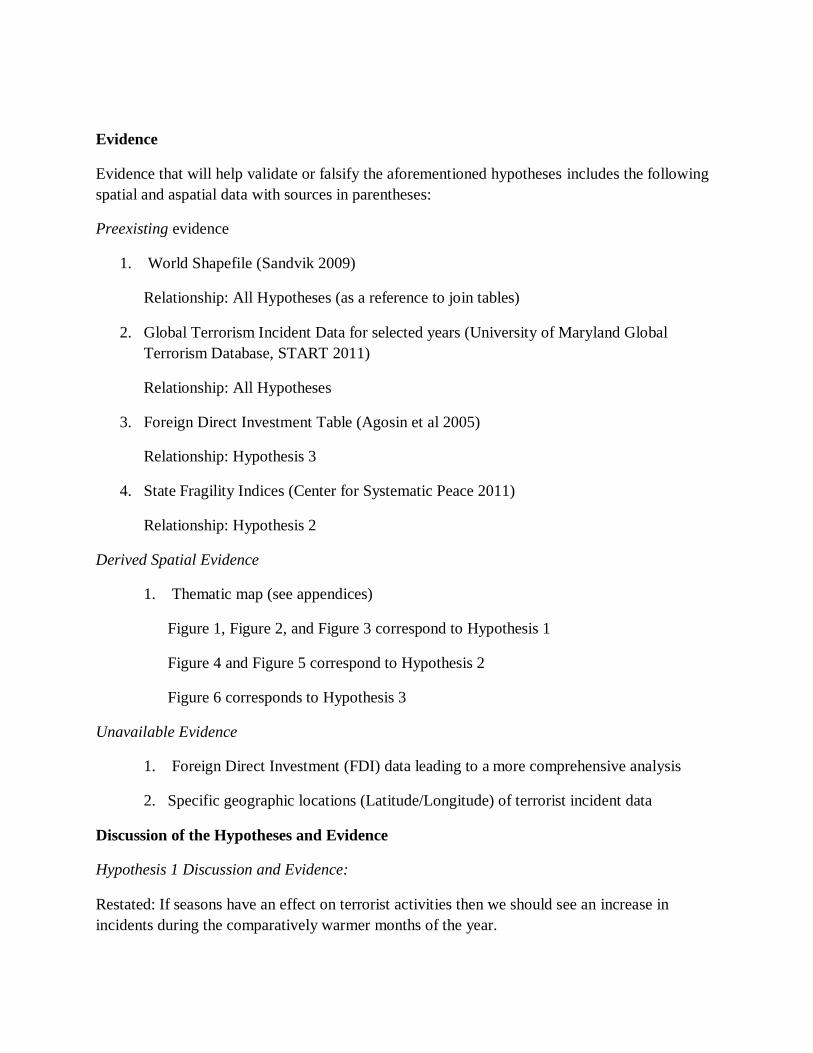
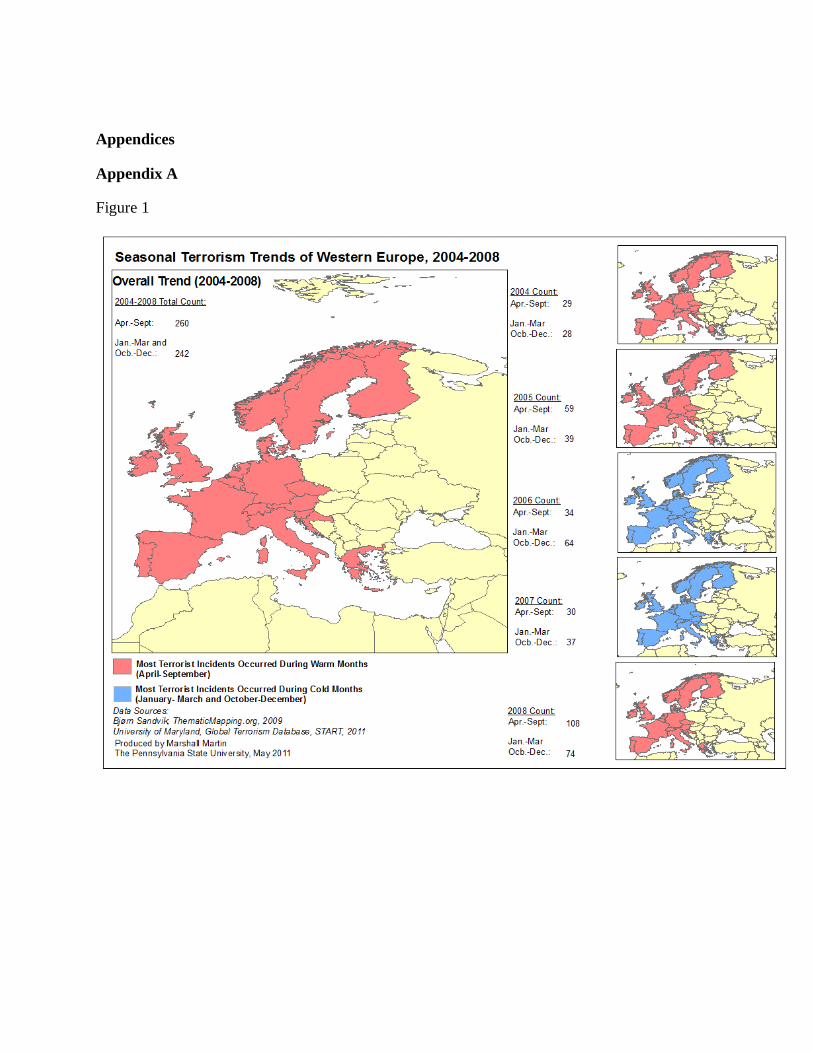
Figure 1, Figure 2, and Figure 3 correspond to Hypothesis 1
Figure 4 and Figure 5 correspond to Hypothesis 2
Figure 6 corresponds to Hypothesis 3
Unavailable Evidence
1. Foreign Direct Investment (FDI) data leading to a more comprehensive analysis
2. Specific geographic locations (Latitude/Longitude) of terrorist incident data
Discussion of the Hypotheses and Evidence
Hypothesis 1 Discussion and Evidence:
Restated: If seasons have an effect on terrorist activities then we should see an increase in
incidents during the comparatively warmer months of the year.
Maps in figures 1, 2, and 3 represent evidence that supports this hypothesis. As mentioned, the
geographic regions of interest herein are Western Europe and Eastern Europe due to their distinct
seasons. Also represented are select equatorial states in South America to determine if this
hypothesis could represent a global trend not confined to regions of distinct seasonal (i.e.
winter/summer) characteristics. From 2004-2008 the findings support hypothesis 1. Aside from
a few individual years, the overall trend for five years sampled illustrates increased incidents
during the majority of time between the spring and fall equinoxes (April-September). An
interesting observation is that from the data represented illustrates not only a trend in regions of
distinct seasonal characteristics depicted here by Western and Eastern Europe, but also in the
select equatorial South American states as well.
Hypothesis 2 Discussion and Evidence:
Restated: If greater political instability correlates to the use of terrorist tactics then we should see
a positive relationship between the two variables.
Maps in figures 4 and 5 represent evidence that supports this hypothesis. As shown in figure 5,
this data corresponds to terrorist incidents in Southern Africa and the Horn of Africa from 2000-
2003 and 2004-2007. Figure 4 depicts the average state fragility indices over the aforementioned
periods for countries in each region. A higher state fragility index corresponds to greater
instability in each geographic extent. Not surprisingly, the Horn of Africa exhibits a much high
state fragility index than select countries in Southern Africa from 2000 onward. Overall, it
appears as if there may be a weak relationship here, however the hypothesis is not fully
supported. For example, terrorist incidents skyrocketed in Somalia from 2004-2007, a country
that also came in with the highest state fragility index. However from 2000-2003, Namibia
exhibited the highest terrorist incident count and scored and obtained a low fragility rating
(Center for Systematic Peace 2011). These findings suggest one of two conclusions. First, that
there is a partial relationship, however other factors than state fragility are more heavily
weighted given the outlier case of Namibia. Second, the quality of the data may be in question
given the Southern African states exhibit significantly higher governance ratings than those in
the Horn of Africa. This could indicate that many terrorist incidents go uncataloged.
Hypothesis 3 Discussion and Evidence:
Restated: If influence in the form of foreign direct investment can affect intrastate economic
conditions then we should see an inverse relationship between domestic economic conditions and
terrorist incidents (positive impact correlates to a decrease in incidents and vice versa).
Figure 6 is the corresponding evidence for this hypothesis. This depicts the effect of foreign
direct investment on select developing countries in Africa from 1970-1996. It specifically
illustrates whether investment ―crowds out‖ i.e. creates an adverse effect on local economies,
―crowds in‖ i.e. has a stimulating effect, or has a neutral effect (Agosin et al 2005). The
hypothesized relationship that terrorist incidents will increase in states that take on a ―crowd out‖
or ―neutral‖ effect follows an economic version of David Kilcullen’s Accidental Guerrilla theory
that posits a hostile reaction of local populations in response to negative effects of foreign
intervention (Kilcullen 2009). The graphic depicted in Figure 6 shows that nearly every state
examined exhibits an increase in terrorist incidents during the second half the 26-year period of
FDI sampled data. This would affirm the need for a necessarily more rigorous methodology or
that the hypothesis is false. In an alternative study, a 2004 study by Harvard University would
support the latter conclusion in its failure to find evidence between terrorism and economic
variables (Abadie 2004).
Final Discussion
Among the three stated hypotheses, findings based on geospatial evidence support the validity of
hypothesis one. Overall findings indicate a future trend of increased violence in the form of
terrorism during warmer months akin to the Afghan ―fighting season.‖ Hypothesis two and three
are either falsified, warrant an adjusted methodology/greater sampling in the case of three, or
further investigation in the case of hypothesis two. Most importantly, this study illustrates
multiple avenues to bring meaning to statistical data through the use of geospatial analysis, and
that existing scholarly theories and emerging hypotheses are testable utilizing this method.
Appendices
Appendix A
Figure 1
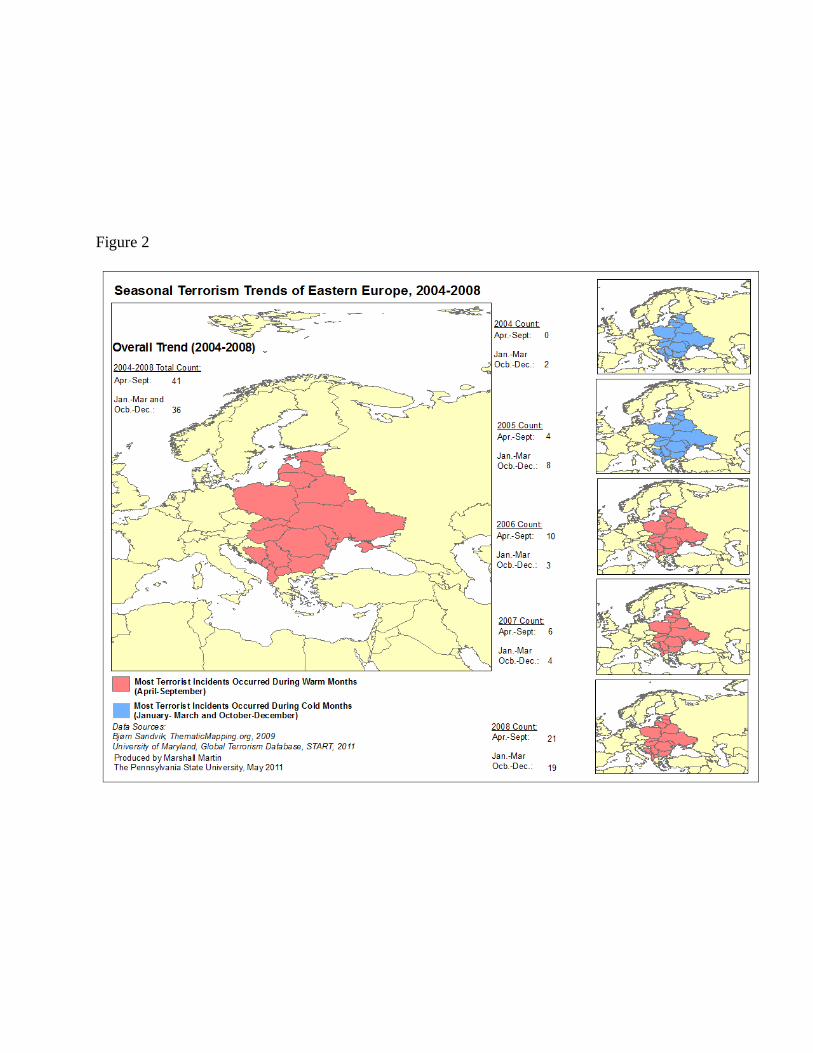
Figure 2
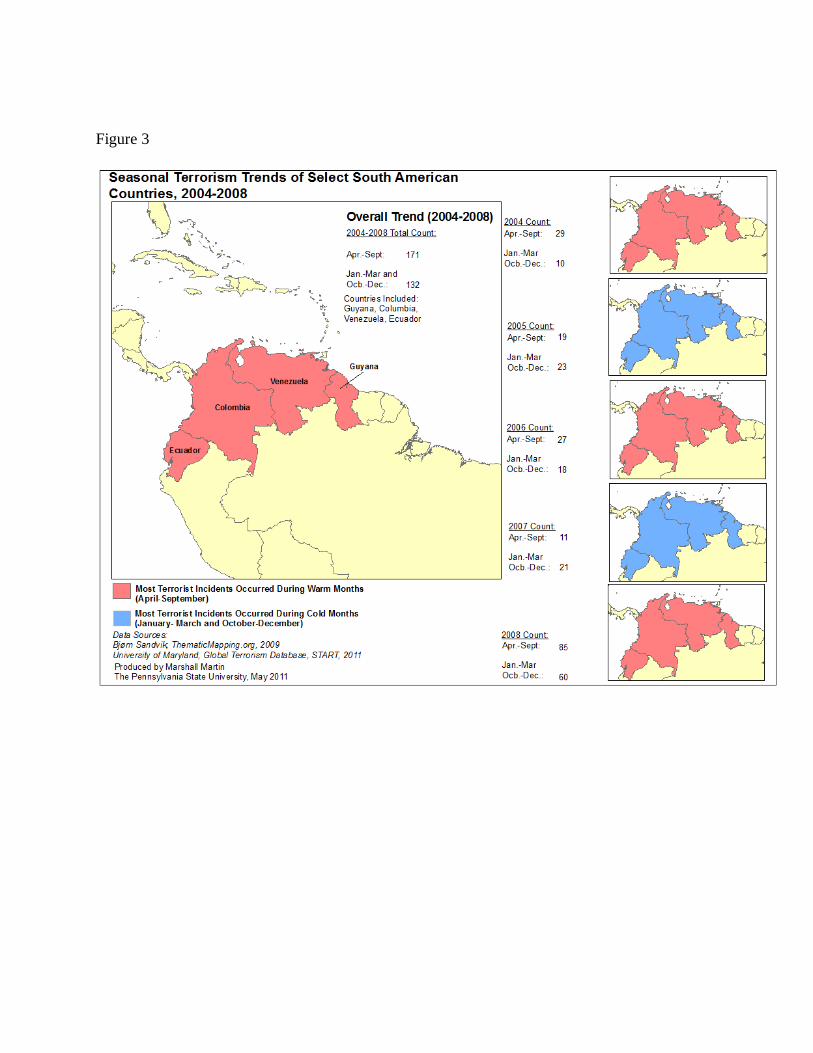
Figure 3
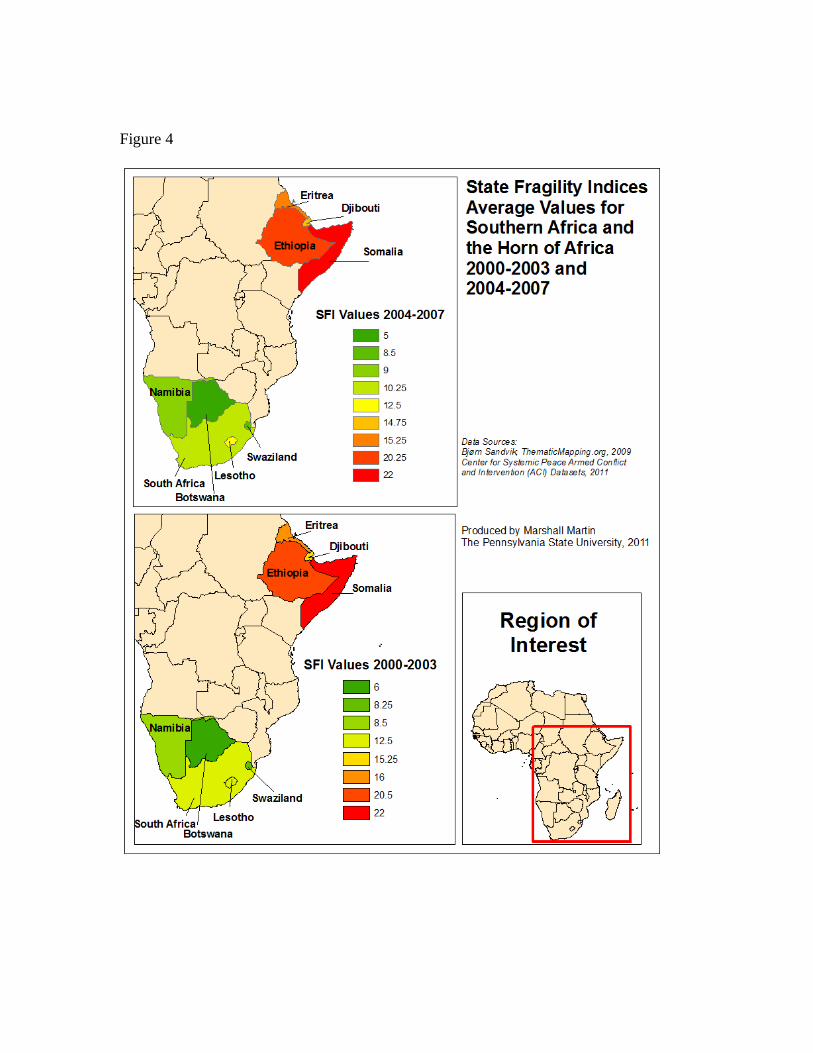
Figure 4
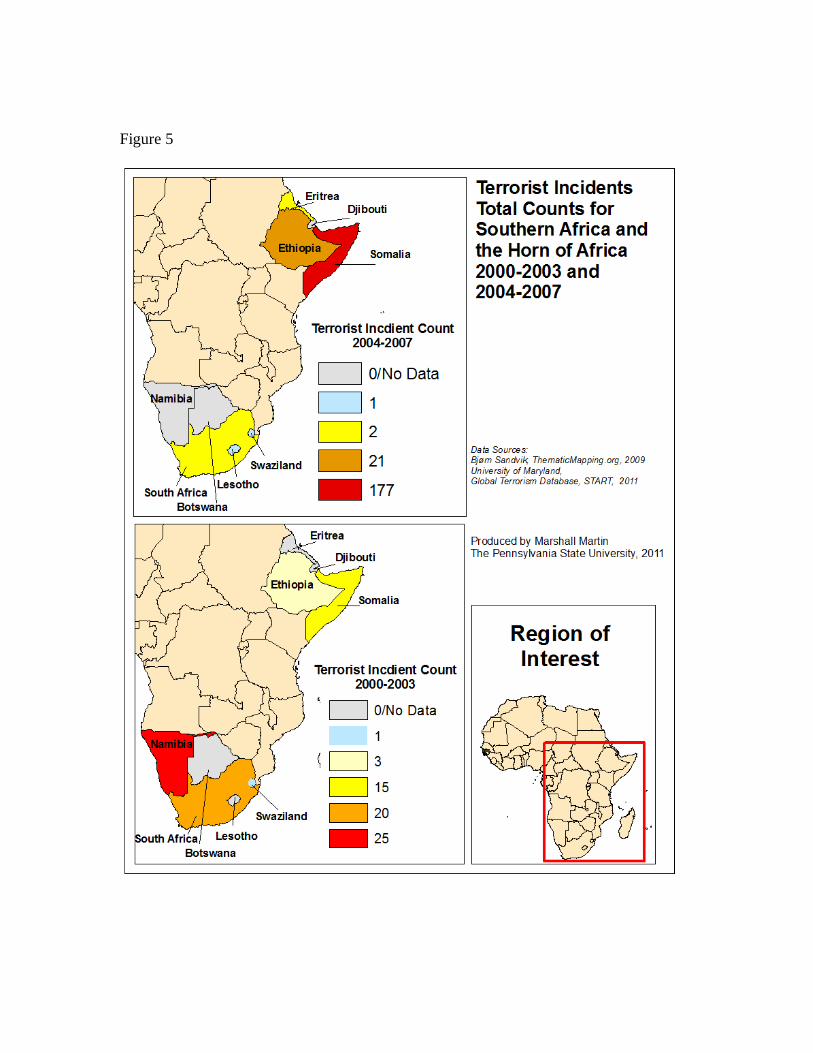
Figure 5
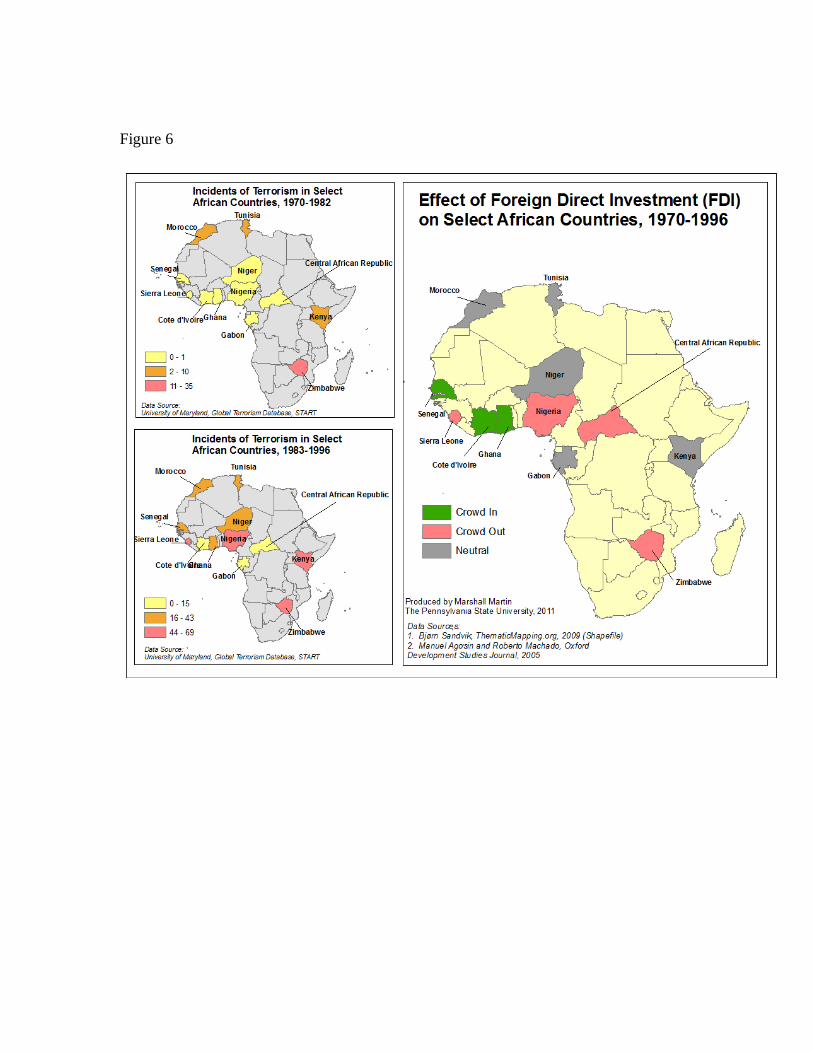
Figure 6
Appendix B
Works Cited
Abadie, Alberto. (2006). Poverty, Political Freedom, and the Roots of Terrorism. American
Economic Review 96(2): 50–56.
Agosin Manuel & Roberto Machado. (2005). Foreign Investment in Developing Countries: Does
it Crowd in Domestic Investment? Oxford Development Studies 33(2): 149-162.
Bauer, Daniel J., John R. Hipp, Patrick J. Curran, and Kenneth A. Bollen. (2004). Crimes of
Opportunity or Crimes of Emotion? Testing Two Explanations of Seasonal Change in
Crime. Social Forces 4(82): 1333-1372.
Can, Salih Hakan , Mark R. Leipnik and Scott M. Mire. (2009). Use of Geographic Information
Systems in Counter‐Terrorism. Contemporary Issues in Criminology and the Social
Sciences 3 (4): 71-92.
Center for Systematic Peace. (2011). Armed Conflict and Intervention (ACI) Datasets.
Retrieved May 10, 2011 from < http://www.systemicpeace.org/inscr/inscr.htm>.
Fahey, Susan. (2010). State Instability and Terrorism. Retrieved May 3, 2011 from
< http://drum.lib.umd.edu/handle/1903/10789>.
Kilcullen, David, (2009). The Accidental Guerrilla: Fighting Small Wars in the Midst of a Big
One. New York: Oxford University Press.
National Counterterrorism Center. (2011). Worldwide Incidents Tracking System (WITS).
Retrieved May 9, 2011 from < http://www.nctc.gov/site/other/wits.html>.
National Institute of Justice. (2008). Terrorism Databases for Analysis. Retrieved April 26,
2011 from <http://www.nij.gov/topics/crime/terrorism/databases.htm>
Perl, Ralph. (2004). The Department of State’s Patterns of Global Terrorism Report: Trends,
State Sponsors, and Related Issues. Retrieved April 25, 2011 from
< www.fas.org/irp/crs/RL32417.pdf http:// >.
Rock, J.C. (2006). The Geographic Nature of Terrorism. Pennsylvania Geographer 2 (44):
133-146
Rusnak, Danielle. (2010). Spatial Analysis of Terrorism. Retrieved April 25, 2011 from
< http://www.scribd.com/doc/29176278/Spatial-Analysis-of-Terrorism>.
Sandvik, Bjorn. (2009). Downloads Page. Retrieved May 6, 2011 from
< http://thematicmapping.org/downloads/>.
University of Maryland, START. (2011). Global Terrorism Database. Retrieved May 1, 2011
from < www.start.umd.edu/gtd>
Appendix C, Experts Consulted
Andrew Kray, Colleague and Geospatial Analyst at SAIC
Carl Martin, Family Member and Chief Financial Officer at Harman Construction, Inc.
Ted Diehl, Friend and Graduate of James Madison University, BA in Political Science