Embed Size (px)
Citation preview
ERD
C/CR
REL
TR-1
8-5
ERDC 6.2 Geospatial Research and Engineering (GRE) ARTEMIS STO-R GRAIL
Using GRAIL Tools to Remotely Assess Terrain Conditions for Austere Entry
Cold
Reg
ions
Res
earc
h
and
Engi
neer
ing
Labo
rato
ry
Sally A. Shoop, Wendy L. Wieder, Elke S. Ochs, and Samantha N. Sinclair
April 2018
Approved for public release; distribution is unlimited.

The U.S. Army Engineer Research and Development Center (ERDC) solves the nation’s toughest engineering and environmental challenges. ERDC develops innovative solutions in civil and military engineering, geospatial sciences, water resources, and environmental sciences for the Army, the Department of Defense, civilian agencies, and our nation’s public good. Find out more at www.erdc.usace.army.mil.
To search for other technical reports published by ERDC, visit the ERDC online library at http://acwc.sdp.sirsi.net/client/default.
ERDC 6.2 Geospatial Research and Engineering (GRE) ARTEMIS STO-R GRAIL
ERDC/CRREL TR-18-5 April 2018
Using GRAIL Tools to Remotely Assess Terrain Conditions for Austere Entry
Sally A. Shoop, Wendy L. Wieder, Elke S. Ochs, and Samantha N. Sinclair U.S. Army Engineer Research and Development Center (ERDC) Cold Regions Research and Engineering Laboratory (CRREL) 72 Lyme Road Hanover, NH 03755-1290
Final Report
Approved for public release; distribution is unlimited.
Prepared for Assistant Secretary of the Army for Acquisition, Logistics, and Technology 103 Army Pentagon Washington, DC 20314-1000
Under ERDC 6.2 Geospatial Research and Engineering (GRE) Applied Research Program Army Terrestrial-Environmental Modeling and Intelligence System Science Technology Objective—Research (ARTEMIS STO-R), Work Items T42 P2 448312 and 5L923J, “Geospatial Remote Assessment for Ingress Locations (GRAIL) Project”
ERDC/CRREL TR-18-5 ii
Abstract
The Geospatial Remote Assessment for Ingress Locations (GRAIL) efforts under the Army Terrestrial-Environmental Modeling and Intelligence Sys-tem (ARTEMIS) program have made significant advances in the remote assessment of terrain and soils for locating potential landing zone and drop zone (LZ and DZ) sites for military operations. The project identified sources of high-quality geospatial data, defined preprocessing require-ments to produce global datasets for analysis, and created the GRAIL Tools software. The GRAIL Tools algorithms analyze and filter geospatial datasets to search for areas suitable for aircraft ground operations. GRAIL Tools then applies geometric criteria to determine if the required LZ/DZ will fit within the areas of suitable terrain and displays the potential LZs and DZs superimposed over geospatial imagery.
Verification of the GRAIL Tools concept at Fort Hunter Liggett, California, developed and trained the suitability filter algorithms with regard to vege-tation, obstructions, and soil strength. Further work served to enhance the algorithms and develop the full toolkit. Future work at a variety of sites, including work in northern regions with snow, ice, and freezing/thawing soils, will evolve the GRAIL Tools to handle the full spectrum of global ter-rain conditions for military operations.
DISCLAIMER: The contents of this report are not to be used for advertising, publication, or promotional purposes. Ci-tation of trade names does not constitute an official endorsement or approval of the use of such commercial products. All product names and trademarks cited are the property of their respective owners. The findings of this report are not to be construed as an official Department of the Army position unless so designated by other authorized documents. DESTROY THIS REPORT WHEN NO LONGER NEEDED. DO NOT RETURN IT TO THE ORIGINATOR.
ERDC/CRREL TR-18-5 iii
Contents
Abstract .......................................................................................................................................................... ii
Figures and Tables ........................................................................................................................................ iv
Preface ............................................................................................................................................................. v
Acronyms and Abbreviations ...................................................................................................................... vi
Unit Conversion Factors ........................................................................................................................... viii
1 Introduction ............................................................................................................................................ 1
1.1 Background ..................................................................................................................... 11.2 Objectives ........................................................................................................................ 31.3 Approach ......................................................................................................................... 4
2 Geospatial data ..................................................................................................................................... 6
3 GRAIL Tools ............................................................................................................................................ 8
3.1 Suitability filters .............................................................................................................. 83.1.1 General filters ........................................................................................................................... 83.1.2 Soil strength toolkit ................................................................................................................ 11
3.2 Geometric Analysis ....................................................................................................... 123.3 Output ............................................................................................................................ 143.4 Summary ....................................................................................................................... 15
4 Validation and Refinement................................................................................................................ 16
4.1 Initial assessment at Fort Hunter Liggett .................................................................... 164.2 Field verification of search algorithms ........................................................................ 174.3 Refinements .................................................................................................................. 194.3.1 Soil strength calculations from soil moisture ....................................................................... 194.3.2 Estimating terrain strength from imagery ............................................................................. 214.3.3 Using machine learning for obstacle detection .................................................................... 24
5 Recommends for Future Work ......................................................................................................... 26
6 Summary and Conclusion ................................................................................................................. 28
References ................................................................................................................................................... 29
: Data Sources ........................................................................................................................ 31
: GRAIL Tools Screen Shots ................................................................................................. 37
: Field Modifications of Land Classification Categories for LZ/DZ ........................... 40
Report Documentation Page
ERDC/CRREL TR-18-5 iv
Figures and Tables
Figures
1 GRAIL landing zone and drop zone assessment process ......................................................... 4 2 GRAIL Tools with user input, criteria, and field-verification-study interaction ........................ 9 3 Example of the threshold filter tool. The top is a prefilter image; the bottom is an
after-filter binary file image ......................................................................................................... 10 4 Example of the unique value filter tool. The top is a prefilter image; the bottom is
an after-filter binary file image .................................................................................................... 11 5 Example of an image classified by CBR soil strength.............................................................. 12 6 Example raster cell, neighborhood, and 100% final LZ result. Orientation is
112.5 degrees .............................................................................................................................. 14 7 Potential C-130 assault LZ sites at various orientations located by GRAIL .......................... 14 8 Locate DZ tool result for 15.2 m and 45.4 m (50 ft and 150 ft) radius zones ................... 15 9 Potential LZ areas based on favorable land cover and slope criteria. The Fort
Hunter Liggett installation boundary is shown in red .............................................................. 17 10 GRAIL identified a potential LZ where an old assault strip LZ existed on the
ground. The site passed slope, roughness, land cover, and geometric criteria ................... 18 11 GRAIL identified a potential C-130 LZ site, based on slope, strength, and being
obstacle free. There was no actual strip at the site, but ground truth showed adequate slope, strength, and geometry at this site ............................................................... 18
12 GRAIL identified this previous DZ as a potential site (map data: Google, Landsat/Copernicus). The site passed land cover, slope, and geometry; but it now has a power-line obstacle on-site ....................................................................................... 18
13 Correlations between soil moisture content (MC) and CBR strength, based on soil texture (Shoop et al. 2008) .................................................................................................. 19
14 Soil strength in terms of CBR (top image) calculated using USCS soil class (middle) and the soil moisture data from GeoWATCH (bottom) ............................................. 20
15 Unsupervised classification of assault LZ image (top), supervised classification for soil strength of the same LZ image with green as strong and red as weak terrain (middle), and a Google Earth (map data: Google, Landsat/Copernicus) image of the same location (bottom)......................................................................................... 22
16 Bomb crater present during May 2013 site visit (left) and general LZ conditions (right) .............................................................................................................................................. 23
17 A 2013 WorldView-2 image after a supervised classification for soil strength ................... 23 18 Using machine learning to automatically detect power lines not easily visible on
imagery (West 2017, map data: Google). Top: Initial image. Middle: Conversion to binary filtered image. Bottom: Detected telephone poles ...................................................... 24
19 Using machine learning to automatically detect large cracks (shown in light green) on a proposed sea ice LZ along the red centerline, which was subsequently moved to a safer location ................................................................................... 25
Tables
1 Readily available geospatial data that can be used as data layers ........................................ 7
ERDC/CRREL TR-18-5 v
Preface
This study was conducted for the Assistant Secretary of the Army for Ac-quisition, Logistics, and Technology as part of the overarching ERDC 6.2 Geospatial Research and Engineering (GRE) Applied Research Program Army Terrestrial Environmental Modeling and Intelligence System Sci-ence Technology Objective—Research (ARTEMIS STO-R), Work Items T42 P2 448312 and 5L923J, “Geospatial Remote Assessment for Ingress Locations (GRAIL) Project.” The ARTEMIS technical program monitor was Mr. John Eylander, CEERD-RR.
The work was performed by Force Projection and Sustainment Branch (CEERD-RRH) of the Research and Engineering Division (CEERD-RR), U.S. Army Engineer Research and Development Center, Cold Regions Re-search and Engineering Laboratory (ERDC-CRREL). At the time of publi-cation, Dr. Harley Cudney was Acting Chief, CEERD-RRH, and Mr. J. D. Horne was Chief, CEERD-RR. The Deputy Director of ERDC-CRREL was Dr. Lance D. Hansen, and the Director was Dr. Joseph L. Corriveau.
Mr. Jesse M. Stanley, Jr., Ms. Ariana Sopher, and Mr. Brian T. Tracy, ERDC-CRREL, provided technical support. Dr. Sarah Kopczynski and Dr. Peter Guth provided manuscript review comments. This research would not have been possible without the dedicated efforts of Dr. Fred Kruse, Mr. Scott Runyon, Ms. Sarah Carlisle, and other supporting researchers at the Naval Postgraduate School. Mr. Stephen Newman at CRREL also offered vital guidance and support throughout this project. Dr. Andmorgan Fischer and Dr. Clint Smith at the ERDC Geospatial Research Laboratory (GRL) provided necessary expertise and fieldwork support. Additionally, the field campaigns were supported by the Fort Hunter Liggett staff, in-cluding Mr. Anthony Trutanich, range officer; Mr. Marc Cutler, scheduling specialist; and Mr. William Duckworth and Mr. Kelly Atwell, training schedulers.
COL Bryan S. Green was Commander of ERDC, and Dr. David W. Pittman was the Director.

ERDC/CRREL TR-18-5 vi
Acronyms and Abbreviations
AGC Army Geospatial Center
ARTEMIS Army Terrestrial Environmental Modeling and Intelligence System
CBR California Bearing Ratio
COSMOS Cosmic-Ray Soil Moisture Observing System
CRREL Cold Regions Research and Engineering Laboratory
DEM Digital Elevation Model
DoD Department of Defense
DZ Drop Zone
ERDC U.S. Army Engineer Research and Development Center
ESDB European Soils Database
FAO Food and Agriculture Organization
GEAR Geocentric Environment for Analysis and Reasoning
GIS Geographic Information System
GPS Global Positioning System
GRAIL Geospatial Remote Assessment for Ingress Locations
GRL Geospatial Research Laboratory
HPA High-Power Amplifier
IUSS International Union of Soil Science
LiDAR Light Detection and Ranging
LZ Landing Zone
NASA National Aeronautics and Space Administration
NCSS National Cooperative Soil Survey
ERDC/CRREL TR-18-5 vii
NGA National Geospatial-Intelligence Agency
NLCD National Land Cover Database
NOAA National Oceanic and Atmospheric Administration
NRCS Natural Resources Conservation Service
SAGE Situational Awareness Geospatially Enabled
SMAP Soil Moisture Active Passive
SPRUCE Signal Physics Representation in Uncertain and Complex Environments
SSURGO Soil Survey Geographic
TerraPAC Terrain Phenomenology and Data Collection
TERRASIM Terrestrial-Environment Rapidly Relocatable Simulation
TSP-SA Temporal-Spatial Predictions: Soil Activity
UNESCO United Nations Educational, Scientific, and Cultural Organization
USCS United Soil Classification System
USDA U.S. Department of Agriculture
UTA Urban and Terrain Analysis
WV2 WorldView-2
WV3 WorldView-3
ERDC/CRREL TR-18-5 viii
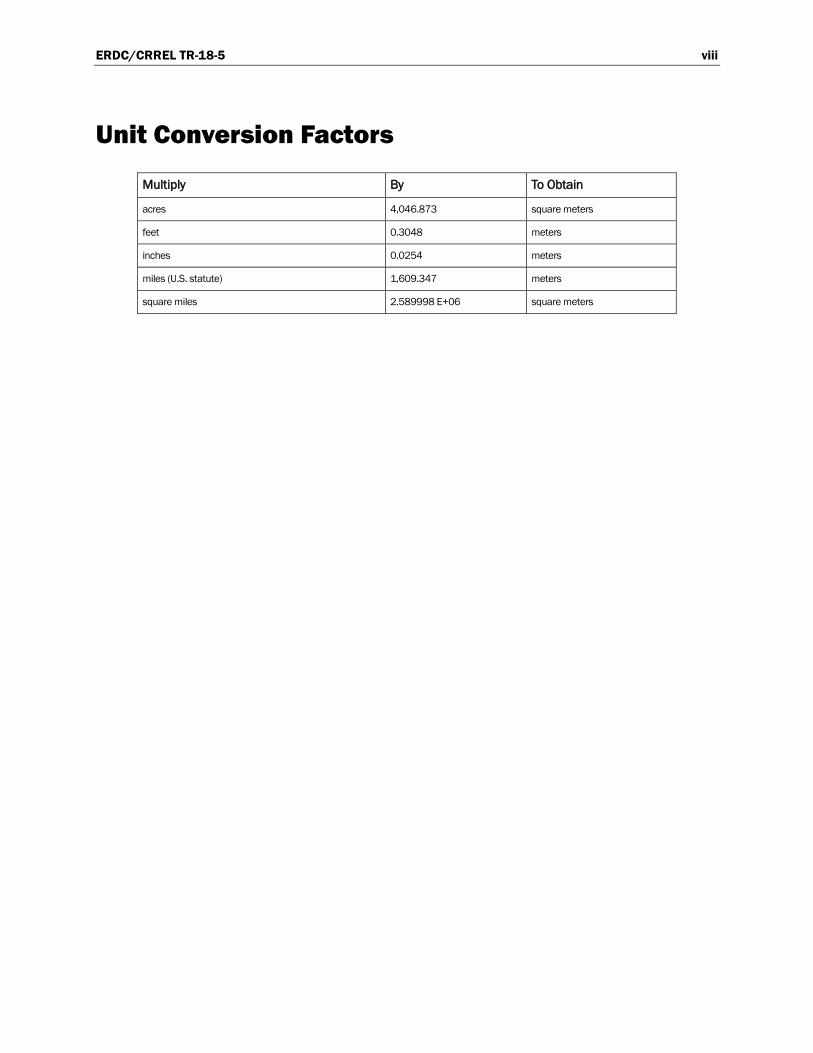
Unit Conversion Factors
Multiply By To Obtain
acres 4,046.873 square meters
feet 0.3048 meters
inches 0.0254 meters
miles (U.S. statute) 1,609.347 meters
square miles 2.589998 E+06 square meters

ERDC/CRREL TR-18-5 1
1 Introduction
1.1 Background
The U.S. military relies on its ability to rapidly deploy forces and equip-ment for operational engagements in remote and often undeveloped re-gions of the world, whether for humanitarian or military purposes. Con-ventionally, after review of maps and imagery, planning these operations requires ground observations to locate and confirm that soil engineering properties and topography meet criteria for landing and delivery of sup-plies. This challenge is further compounded because there is no direct method of linking site selections with historical climate or forecast weather data to predict how weather will affect access. Forward combat units require an improved method to remotely assess austere entry loca-tions and to identify landing zones and drop zones (LZs and DZs) to meet expedient entry and agile logistics and sustainment requirements in any operational environment.
The Army Terrestrial Modeling and Intelligence System (ARTEMIS) pro-gram focuses on developing innovative methods to fuse weather infor-mation with geospatial content. Past research efforts have developed phys-ical models and geospatial systems; however, the merging of physical models with geospatial systems has largely been limited by incompatible data sources and the complexity of terrestrial information requirements. Integrating weather with geospatial services has long been a challenge within the Army, as demonstrated by the current method of weather infor-mation delivery to the commander—via PowerPoint by the Staff Weather Officer and without full integration with terrain impacts.
The ARTEMIS team is conducting experiments and investigating new op-tions for integrating physical terrain models with Army tactical models and fielded geospatial information systems, compliant with the Army Geo-spatial Enterprise. More specifically, ARTEMIS is developing new algo-rithms, methods, processes, and software toolkits that will enable fused all-weather and all-season military decision aids (e.g., maneuver, austere entry, sensor performance, and other complex terrain-weather analysis tasks) to be delivered in a method that supports risk-based assessments. Such products will improve situational awareness of the current and future

ERDC/CRREL TR-18-5 2
environment properties, deliver tactical-level geospatial products to en-hance the commander’s situational awareness, and improve the intelli-gence used to support battlefield operations.
The ARTEMIS program is grouped into seven focus areas:
• Terrestrial-Environment Rapidly Relocatable Simulation (TERRASIM) • Terrain Phenomenology and Data Collection (TerraPAC) • Temporal-Spatial Predictions: Soil Activity (TSP-SA) • Terrestrial Geospatial Remote Assessment for Ingress Locations (Ter-
restrial GRAIL, herein referred to as GRAIL) • Signal Physics Representation in Uncertain and Complex Environ-
ments (SPRUCE) • Geocentric Environment for Analysis and Reasoning (GEAR) • Urban and Terrain Analysis (UTA).
The focus teams are composed of researchers from the U.S. Army Engi-neer Research and Development Center’s Cold Regions Research and En-gineering Laboratory (ERDC-CRREL) and Geospatial Research Laboratory (ERDC-GRL).
This report discusses the GRAIL project and presents findings that repre-sent major advancements in the GRAIL terrain assessment capability. GRAIL focuses on locating areas suitable for landing aircraft or dropping cargo and personnel. In current operations, the process for locating LZs/DZs is still largely left to subject matter experts analyzing geospatial data, weather forecasts, and mission requirements with on-site observa-tions when possible. However, on-the-ground assessment can put personal at risk in dangerous terrain conditions and volatile or hostile environ-ments; on-site reconnaissance can also jeopardize operation plans by mak-ing the presence of U.S. forces know in advance of entry. In the case of cold regions applications, the LZ/DZ requirements are often incomplete or based on aircraft that are no longer operational. Remote and automated assessment of potential LZs and DZs is useful both strategically and tacti-cally to reduce or eliminate the number of sites to be visited by assessing them with standoff capability and to determine the type of equipment, timing, and location based on mission and assessed or predicted terrain conditions.
ERDC/CRREL TR-18-5 3
Our approach was first to document the requirements for austere LZs/DZs (Wieder and Shoop 2017) and then to automate any well-defined criteria within a geospatial framework. The geospatial tools were designed with the end user in mind. For criteria that are not easily obtained from geospa-tial datasets, such as terrain strength, GRAIL Tools refines, enhances, and implements state-of-the-art prediction algorithms.
Because terrain strength, with regard to soil bearing capacity sufficient to allow aircraft landings and take offs, is a key component to criteria-driven identification and selection of LZs/DZs, a major research component of the GRAIL effort involved developing an evidence-based geospatial ap-proach to sensing and predicting terrain strength by using stand-off measures (including satellite-based sensing), as well as incorporating weather effects on strength to improve spatial and temporal resolution, and to reduce uncertainty. The result of this effort has led to a major ad-vancement in terrain assessment capabilities.
1.2 Objectives
The objective of the GRAIL project is to deliver an automated, evidence-based, and tool-driven approach for locating areas suitable for landing air-craft or for dropping cargo and personnel in remote austere regions.
To meet these requirements, we have developed algorithms that are flexi-ble with respect to the type and resolution of input geospatial data. Typi-cally, these data layers include digital elevation, soil type, land cover from various forms of remotely sensed imagery, high-resolution LiDAR (Light Detection and Ranging), and other terrain datasets. The algorithms quickly identify flat, low relief, and obstruction-free areas. Because terrain strength is a critical parameter for entry and subsequent maneuvers, ter-rain strength estimates using weather-based or climate-based soil mois-ture conditions are also included.
Lastly, GRAIL’s terrain-detection capabilities were supplemented with im-age-processing techniques, using supervised classification analysis and machine learning, for both soil strength classification and obstacle detec-tion (i.e., fences, telephone poles, and other linear or repeating features). These methods can be applied to other data layers or filters as required by the users.
ERDC/CRREL TR-18-5 4
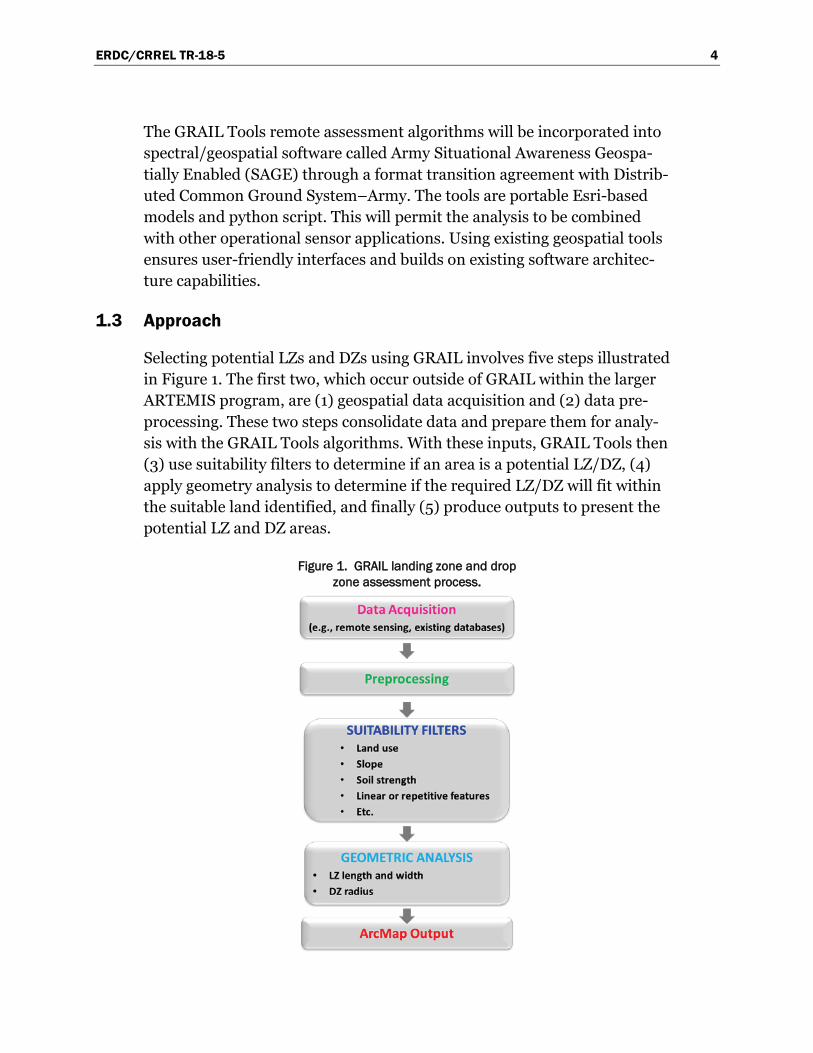
1.3 Approach
FFigure 1. GRAIL landing zone and dropzone assessment process.

ERDC/CRREL TR-18-5 5
These steps are fully compatible with existing Army SAGE or other ArcGIS software, ArcGIS being the commercial geographic information system (GIS) platform for SAGE. This paper discusses each step of the process and provides an overview of the initial testing and validation work that was used to develop and refine the suitability filter algorithms with regard to vegetation, obstructions, and soil strength.
ERDC/CRREL TR-18-5 6
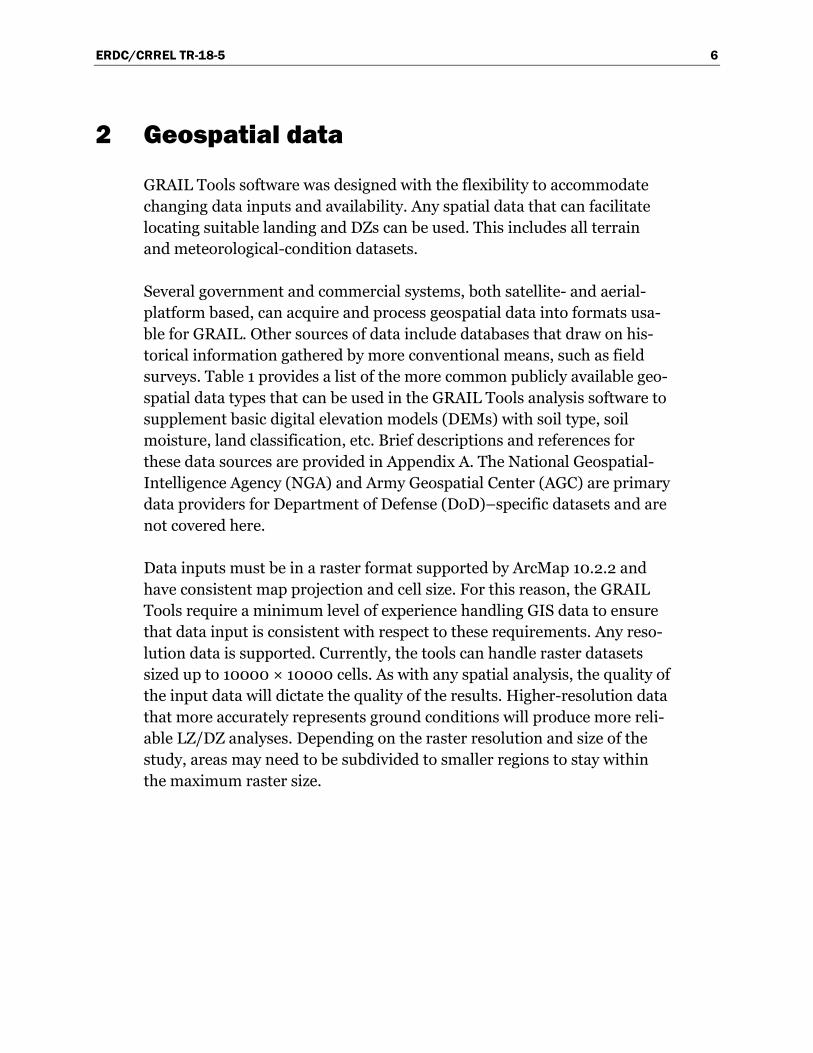
2 Geospatial data
GRAIL Tools software was designed with the flexibility to accommodate changing data inputs and availability. Any spatial data that can facilitate locating suitable landing and DZs can be used. This includes all terrain and meteorological-condition datasets.
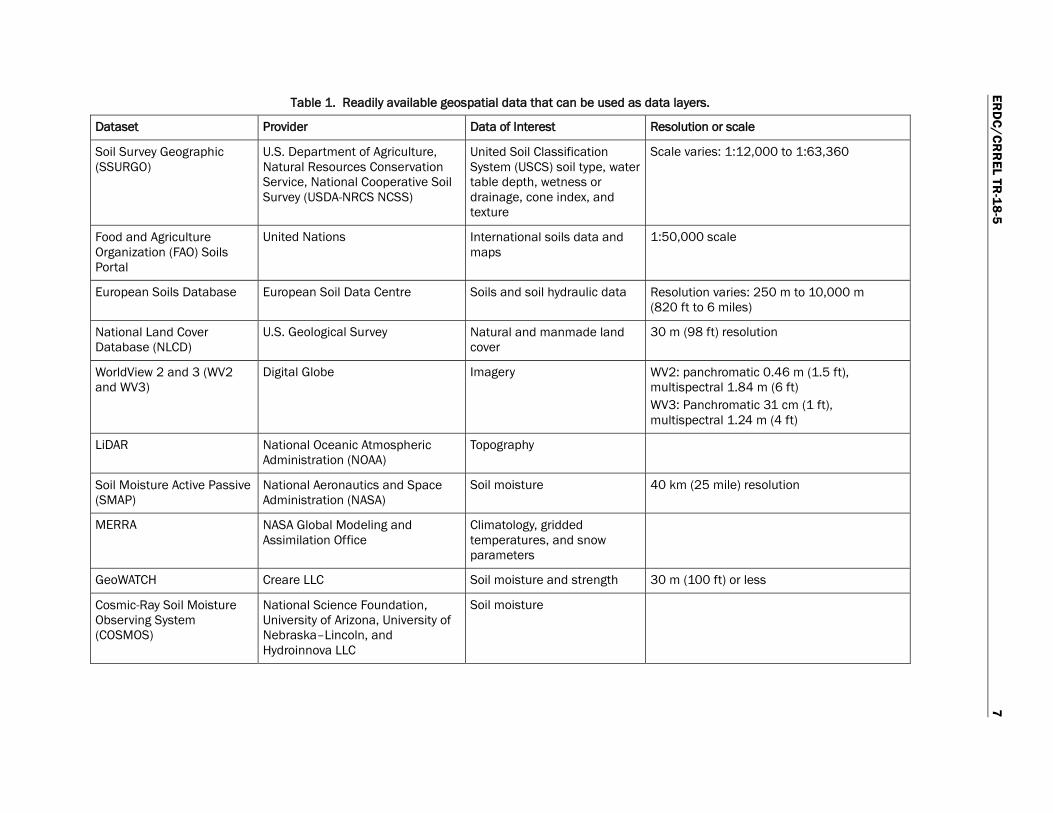
Several government and commercial systems, both satellite- and aerial-platform based, can acquire and process geospatial data into formats usa-ble for GRAIL. Other sources of data include databases that draw on his-torical information gathered by more conventional means, such as field surveys. Table 1 provides a list of the more common publicly available geo-spatial data types that can be used in the GRAIL Tools analysis software to supplement basic digital elevation models (DEMs) with soil type, soil moisture, land classification, etc. Brief descriptions and references for these data sources are provided in Appendix A. The National Geospatial-Intelligence Agency (NGA) and Army Geospatial Center (AGC) are primary data providers for Department of Defense (DoD)–specific datasets and are not covered here.
Data inputs must be in a raster format supported by ArcMap 10.2.2 and have consistent map projection and cell size. For this reason, the GRAIL Tools require a minimum level of experience handling GIS data to ensure that data input is consistent with respect to these requirements. Any reso-lution data is supported. Currently, the tools can handle raster datasets sized up to 10000 × 10000 cells. As with any spatial analysis, the quality of the input data will dictate the quality of the results. Higher-resolution data that more accurately represents ground conditions will produce more reli-able LZ/DZ analyses. Depending on the raster resolution and size of the study, areas may need to be subdivided to smaller regions to stay within the maximum raster size.
ERD
C/CRR
EL TR-18-5
7
Table 1. Readily available geospatial data that can be used as data layers.
Dataset Provider Data of Interest Resolution or scale
Soil Survey Geographic (SSURGO)
U.S. Department of Agriculture, Natural Resources Conservation Service, National Cooperative Soil Survey (USDA-NRCS NCSS)
United Soil Classification System (USCS) soil type, water table depth, wetness or drainage, cone index, and texture
Scale varies: 1:12,000 to 1:63,360
Food and Agriculture Organization (FAO) Soils Portal
United Nations International soils data and maps
1:50,000 scale
European Soils Database European Soil Data Centre Soils and soil hydraulic data Resolution varies: 250 m to 10,000 m (820 ft to 6 miles)
National Land Cover Database (NLCD)
U.S. Geological Survey Natural and manmade land cover
30 m (98 ft) resolution
WorldView 2 and 3 (WV2 and WV3)
Digital Globe Imagery WV2: panchromatic 0.46 m (1.5 ft), multispectral 1.84 m (6 ft) WV3: Panchromatic 31 cm (1 ft), multispectral 1.24 m (4 ft)
LiDAR National Oceanic Atmospheric Administration (NOAA)
Topography
Soil Moisture Active Passive (SMAP)
National Aeronautics and Space Administration (NASA)
Soil moisture 40 km (25 mile) resolution
MERRA NASA Global Modeling and Assimilation Office
Climatology, gridded temperatures, and snow parameters
GeoWATCH Creare LLC Soil moisture and strength 30 m (100 ft) or less
Cosmic-Ray Soil Moisture Observing System (COSMOS)
National Science Foundation, University of Arizona, University of Nebraska–Lincoln, and Hydroinnova LLC
Soil moisture
ERDC/CRREL TR-18-5 8
3 GRAIL Tools
GRAIL Tools is a toolkit for ArcGIS (Esri, Inc.) to aid in locating austere entry LZs and DZs by using spatial datasets of suitability criteria and geo-metric specifications. The objective of GRAIL Tools is to reduce the time re-quired by planners to locate potential austere entry sites and to increase the likelihood of identifying viable entry locations. GRAIL Tools work within the ArcMap platform to analyze the imagery and determine the state of land cover, ground slope, soil properties, and other issues (i.e., obstacles) that would preclude the dropping or landing of cargo, personnel, or specific aircraft and to filter out those areas that are unsuitable for these activities. GRAIL Tools facilitate an otherwise manual operation of combining availa-ble map layers to visually extract regions that meet the geometric specifica-tions of the desired LZ/DZ. GRAIL Tools accomplishes this by automating data suitability filters to facilitate the geospatial search for suitable areas based on user-defined (or default) filters for LZ/DZ criteria, such as certain land cover classes, ground slope, geometry, soil properties, etc.
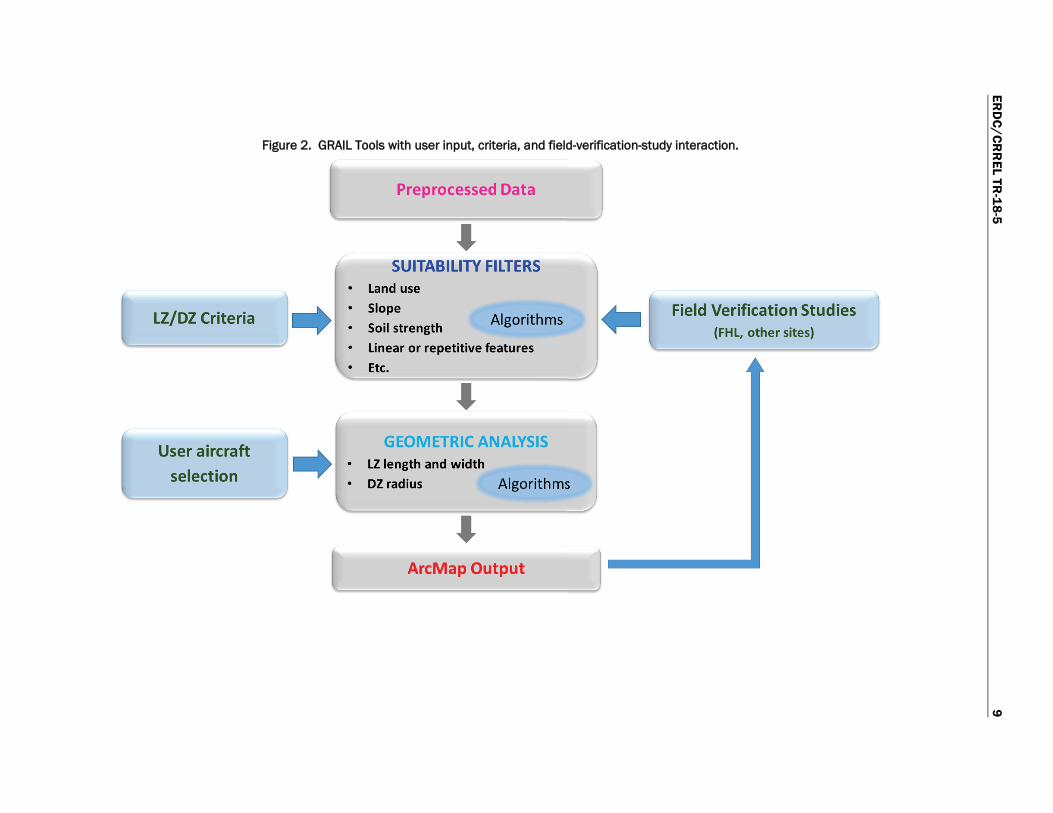
The algorithms and toolsets were verified and refined through field ground-truth experiments where actual ground measurements were com-pared with imagery-analysis predictions. Figure 2 illustrates the use of user input, LZ/DZ criteria, and field verification data to refine or confirm the al-gorithms within GRAIL Tools to locate potential LZ/DZ.
3.1 Suitability filters
3.1.1 General filters
GRAIL Tools was designed with the understanding that the availability, qual-ity, and resolution of terrain and weather datasets will vary. To handle the un-knowns of data availability, GRAIL Tools were designed for types of data val-ues rather than specific datasets. One tool was created for continuous value datasets, such as slope and wind speed, that can determine whether values are suitable or unsuitable based on a threshold. This is called the threshold filter tool. A separate tool, called the unique value filter tool, was created for categorical data, such as land cover, to identify unique classes that represent suitable or unsuitable conditions. These tools all generate a “suitability” out-put raster dataset containing only zeros (unsuitable) and ones (suitable).
ERD
C/C
RR
EL TR-1
8-5
9
FFigure 2. GRAIL Tools with user input, criteria, and field-verification-study interaction.
ERDC/CRREL TR-18-5 10
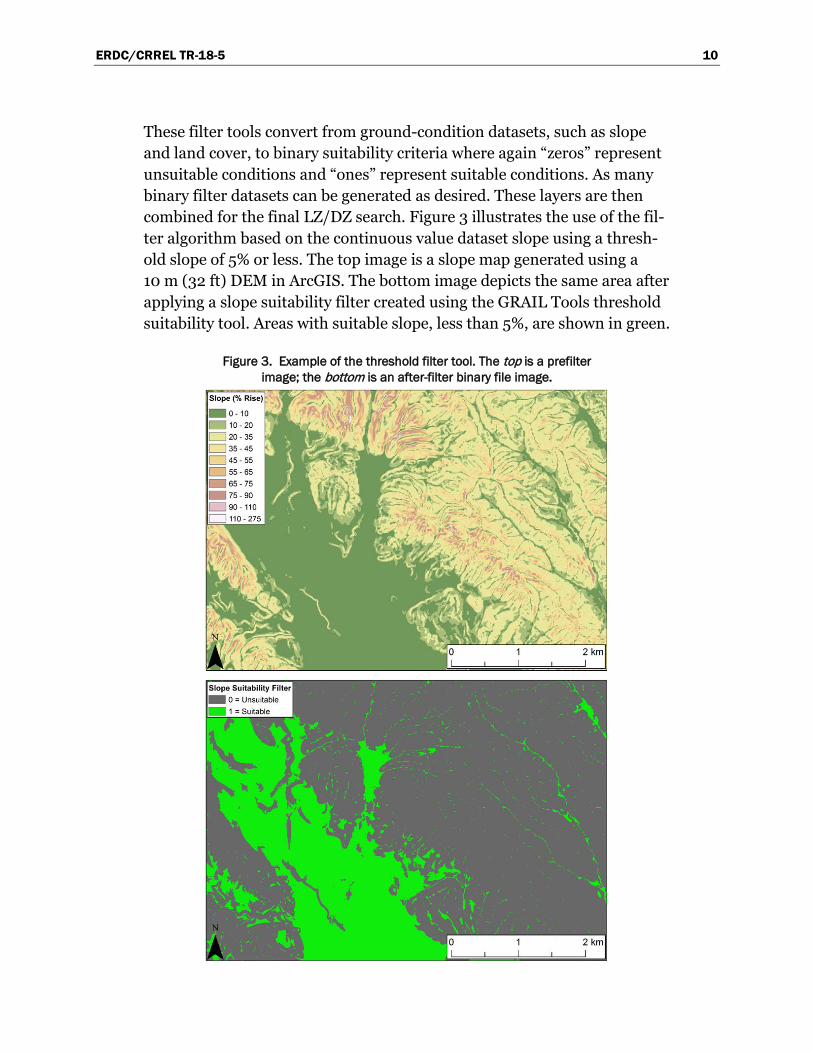
These filter tools convert from ground-condition datasets, such as slope and land cover, to binary suitability criteria where again “zeros” represent unsuitable conditions and “ones” represent suitable conditions. As many binary filter datasets can be generated as desired. These layers are then combined for the final LZ/DZ search. Figure 3 illustrates the use of the fil-ter algorithm based on the continuous value dataset slope using a thresh-old slope of 5% or less. The top image is a slope map generated using a 10 m (32 ft) DEM in ArcGIS. The bottom image depicts the same area after applying a slope suitability filter created using the GRAIL Tools threshold suitability tool. Areas with suitable slope, less than 5%, are shown in green.
Figure 3. Example of the threshold filter tool. The top is a prefilter image; the bottom is an after-filter binary file image.
ERDC/CRREL TR-18-5 11
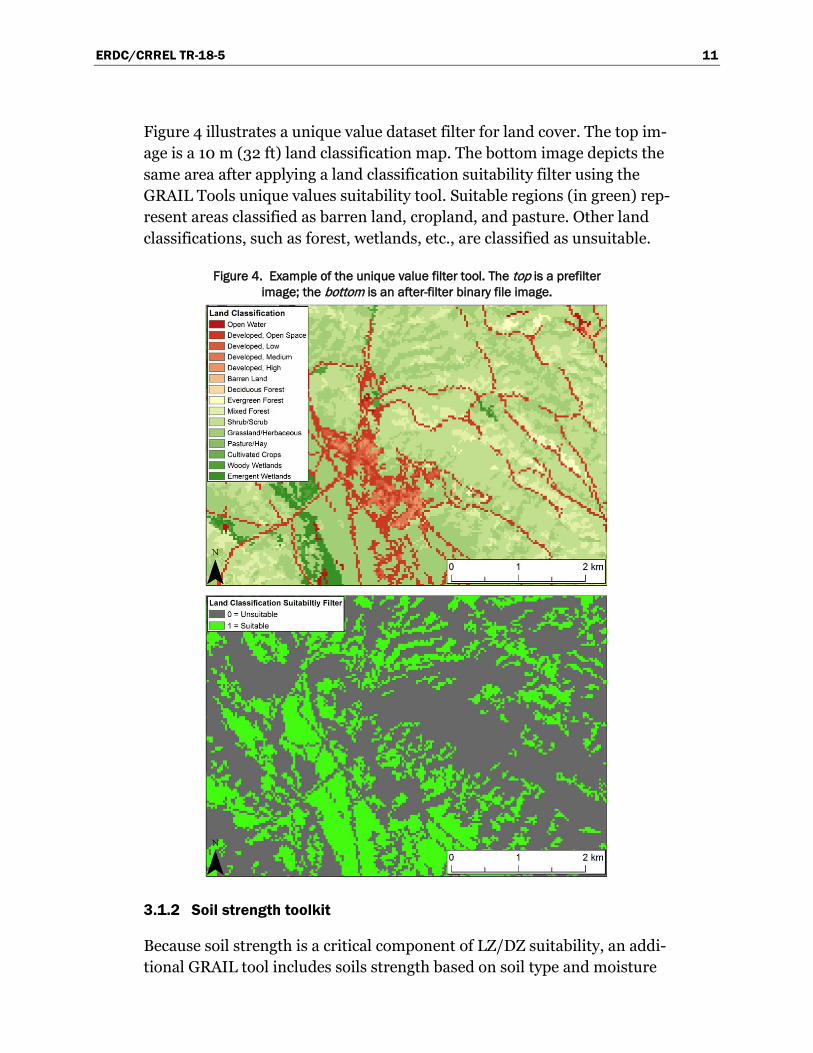
Figure 4 illustrates a unique value dataset filter for land cover. The top im-age is a 10 m (32 ft) land classification map. The bottom image depicts the same area after applying a land classification suitability filter using the GRAIL Tools unique values suitability tool. Suitable regions (in green) rep-resent areas classified as barren land, cropland, and pasture. Other land classifications, such as forest, wetlands, etc., are classified as unsuitable.
Figure 4. Example of the unique value filter tool. The top is a prefilter image; the bottom is an after-filter binary file image.
3.1.2 Soil strength toolkit
Because soil strength is a critical component of LZ/DZ suitability, an addi-tional GRAIL tool includes soils strength based on soil type and moisture
ERDC/CRREL TR-18-5 12
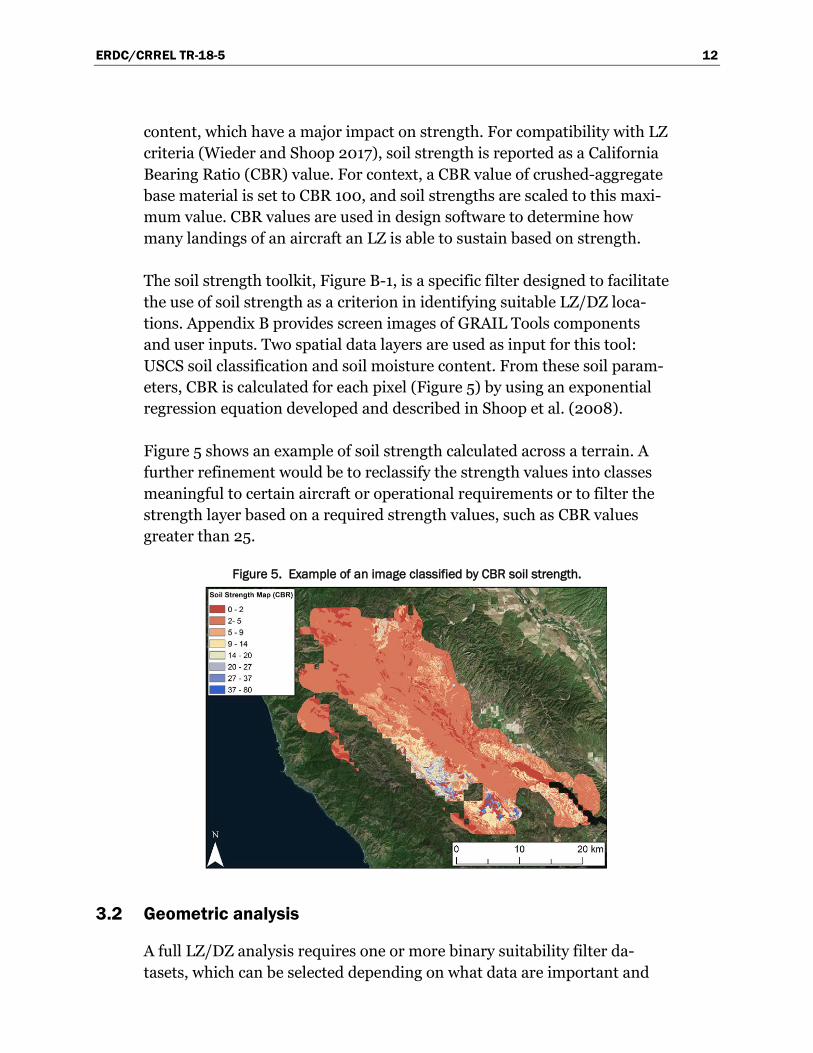
content, which have a major impact on strength. For compatibility with LZ criteria (Wieder and Shoop 2017), soil strength is reported as a California Bearing Ratio (CBR) value. For context, a CBR value of crushed-aggregate base material is set to CBR 100, and soil strengths are scaled to this maxi-mum value. CBR values are used in design software to determine how many landings of an aircraft an LZ is able to sustain based on strength.
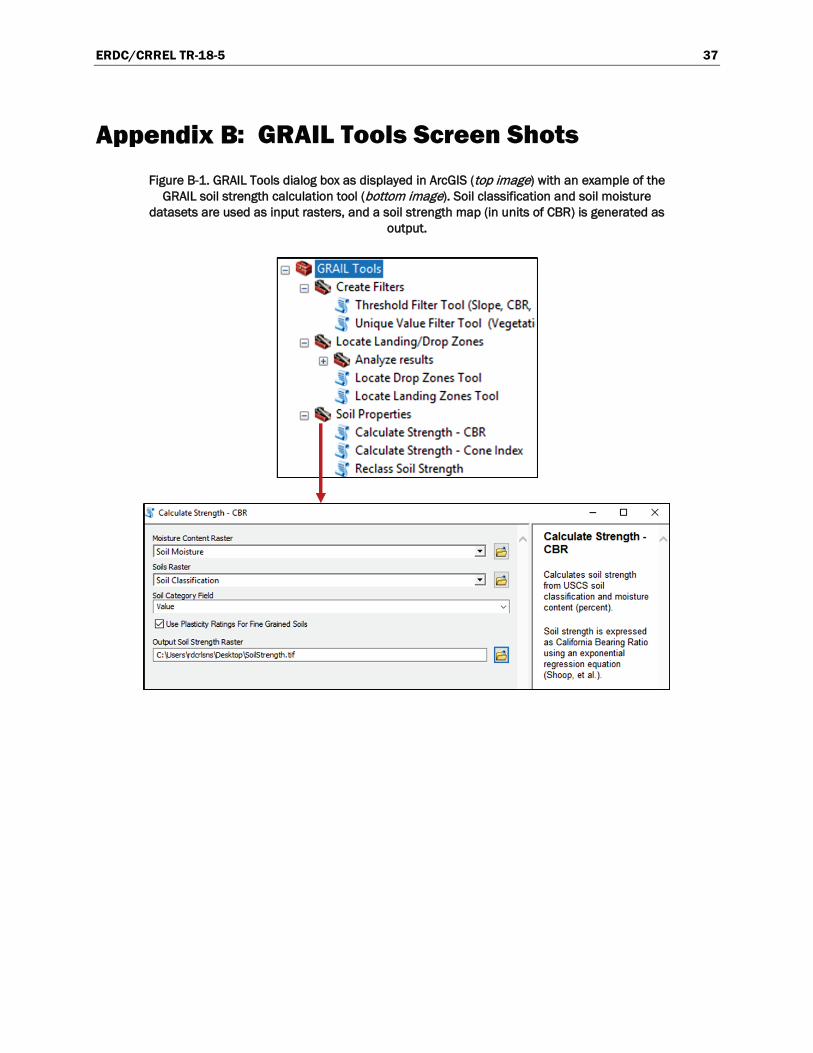
The soil strength toolkit, Figure B-1, is a specific filter designed to facilitate the use of soil strength as a criterion in identifying suitable LZ/DZ loca-tions. Appendix B provides screen images of GRAIL Tools components and user inputs. Two spatial data layers are used as input for this tool: USCS soil classification and soil moisture content. From these soil param-eters, CBR is calculated for each pixel (Figure 5) by using an exponential regression equation developed and described in Shoop et al. (2008).
Figure 5 shows an example of soil strength calculated across a terrain. A further refinement would be to reclassify the strength values into classes meaningful to certain aircraft or operational requirements or to filter the strength layer based on a required strength values, such as CBR values greater than 25.
Figure 5. Example of an image classified by CBR soil strength.
3.2 Geometric analysis
A full LZ/DZ analysis requires one or more binary suitability filter da-tasets, which can be selected depending on what data are important and
ERDC/CRREL TR-18-5 13
available for inclusion as criteria. These filtered layers are then combined and analyzed to determine if a suitable LZ/DZ is available based on re-quired geometry. The user can define the geometry of the required LZ/DZ or can choose from an aircraft-specific pick list. GRAIL Tools includes geo-metric criteria for the C-17 and C-130, the two aircraft currently used on unpaved landing strips. The LZ geometric criteria for these aircraft were taken from applicable military and civilian guidance (Wieder and Shoop 2017).
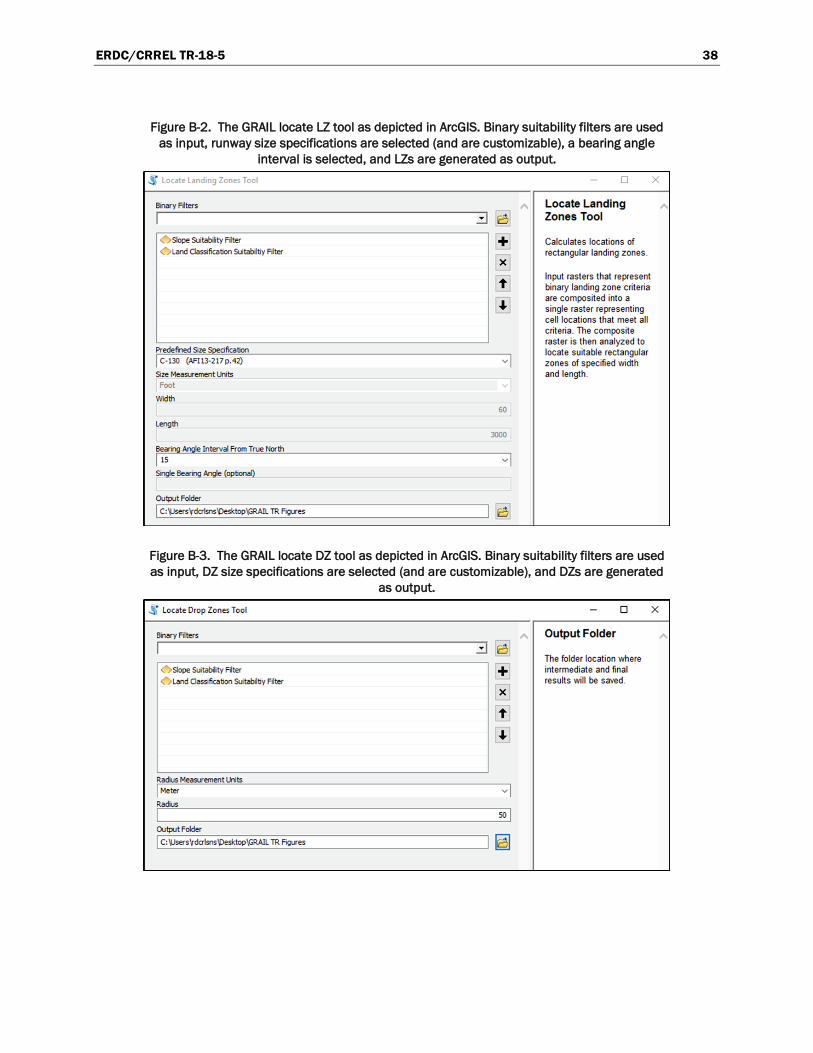
A basic LZ analysis requires the length and width of the rectangular zone and the orientation with respect to true north on the ground (Figure B-2). Alternatively, a sweep of a full range of LZ orientations through 180 de-grees is also possible at user-specified increments. Circular DZs require the zone radius (Figure B-3).
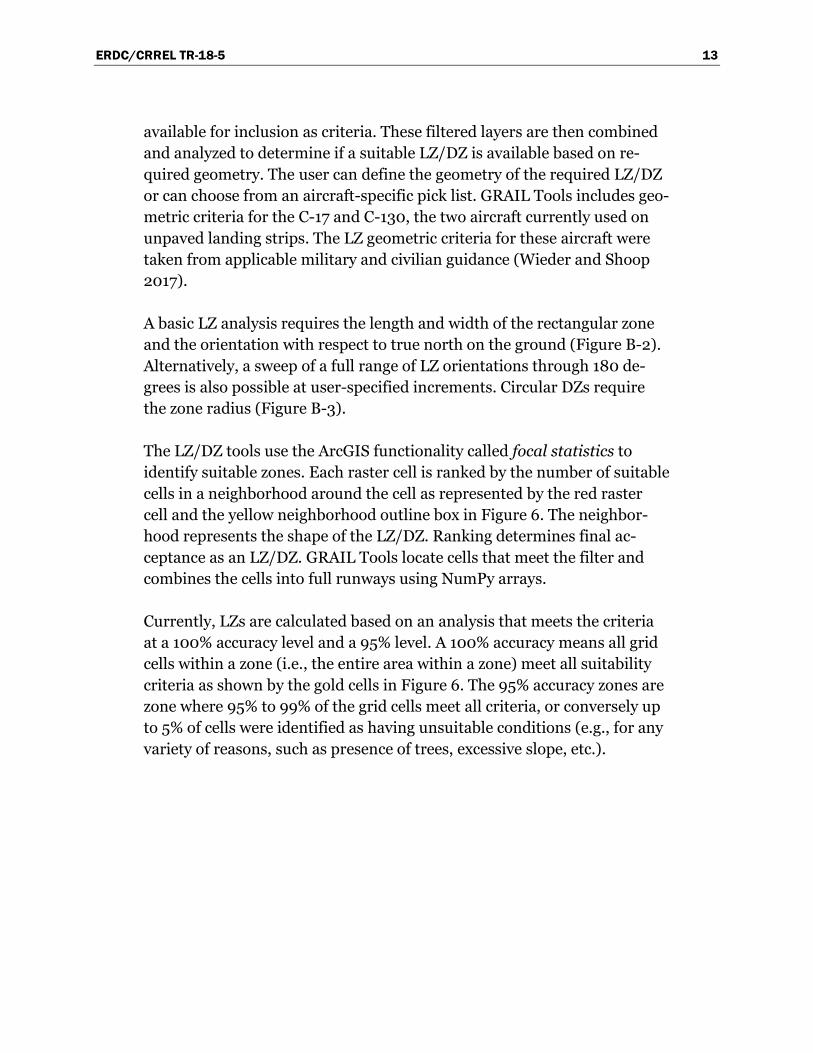
The LZ/DZ tools use the ArcGIS functionality called focal statistics to identify suitable zones. Each raster cell is ranked by the number of suitable cells in a neighborhood around the cell as represented by the red raster cell and the yellow neighborhood outline box in Figure 6. The neighbor-hood represents the shape of the LZ/DZ. Ranking determines final ac-ceptance as an LZ/DZ. GRAIL Tools locate cells that meet the filter and combines the cells into full runways using NumPy arrays.
Currently, LZs are calculated based on an analysis that meets the criteria at a 100% accuracy level and a 95% level. A 100% accuracy means all grid cells within a zone (i.e., the entire area within a zone) meet all suitability criteria as shown by the gold cells in Figure 6. The 95% accuracy zones are zone where 95% to 99% of the grid cells meet all criteria, or conversely up to 5% of cells were identified as having unsuitable conditions (e.g., for any variety of reasons, such as presence of trees, excessive slope, etc.).
ERDC/CRREL TR-18-5 14
Figure 6. Example raster cell, neighborhood, and 100% final LZ result. Orientation is 112.5 degrees.
3.3 Output
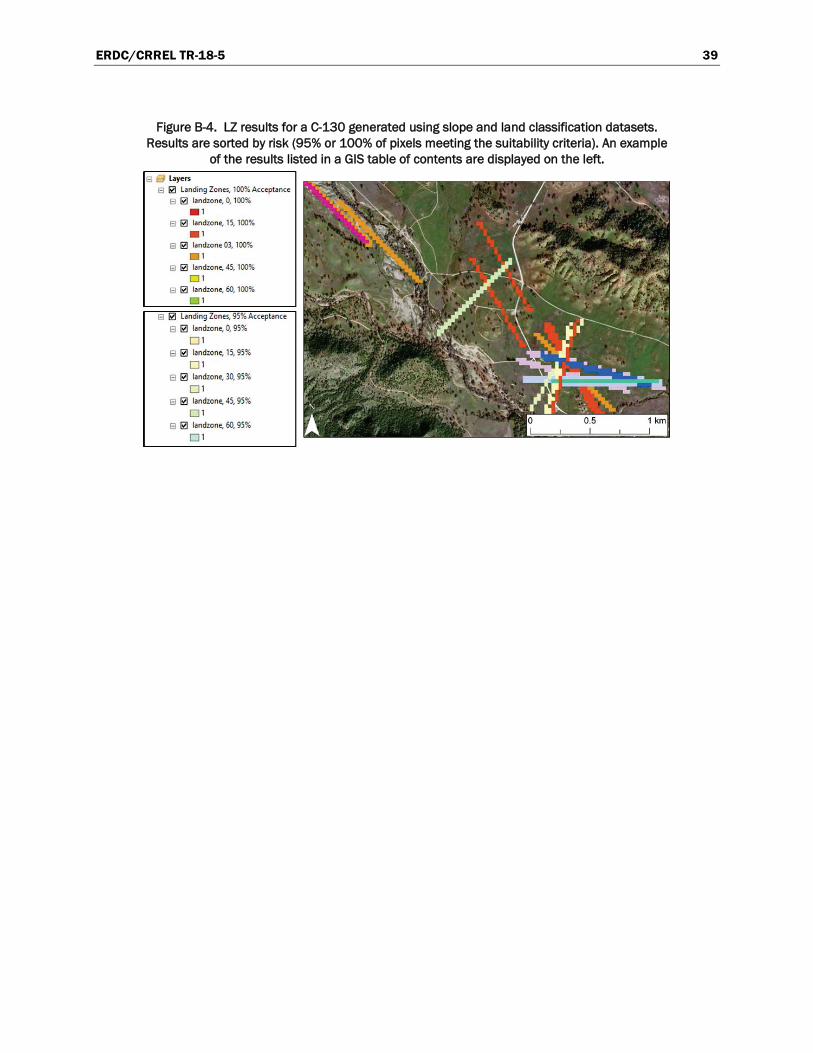
Results of the LZ and DZ analysis are loaded in ArcMap and grouped by suitability acceptance levels (i.e., 100% and 95%). A screen shot of this is provided as Figure B-4 (Appendix B).
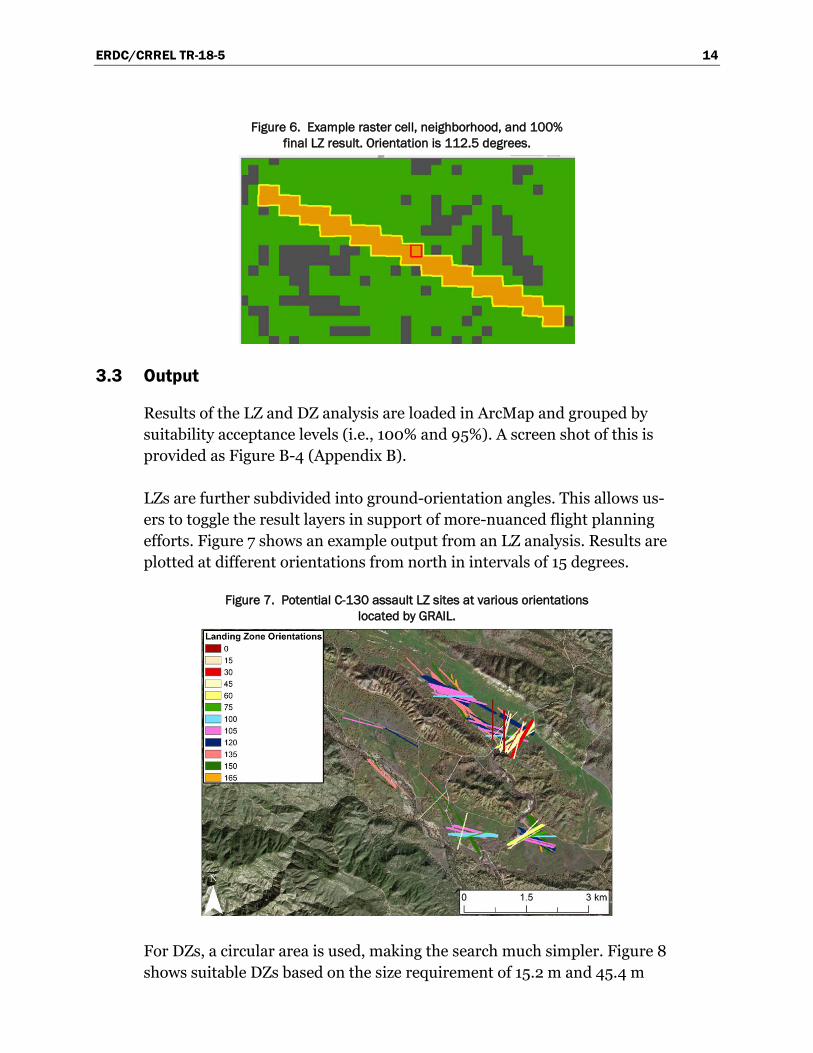
LZs are further subdivided into ground-orientation angles. This allows us-ers to toggle the result layers in support of more-nuanced flight planning efforts. Figure 7 shows an example output from an LZ analysis. Results are plotted at different orientations from north in intervals of 15 degrees.
Figure 7. Potential C-130 assault LZ sites at various orientations located by GRAIL.
For DZs, a circular area is used, making the search much simpler. Figure 8 shows suitable DZs based on the size requirement of 15.2 m and 45.4 m
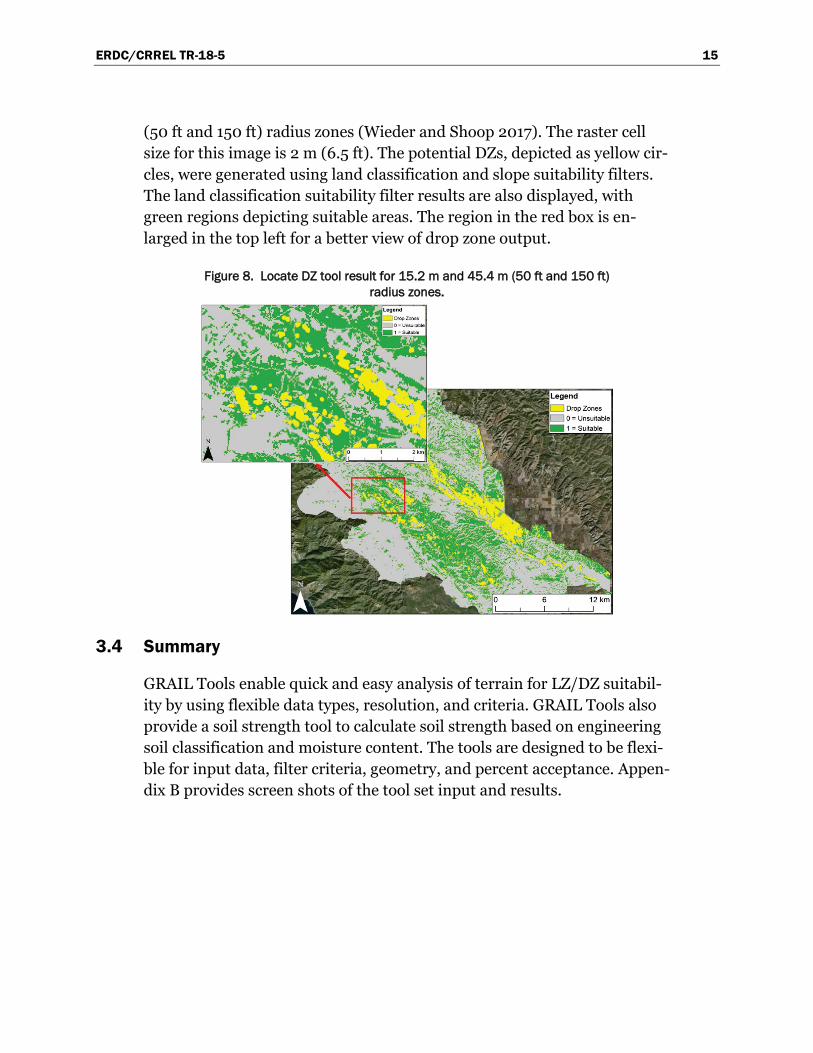
ERDC/CRREL TR-18-5 15
FFigure 8. Locate DZ tool result for 15.2 m and 45.4 m (50 ft and 150 ft) radius zones.
3.4 Summary
ERDC/CRREL TR-18-5 16
4 Validation and Refinement
To test the ability of the GRAIL Tools algorithms to correctly predict LZs and DZs, ERDC-CRREL conducted a series of field data collections with corresponding analysis of geospatial datasets and site imagery. This work included ground-truth surveys of vegetation, land use and other features or obstacles that would prelude LZ or DZ operations. The GRAIL team used these survey data to evaluate whether the suitability filters were working correctly and to determine specific aspects of the algorithms re-quiring refinement. Ground-truth soil moisture and strength measure-ments were used to validate and refine the CBR soil strength model. So-pher et al. (2016a, 2016b), West (2017), and Sinclair et al. (2017) discuss the field-validation, ground-truth, and machine-learning work in greater detail.
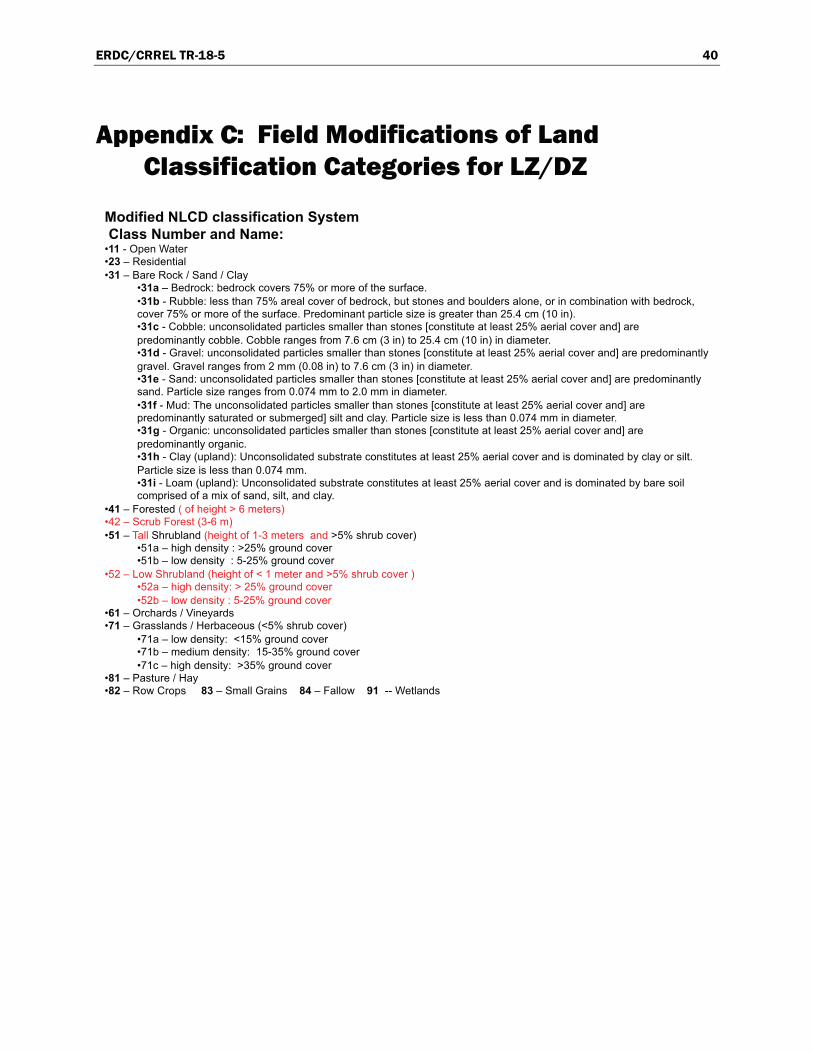
Field surveys were conducted concurrently with the WV2 and WV3 satel-lite data collection. Field soil strength measurements were taken using the Clegg Impact Hammer, Dynamic Cone Penetrometer, and Cone Index and were converted to CBR. Soils were tested for on-site soil type and proper-ties, and the sites were evaluated for land classification (modified from NLCD, see Appendix C), slope, roughness, and vegetation. Sites were vis-ited at several times of the year to specifically address seasonal changes to soil moisture and vegetation.
4.1 Initial assessment at Fort Hunter Liggett
ERDC-CRREL tested GRAIL at Fort Hunter Liggett, located near the cen-tral coast of California, to assess GRAIL’s feasibility and accuracy in select-ing suitable ground surface areas for LZs and DZs. Spread across 809 km2 (200,000 acres) of variable terrain, Fort Hunter Liggett included four es-tablished LZs and twenty DZs, which allowed for a blind test to see if GRAIL would select these areas as suitable based on the system algo-rithms.
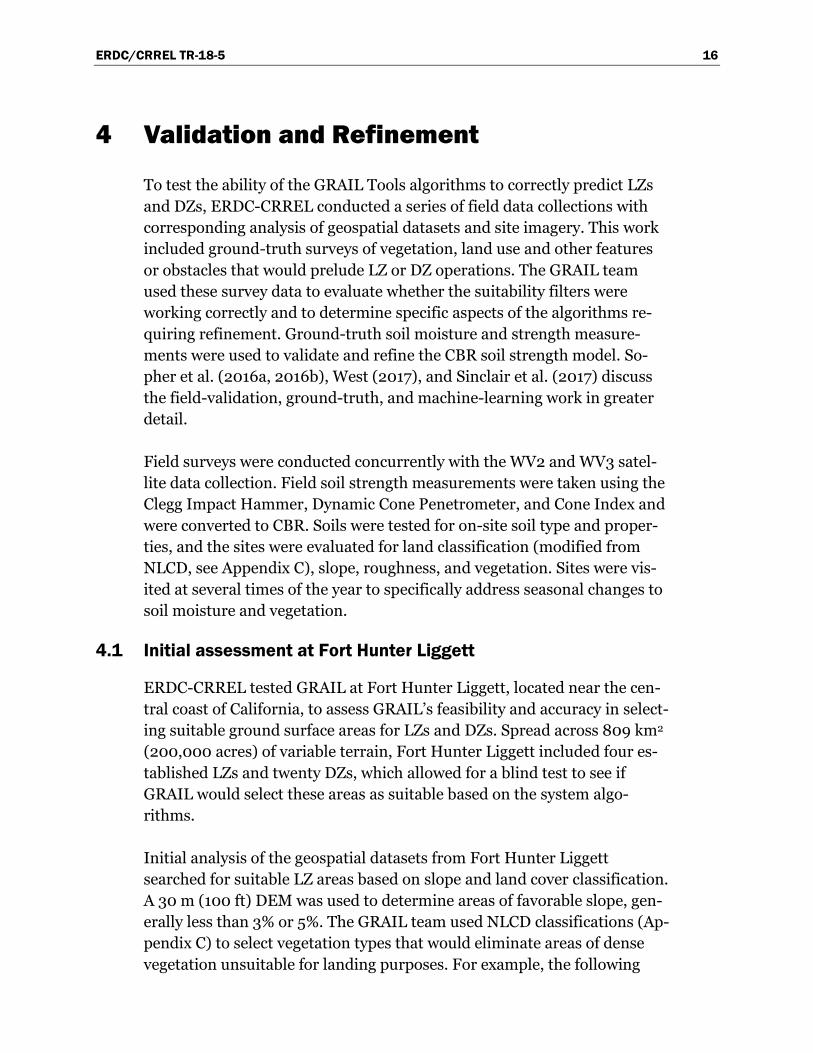
Initial analysis of the geospatial datasets from Fort Hunter Liggett searched for suitable LZ areas based on slope and land cover classification. A 30 m (100 ft) DEM was used to determine areas of favorable slope, gen-erally less than 3% or 5%. The GRAIL team used NLCD classifications (Ap-pendix C) to select vegetation types that would eliminate areas of dense vegetation unsuitable for landing purposes. For example, the following
ERDC/CRREL TR-18-5 17
FFigure 9. Potential LZ areas based on favorable land cover and slope criteria. The Fort Hunter Liggett installation boundary is shown in red.
4.2 Field verification of search algorithms
ERDC/CRREL TR-18-5 18
(discussed in later sections and in detail by Sopher et al. [2016 a, 2016b] and West [2017]).
Results demonstrated that slope, roughness, land class, and adequate geom-etry were quite successful for both finding suitable areas and ruling out un-suitable areas. Remotely assed soil strength and finding obstacles required additional research and development efforts, however. Figures 10–12 show examples of the results of the initial blind test of the search algorithms.
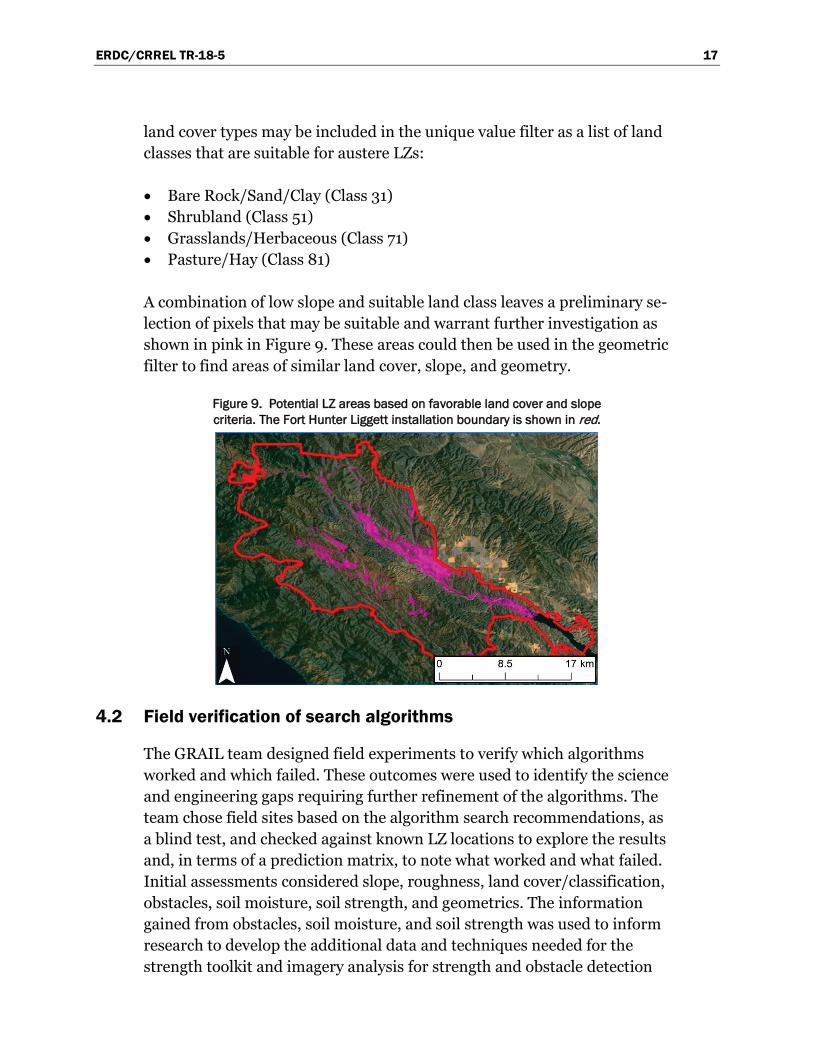
Figure 10. GRAIL identified a potential LZ where an old assault strip LZ existed on the ground. The site passed slope, roughness, land cover, and geometric criteria.
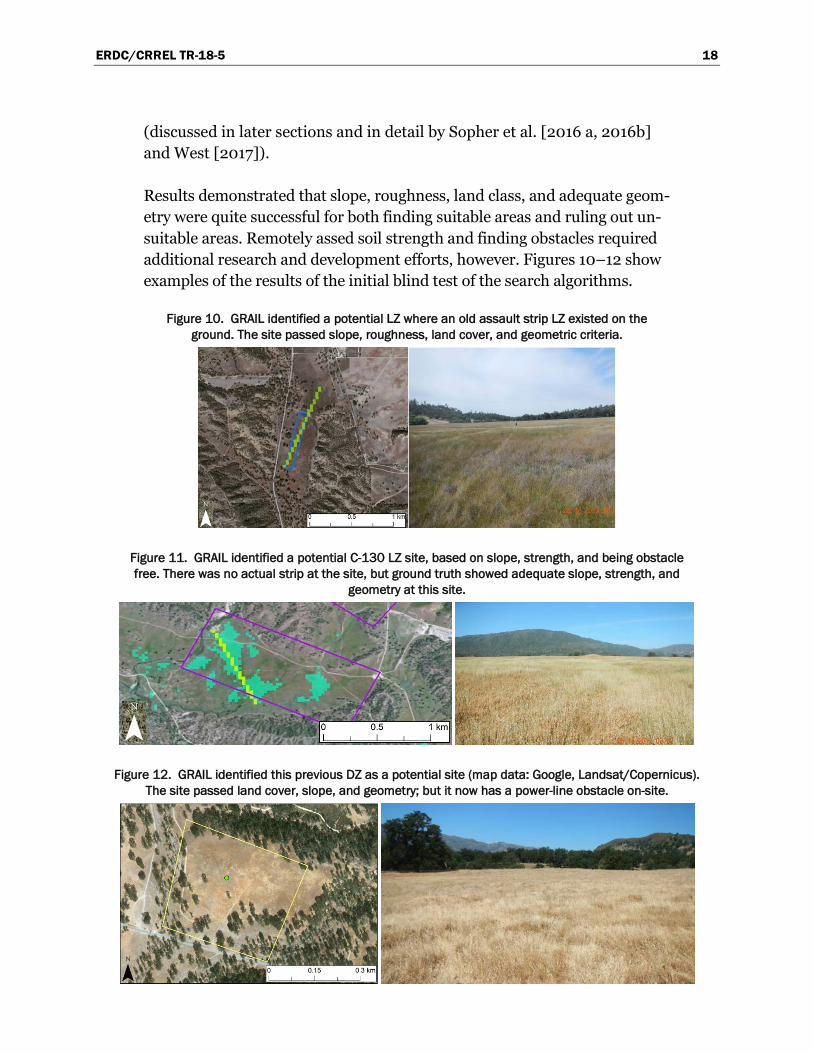
Figure 11. GRAIL identified a potential C-130 LZ site, based on slope, strength, and being obstacle free. There was no actual strip at the site, but ground truth showed adequate slope, strength, and
geometry at this site.
Figure 12. GRAIL identified this previous DZ as a potential site (map data: Google, Landsat/Copernicus). The site passed land cover, slope, and geometry; but it now has a power-line obstacle on-site.
ERDC/CRREL TR-18-5 19
4.3 Refinements
4.3.1 Soil strength calculations from soil moisture
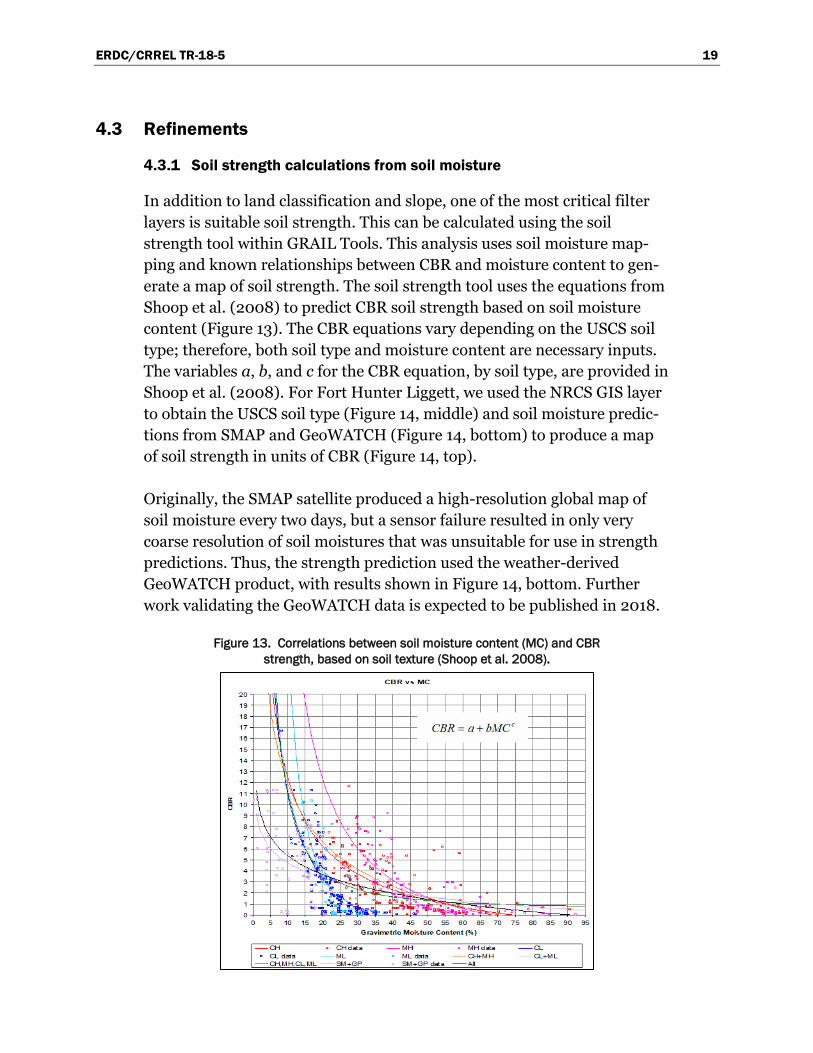
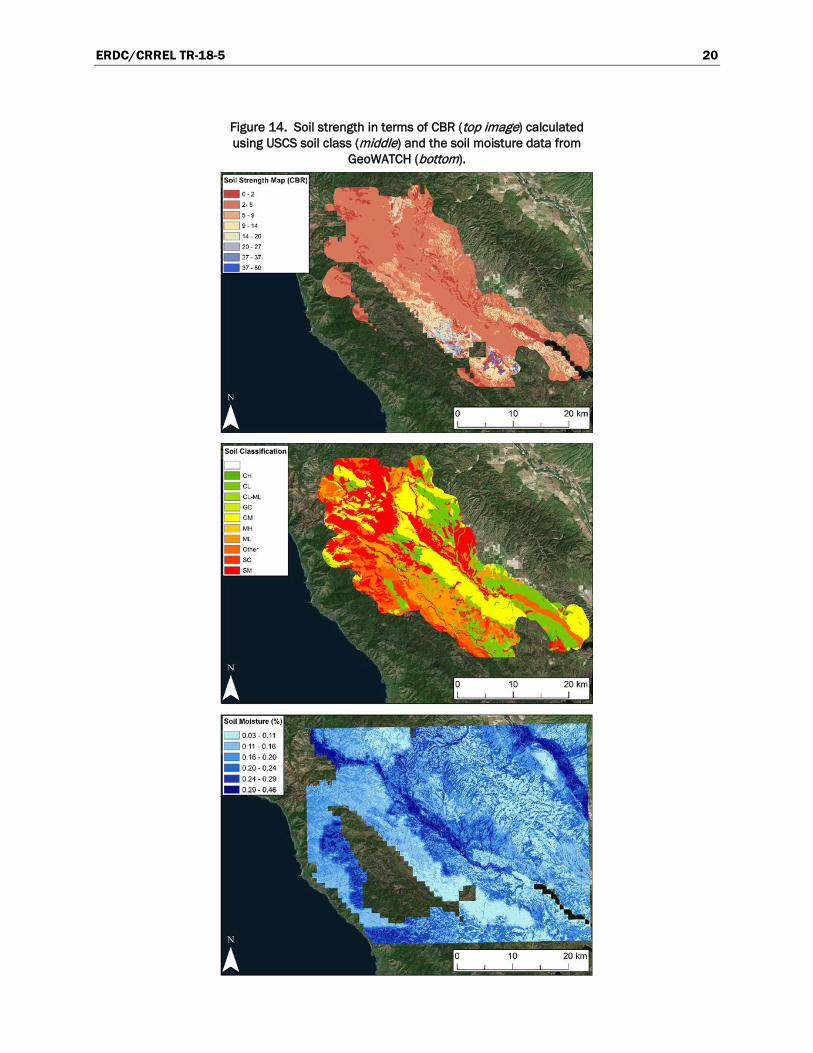
In addition to land classification and slope, one of the most critical filter layers is suitable soil strength. This can be calculated using the soil strength tool within GRAIL Tools. This analysis uses soil moisture map-ping and known relationships between CBR and moisture content to gen-erate a map of soil strength. The soil strength tool uses the equations from Shoop et al. (2008) to predict CBR soil strength based on soil moisture content (Figure 13). The CBR equations vary depending on the USCS soil type; therefore, both soil type and moisture content are necessary inputs. The variables a, b, and c for the CBR equation, by soil type, are provided in Shoop et al. (2008). For Fort Hunter Liggett, we used the NRCS GIS layer to obtain the USCS soil type (Figure 14, middle) and soil moisture predic-tions from SMAP and GeoWATCH (Figure 14, bottom) to produce a map of soil strength in units of CBR (Figure 14, top).
Originally, the SMAP satellite produced a high-resolution global map of soil moisture every two days, but a sensor failure resulted in only very coarse resolution of soil moistures that was unsuitable for use in strength predictions. Thus, the strength prediction used the weather-derived GeoWATCH product, with results shown in Figure 14, bottom. Further work validating the GeoWATCH data is expected to be published in 2018.
Figure 13. Correlations between soil moisture content (MC) and CBR strength, based on soil texture (Shoop et al. 2008).
ERDC/CRREL TR-18-5 20
Figure 14. Soil strength in terms of CBR (top image) calculated using USCS soil class (middle) and the soil moisture data from
GeoWATCH (bottom).
ERDC/CRREL TR-18-5 21
4.3.2 Estimating terrain strength from imagery
Raster layers of imagery can easily be incorporated within GRAIL Tools. Suitability analysis could include a threshold or unique value filter based on some feature of the imagery or on a classification of the imagery. For our purpose, we explored using the threshold value filter to include terrain strength obtained from an image classification in the LZ/DZ search. There-fore, we evaluated a new technique to use multispectral imagery to classify the terrain into categories related to strength or stiffness. While such a stand-off assessment of strength is counterintuitive because strength or stiffness are related to a physical loading of the surface, the bearing capacity of the terrain can be related to other parameters that are expressed at the surface, such as vegetation characteristics, or other parameters that we still are not able to broadly classify, such as grain angularity or minerology.
Sopher et al. (2016a, 2016b) explored image classification for soil strength. Classification is the process of categorizing each pixel of an image into a cer-tain spectral class to describe what kind of object, or in the case of GRAIL, land cover, obstacle, or soil strength, that pixel depicts. Supervised classifi-cations use training data, which are groups of pixels that the analyst knows to be of a certain information class or characteristic on the ground (ground truth) to improve the algorithms’ capabilities.
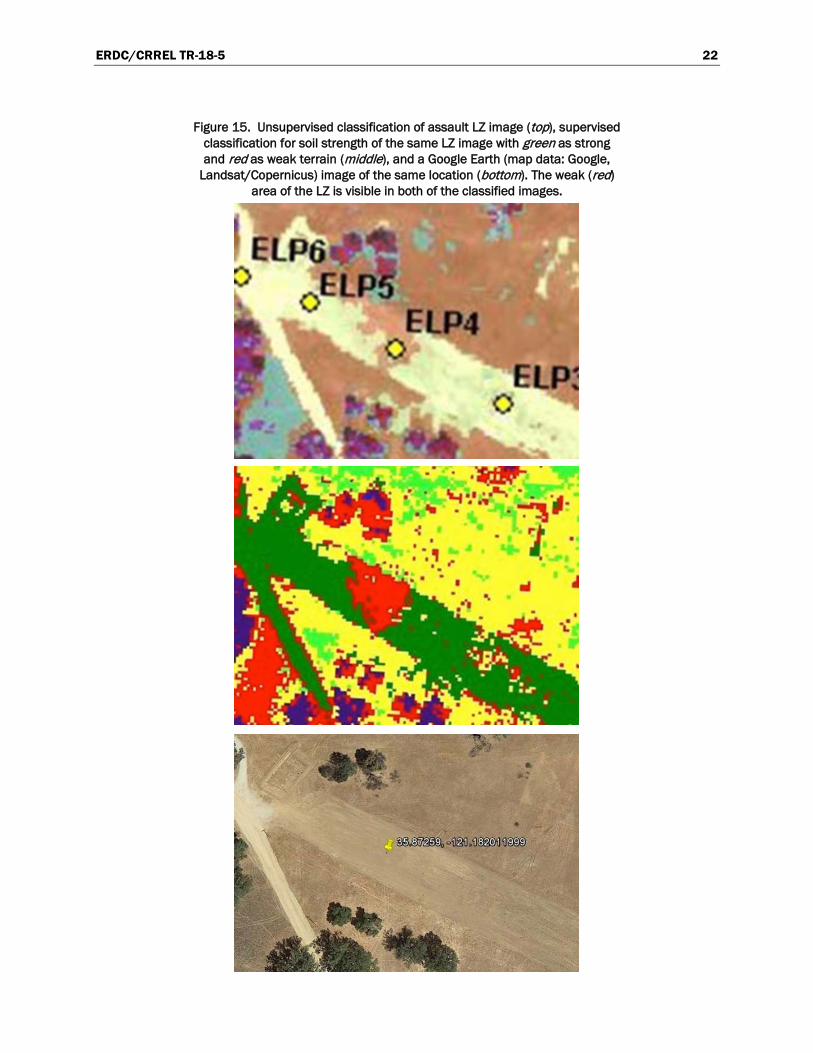
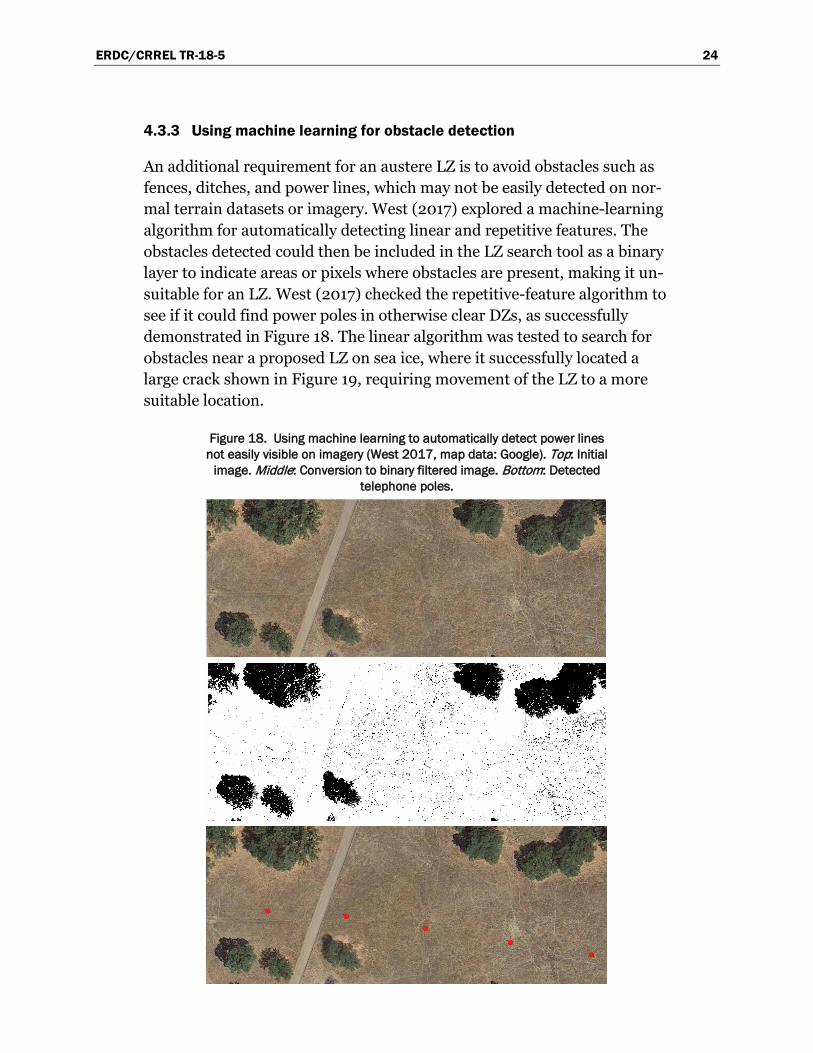
Sopher’s findings demonstrate that initial assessments of multispectral sat-ellite imagery classifications and ground spectra evaluation show potential for classification related to terrain strength. Figure 15 illustrates this. The unsupervised classification, without training data applied, of the image clearly shows the LZ with a disturbance in the LZ where a bomb crater had been repaired (Figure 16). A supervised classification using CBR training data shows a similarly well-defined LZ, only this time with CBR indicators ranging from dark green (strong terrain with CBR greater than 60) to red (weak terrain not suitable for an LZ). Seven strength categories appeared to work best for classifying an image for terrain strength. An additional exam-ple of a supervised classification using CBR training data clearly shows the unpaved Schoonover airfield (Figure 17). While the theoretical basis is not well understood, a more thorough statistical analysis of image classification for strength and incorporation of user-defined classes is underway.*
* J. Palacio, personal communication, 5 March 2018. Hanover, NH: U.S. Army Engineer Research and
Development Center.
ERDC/CRREL TR-18-5 22
Figure 15. Unsupervised classification of assault LZ image (top), supervised classification for soil strength of the same LZ image with green as strong and red as weak terrain (middle), and a Google Earth (map data: Google,
Landsat/Copernicus) image of the same location (bottom). The weak (red) area of the LZ is visible in both of the classified images.
ERDC/CRREL TR-18-5 23
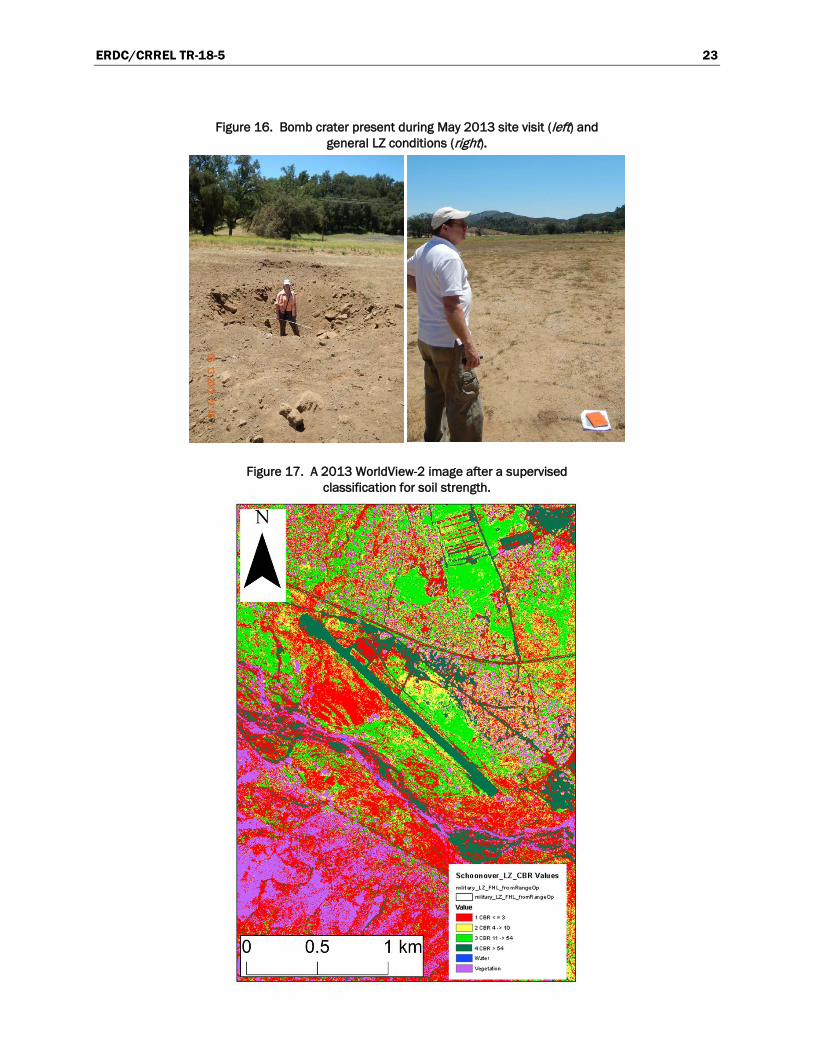
Figure 16. Bomb crater present during May 2013 site visit (left) and general LZ conditions (right).
Figure 17. A 2013 WorldView-2 image after a supervised classification for soil strength.
ERDC/CRREL TR-18-5 24
4.3.3 Using machine learning for obstacle detection
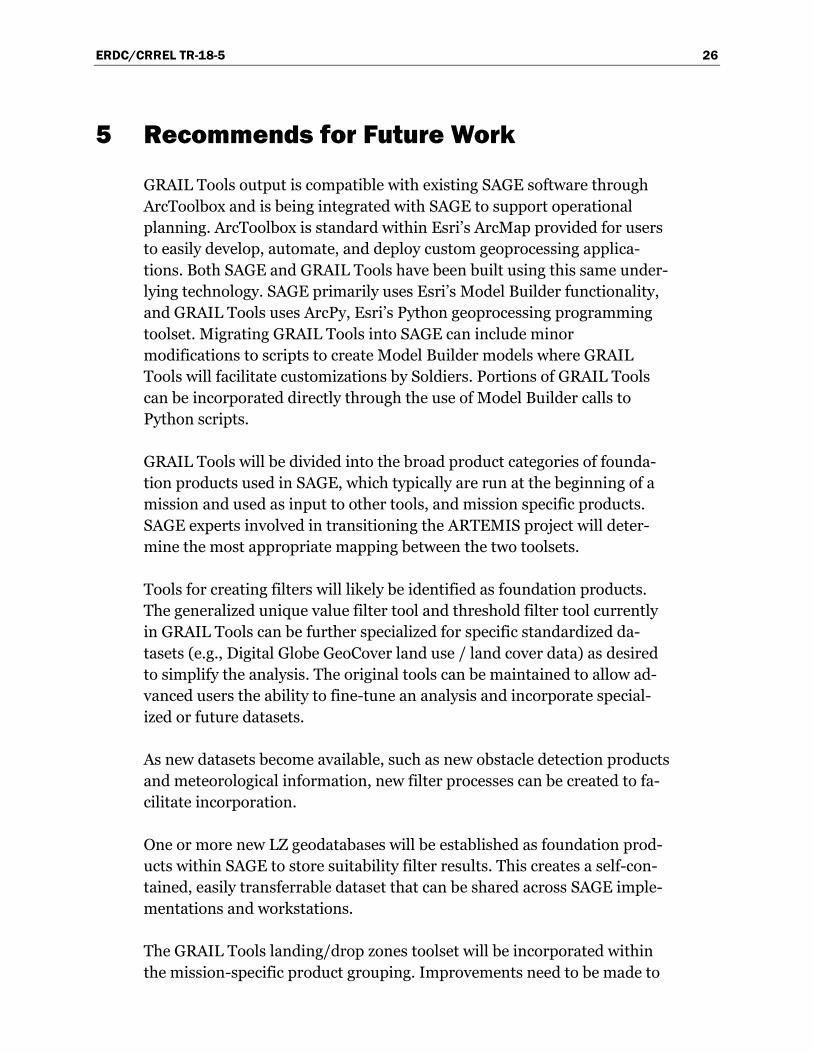
An additional requirement for an austere LZ is to avoid obstacles such as fences, ditches, and power lines, which may not be easily detected on nor-mal terrain datasets or imagery. West (2017) explored a machine-learning algorithm for automatically detecting linear and repetitive features. The obstacles detected could then be included in the LZ search tool as a binary layer to indicate areas or pixels where obstacles are present, making it un-suitable for an LZ. West (2017) checked the repetitive-feature algorithm to see if it could find power poles in otherwise clear DZs, as successfully demonstrated in Figure 18. The linear algorithm was tested to search for obstacles near a proposed LZ on sea ice, where it successfully located a large crack shown in Figure 19, requiring movement of the LZ to a more suitable location.
Figure 18. Using machine learning to automatically detect power lines not easily visible on imagery (West 2017, map data: Google). Top: Initial
image. Middle: Conversion to binary filtered image. Bottom: Detected telephone poles.

ERDC/CRREL TR-18-5 25
Figure 19. Using machine learning to automatically detect large cracks (shown in light green) on a proposed sea ice LZ along the red centerline, which was subsequently moved to a safer
location.
ERDC/CRREL TR-18-5 26
5 Recommends for Future Work
GRAIL Tools output is compatible with existing SAGE software through ArcToolbox and is being integrated with SAGE to support operational planning. ArcToolbox is standard within Esri’s ArcMap provided for users to easily develop, automate, and deploy custom geoprocessing applica-tions. Both SAGE and GRAIL Tools have been built using this same under-lying technology. SAGE primarily uses Esri’s Model Builder functionality, and GRAIL Tools uses ArcPy, Esri’s Python geoprocessing programming toolset. Migrating GRAIL Tools into SAGE can include minor modifications to scripts to create Model Builder models where GRAIL Tools will facilitate customizations by Soldiers. Portions of GRAIL Tools can be incorporated directly through the use of Model Builder calls to Python scripts.
GRAIL Tools will be divided into the broad product categories of founda-tion products used in SAGE, which typically are run at the beginning of a mission and used as input to other tools, and mission specific products. SAGE experts involved in transitioning the ARTEMIS project will deter-mine the most appropriate mapping between the two toolsets.
Tools for creating filters will likely be identified as foundation products. The generalized unique value filter tool and threshold filter tool currently in GRAIL Tools can be further specialized for specific standardized da-tasets (e.g., Digital Globe GeoCover land use / land cover data) as desired to simplify the analysis. The original tools can be maintained to allow ad-vanced users the ability to fine-tune an analysis and incorporate special-ized or future datasets.
As new datasets become available, such as new obstacle detection products and meteorological information, new filter processes can be created to fa-cilitate incorporation.
One or more new LZ geodatabases will be established as foundation prod-ucts within SAGE to store suitability filter results. This creates a self-con-tained, easily transferrable dataset that can be shared across SAGE imple-mentations and workstations.
The GRAIL Tools landing/drop zones toolset will be incorporated within the mission-specific product grouping. Improvements need to be made to
ERDC/CRREL TR-18-5 27
these tools to streamline LD/DZ size specifications for specific aircraft. Re-search can be performed to also automate selection of suitability filters based on mission planning specifications and data availability within foun-dation product databases.
User input continues to inform future advancements to GRAIL Tools. Ar-eas already identified as needing future inclusion are analysis of approach and take-off angles and availability of a buffer zone around LZ/DZ loca-tions to perform specific mission tasks. Data for these additional capabili-ties are readily available. Future code development followed by algorithm verification and validation will enable new tools to perform these second-ary analyses. Additionally, more aircraft can be added to the pick list with further input from the operations community.
GRAIL currently focuses on soil systems, but parameters and datasets for cold regions, such as snow-covered, ice-covered, or frozen ground, are be-ing developed concurrently with other research programs in this area. Other work under ARTEMIS GRAIL has included several initial field col-lection campaigns at austere regions such as Antarctica, Alaska, Canada, and northern Scandinavia, which are setting conditions necessary for the development and testing of a “Cold GRAIL” toolkit. This will become espe-cially relevant for the DoD as operational requirements in regions with cold-impacted terrain become increasingly relevant to national security. Additionally, to improve application of GRAIL across a wide variety of us-ers, tandem work is being executed (Sinclair and Shoop 2017) to provide an expanded user-weighted risk-based approach.
ERDC/CRREL TR-18-5 28
6 Summary and Conclusion
The GRAIL efforts under the ARTEMIS project have made significant ad-vances in the remote assessment of terrain and soils for the location of po-tential LZ and DZ sites for military operations. This project has identified sources of high-quality geospatial data and has defined preprocessing re-quirements to produce global imagery for analysis. With these images as input, the GRAIL Tools use suitability filters to determine if an area is a potential LZ/DZ with regard to slope, land cover, soil strength, or other user-defined criteria. GRAIL Tools then applies geometric analysis to de-termine if the required LZ/DZ will fit within the suitable area identified and then outputs the potential LZ and DZ areas superimposed over the ge-ospatial imagery. The GRAIL Tools software and output are compatible with existing Army SAGE software.
Initial work took place at Fort Hunter Liggett, California, to develop and train the suitability filter algorithms with regard to vegetation, obstruc-tions, and soil strength. Future work at a variety of sites, with the addition of work in arctic and subarctic regions with snow, ice, and permafrost soils, will evolve the GRAIL Tools further to handle the full spectrum of global terrain where military operations may be required.
ERDC/CRREL TR-18-5 29
References Bieszczad, J., M. P. Ueckermann, C. A. Brooks, R. Chambers, W. E. Audette, and J. D.
Walthour. 2016. DASSP: A System for High-Resolution, Global Prediction of Soil Moisture Content and Soil Strength. Presented at the 30th Conference on Hydrology, 11–14 January, New Orleans, LA. Boston, MA: American Meteorological Society. https://ams.confex.com/ams/96Annual/webprogram/Paper288342.html.
Desilets, D., M. Zreda, and T. P. A. Ferré. 2010. Nature’s Neutron Probe: Land Surface Hydrology at an Elusive Scale with Cosmic Rays. Water Resources Research 46:W11505. doi:10.1029/2009WR008726.
Desilets, D., and M. Zreda. 2013. Footprint Diameter for a Cosmic-Ray Soil Moisture Probe: Theory and Monte Carlo Simulations. Water Resources Research 49:3566–3575. doi:10.1002/wrcr.20187.
Digital Globe. 2018. The Largest Constellation in the Industry. Westminster, CO: DigitalGlobe, Inc. https://www.digitalglobe.com/about/our-constellation.
Dong, J., T. E. Ochsner, M. Zreda, M. H. Cosh, and C. B. Zou. 2014. Calibration and Validation of the COSMOS Rover for Surface Soil Moisture Measurement. Vadose Zone Journal 13 (4). doi:10.2136/vzj2013.08.0148.
European Soil Data Centre. 2018. European Soil Data Centre (ESDAC). European Commission, Joint Research Centre, European Soil Data Center. https://esdac.jrc.ec.europa.eu/ (accessed February 2018).
FAO (Food and Agriculture Organization). 2017a. Legacy Soil Maps and Soils Databases. FAO Soils Portal. http://www.fao.org/soils-portal/soil-survey/soil-maps-and-databases/en/ (accessed 18 October 2017).
———. 2017b. FAO/UNESCO Soil Map of the World. FAO Soils Portal. http://www.fao.org/soils-portal/soil-survey/soil-maps-and-databases/faounesco-soil-map-of-the-world/en/ (accessed 18 October 2017).
Jet Propulsion Laboratory. 2015. NASA Soil Moisture Radar Ends Operations, Mission Science Continues. Jet Propulsion Laboratory, California Institute of Technology. 2 September. https://www.jpl.nasa.gov/news/news.php?feature=4710.
Köhli M., M. Schrön, M. Zreda, U. Schmidt, P. Dietrich, and S. Zacharias. 2015. Footprint Characteristics Revised for Field-Scale Soil Moisture Monitoring with Cosmic-Ray Neutrons. Water Resources Research 51 (7): 5772–5790. doi:10.1002/2015WR017169.
Multi-Resolution Land Characteristics Consortium. 2011. National Land Cover Database 2011 (NLCD 2011). Sioux Falls, SD: U.S. Geological Survey, Earth Resources Observation and Science Center, Multi-Resolution Land Characteristics Consortium Project. http://www.mrlc.gov/nlcd2011.php.
NASA (National Aeronautics and Space Administration). 2015. NASA Launches Groundbreaking Soil Moisture Mapping Satellite. Release 15-016, 31 January. http://www.nasa.gov/press/2015/january/nasa-launches-groundbreaking-soil-moisture-mapping-satellite.
ERDC/CRREL TR-18-5 30
NOAA (National Oceanic and Atmospheric Administration). 2015. What is LIDAR? Silver Spring, MD: National Oceanic and Atmospheric Administration, National Ocean Service. http://oceanservice.noaa.gov/facts/lidar.html.
Rosolem, R., W. J. Shuttleworth, M. Zreda, T. E. Franz, X. Zeng, and S. A. Kurc. 2013. The Effect of Atmospheric Water Vapor on Neutron Count in the Cosmic-Ray Soil Moisture Observing System. Journal of Hydrometeorology 14:1659–1671. doi:10.1175/JHM-D-12-0120.1
Shoop, S. A., C. Ryerson, R. Affleck, J. Buska, and J. Kost. 2008. Predicting Soil Strength for Opportune Landing Sites. In Transportation Systems 2008 Workshop, Phoenix, AZ, 21–24 April. CD-ROM. Omaha, NE: USACE Transportation Systems Center.
Sinclair, S., S. Shoop, and E. Ochs. 2017. A Remote Sensing Technique to Locate Austere LZs for Military Aircraft. Poster session at the Geological Society of America Annual Meeting, Seattle WA, 22–25 October 2017.
Sopher, A. M., S. A. Shoop, J. M. Stanley, and B. T. Tracy. 2016a. Image Analysis and Classification Based on Soil Strength. ERDC/CRREL TR-16-13. Hanover, NH: US Army Engineer Research and Development Center.
———. 2016b. Image Analysis and Classification Based on Soil Strength. In Proceedings, 8th Americas Conference of the International Society for Terrain Vehicle Systems (ISTVS), 12–14 September, Detroit, MI, paper number 98. https://www.istvs.org/proceedings-orders/8th-north-american-conf-2016-detroit.
USDA-NRCS (U.S. Department of Agriculture, Natural Resources Conservation Service). n.d. Description of SSURGO Database. Washington, DC: U.S. Department of Agriculture, Natural Resources Conservation Service. http://www.nrcs.usda.gov/wps/portal/nrcs/detail/soils/survey/geo/?cid=nrcs142p2_053627 (accessed 28 March 2018).
West, B. 2017. Linear and Repetitive-Feature Detection within Remotely Sensed Imagery. ERDC/CRREL TR-17-6. Hanover, NH: U.S. Army Engineer Research and Development Center.
Wieder and Shoop. 2017. LZ and DZ Criteria. ERDC/CRREL SR-17-1. Hanover, NH: U.S. Army Engineer Research and Development Center.
Zreda, M., D. Desilets, T. P. A. Ferré, and R. L. Scott. 2008. Measuring Soil Moisture Content Non-Invasively at Intermediate Spatial Scale using Cosmic-Ray Neutrons. Geophysical Research Letters 35 (21): L21402, doi:10.1029/2008GL035655.
Zreda, M., W. J. Shuttleworth, X. Xeng, C. Zweck, D. Desilets, T. E. Franz, and R. Rosolem. 2012. COSMOS: The COsmic-ray Soil Moisture Observing System. Hydrology and Earth System Sciences 16:4079–4099. doi:10.5194/hess-16-1-2012.
ERDC/CRREL TR-18-5 31
: Data Sources
A.1 Soil Survey Geographic (SSURGO)
A.2 Food and Agriculture Organization (FAO) of the United Nations
ERDC/CRREL TR-18-5 32
with collaboration between innumerable soil scientists and remained until recently the only global overview of soil resources (FAO 2017b).
Other legacy maps and databases available through FAO refer to data and maps compiled using field surveys backed up by remote sensing and other environmental data, expert opinion, and laboratory analysis. The bulk of soil information was collected in this way. The technological advances in remote sensing, computers, terrain analysis, geostatistics, GIS data inte-gration, and instrumentation have made it possible to achieve unprece-dented reliability and utility in digital soil maps (FAO 2017a).
A.3 European Soils Database
The European Soils Database (ESDB) can be found as part of the Euro-pean Soil Data Centre’s online data repository (European Soil Data Centre 2018). The ESDB data were developed in collaboration with the European Soil Bureau Network. Data cover the entirety of the European Union and are available in both raster and vector formats. Data use the Geographical Information System of the Commission’s Lambert Azimuth coordinate system. The Geographical Information System of the Commission is the agency responsible for meeting the European Commission’s geographical information needs. The soils database has several data subsections, includ-ing topsoil (at 500 m resolution), organic topsoil (at 1000 m resolution), European Union soils (at 10,000 m resolution), and three-dimensional soil hydraulic data (at 250 m resolution).
A.4 Soil Moisture Active Passive (SMAP) satellite
The SMAP observatory was launched on 31 January 2015, from Vanden-berg Air Force Base, California. SMAP’s combined radar and radiometer instruments were intended to peer into the top 5 cm (2 in.) of soil through clouds and moderate vegetation cover, day and night, to produce high-res-olution, accurate soil moisture maps. SMAP could also detect whether the ground was frozen or thawed. However, on 7 July 2015, SMAP partially failed when the radar stopped transmitting.
SMAP orbits Earth from pole to pole every 98.5 minutes, repeating the same ground track every 8 days. Its 1000 km (620 mile) measurement swath allows SMAP to cover Earth’s entire equatorial region every 3 days and higher latitudes every 2 days. SMAP’s active radar and passive radi-

ERDC/CRREL TR-18-5 33
ometer instruments were designed to complement each other and to miti-gate the limitations of each measurement alone. The radar enabled high-resolution measurements of up to 3.1 km (1.9 miles) but with lower accu-racy for sensing surface soil moisture. In contrast, the microwave radiome-ter was more accurate in its measurements but had lower resolution of about 40 km (25 miles). By combining the active and passive measure-ments, SMAP was designed to estimate soil moisture at a resolution of about 9 km (5.6 miles).
The SMAP team at NASA’s Jet Propulsion Laboratory in Pasadena, Cali-fornia, engaged with many organizations and individuals that saw immedi-ate uses for the satellite’s data. Through workshops and tutorials, the SMAP Applications Working Group collaborated with 45 “early adopters” to test and integrate the mission’s data products into many different appli-cations. Early adopters included weather forecasters from several nations and researchers and planners from the U.S. Department of Agriculture, U.S. Geological Survey, U.S. Centers for Disease Control and Prevention, the United Nations World Food Programme, and CRREL.
From February through April 2015, SMAP and its ground system were commissioned to ensure they were fully functional and ready to begin rou-tine science data collection. SMAP science operations then began, and SMAP data was under calibration and validation (NASA 2015).
On 7 July 2015, SMAP’s radar stopped transmitting due to an anomaly in-volving the radar’s high-power amplifier (HPA). The HPA was designed to boost the power level of the radar’s pulse to more than 500 W, ensuring that the energy scattered from Earth’s surface could be accurately meas-ured.
A series of diagnostic tests and procedures was performed on both the spacecraft and on the ground using flight spare parts during the summer of 2015. Following an unsuccessful attempt on 24 August 2015 to power up the radar unit, the project had exhausted all identified possible options for recovering nominal operation of the HPA and concluded the radar was not recoverable. The radiometer, however, continues to transmit data today.
SMAP’s radar allowed the mission’s soil moisture and freeze–thaw meas-urements to be resolved to smaller regions of Earth—about 9 km (5.6 miles) for soil moisture and 3 km (1.9 miles) for freeze–thaw. Without
ERDC/CRREL TR-18-5 34
the radar, the mission’s resolving power is limited to regions of almost 40 km (25 miles) for soil moisture and freeze–thaw (Jet Propulsion Labor-atory 2015).
A.5 GeoWATCH
GeoWATCH is a hydrometeorological modeling approach and cloud-based computing architecture for generating high-resolution estimates of soil moisture content and soil strength (Bieszczad et al. 2016). These ground-state conditions are produced with global coverage at spatial scales of tens of meters; and the hydrometeorological modeling approach is applicable to climatological, current, or forecast weather conditions.
GeoWATCH’s ground-state predictions are generated using a physics-based downscaling approach that fuses weather-scale (1/4-degree spatial scale) land-surface-model estimates of soil moisture and land surface wa-ter and energy fluxes with geospatial data, including high-resolution to-pography, land cover, soil classification, and vegetation (1 to 3 arc-second spatial scale). A two-stage physics-based hydrological model is then ap-plied to downscale the weather-scale data to the resolution of the highest-resolution datasets. The first downscaling stage computes steady-state soil moisture redistribution due to topography and soil texture effects. The second downscaling stage accounts for dynamic weather-driven effects by computing water balances that disaggregate water fluxes from the weather-scale land surface model based on the high-resolution geospatial data.
The results of these two downscaling stages are then combined, yielding high-resolution soil moisture estimates. These estimates are combined with soil texture classification data as inputs to soil strength prediction al-gorithms (e.g., estimation of rating cone index). GeoWATCH provides near-real-time, global soil moisture predictions (Bieszczad et al. 2016).
A.6 Cosmic-Ray Soil Moisture Observing System (COSMOS)
When cosmic rays, which are high-energy subatomic particles that origi-nate in outer space, penetrate the atmosphere, fast neutrons are generated by interactions with atmospheric nuclei (Dong et al. 2014). As these cos-mic rays interact with the land surface, additional fast neutrons are pro-duced. Because neutrons and hydrogen atoms have similar mass, these
ERDC/CRREL TR-18-5 35
fast neutrons are moderated by pools of hydrogen existing in the land sur-face (mainly in the form of water); thus, the fast neutron intensity above the land surface is inversely correlated with soil moisture (Zreda et al. 2008). This provides the theoretical basis for the cosmic-ray neutron probe method of soil water content estimation, which can be used in either a fixed or roving platform. COSMOS typically consists of two gas-filled (ei-ther helium-3 or boron trifluoride) neutron detectors that have different energy sensitivities (Desilets et al. 2010; Zreda et al. 2012). One detector is shielded by low-density polyethylene and is sensitive to fast neutrons while the other unshielded detector is sensitive to thermal neutrons.
The sensor typically provides soil moisture content measurements for a circular area with a radius of approximately 300 m (984 ft) and depths of about 12–76 cm (5–30 in.) (Desilets and Zreda 2013; Köhli et al. 2015). This footprint decreases with increasing atmospheric pressure and atmos-pheric water vapor while the measurement precision of the sensor in-creases with increased neutron count rates but decreases with increased soil water content (Zreda et al. 2012; Desilets and Zreda 2013; Rosolem et al. 2013).
A.7 National Land Cover Database (NLCD)
The U.S. Geological Survey collects and maintains data that show both natural and manmade land cover of the United States. These data are col-lected from orbiting Landsat satellites and produced for access via NLCD. NLCD encompasses all 50 states and Puerto Rico. NLCD 2011 is a 16-class land cover classification scheme that includes urban, agricultural, range-land, forest, surface waters, wetlands, scrublands, grasslands, barren lands, and perennial ice/snow classes. The spatial resolution of the data is 30 m (98 ft) (Multi-Resolution Land Characteristics Consortium 2011).
A.8 Digital Globe WorldView-2 and WorldView-3
Digital Globe’s WorldView-2 (WV2) launched in October 2009 and was the first high-resolution, 8-band, multispectral commercial satellite. Oper-ating at an altitude of 770 km (478 miles), WV2 provides 46 cm (18 in.) panchromatic resolution and 1.85 m (6 ft) multispectral resolution. WV2 has an average revisit time of 1.1 days and is capable of collecting up to 1 million square kilometers (386,000 square miles) of 8-band imagery per day (Digital Globe 2018).

ERDC/CRREL TR-18-5 36
WorldView-3 (WV3), launched in August 2014, is a multispectral imager that operates at 617 km (383 miles) and can collect one band of 31 cm (12 in.) panchromatic resolution, 8 bands of 1.24 m (4 ft) multispectral resolu-tion, and 8 bands of 3.7 m (12 ft) short-wave infrared resolution. Com-pared to WV2, WV3 offers greater spatial resolution and includes an addi-tional 8 short-wave infrared bands, allowing for greater spectral resolu-tion. Short-wave infrared can detect chemistry based on absorption and can facilitate the identification of soils and minerals. (Digital Globe 2018).
A.9 LiDAR
LiDAR is a remote-sensing method that uses light in the form of a pulsed laser to measure ranges (variable distances) to the Earth. These light pulses—combined with other data recorded by the airborne system—gen-erate precise, three-dimensional information about the shape of the Earth and its surface characteristics.
A LiDAR instrument principally consists of a laser, a scanner, and a spe-cialized Global Positioning System (GPS) receiver. Airplanes, helicopters, and drones are the most commonly used platforms for acquiring LiDAR data over broad areas. Two types of LiDAR are topographic and bathymet-ric. Topographic LiDAR typically uses a near-infrared laser to map the land while bathymetric LiDAR uses water-penetrating green light to also measure seafloor and riverbed elevations. LiDAR is a product of the Na-tional Oceanic Atmospheric Administration (NOAA 2015).
ERDC/CRREL TR-18-5 37
: GRAIL Tools Screen Shots
FFigure B-1. GRAIL Tools dialog box as displayed in ArcGIS (top image) with an example of the GRAIL soil strength calculation tool (bottom image). Soil classification and soil moisture
datasets are used as input rasters, and a soil strength map (in units of CBR) is generated as output.
ERDC/CRREL TR-18-5 38
FFigure B-2. The GRAIL locate LZ tool as depicted in ArcGIS. Binary suitability filters are usedas input, runway size specifications are selected (and are customizable), a bearing angle
interval is selected, and LZs are generated as output.
Figure B-3. The GRAIL locate DZ tool as depicted in ArcGIS. Binary suitability filters are used as input, DZ size specifications are selected (and are customizable), and DZs are generated
as output.
ERDC/CRREL TR-18-5 39
FFigure B-4. LZ results for a C-130 generated using slope and land classification datasets.Results are sorted by risk (95% or 100% of pixels meeting the suitability criteria). An example
of the results listed in a GIS table of contents are displayed on the left.
ERDC/CRREL TR-18-5 40
: Field Modifications of Land Classification Categories for LZ/DZ
REPORT DOCUMENTATION PAGE Form Approved OMB No. 0704-0188
Public reporting burden for this collection of information is estimated to average 1 hour per response, including the time for reviewing instructions, searching existing data sources, gathering and maintaining the data needed, and completing and reviewing this collection of information. Send comments regarding this burden estimate or any other aspect of this collection of information, including suggestions for reducing this burden to Department of Defense, Washington Headquarters Services, Directorate for Information Operations and Reports (0704-0188), 1215 Jefferson Davis Highway, Suite 1204, Arlington, VA 22202-4302. Respondents should be aware that notwithstanding any other provision of law, no person shall be subject to any penalty for failing to comply with a collection of information if it does not display a currently valid OMB control number. PLEASE DO NOT RETURN YOUR FORM TO THE ABOVE ADDRESS. 1. REPORT DATE (DD-MM-YYYY)
April 2018 2. REPORT TYPE
Technical Report/Final 3. DATES COVERED (From - To)
4. TITLE AND SUBTITLE
Using GRAIL Tools to Remotely Assess Terrain Conditions for Austere Entry
5a. CONTRACT NUMBER
5b. GRANT NUMBER
5c. PROGRAM ELEMENT NUMBER T42 P2 448312 and 5L923J
6. AUTHOR(S)
Sally A. Shoop, Wendy L. Wieder, Elke S. Ochs, and Samantha N. Sinclair 5d. PROJECT NUMBER
5e. TASK NUMBER
5f. WORK UNIT NUMBER
7. PERFORMING ORGANIZATION NAME(S) AND ADDRESS(ES) 8. PERFORMING ORGANIZATION REPORT
NUMBER
U.S. Army Engineer Research and Development Center (ERDC) Cold Regions Research and Engineering Laboratory (CRREL) 72 Lyme Road Hanover, NH 03755-1290
ERDC/CRREL TR-18-5
9. SPONSORING / MONITORING AGENCY NAME(S) AND ADDRESS(ES) 10. SPONSOR/MONITOR’S ACRONYM(S) Assistant Secretary of the Army for Acquisition, Logistics, and Technology 103 Army Pentagon Washington, DC 20314-1000
11. SPONSOR/MONITOR’S REPORT NUMBER(S)
12. DISTRIBUTION / AVAILABILITY STATEMENT Approved for public release; distribution is unlimited.
13. SUPPLEMENTARY NOTES ERDC 6.2 Geospatial Research and Engineering (GRE) Applied Research Program Army Terrestrial-Environmental Modeling and Intelligence System Science Technology Objective—Research (ARTEMIS STO-R) 14. ABSTRACT The Geospatial Remote Assessment for Ingress Locations (GRAIL) efforts under the Army Terrestrial-Environmental Modeling and Intelligence System (ARTEMIS) program have made significant advances in the remote assessment of terrain and soils for locating potential landing zone and drop zone (LZ and DZ) sites for military operations. The project identified sources of high-quality geospatial data, defined preprocessing requirements to produce global datasets for analysis, and created the GRAIL Tools software. The GRAIL Tools algorithms analyze and filter geospatial datasets to search for areas suitable for aircraft ground operations. GRAIL Tools then applies geometric criteria to determine if the required LZ/DZ will fit within the areas of suitable terrain and displays the potential LZs and DZs superimposed over geospatial imagery.
Verification of the GRAIL Tools concept at Fort Hunter Liggett, California, developed and trained the suitability filter algorithms with regard to vegetation, obstructions, and soil strength. Further work served to enhance the algorithms and develop the full toolkit. Future work at a variety of sites, including work in northern regions with snow, ice, and freezing/thawing soils, will evolve the GRAIL Tools to handle the full spectrum of global terrain conditions for military operations.
15. SUBJECT TERMS Remote-sensing images, Shear strength of soils, Soil moisture, Soils--Remote sensing, Trafficability
16. SECURITY CLASSIFICATION OF: 17. LIMITATION OF ABSTRACT
18. NUMBER OF PAGES
19a. NAME OF RESPONSIBLE PERSON
a. REPORT
Unclassified
b. ABSTRACT
Unclassified
c. THIS PAGE
Unclassified SAR 51 19b. TELEPHONE NUMBER (include area code)
Standard Form 298 (Rev. 8-98) Prescribed by ANSI Std. 239.18