Embed Size (px)
Citation preview
Quarterly Presentation Q3 2016
DOF Subsea Group
DOF Subsea Group
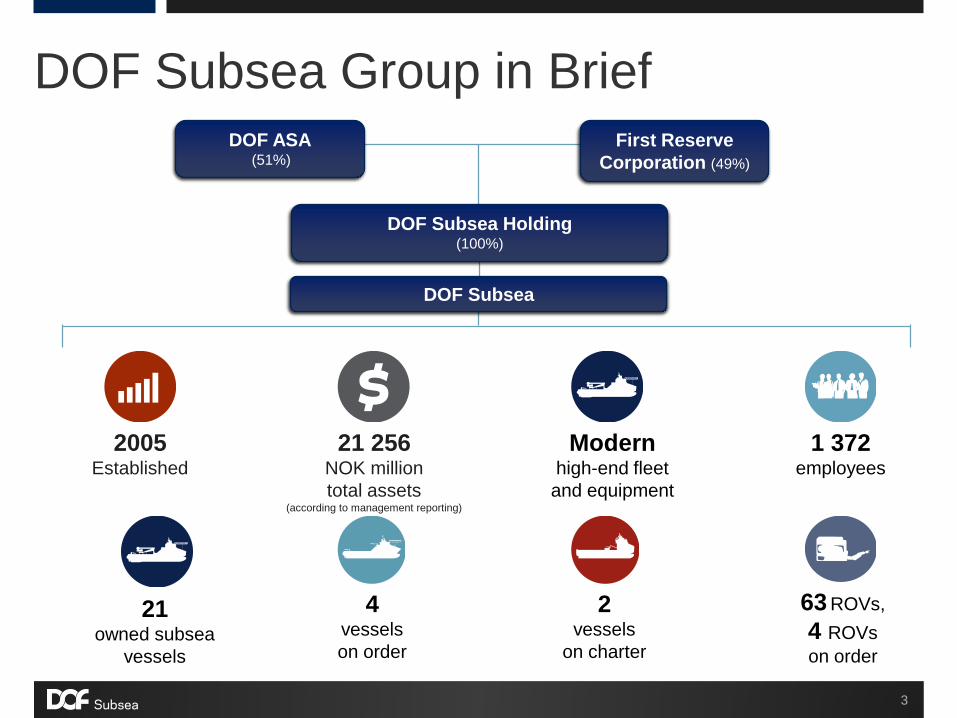
DOF Subsea Group in Brief
3
2005Established
21 256NOK million
total assets(according to management reporting)
Modernhigh-end fleet
and equipment
21owned subsea
vessels
4vessels
on order
2vessels
on charter
63 ROVs,
4 ROVs
on order
First Reserve
Corporation (49%)
1 372employees
DOF Subsea
DOF Subsea Holding(100%)
DOF ASA(51%)
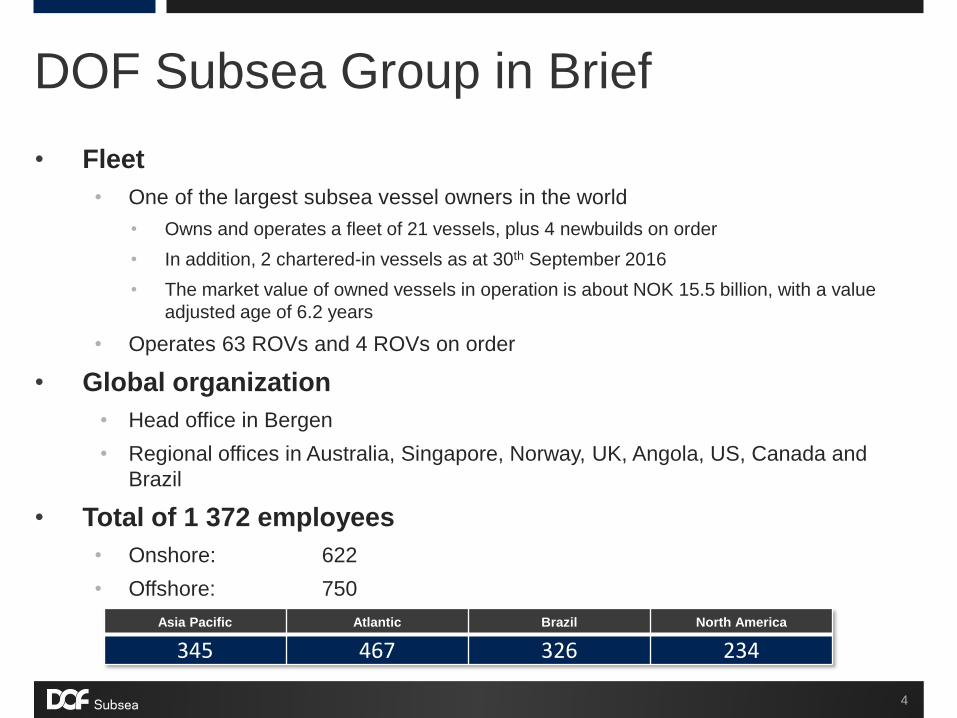
DOF Subsea Group in Brief
• Fleet
• One of the largest subsea vessel owners in the world
• Owns and operates a fleet of 21 vessels, plus 4 newbuilds on order
• In addition, 2 chartered-in vessels as at 30th September 2016
• The market value of owned vessels in operation is about NOK 15.5 billion, with a value
adjusted age of 6.2 years
• Operates 63 ROVs and 4 ROVs on order
• Global organization
• Head office in Bergen
• Regional offices in Australia, Singapore, Norway, UK, Angola, US, Canada and
Brazil
• Total of 1 372 employees
• Onshore: 622
• Offshore: 750
4
Asia Pacific Atlantic Brazil North America
345 467 326 234
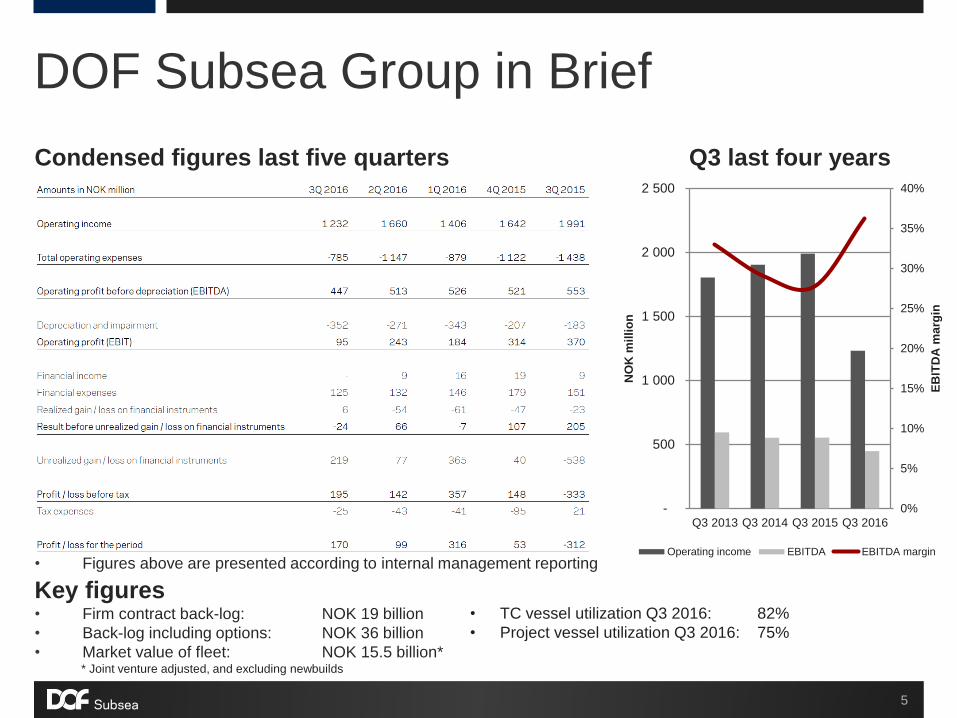
DOF Subsea Group in Brief
Condensed figures last five quarters Q3 last four years
• Figures above are presented according to internal management reporting
Key figures• Firm contract back-log: NOK 19 billion
• Back-log including options: NOK 36 billion
• Market value of fleet: NOK 15.5 billion*
5
0%
5%
10%
15%
20%
25%
30%
35%
40%
-
500
1 000
1 500
2 000
2 500
Q3 2013 Q3 2014 Q3 2015 Q3 2016
EB
ITD
A m
arg
in
NO
K m
illi
on
Operating income EBITDA EBITDA margin
• TC vessel utilization Q3 2016: 82%
• Project vessel utilization Q3 2016: 75%
* Joint venture adjusted, and excluding newbuilds
Recent Events
• Fleet
• First of four PLSVs, Skandi Açu, on-hire with Petrobras from 13th of August
• Delivery of second PLSV, Skandi Buzios, from yard. Vessel in Holland for topside
installation
• On-hire with Petrobras from Q2 2017
• Agreement regarding sale of Skandi Santos to AKASTOR ASA
• Contracts
• Shell Australia awarded DOF Subsea an IMR contract in Asia Pacific for 5 years firm
plus 2 x 2 years options
• Petrobras awarded Skandi Salvador 1 year IMR contract plus 1 year option
• Finance
• Drawdown of 1st tranche on Skandi Buzios at delivery from yard in September 2016
• Refinancing Skandi Singapore
6
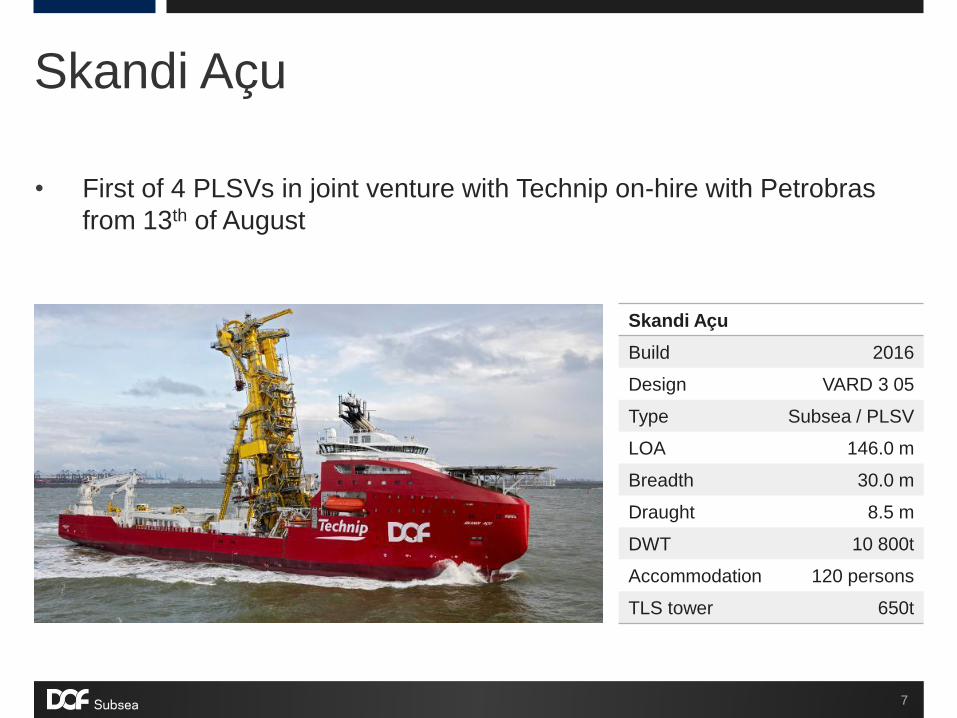
Skandi Açu
• First of 4 PLSVs in joint venture with Technip on-hire with Petrobras
from 13th of August
7
Skandi Açu
Build 2016
Design VARD 3 05
Type Subsea / PLSV
LOA 146.0 m
Breadth 30.0 m
Draught 8.5 m
DWT 10 800t
Accommodation 120 persons
TLS tower 650t
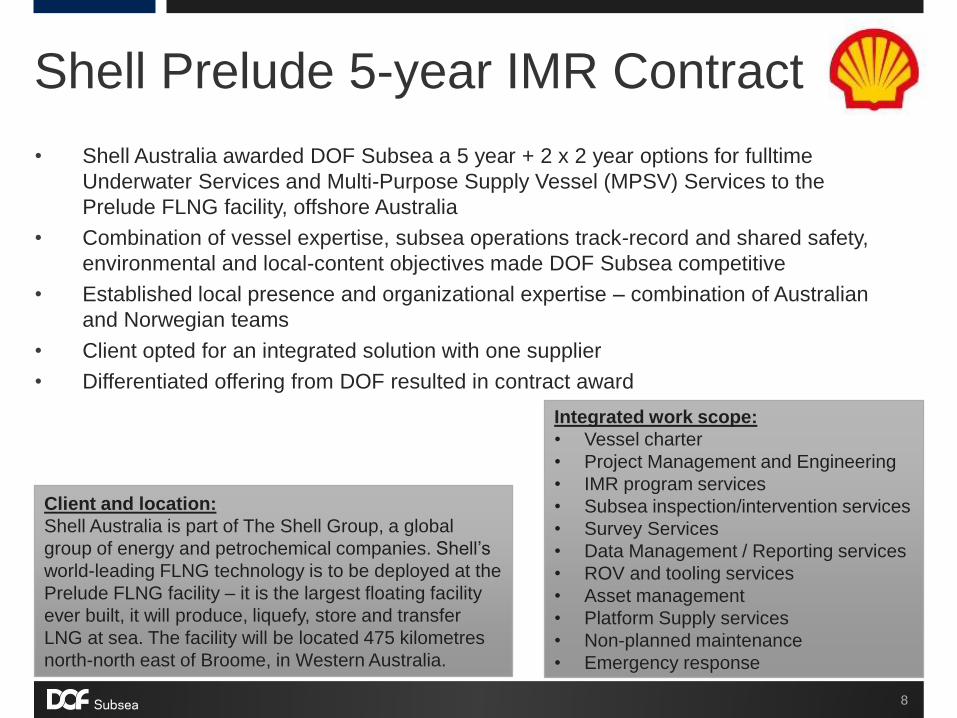
Shell Prelude 5-year IMR Contract
• Shell Australia awarded DOF Subsea a 5 year + 2 x 2 year options for fulltime
Underwater Services and Multi-Purpose Supply Vessel (MPSV) Services to the
Prelude FLNG facility, offshore Australia
• Combination of vessel expertise, subsea operations track-record and shared safety,
environmental and local-content objectives made DOF Subsea competitive
• Established local presence and organizational expertise – combination of Australian
and Norwegian teams
• Client opted for an integrated solution with one supplier
• Differentiated offering from DOF resulted in contract award
8
Integrated work scope:
• Vessel charter
• Project Management and Engineering
• IMR program services
• Subsea inspection/intervention services
• Survey Services
• Data Management / Reporting services
• ROV and tooling services
• Asset management
• Platform Supply services
• Non-planned maintenance
• Emergency response
Client and location:
Shell Australia is part of The Shell Group, a global
group of energy and petrochemical companies. Shell’s
world-leading FLNG technology is to be deployed at the
Prelude FLNG facility – it is the largest floating facility
ever built, it will produce, liquefy, store and transfer
LNG at sea. The facility will be located 475 kilometres
north-north east of Broome, in Western Australia.
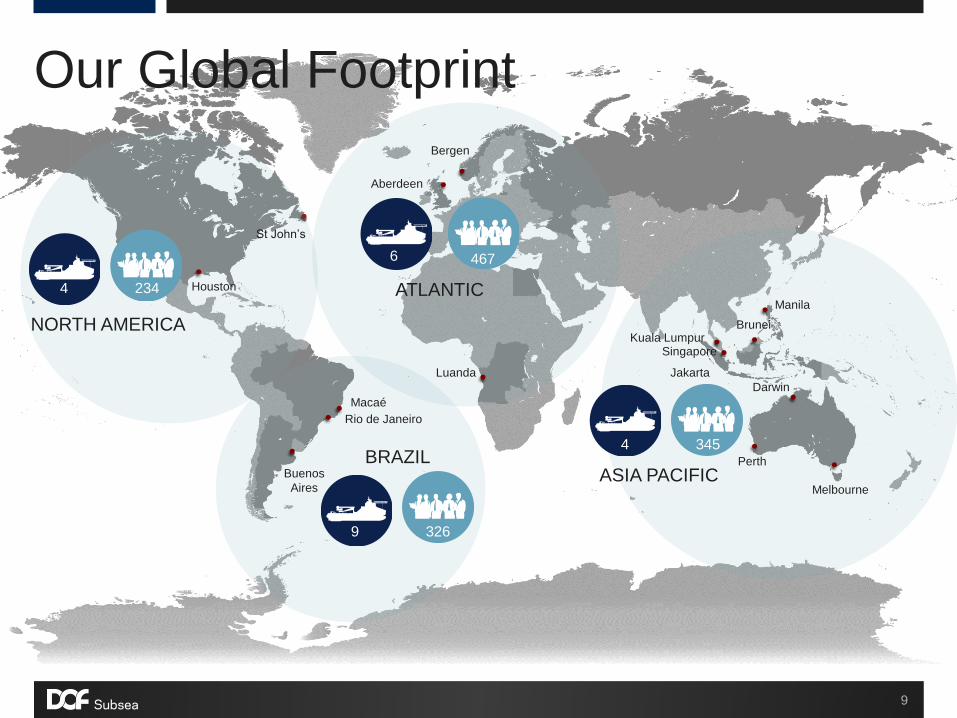
Our Global Footprint
9
ATLANTIC
NORTH AMERICA
BRAZILASIA PACIFIC
Macaé
Rio de Janeiro
Buenos
Aires
Houston
St John’s
Aberdeen
Bergen
Luanda
Singapore
Manila
Melbourne
Jakarta
BruneiKuala Lumpur
Darwin
Perth
3269
4676
2344
3454
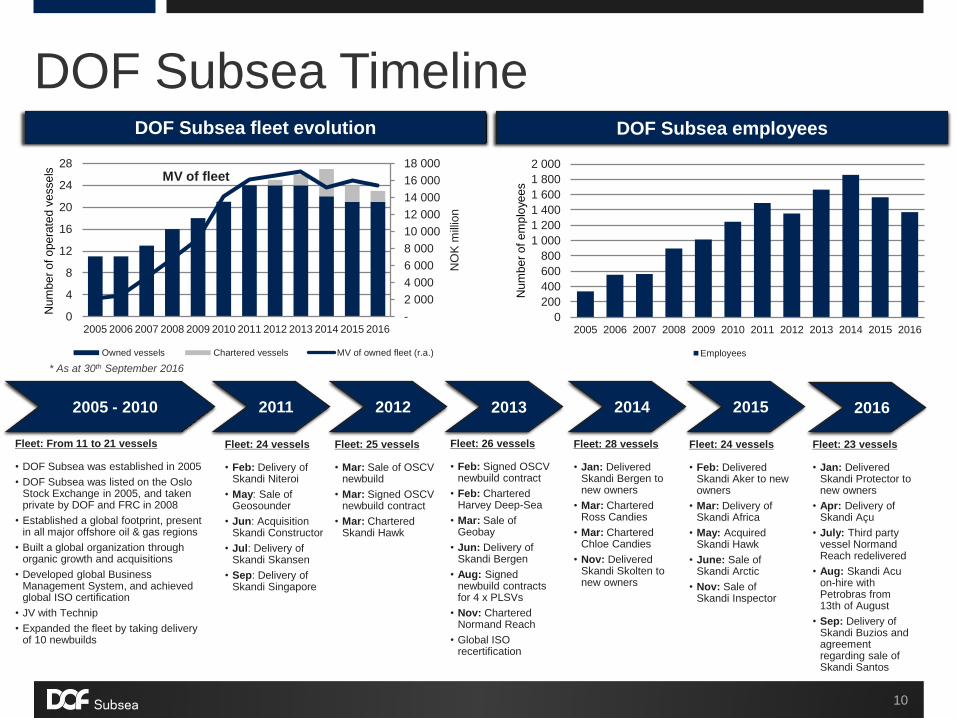
DOF Subsea Timeline
10
DOF Subsea fleet evolution
-
2 000
4 000
6 000
8 000
10 000
12 000
14 000
16 000
18 000
0
4
8
12
16
20
24
28
2005 2006 2007 2008 2009 2010 2011 2012 2013 2014 2015 2016
NO
K m
illio
n
Nu
mb
er
of o
pe
rate
d v
essels
Owned vessels Chartered vessels MV of owned fleet (r.a.)
MV of fleet
2005 - 2010
Fleet: From 11 to 21 vessels
• DOF Subsea was established in 2005
• DOF Subsea was listed on the Oslo Stock Exchange in 2005, and taken private by DOF and FRC in 2008
• Established a global footprint, present in all major offshore oil & gas regions
• Built a global organization through organic growth and acquisitions
• Developed global Business Management System, and achieved global ISO certification
• JV with Technip
• Expanded the fleet by taking delivery of 10 newbuilds
2011
Fleet: 24 vessels
• Feb: Delivery of Skandi Niteroi
• May: Sale of Geosounder
• Jun: Acquisition Skandi Constructor
• Jul: Delivery of Skandi Skansen
• Sep: Delivery of Skandi Singapore
2012
Fleet: 25 vessels
• Mar: Sale of OSCV newbuild
• Mar: Signed OSCV newbuild contract
• Mar: CharteredSkandi Hawk
2013
Fleet: 26 vessels
• Feb: Signed OSCV newbuild contract
• Feb: Chartered Harvey Deep-Sea
• Mar: Sale ofGeobay
• Jun: Delivery of Skandi Bergen
• Aug: Signed newbuild contracts for 4 x PLSVs
• Nov: Chartered Normand Reach
• Global ISO recertification
2014
Fleet: 28 vessels
• Jan: Delivered Skandi Bergen to new owners
• Mar: CharteredRoss Candies
• Mar: CharteredChloe Candies
• Nov: Delivered Skandi Skolten to new owners
DOF Subsea employees
0
200
400
600
800
1 000
1 200
1 400
1 600
1 800
2 000
2005 2006 2007 2008 2009 2010 2011 2012 2013 2014 2015 2016
Nu
mb
er
of e
mp
loye
es
Employees
2015
Fleet: 24 vessels
• Feb: Delivered Skandi Aker to new owners
• Mar: Delivery of Skandi Africa
• May: Acquired Skandi Hawk
• June: Sale of Skandi Arctic
• Nov: Sale of Skandi Inspector
* As at 30th September 2016
2016
Fleet: 23 vessels
• Jan: Delivered Skandi Protector to new owners
• Apr: Delivery of Skandi Açu
• July: Third party vessel Normand Reach redelivered
• Aug: Skandi Acuon-hire with Petrobras from 13th of August
• Sep: Delivery ofSkandi Buzios and agreementregarding sale ofSkandi Santos
Modern High-end Fleet
11
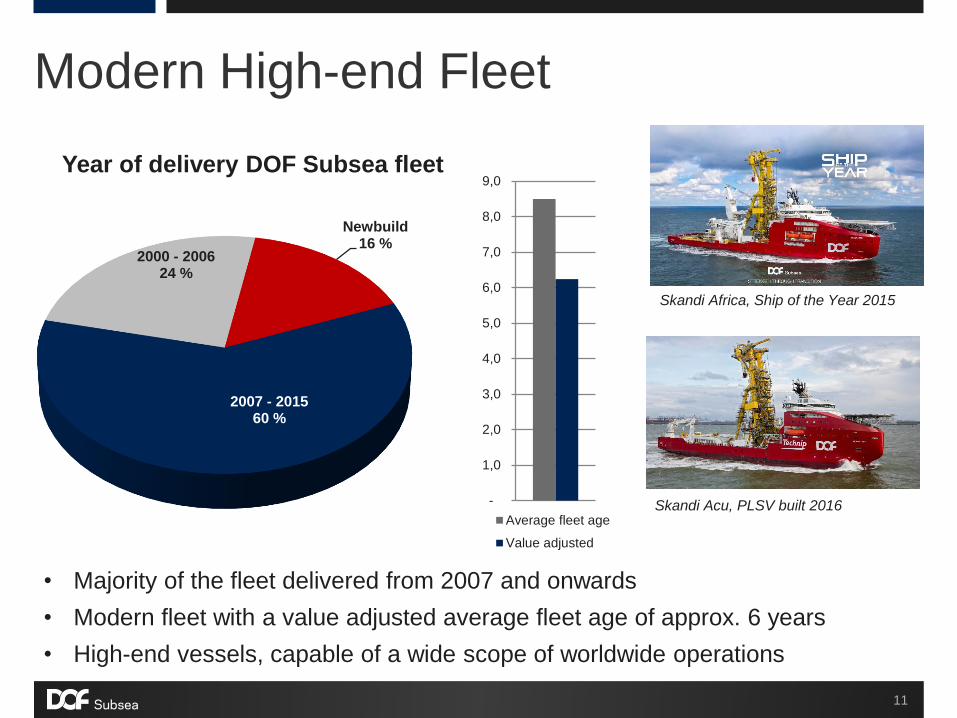
• Majority of the fleet delivered from 2007 and onwards
• Modern fleet with a value adjusted average fleet age of approx. 6 years
• High-end vessels, capable of a wide scope of worldwide operations
Skandi Africa, Ship of the Year 2015
Skandi Acu, PLSV built 2016
Newbuild16 %
2007 - 201560 %
2000 - 200624 %
Year of delivery DOF Subsea fleet
-
1,0
2,0
3,0
4,0
5,0
6,0
7,0
8,0
9,0
Average fleet age
Value adjusted
Business Management
12
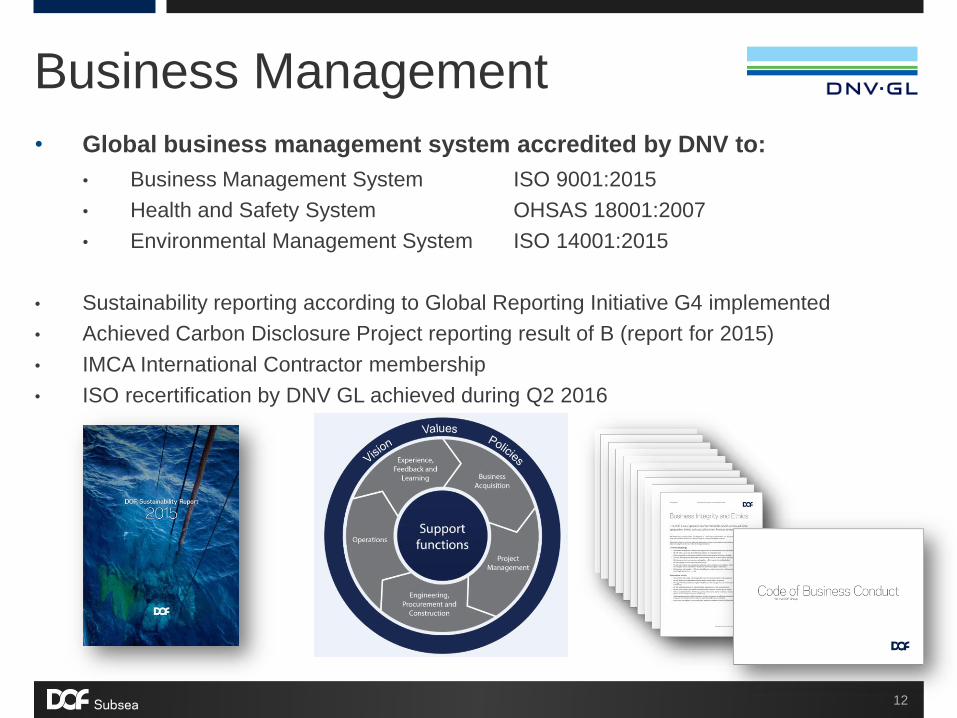
• Global business management system accredited by DNV to:
• Business Management System ISO 9001:2015
• Health and Safety System OHSAS 18001:2007
• Environmental Management System ISO 14001:2015
• Sustainability reporting according to Global Reporting Initiative G4 implemented
• Achieved Carbon Disclosure Project reporting result of B (report for 2015)
• IMCA International Contractor membership
• ISO recertification by DNV GL achieved during Q2 2016
2009
HSEQ Key Statistics
13
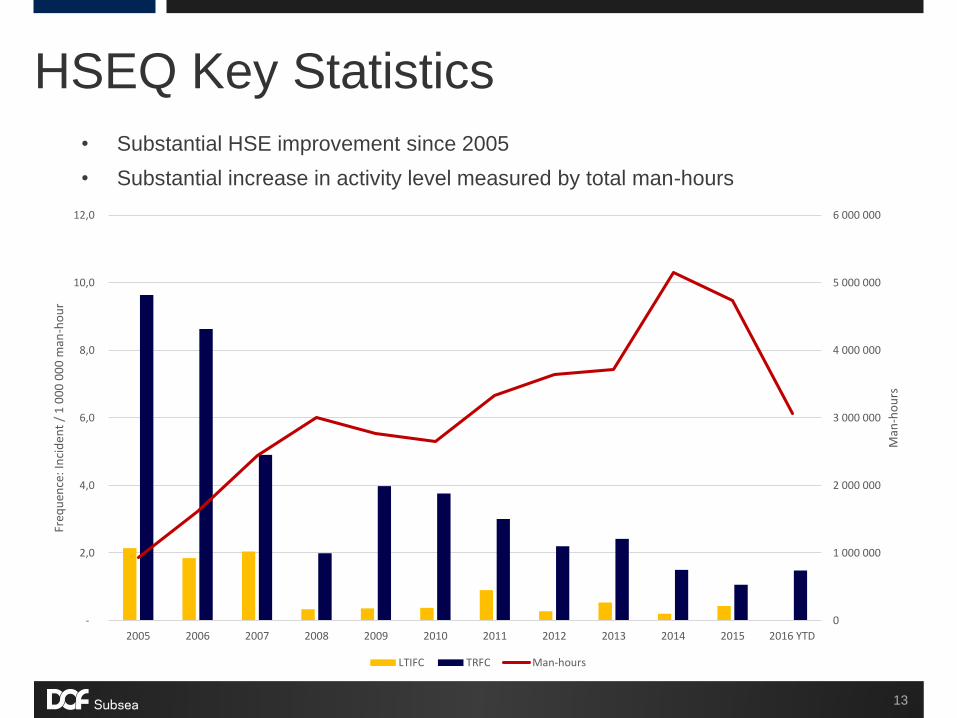
• Substantial HSE improvement since 2005
• Substantial increase in activity level measured by total man-hours
0
1 000 000
2 000 000
3 000 000
4 000 000
5 000 000
6 000 000
-
2,0
4,0
6,0
8,0
10,0
12,0
2005 2006 2007 2008 2009 2010 2011 2012 2013 2014 2015 2016 YTD
Man
-ho
urs
Freq
uen
ce:
Inci
den
t /
1 0
00
00
0 m
an-h
ou
r
LTIFC TRFC Man-hours
DOF Subsea – Projects
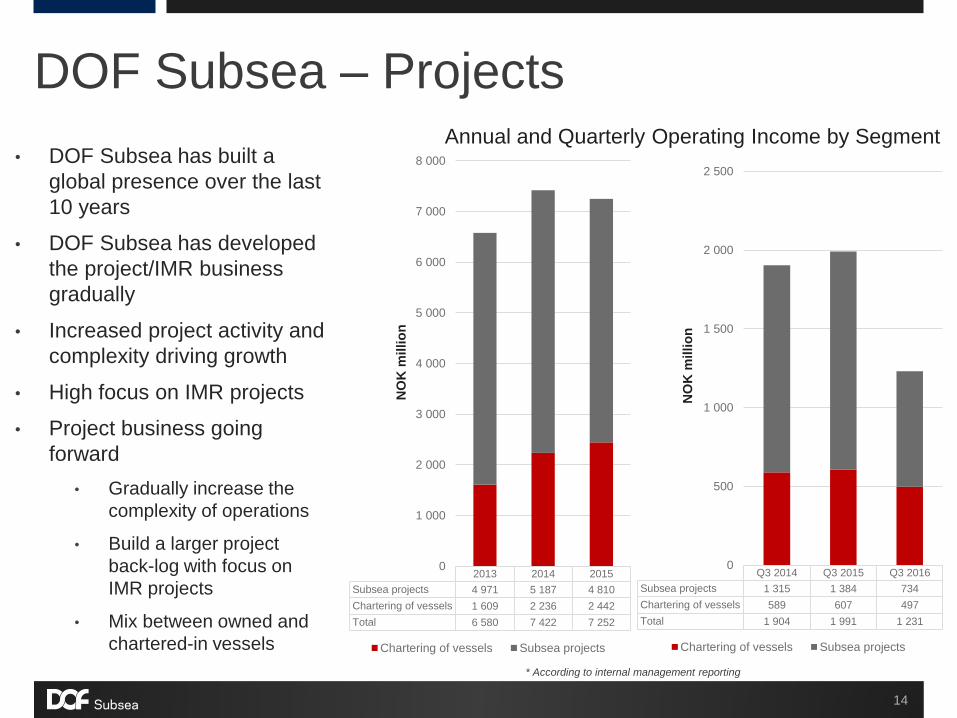
• DOF Subsea has built a
global presence over the last
10 years
• DOF Subsea has developed
the project/IMR business
gradually
• Increased project activity and
complexity driving growth
• High focus on IMR projects
• Project business going
forward
• Gradually increase the
complexity of operations
• Build a larger project
back-log with focus on
IMR projects
• Mix between owned and
chartered-in vessels
14
* According to internal management reporting
Annual and Quarterly Operating Income by Segment
2013 2014 2015
Subsea projects 4 971 5 187 4 810
Chartering of vessels 1 609 2 236 2 442
Total 6 580 7 422 7 252
0
1 000
2 000
3 000
4 000
5 000
6 000
7 000
8 000
NO
K m
illio
n
Chartering of vessels Subsea projects
Q3 2014 Q3 2015 Q3 2016
Subsea projects 1 315 1 384 734
Chartering of vessels 589 607 497
Total 1 904 1 991 1 231
0
500
1 000
1 500
2 000
2 500
NO
K m
illio
n
Chartering of vessels Subsea projects
Back-log
15
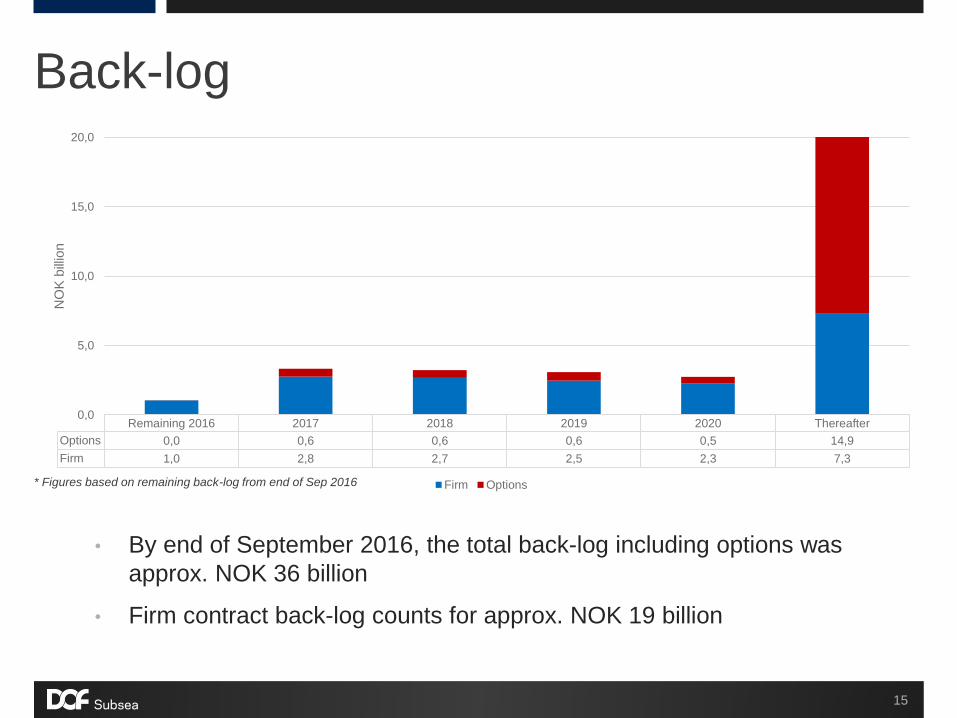
• By end of September 2016, the total back-log including options was
approx. NOK 36 billion
• Firm contract back-log counts for approx. NOK 19 billion
* Figures based on remaining back-log from end of Sep 2016
Remaining 2016 2017 2018 2019 2020 Thereafter
Options 0,0 0,6 0,6 0,6 0,5 14,9
Firm 1,0 2,8 2,7 2,5 2,3 7,3
0,0
5,0
10,0
15,0
20,0
NO
K b
illio
n
Firm Options
Financials
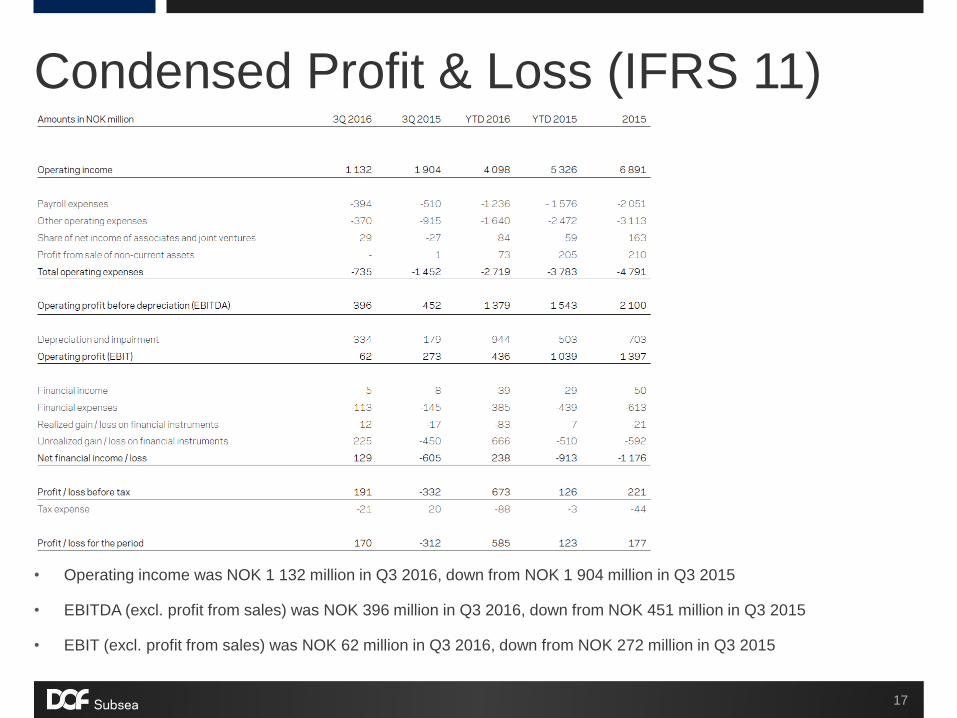
Condensed Profit & Loss (IFRS 11)
• Operating income was NOK 1 132 million in Q3 2016, down from NOK 1 904 million in Q3 2015
• EBITDA (excl. profit from sales) was NOK 396 million in Q3 2016, down from NOK 451 million in Q3 2015
• EBIT (excl. profit from sales) was NOK 62 million in Q3 2016, down from NOK 272 million in Q3 2015
17
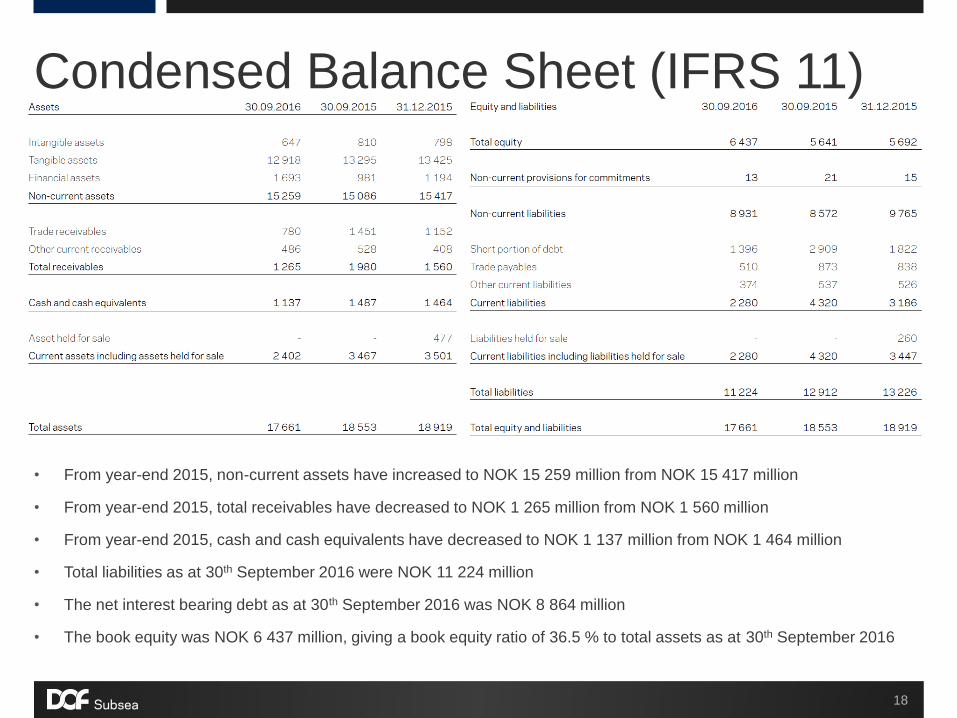
Condensed Balance Sheet (IFRS 11)
• From year-end 2015, non-current assets have increased to NOK 15 259 million from NOK 15 417 million
• From year-end 2015, total receivables have decreased to NOK 1 265 million from NOK 1 560 million
• From year-end 2015, cash and cash equivalents have decreased to NOK 1 137 million from NOK 1 464 million
• Total liabilities as at 30th September 2016 were NOK 11 224 million
• The net interest bearing debt as at 30th September 2016 was NOK 8 864 million
• The book equity was NOK 6 437 million, giving a book equity ratio of 36.5 % to total assets as at 30th September 2016
18
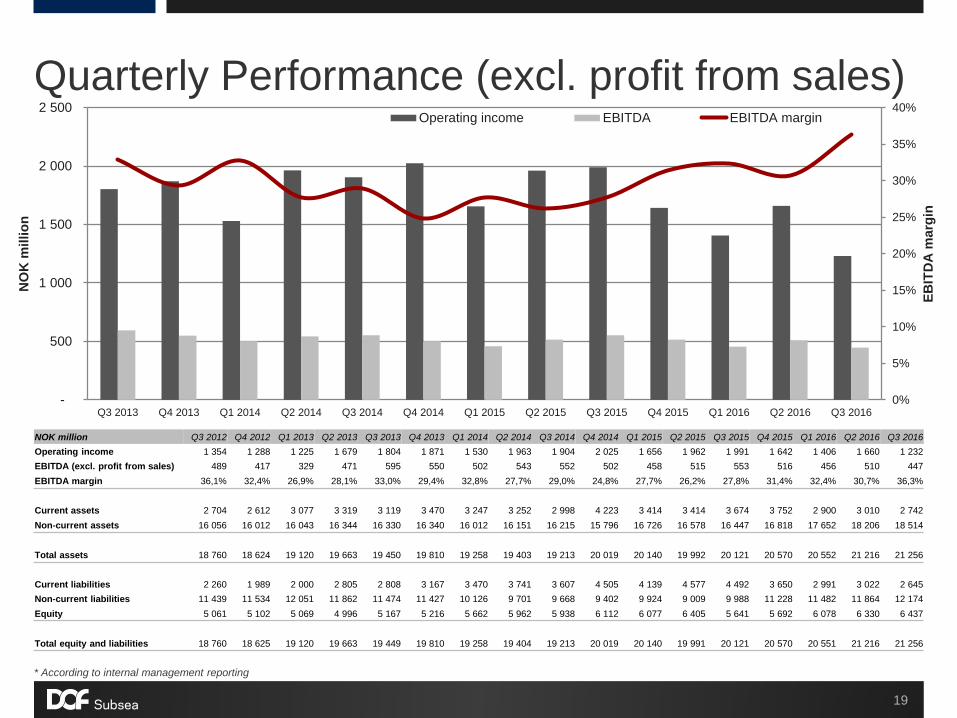
Quarterly Performance (excl. profit from sales)
19
* According to internal management reporting
0%
5%
10%
15%
20%
25%
30%
35%
40%
-
500
1 000
1 500
2 000
2 500
Q3 2013 Q4 2013 Q1 2014 Q2 2014 Q3 2014 Q4 2014 Q1 2015 Q2 2015 Q3 2015 Q4 2015 Q1 2016 Q2 2016 Q3 2016
EB
ITD
A m
arg
in
NO
K m
illio
n
Operating income EBITDA EBITDA margin
NOK million Q3 2012 Q4 2012 Q1 2013 Q2 2013 Q3 2013 Q4 2013 Q1 2014 Q2 2014 Q3 2014 Q4 2014 Q1 2015 Q2 2015 Q3 2015 Q4 2015 Q1 2016 Q2 2016 Q3 2016
Operating income 1 354 1 288 1 225 1 679 1 804 1 871 1 530 1 963 1 904 2 025 1 656 1 962 1 991 1 642 1 406 1 660 1 232
EBITDA (excl. profit from sales) 489 417 329 471 595 550 502 543 552 502 458 515 553 516 456 510 447
EBITDA margin 36,1% 32,4% 26,9% 28,1% 33,0% 29,4% 32,8% 27,7% 29,0% 24,8% 27,7% 26,2% 27,8% 31,4% 32,4% 30,7% 36,3%
Current assets 2 704 2 612 3 077 3 319 3 119 3 470 3 247 3 252 2 998 4 223 3 414 3 414 3 674 3 752 2 900 3 010 2 742
Non-current assets 16 056 16 012 16 043 16 344 16 330 16 340 16 012 16 151 16 215 15 796 16 726 16 578 16 447 16 818 17 652 18 206 18 514
Total assets 18 760 18 624 19 120 19 663 19 450 19 810 19 258 19 403 19 213 20 019 20 140 19 992 20 121 20 570 20 552 21 216 21 256
Current liabilities 2 260 1 989 2 000 2 805 2 808 3 167 3 470 3 741 3 607 4 505 4 139 4 577 4 492 3 650 2 991 3 022 2 645
Non-current liabilities 11 439 11 534 12 051 11 862 11 474 11 427 10 126 9 701 9 668 9 402 9 924 9 009 9 988 11 228 11 482 11 864 12 174
Equity 5 061 5 102 5 069 4 996 5 167 5 216 5 662 5 962 5 938 6 112 6 077 6 405 5 641 5 692 6 078 6 330 6 437
Total equity and liabilities 18 760 18 625 19 120 19 663 19 449 19 810 19 258 19 404 19 213 20 019 20 140 19 991 20 121 20 570 20 551 21 216 21 256
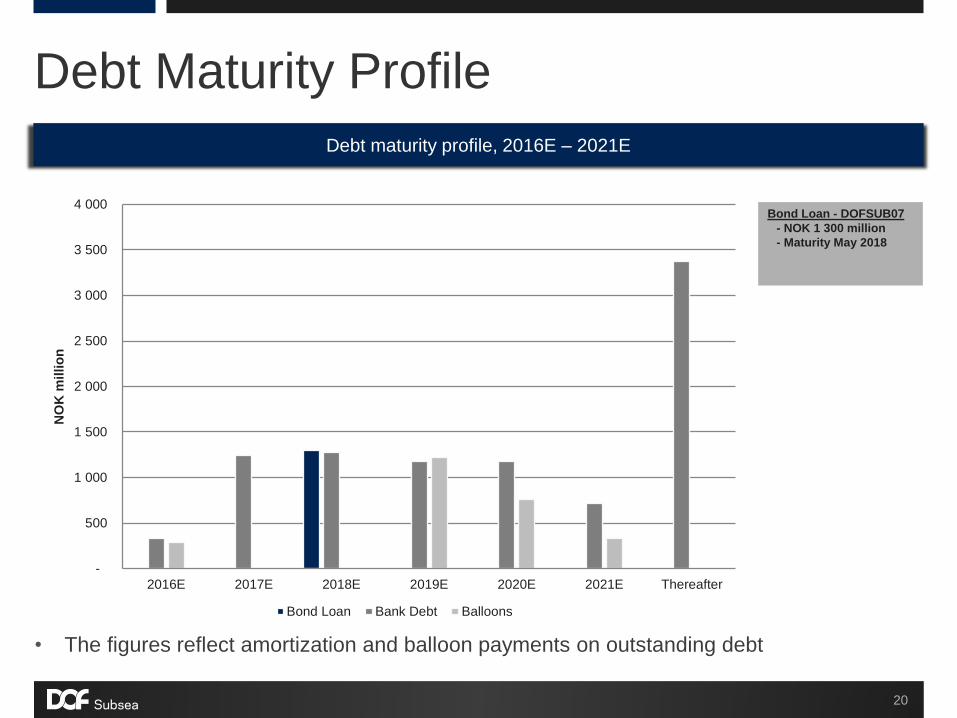
Debt Maturity Profile
20
Bond Loan - DOFSUB07
- NOK 1 300 million
- Maturity May 2018
• The figures reflect amortization and balloon payments on outstanding debt
Debt maturity profile, 2016E – 2021E
-
500
1 000
1 500
2 000
2 500
3 000
3 500
4 000
2016E 2017E 2018E 2019E 2020E 2021E Thereafter
NO
K m
illio
n
Bond Loan Bank Debt Balloons
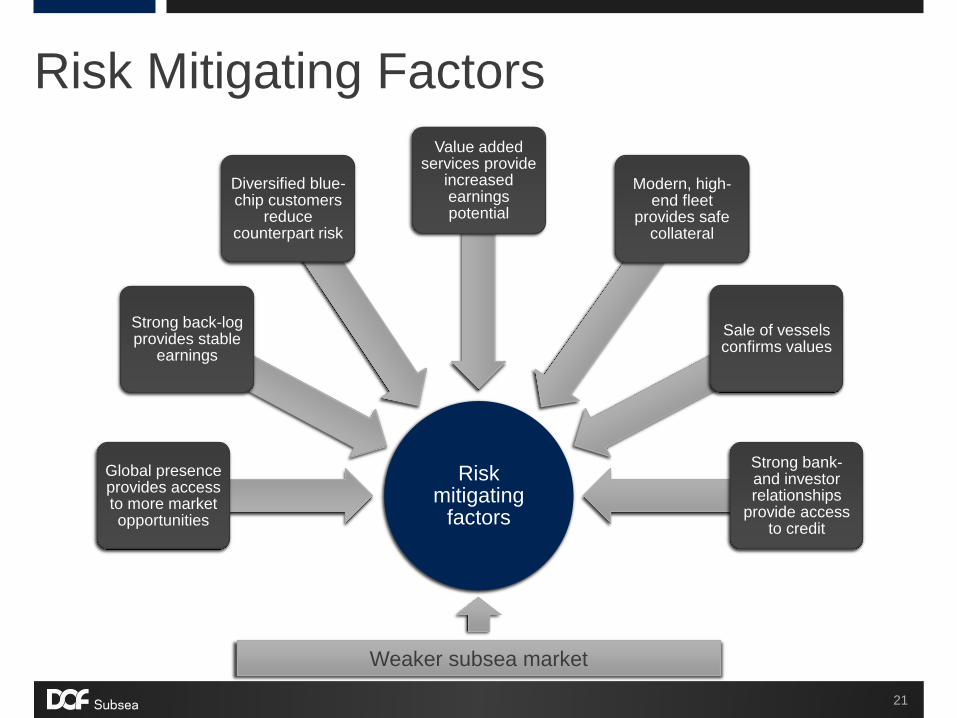
Risk Mitigating Factors
21
Risk mitigating
factors
Global presence provides access to more market opportunities
Strong back-log provides stable
earnings
Diversified blue-chip customers
reduce counterpart risk
Value added services provide
increased earnings potential
Modern, high-end fleet
provides safe collateral
Strong bank-and investor relationships
provide access to credit
Sale of vessels confirms values
Weaker subsea market
Outlook
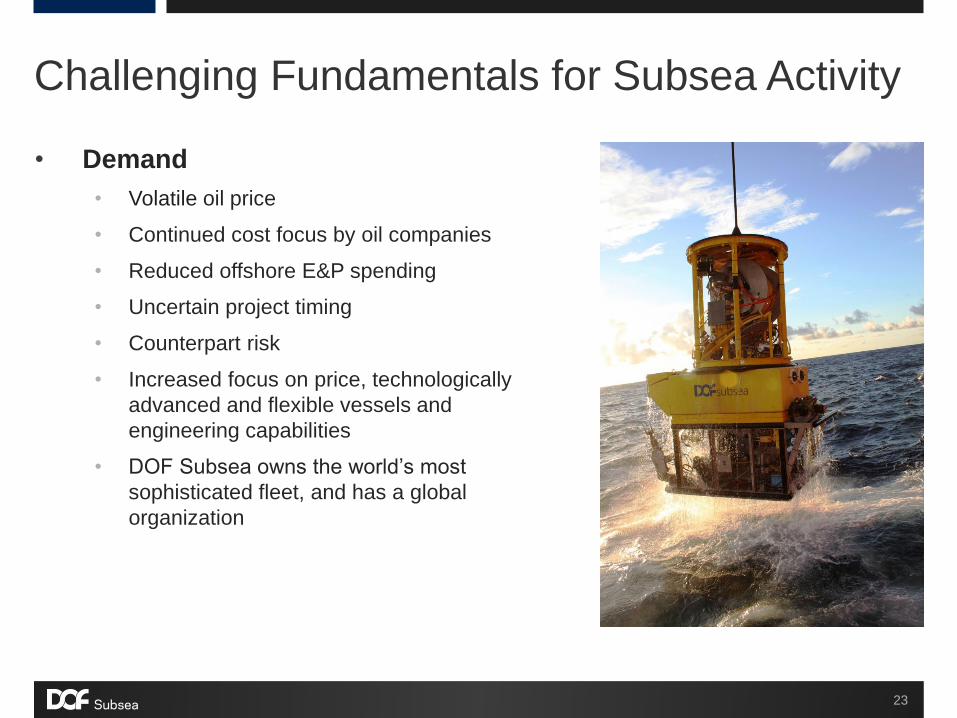
Challenging Fundamentals for Subsea Activity
23
• Demand
• Volatile oil price
• Continued cost focus by oil companies
• Reduced offshore E&P spending
• Uncertain project timing
• Counterpart risk
• Increased focus on price, technologically
advanced and flexible vessels and
engineering capabilities
• DOF Subsea owns the world’s most
sophisticated fleet, and has a global
organization
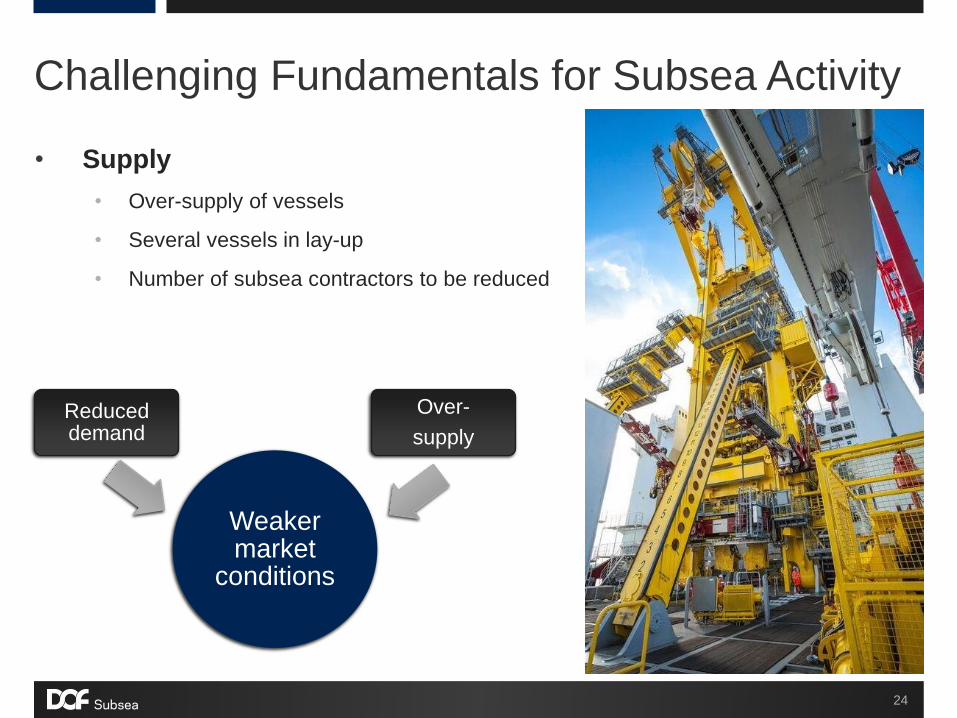
Challenging Fundamentals for Subsea Activity
24
• Supply
• Over-supply of vessels
• Several vessels in lay-up
• Number of subsea contractors to be reduced
Weaker market
conditions
Reduced demand
Over-
supply
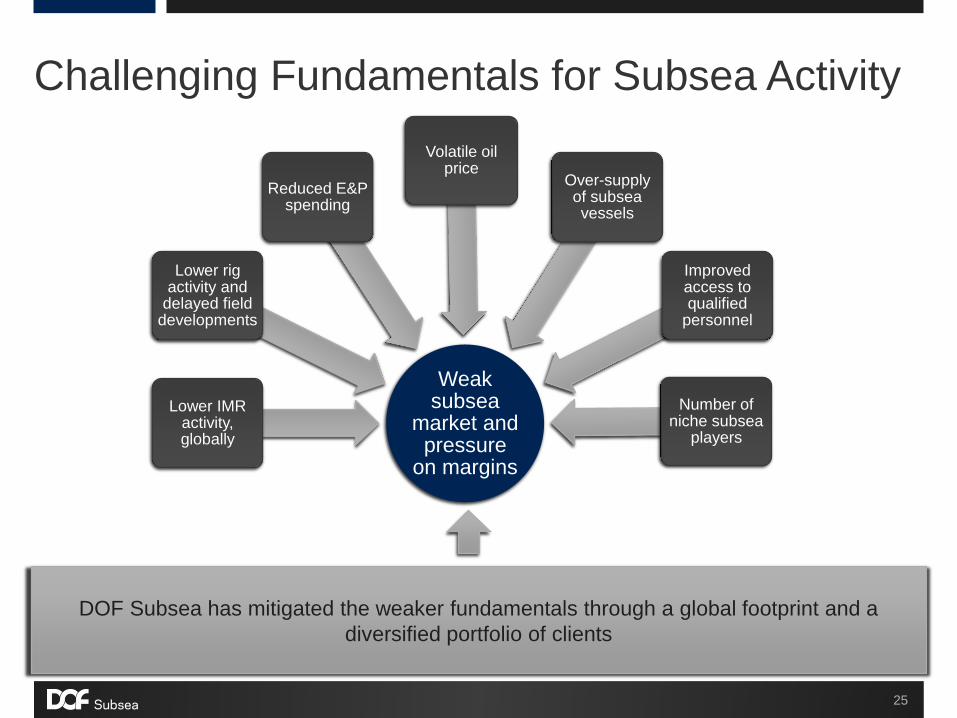
Challenging Fundamentals for Subsea Activity
25
Weak subsea
market and pressure
on margins
Lower IMR activity, globally
Lower rig activity and
delayed field developments
Reduced E&P spending
Volatile oil price
Number of niche subsea
players
Improved access to qualified
personnel
Over-supply of subsea vessels
DOF Subsea has mitigated the weaker fundamentals through a global footprint and a
diversified portfolio of clients
Thank you!