Embed Size (px)
Citation preview

FINANCIAL REPORT
Q1 2020

DOF Subsea ASThormøhlens gate 53 C5006 BergenNORWAYwww.dofsubsea.com

IndexFinancial Report 1st quarter 2020 . . . . . . . . . . . . . . . . . . .4
Financial statements 1st quarter 2020 . . . . . . . . . . . . . . .8
Consolidated statement of comprehensive income . . . . . . . . . . . 8
Consolidated statement of financial position . . . . . . . . . . . . . . . . . . 9
Consolidated statement of cash flows. . . . . . . . . . . . . . . . . . . . . . . . 11
Consolidated statement of changes in equity . . . . . . . . . . . . . . . . 12
Notes to the financial statements . . . . . . . . . . . . . . . . . . 14
Note 1 Management reporting . . . . . . . . . . . . . . . . . . . . . . . . . . . . . . . . 14
Note 2 Segment information . . . . . . . . . . . . . . . . . . . . . . . . . . . . . . . . . . 16
Note 3 Operating revenue . . . . . . . . . . . . . . . . . . . . . . . . . . . . . . . . . . . . . 16
Note 4 Financial income and expenses . . . . . . . . . . . . . . . . . . . . . . . 17
Note 5 Tangible assets . . . . . . . . . . . . . . . . . . . . . . . . . . . . . . . . . . . . . . . . . 18
Note 6 Goodwill . . . . . . . . . . . . . . . . . . . . . . . . . . . . . . . . . . . . . . . . . . . . . . . . . 18
Note 7 Cash pool. . . . . . . . . . . . . . . . . . . . . . . . . . . . . . . . . . . . . . . . . . . . . . . . 19
Note 8 Net interest-bearing debt . . . . . . . . . . . . . . . . . . . . . . . . . . . . . . 19
Note 9 Financial instruments and hedging activities . . . . . . . . 21
Note 10 Transactions with related parties. . . . . . . . . . . . . . . . . . . . 22
Note 11 Investments in associates and joint ventures. . . . . . 22
Note 12 Shareholder information . . . . . . . . . . . . . . . . . . . . . . . . . . . . . 22
Note 13 Going Concern . . . . . . . . . . . . . . . . . . . . . . . . . . . . . . . . . . . . . . . . 23
Note 14 Events after period end . . . . . . . . . . . . . . . . . . . . . . . . . . . . . . 23
Note 15 Performance measurement definitions . . . . . . . . . . . . . 24
Supplemental information . . . . . . . . . . . . . . . . . . . . . . . . . 25
Condensed statement of comprehensive income 5 last quarters. . . . . . . . . . . . . . . . . . . . . . . . . . . . . . . . . . . . . . . . . . . . . . . . . . . 25
Condensed statement of financial position 5 last quarters. . . . . . . . . . . . . . . . . . . . . . . . . . . . . . . . . . . . . . . . . . . . . . . . . . . 26
Key figures . . . . . . . . . . . . . . . . . . . . . . . . . . . . . . . . . . . . . . . . . . . . . . . . . . . . . . . 26
Financial Report Q1 2020 | DOF SUBSEA GROUP
4
Financial Report 1st quarter 2020
Headlines In the 1st quarter of 2020, the DOF Subsea Group had an operating revenue of NOK 997 million (NOK 844 million in the 1st quarter of 2019) with an operating profit before depreciation and impairment (EBITDA) of NOK 391 million (NOK 226 million). The operating profit (EBIT) was negative NOK 585 million (NOK 59 million) after depreciation and impairment of NOK 976 million (NOK 167 million). The net financial loss was NOK 1 333 million (loss NOK 64 million), and the loss before tax was NOK 1 918 million (loss NOK 5 million).
During the 1st quarter, the Group has recognised an impairment and depreciation of tangible assets of NOK 976 million due to the weakening market for vessel services and the low demand visibility for the Groups services going forward. The Group has also faced a net financial loss of NOK 1 333 million due to the extreme weakening of the NOK against the USD. Of the net financial loss, NOK 30 million is financial income, NOK 163 million is financial cost, NOK 386 million in realized financial loss on currency and derivatives and the reminder NOK 815 million is unrealized currency loss on loan in USD, outstanding FX derivatives and Interest rate derivatives.
The impact of the covid-19 virus and the sharp fall in the oil price have led to postponement and cancellation of offshore projects and tenders. These events have disrupted the Group’s operations and earnings going forward. The market conditions have become more challenging with oversupply of services and subsea vessels. The situation is resulting in cancellation and renegotiation of contracts, increased pressure on earnings and challenges with utilisation of both personnel and assets. Since the visibility of the demand for the Groups services is low, the medium to long term impact on the liquidity and solidity is difficult to address.
As a consequence of the uncertainties caused by the recent events the Group has entered into a standstill agreement with 93 % of its secured lenders and its bondholders. In this period no interest and instalment will be paid to the secured lenders, except interest on the NOK 100 million credit facility. In addition, the Group has imposed a unilateral standstill on the secured lenders not participating in the stand still agreement. Although no assurance can be given DOF Subsea AS have not received any indication that these secure lenders in question will invoke the event of default provision in the relevant loan agreements as a result of such decision. The Group will continue its dialogue with the secured lenders and bondholders to secure a long-term financial solution, which must be sufficient robust
taking the recent development into account.The standstill agree-ments do not cover DOF Subsea Brasil or the Joint Venture Group.Despite the challenges, the Group has improved the operational performance in all regions compared to first quarter of 2019. The average vessel utilisation in the Subsea/IMR Projects segment were 73 % for the quarter whilst the utilisation of the vessels within Long-term Charter segment were 82 %. For the fleet in total, the utilisation was 76 %. The utilisation figures are based on total available days, including yard stay days for dry docking, repair and upgrade/conversion, transits and idle time.
Operational events in the quarterAs of 31 March 2020, the number of subsea employees was 1 179, and the Group’s fleet comprised of 24 owned vessels, 3 chartered-in vessels and 71 ROVs.
During the 1st quarter, the Asia Pacific region has conducted IMR and construction work for Shell in the Philippines and in Australia, IMR and survey work for Chevron and light construction, mooring and installation work for OMV in New Zealand. In the Atlantic region, the Group has executed engi-neering, light construction, survey, IMR and decommissioning work for ENI in Angola and Subsea 7 in Ghana. In addition, the vessel Geosea entered into a long-term BB contract with N-Sea where the end client is the Royal Netherlands Navy. In the North America region, the Group has conducted IMR and installation work for Husky Energy, Shell, Saipem and Anardarko, in addition to RSV services for Argas in the Middle East. During the quarter the region received an Ocean Bottom Node survey in the GOM with start-up medio May. In the Brazil region, the Group has been engaged in ROV inspection and diving work for Petrobras. In addition, the joint venture with TechnipFMC has provided pipelay services for Petrobras and the JV vessel Skandi Niteroi and Skandi Vitoria are on contract with TechnipFMC. The Group has received several requests from clients to renegotiate contract terms due to the extreme situation in the market. During the quarter, the Group has been awarded several short-term contracts in the Subsea/IMR Projects segment, including the renewable industry.
In the Long-term Chartering segment, Skandi Acergy has been idle during the quarter, she is operating under a long-term contract where the Group is taking utilisation risk on the vessel. In May 2020 the Group received termination notice from the charterer and the vessel will go off hire in July 2020.
Key figures (NOK million) 1Q 2020 1Q 2019
Operating revenue 977 844
EBITDA 391 226
EBIT -585 59
Net interest-bearing debt 9 724 8 997
EBITDA proportional method 491 365
Utilisation 1Q 2020 4Q 2019 3Q 2019 2Q 2019 1Q 2019
Long-term Chartering 82% 78% 72 % 77 % 76 %
Subsea/IMR Projects 73% 76% 80 % 67 % 63 %
Fleet 76% 77% 78 % 70 % 67 %
| Financial Report Q1 2020DOF SUBSEA GROUP
5
Consolidated statement of comprehensive income and consolidated statement of financial position
In the 1st quarter of 2020, the Group achieved an operating revenue of NOK 997 million compared to an operating revenue of NOK 844 million in the 1st quarter of 2019. Operating profit before depreciation and impairment (EBITDA) was NOK 391 million (NOK 226 million in 2019). The operating profit after depreciation and impairment (EBIT) was negative NOK 585 million (NOK 59 million). Depreciation and impairment amounted to NOK 976 million (NOK 167 million), comprising of depreciation of NOK 126, impairment of tangible assets of NOK 765 million and impairment of goodwill of NOK 85 million. In addition, an impairment on the joint venture vessel Skandi Niteroi of NOK 55 million has been recognised, affecting the share of net profit of associates and joint venture.
Net financial loss was NOK 1 333 million (loss NOK 64 million). The loss before tax was NOK 1 918 million (loss NOK 5 million), and the loss for the period was NOK 1 947 million (loss NOK 25 million).
The Group’s total assets were NOK 14 841 million (NOK 16 551 million), whereas non-current assets amounted to NOK 12 763 million (NOK 14 792 million), including NOK 4 million (NOK 552 million) in intangible assets. Current assets were NOK 2 079 million (NOK 1 760 million), of which NOK 803 million (NOK 812 million) was cash and cash equivalents.
The total equity was NOK 3 010 million (NOK 5 708 million), including non-controlling interests of NOK 146 million (NOK 195 million). Non-current liabilities were NOK 677 million (NOK 7 887 million). Current liabilities were NOK 11 154 million (NOK 2 957 million), of which NOK 10 189 million (NOK 2 291 million) was current portion of debt. The Group’s total equity and lia-bilities were NOK 14 841 million (NOK 16 551 million). The net interest-bearing debt (NIBD) was NOK 9 724 million (NOK 8 997 million). At the end of the 1st quarter, the book equity ratio was 20 %.
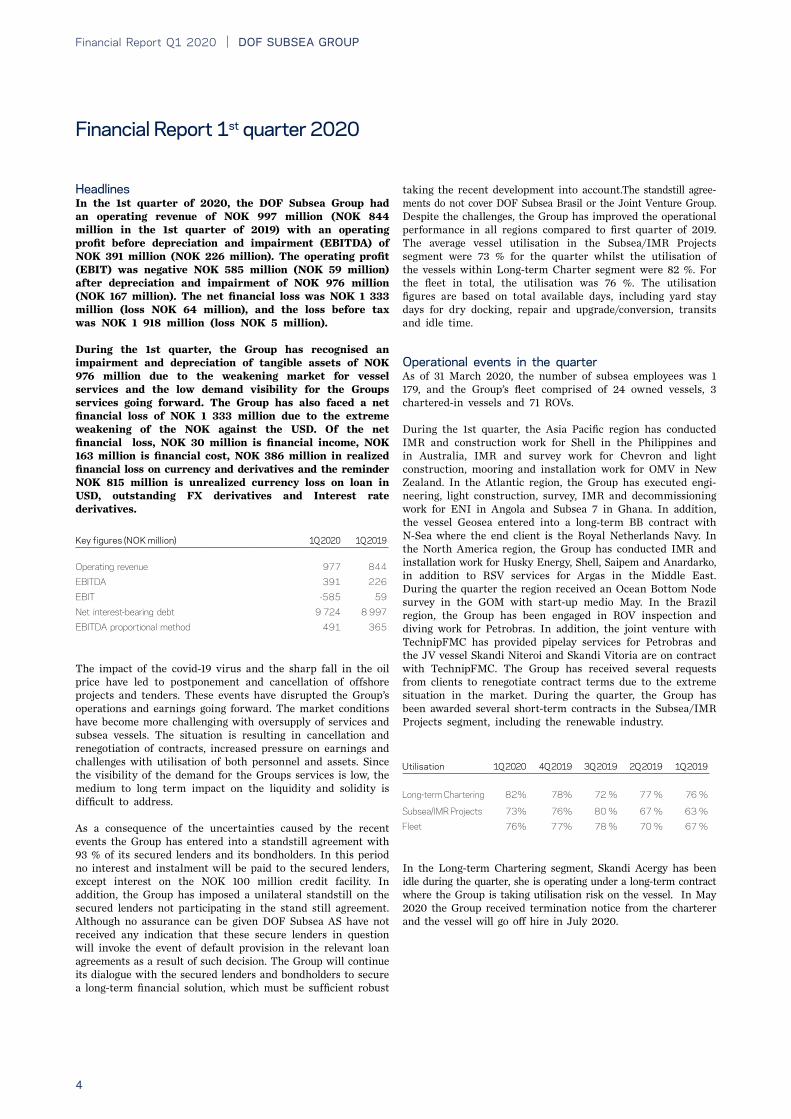
Cash and cash equivalents have changed due to operating, investing and financing activities. Net cash flow from operating
activities in the 1st quarter was NOK 94 million (NOK -104 million). Cash flow from investing activities was NOK -51 million (NOK -36 million), of which NOK -73 million (NOK -48 million) was from investment in assets that increase or will increase capacity for the Group. Cash flow from financing activities was NOK 136 million (NOK -189 million), related to proceeds of interest-bearing debt and instalments on long-term interest-bearing debt. At the end of the 1st quarter, the Group’s cash and cash equivalents were NOK 803 million (NOK 812 million).
Debt, financing and liquidity
The Group’s interest-bearing debt was NOK 10 725 million (NOK 10 063 million), the current portion of interest-bearing debt at the end of March was NOK 10 189 million (NOK 2 291 million), including balloons, bond, drawn credit facility and ordinary instalments. During the quarter the Group has paid ordinary interest. The payment of instalments has been reduced significantly due to the ongoing negotiations regarding a long-term financing solution for the Group. The joint venture with TechnipFMC, has paid ordinary instalments and interest during the quarter.
As a consequence of the global covid-19 situation, the oil price collapse and the weakening of the NOK against the USD, the Group faced liquidity problems due to realisation of FX positions medio March. The liquidity problems were partially solved by a NOK 100 million liquidity facility provided by the senior lenders and deferral of payment of interest rates, instalment and further settlement of derivative positions. The Group has entered into a standstill agreement with 93% of its secured lenders and its bondholders giving a temporary deferral payment of interest, instalments and waivers of covenants until 30th of June. In addition, the Group has imposed a unilateral standstill on the secured lenders not participating in the stand still agreement. Although no assurance can be given DOF Subsea AS have not received any indication that these secure lenders in question will invoke the event of default provision in the relevant loan agreements as a result of such decision.
Financial riskThe Group’s operating income is in NOK, USD, AUD, GBP, CAD and BRL, while the Group’s loans are distributed between NOK, USD and CAD. This exposes the Group to the risk of exchange rate fluctuations. The Group has had an active exchange rate
NOK million 1Q 2020 1Q 2019 Change %
Operating revenue 977 844 16%
EBITDA 391 226 73%
EBIT -585 59 -
NOK million 31 .03 .2020 31 .03 .2019 Change %
Total assets 14 841 16 551 -10%
Tangible assets 9 696 11 258 -14%
Cash and cash equivalents 803 812 -1%
Net interest-bearing debt 9 702 8 997 8%
Total equity 3 010 5 708 -47%
Financial Report Q1 2020 | DOF SUBSEA GROUP
6
policy and uses derivatives to hedge the exchange rate exposure and interest rate exposure.
ShareholdersBy quarter end, the shares in DOF Subsea AS were owned by DOF ASA (100 %). The number of outstanding shares is 167 352 762, with a book equity of NOK 18 per share.
EmployeesAt the end of 1st quarter, the number of employees in the Group was 1 179. The number does not include marine employees that are employed in DOF Management and Norskan and hired in through shipman agreements to operate the Group’s vessels.
The FleetAt the end of 1st quarter, the Group’s fleet comprised 24 owned vessels, in addition to 3 chartered-in vessels. In addition, the Group operates 71 ROVs.
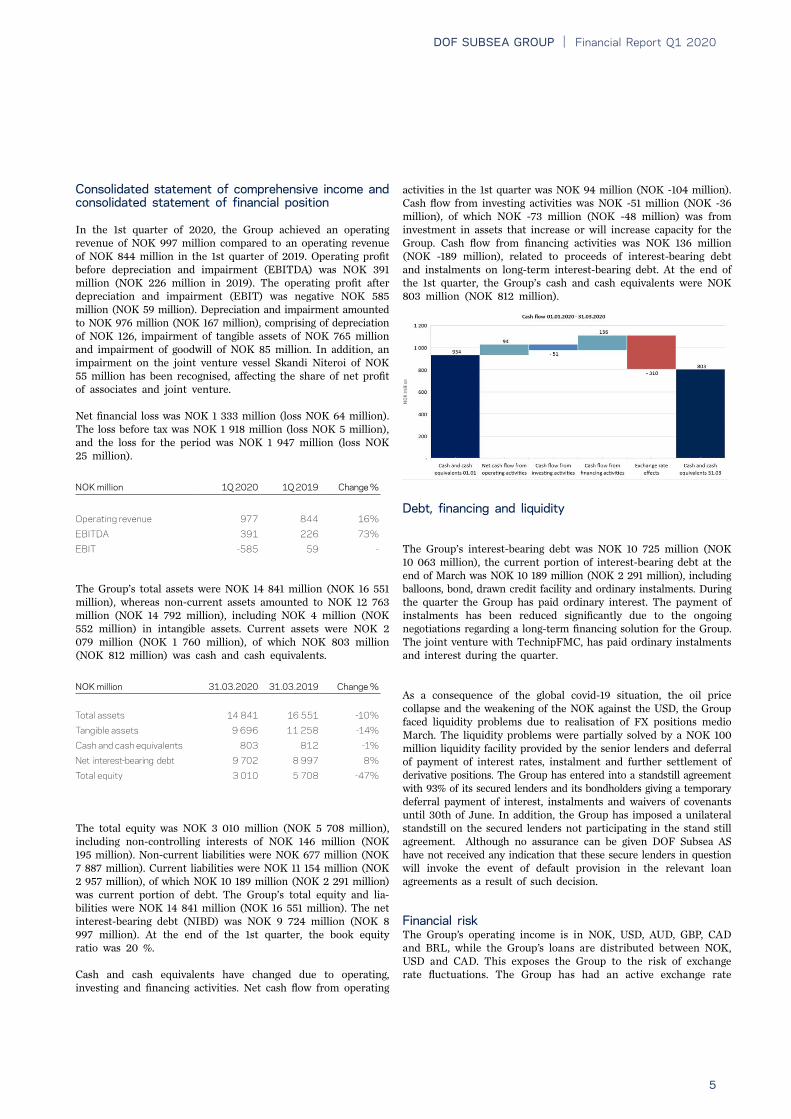
The BacklogAs at the end of 1st quarter, the firm contract backlog amounted to NOK 13.8 billion. However, the Group is exposed to the short-term market conditions in the Subsea/IMR Projects segment, and the backlog on some of the key assets in this segment are low. In this segment the management is working to increase the backlog and improve the utilisation of personnel and assets. The uncertain situation in the subsea market is challenging where several client are trying to renegotiate contract terms, the outcome of these negotiations are uncertain.
Contract Backlog*
2020 2021 2022 2023 2024 ThereafterOptions Revenue 0,4 1,1 1,3 1,3 1,2 15,8Firm Revenue 3,2 2,7 2,2 1,9 1,8 2,0
0,0
5,0
10,0
15,0
20,0
NO
K bi
llio
n
Firm Revenue Options Revenue
*Contract backlog includes DOF Subsea’s share of joint venture vessels but excludes master service agreements (MSAs) within the subsea/IMR Projects segment. Under the MSAs only con-firmed POs are accounted for.
Events after period endThe focus for the Group after period end has been to protect its employees from the impact of the global covid-19 situation and try to execute projects and operate the vessels as close to normal as possible. The Group has so far been able to operate its vessels close to normal, even though the replacement of crew has become and is expected to remain challenging.Given the unclear situation with the broader impact of covid-19 and the oil price, the medium-term financial situation for the Group is challenging. The Group has entered into a standstill agreement with its bondholders in DOFSUB07, DOFSUB08 and DOFSUB09 on the 22nd of April. On the 15th of May the Group entered into a standstill agreement with 93 % of its secured lenders. Towards the remaining secured lender, the Group has imposed a unilateral standstill on the secured lender not participating in the agreement. Although no assurance can be given, DOF Subsea AS has not received any indication that the secure lender in question will invoke the event of default provision in the relevant loan agreement as a result of such decision. The liquidity facility, the earnings together with the standstill agreements cover the Group’s short-term liquidity need. The Group will continue its effort together with the secured lenders and bondholders in order to try to reach a robust long-term financial solution. The standstill agreements do not cover DOF Subsea Brasil or the Joint Venture.After period end the Group has received a contract on Skandi Skansen and Geosund and received a termination on the contract of Skandi Acergy. In addition, several of the Groups clients have asked for renegotiations of contract terms.
OutlookThe market is expected to become more challenging as theeffect of the covid-19 situation and decline in oil price are materializing however, with variations between the different regions and within the Long-term chartering segment.
The Group will maintain its strategy to secure the fleet on long-term contracts and is actively working on keeping the firm employment of the fleet as high as possible. The Group will further continue to adapt its cost level and adjust its capacity to the challenging markets.
The majority of the Group’s Long-term Chartering assets are committed on firm contracts and represent the largest portion of the Group’s backlog. A continuing weak market will however increase the risk of lower earnings of the Group’s vessels and put more pressure on the Group’s liquidity position if a robust long-term refinancing solution is not achieved.
The outbreak of the covid-19 virus and the sharp decline in the oil price will impact the market and the market sentiment going forward. As a result, the Board of Directors expects the market conditions to remain challenging, and the timing of market recovery remain uncertain. The uncertainty of future earnings and that the asset values are sensitiv to the USDNOK exchange rate, may lead to further impairment of the Groups assets. The quarterly financial statements are based on the going concern assumption. If the Group cannot be treated as ‘going concern’, the valuation of the Group’s assets will be further revised. Valuation of asset without the going concern

| Financial Report Q1 2020DOF SUBSEA GROUP
7
assumption may result in further impairment of the Group’s assets.
As reported, the Group has entered into a standstill agreement with the majority of its secured lenders and the bondholders, giving the Group a temporary deferral of payments of interest and instalments until 30th of June. A further extension of the stand still agreements are expected, in order to reach a robust long-term financial solution for the Group. Even though there is still uncertainty if a long-term financial solution will be achieved, the Board of Directors and Management believes that a solution is obtainable, but no assurance can be given.
Bergen, 26 May 2020 The Board of Directors of DOF Subsea AS Contact information:Mons S. Aase, CEO +47 916 61 012Marianne Møgster +47 993 06 916
DOF Subsea ASThormølens gate 53 C5006 Bergenwww.dofsubsea.com
Financial Report Q1 2020 | DOF SUBSEA GROUP
8
Amounts in NOK million
Financial statements 1st quarter 2020
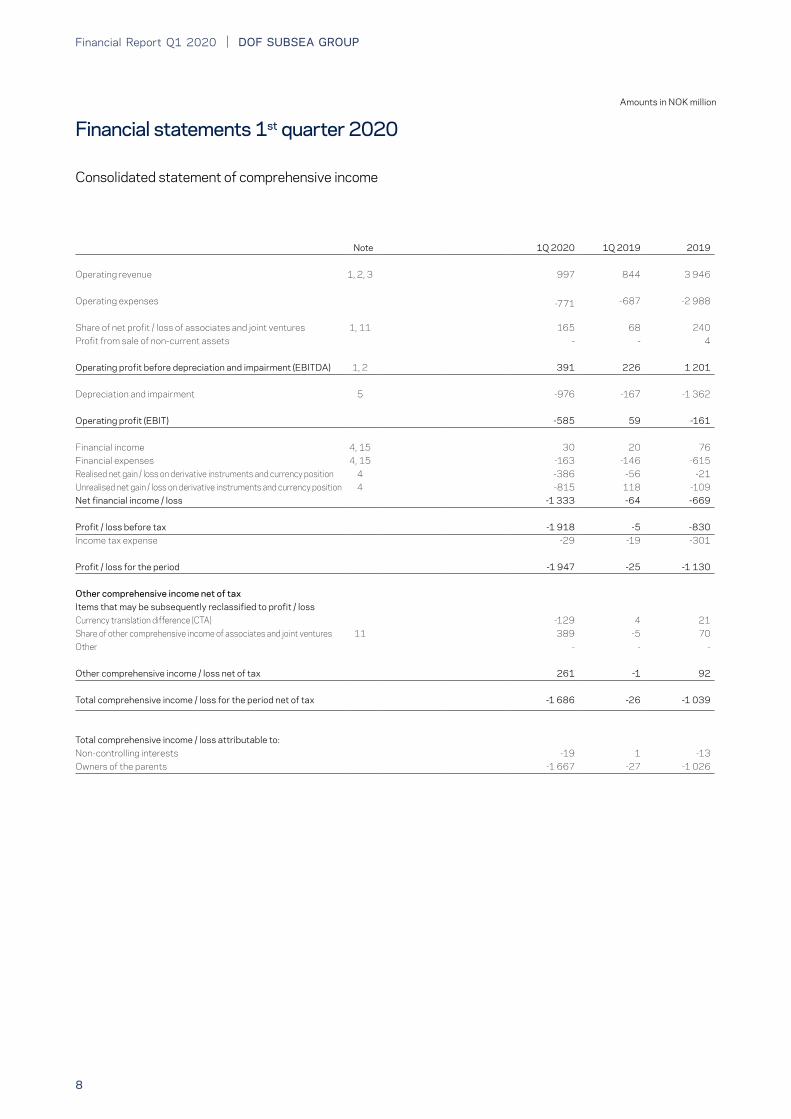
Consolidated statement of comprehensive income
Note 1Q 2020 1Q 2019 2019
Operating revenue 1, 2, 3 997 844 3 946
Operating expenses -771 -687 -2 988
Share of net profit / loss of associates and joint ventures 1, 11 165 68 240Profit from sale of non-current assets - - 4
Operating profit before depreciation and impairment (EBITDA) 1, 2 391 226 1 201
Depreciation and impairment 5 -976 -167 -1 362
Operating profit (EBIT) -585 59 -161
Financial income 4, 15 30 20 76Financial expenses 4, 15 -163 -146 -615Realised net gain / loss on derivative instruments and currency position 4 -386 -56 -21Unrealised net gain / loss on derivative instruments and currency position 4 -815 118 -109Net financial income / loss -1 333 -64 -669
Profit / loss before tax -1 918 -5 -830Income tax expense -29 -19 -301
Profit / loss for the period -1 947 -25 -1 130
Other comprehensive income net of taxItems that may be subsequently reclassified to profit / lossCurrency translation difference (CTA) -129 4 21Share of other comprehensive income of associates and joint ventures 11 389 -5 70Other - - -
Other comprehensive income / loss net of tax 261 -1 92
Total comprehensive income / loss for the period net of tax -1 686 -26 -1 039
Total comprehensive income / loss attributable to:Non-controlling interests -19 1 -13Owners of the parents -1 667 -27 -1 026
| Financial Report Q1 2020DOF SUBSEA GROUP
9
Amounts in NOK million
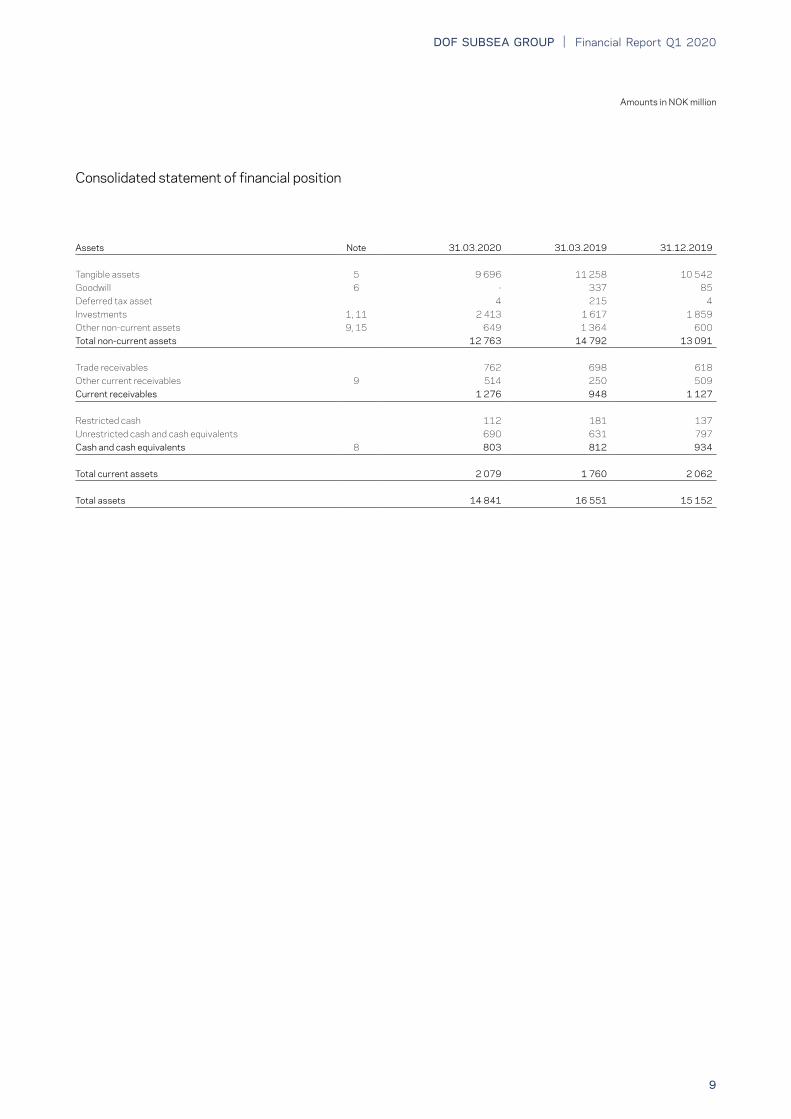
Consolidated statement of financial position
Assets Note 31 .03 .2020 31 .03 .2019 31 .12 .2019
Tangible assets 5 9 696 11 258 10 542Goodwill 6 - 337 85Deferred tax asset 4 215 4Investments 1, 11 2 413 1 617 1 859Other non-current assets 9, 15 649 1 364 600Total non-current assets 12 763 14 792 13 091
Trade receivables 762 698 618Other current receivables 9 514 250 509Current receivables 1 276 948 1 127
Restricted cash 112 181 137Unrestricted cash and cash equivalents 690 631 797Cash and cash equivalents 8 803 812 934
Total current assets 2 079 1 760 2 062
Total assets 14 841 16 551 15 152
Financial Report Q1 2020 | DOF SUBSEA GROUP
10
Amounts in NOK million
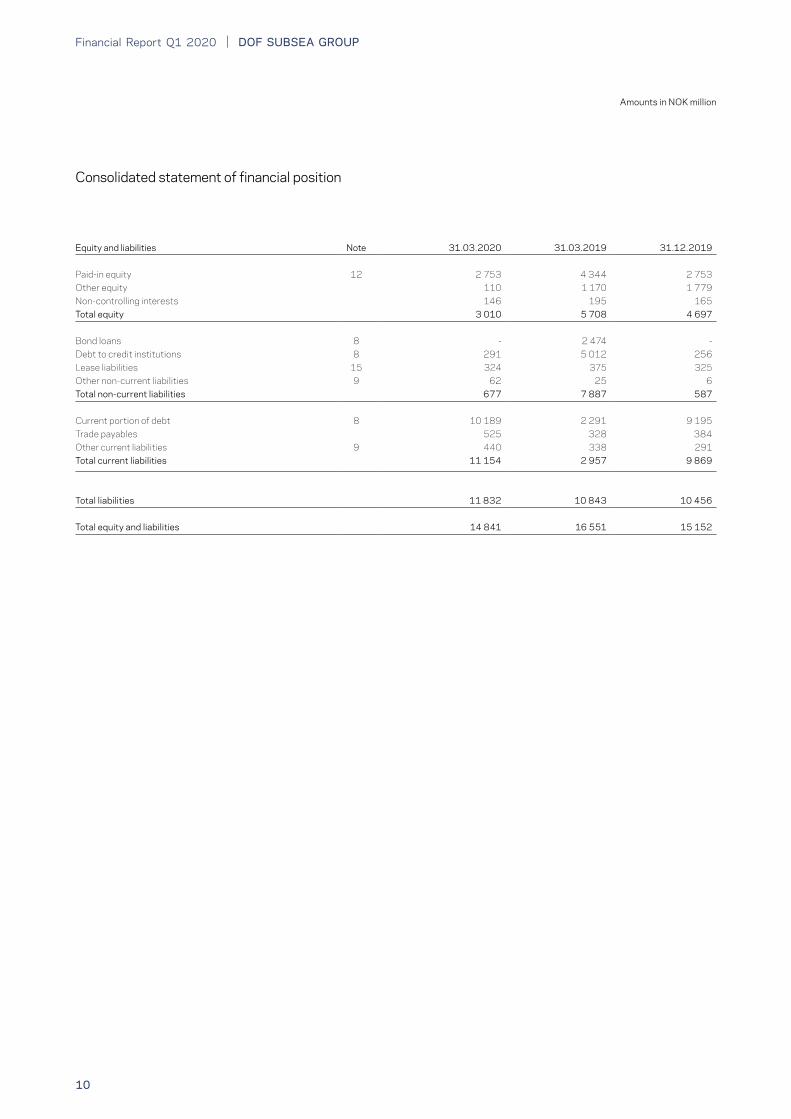
Equity and liabilities Note 31 .03 .2020 31 .03 .2019 31 .12 .2019
Paid-in equity 12 2 753 4 344 2 753Other equity 110 1 170 1 779Non-controlling interests 146 195 165Total equity 3 010 5 708 4 697
Bond loans 8 - 2 474 -Debt to credit institutions 8 291 5 012 256Lease liabilities 15 324 375 325Other non-current liabilities 9 62 25 6Total non-current liabilities 677 7 887 587
Current portion of debt 8 10 189 2 291 9 195Trade payables 525 328 384Other current liabilities 9 440 338 291Total current liabilities 11 154 2 957 9 869
Total liabilities 11 832 10 843 10 456
Total equity and liabilities 14 841 16 551 15 152
Consolidated statement of financial position
| Financial Report Q1 2020DOF SUBSEA GROUP
11
Amounts in NOK million
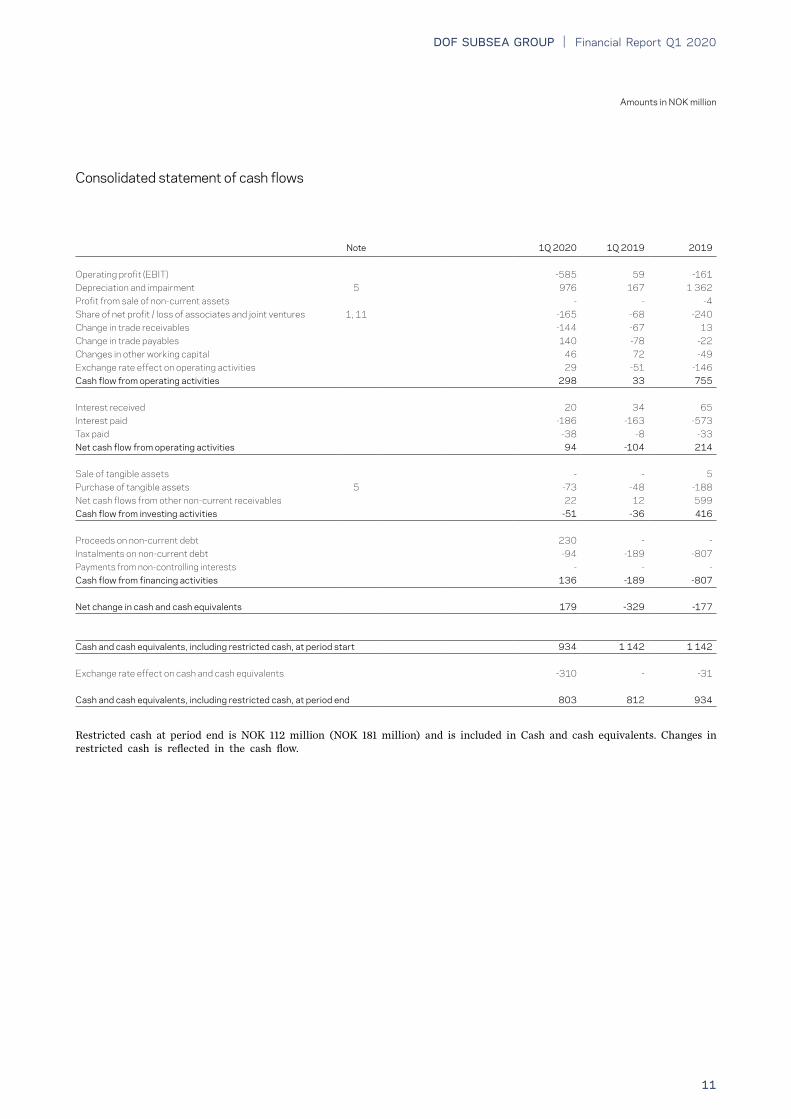
Consolidated statement of cash flows
Note 1Q 2020 1Q 2019 2019
Operating profit (EBIT) -585 59 -161Depreciation and impairment 5 976 167 1 362Profit from sale of non-current assets - - -4Share of net profit / loss of associates and joint ventures 1, 11 -165 -68 -240Change in trade receivables -144 -67 13Change in trade payables 140 -78 -22Changes in other working capital 46 72 -49Exchange rate effect on operating activities 29 -51 -146Cash flow from operating activities 298 33 755
Interest received 20 34 65Interest paid -186 -163 -573Tax paid -38 -8 -33Net cash flow from operating activities 94 -104 214
Sale of tangible assets - - 5Purchase of tangible assets 5 -73 -48 -188Net cash flows from other non-current receivables 22 12 599Cash flow from investing activities -51 -36 416
Proceeds on non-current debt 230 - -Instalments on non-current debt -94 -189 -807Payments from non-controlling interests - - -Cash flow from financing activities 136 -189 -807
Net change in cash and cash equivalents 179 -329 -177
Cash and cash equivalents, including restricted cash, at period start 934 1 142 1 142
Exchange rate effect on cash and cash equivalents -310 - -31
Cash and cash equivalents, including restricted cash, at period end 803 812 934
Restricted cash at period end is NOK 112 million (NOK 181 million) and is included in Cash and cash equivalents. Changes in restricted cash is reflected in the cash flow.

Financial Report Q1 2020 | DOF SUBSEA GROUP
12
Amounts in NOK million
Consolidated statement of changes in equity
Share
capital
Share
premium
Other paid-in capital
Paid-in equity
Retained earnings
Currency translation
differences
Other equity
Non- controlling
interests
Total
equity
Equity at 01 .01 .2020 1 674 540 540 2 753 1 715 63 1 779 165 4 697
Profit / loss for the period - - - - -1 929 - -1 929 -19 -1 947Other comprehensive income for the period - - - - 389 -129 261 - 261Total comprehensive income for the period - - - - -1 532 -136 -1 668 -19 -1 687
Equity at 31 .03 .2020 1 674 540 540 2 753 175 -66 110 146 3 010
Equity at 01 .01 .2019 1 674 540 2 130 4 344 1 155 42 1 197 194 5 735
Profit / loss for the period - - - - -25 - -25 1 -24Other comprehensive income for the period - - - - -5 4 -1 - -1Total comprehensive income for the period - - - - -30 4 -27 1 -26
Equity at 31 .03 .2020 1 674 540 2 130 4 344 1 125 46 1 170 195 5 708

| Financial Report Q1 2020DOF SUBSEA GROUP
13
Financial Report Q1 2020 | DOF SUBSEA GROUP
14
Amounts in NOK million
Notes to the financial statements
Note 1 Management reporting
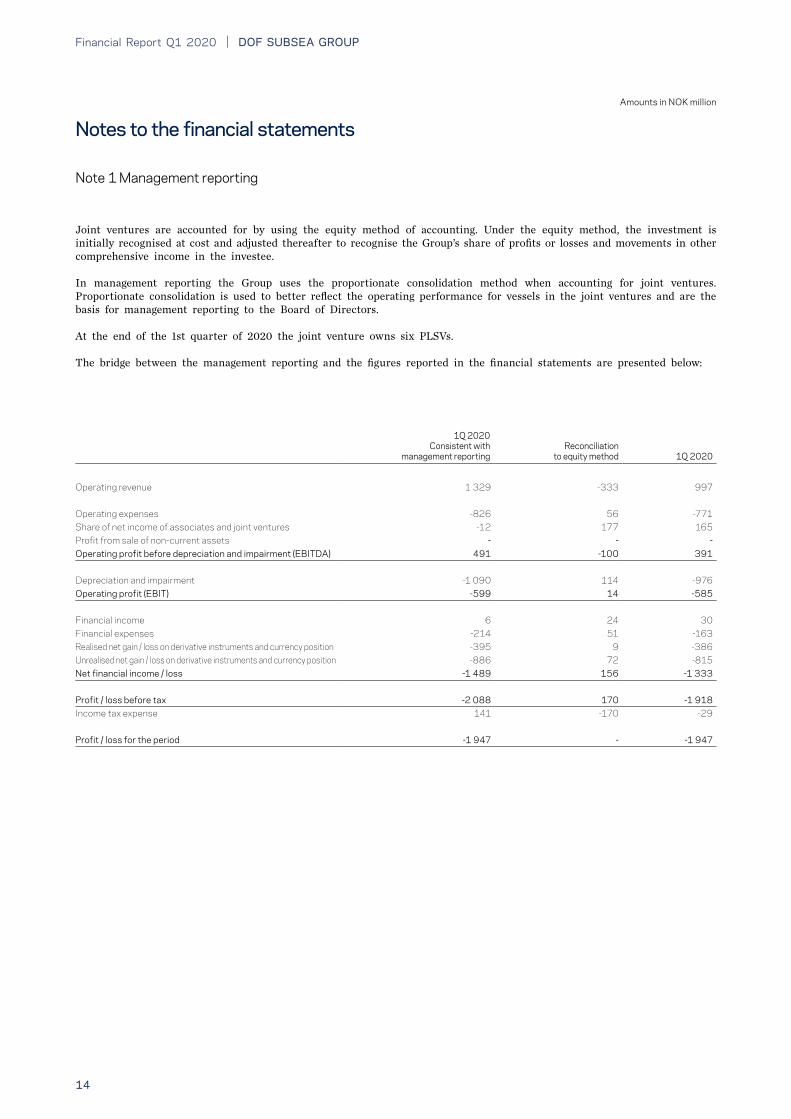
Joint ventures are accounted for by using the equity method of accounting. Under the equity method, the investment is initially recognised at cost and adjusted thereafter to recognise the Group’s share of profits or losses and movements in other comprehensive income in the investee.
In management reporting the Group uses the proportionate consolidation method when accounting for joint ventures. Proportionate consolidation is used to better reflect the operating performance for vessels in the joint ventures and are the basis for management reporting to the Board of Directors.
At the end of the 1st quarter of 2020 the joint venture owns six PLSVs.
The bridge between the management reporting and the figures reported in the financial statements are presented below:
1Q 2020Consistent with
management reportingReconciliation
to equity method 1Q 2020
Operating revenue 1 329 -333 997
Operating expenses -826 56 -771Share of net income of associates and joint ventures -12 177 165Profit from sale of non-current assets - - -Operating profit before depreciation and impairment (EBITDA) 491 -100 391
Depreciation and impairment -1 090 114 -976Operating profit (EBIT) -599 14 -585
Financial income 6 24 30Financial expenses -214 51 -163Realised net gain / loss on derivative instruments and currency position -395 9 -386Unrealised net gain / loss on derivative instruments and currency position -886 72 -815Net financial income / loss -1 489 156 -1 333
Profit / loss before tax -2 088 170 -1 918Income tax expense 141 -170 -29
Profit / loss for the period -1 947 - -1 947

| Financial Report Q1 2020DOF SUBSEA GROUP
15
Amounts in NOK million
Note 1 Management reporting (continued from previous page)
Consolidated statement of financial position
31 .03 .2020Consistent with
management reportingReconciliation
to equity method 31 .03 .2020
Intangible assets 400 -395 4Tangible assets 17 062 -7 366 9 696Financial assets 329 2 733 3 062Total non-current assets 17 791 -5 028 12 763Other current assets 1 212 64 1 276Cash and cash equivalents 1 248 -445 803Total current assets 2 460 -381 2 079Total assets 20 251 -5 409 14 841
Consolidated statement of financial position
31 .03 .2020Consistent with
management reportingReconciliation
to equity method 31 .03 .2020
Total equity 3 010 - 3 010
Non-current liabilities 5 407 -4 729 677Current liabilities 11 834 -680 11 154Total liabilities 17 241 -5 409 11 832Total equity and liabilities 20 251 -5 409 14 841
Consolidated statement of cash flows
31 .03 .2020Consistent with
management reportingReconciliation
to equity method 31 .03 .2020
Net cash flow from operating activities 290 -196 94Cash flow from investing activities -71 20 -51Cash flow from financing activities 34 102 136Net change in cash and cash equivalents 253 -74 179
Cash and cash equivalent at the beginning of the period 1 238 -303 934Exchange rate effect on cash and cash equivalents -243 -67 -310Cash and Cash equivalents at the end of the period 1 248 -445 803
In management reporting for Q1 2020 an impairment on the joint venture vessel Skandi Niteroi of NOK 55 million (DOF Subsea Group’s share) has been recognised. In the joint venture company DOFCON Navegacao Ltda, a hedging position in Brazilian Real that was closed in 2017 in relation to conversion to functional currency USD, implying a profit and loss effect (unrealised financial cost) of negative NOK 16 million in Q1 2020. The correction does not affect the company’s cash- or equity position. The impairment and the hedging correction give a total negative effect on the Group`s “Share of net income of associates and joint ventures” with NOK 71 million in Q1 2020. The negative effect on NOK 71 million is included in “operating profit before depreciation and impairment (EBITDA)” in the bridge between management reporting and Financial statements. The table is presented above.
Financial Report Q1 2020 | DOF SUBSEA GROUP
16
Amounts in NOK million
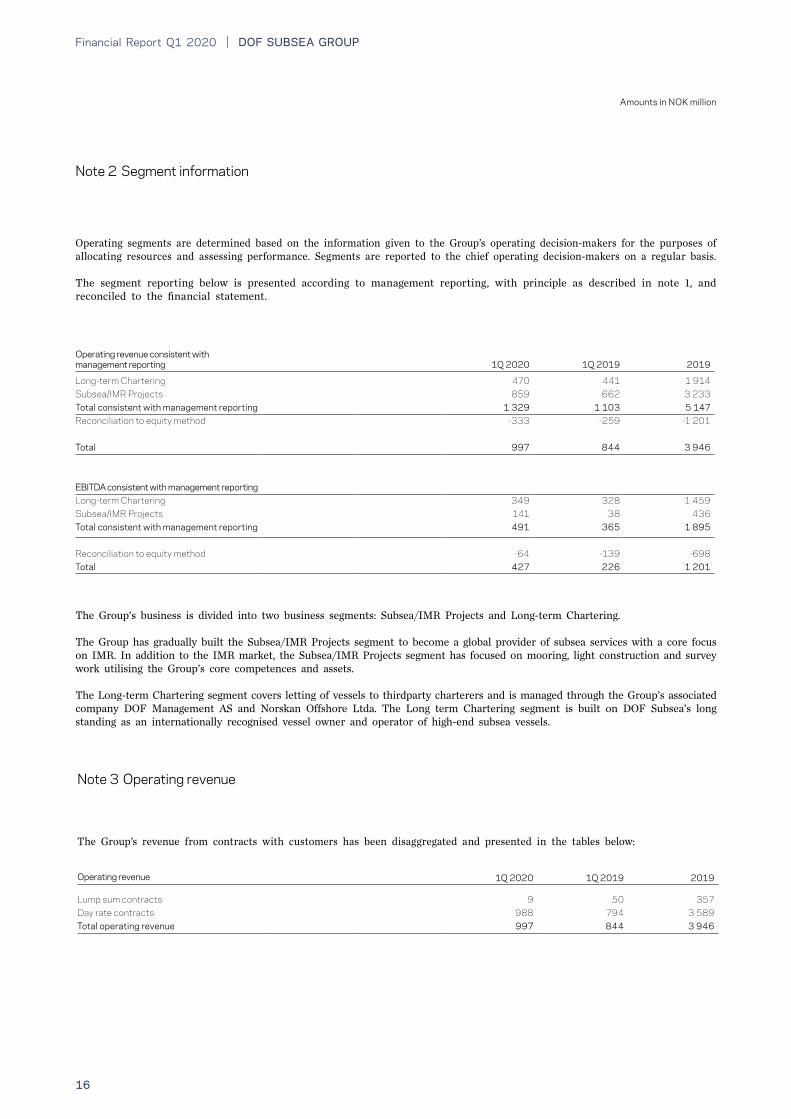
Operating segments are determined based on the information given to the Group’s operating decision-makers for the purposes of allocating resources and assessing performance. Segments are reported to the chief operating decision-makers on a regular basis.
The segment reporting below is presented according to management reporting, with principle as described in note 1, and reconciled to the financial statement.
Note 2 Segment information
The Group’s revenue from contracts with customers has been disaggregated and presented in the tables below:
The Group’s business is divided into two business segments: Subsea/IMR Projects and Long-term Chartering.
The Group has gradually built the Subsea/IMR Projects segment to become a global provider of subsea services with a core focus on IMR. In addition to the IMR market, the Subsea/IMR Projects segment has focused on mooring, light construction and survey work utilising the Group’s core competences and assets.
The Long-term Chartering segment covers letting of vessels to thirdparty charterers and is managed through the Group’s associated company DOF Management AS and Norskan Offshore Ltda. The Long term Chartering segment is built on DOF Subsea’s long standing as an internationally recognised vessel owner and operator of high-end subsea vessels.
Operating revenue consistent with management reporting
1Q 2020
1Q 2019
2019
Long-term Chartering 470 441 1 914Subsea/IMR Projects 859 662 3 233Total consistent with management reporting 1 329 1 103 5 147Reconciliation to equity method -333 -259 -1 201
Total 997 844 3 946
EBITDA consistent with management reportingLong-term Chartering 349 328 1 459Subsea/IMR Projects 141 38 436Total consistent with management reporting 491 365 1 895
Reconciliation to equity method -64 -139 -698Total 427 226 1 201
Operating revenue
1Q 2020
1Q 2019
2019
Lump sum contracts 9 50 357Day rate contracts 988 794 3 589Total operating revenue 997 844 3 946
Note 3 Operating revenue
| Financial Report Q1 2020DOF SUBSEA GROUP
17
Amounts in NOK million
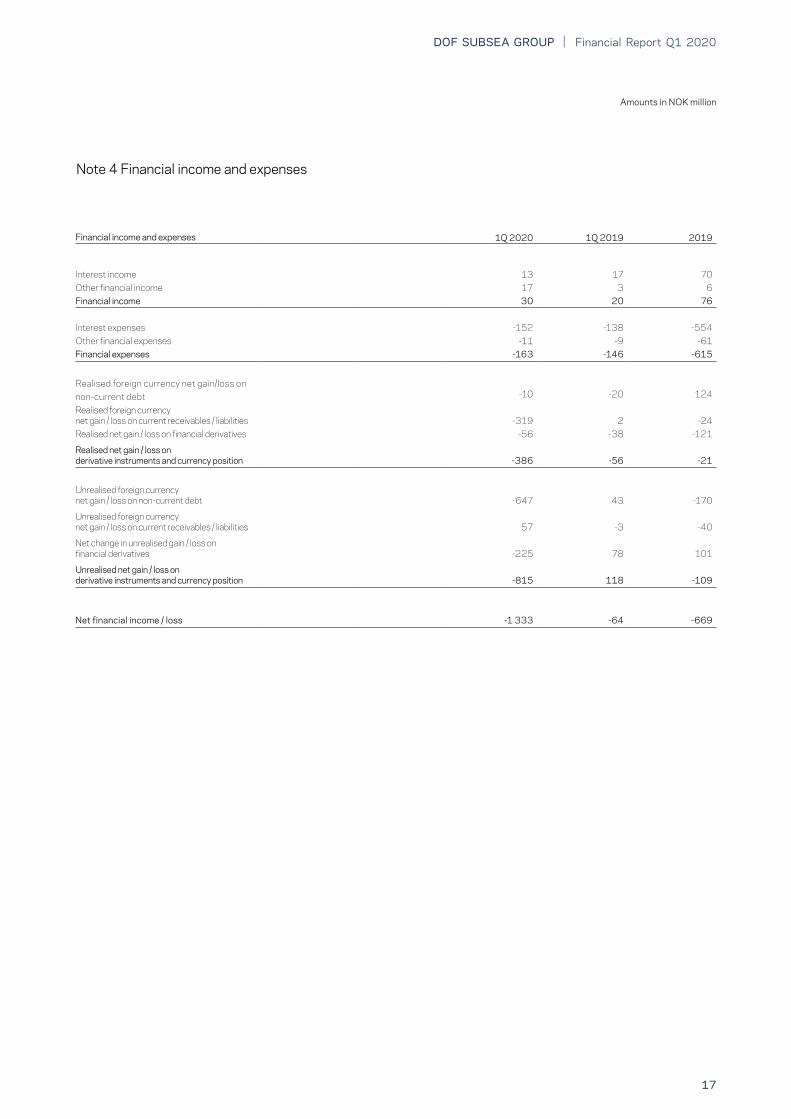
Note 4 Financial income and expenses
Financial income and expenses 1Q 2020 1Q 2019 2019
Interest income 13 17 70Other financial income 17 3 6Financial income 30 20 76
Interest expenses -152 -138 -554Other financial expenses -11 -9 -61Financial expenses -163 -146 -615
Realised foreign currency net gain/loss on non-current debt -10 -20 124
Realised foreign currency net gain / loss on current receivables / liabilities -319 2 -24Realised net gain / loss on financial derivatives -56 -38 -121
Realised net gain / loss on derivative instruments and currency position -386 -56 -21
Unrealised foreign currency net gain / loss on non-current debt -647 43 -170
Unrealised foreign currency net gain / loss on current receivables / liabilities 57 -3 -40
Net change in unrealised gain / loss on financial derivatives -225 78 101
Unrealised net gain / loss on derivative instruments and currency position -815 118 -109
Net financial income / loss -1 333 -64 -669

Financial Report Q1 2020 | DOF SUBSEA GROUP
18
Amounts in NOK million
Note 5 Tangible assets
31 .03 .2020
Vessels & periodic maintenance
ROVs
Operating equipments
Right-of-use assets
Total
Net booked value 01 .01 . 9 350 679 287 226 10 542
Additions 53 3 17 - 73Disposal - - - - -Reclassification -17 2 -10 - -26Depreciation -64 -40 -13 -10 -126Impairment -755 - -9 - -764Currency translation differences -31 - 11 18 -2Net booked value 31 .03 . 8 536 644 282 234 9 696
31 .03 .2019 Vessels & periodic
maintenance
ROVsOperating
equipments
Right-of-use assets
Total
Net booked value 01 .01 . 10 033 730 338 284 11 384Additions 29 12 8 - 48Depreciation -72 -39 -18 -10 -139Impairment -28 - - - -28Currency translation differences -9 - -1 2 -8Net booked value 31 .03 . 9 954 703 326 276 11 258
The recent outbreak of Covid-19 and the sharp decline in the oil price is expected to negatively impact the market sentiment. The market conditions have become more challenging with oversupply of services and subsea vessels. The situation is resulting in cancellation and renegotiation of contracts, increased pressure on earnings and challenges with utilisation of both personnel and assets. The market conditions are expected to remain challenging, and the timing of market recovery remains uncertain. Considering these effects, impairment tests performed for Q1 2020 have resulted in impairment losses of NOK 755 million. The impairment test of other tangible assets resulted in an impairment loss of NOK 9 million.
Impairment tests are highly USD sensitive and a drop in USD/NOK of NOK 0,5 will result in an additional impairment of NOK 340 million, given no change in other assumptions. While testing the reasonableness of the broker estimates the Group has applied a nominal WACC after tax of 9.3%. An increase in WACC with 50 basis points will result in an additional impairment of the vessels with NOK 293 million. Negative effect on net future cash flows with 20 % will result in an additional impairment of the vessels with NOK 666 million.
Note 6 Goodwill
Goodwill is reviewed for impairment whenever events or changes in circumstances indicate that the carrying amount of goodwill may not be recoverable. The recent outbreak of Covid-19 and the sharp decline in the oil price is expected to negatively impact the market sentiment. The market conditions have become more challenging with oversupply of services and subsea vessels. The situation is resulting in cancellation and renegotiation of contracts, increased pressure on earnings and challenges with utilisation of both personnel and assets. Considering these effects, impairment test for goodwill performed for Q1 2020 has resulted in an impairment of goodwill of NOK 85 million. After impairment of NOK 85 million, all goodwill in the Group has been impaired. Impairment losses on goodwill cannot be reversed.
Net booked value of right-of-use assets at Q1 2020 consists of property with NOK 233 million and operating equipment of NOK 1 million.
| Financial Report Q1 2020DOF SUBSEA GROUP
19
Amounts in NOK million
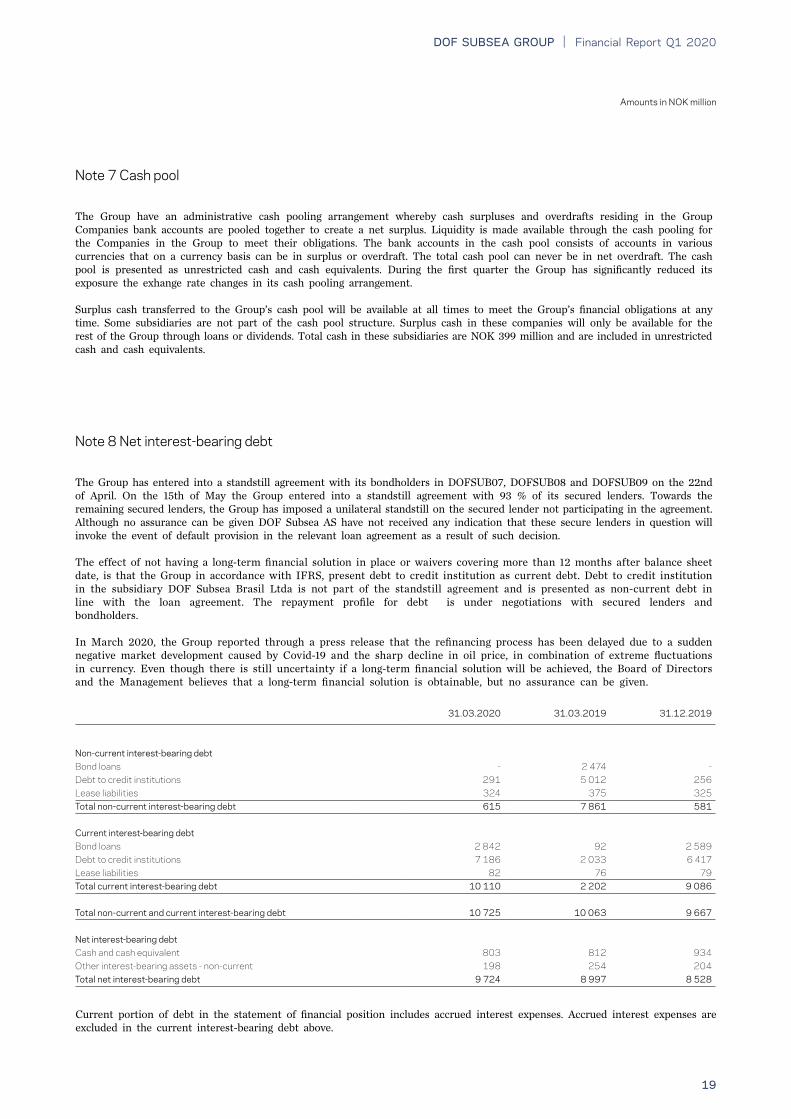
Note 7 Cash pool
The Group have an administrative cash pooling arrangement whereby cash surpluses and overdrafts residing in the Group Companies bank accounts are pooled together to create a net surplus. Liquidity is made available through the cash pooling for the Companies in the Group to meet their obligations. The bank accounts in the cash pool consists of accounts in various currencies that on a currency basis can be in surplus or overdraft. The total cash pool can never be in net overdraft. The cash pool is presented as unrestricted cash and cash equivalents. During the first quarter the Group has significantly reduced its exposure the exhange rate changes in its cash pooling arrangement.
Surplus cash transferred to the Group’s cash pool will be available at all times to meet the Group’s financial obligations at any time. Some subsidiaries are not part of the cash pool structure. Surplus cash in these companies will only be available for the rest of the Group through loans or dividends. Total cash in these subsidiaries are NOK 399 million and are included in unrestricted cash and cash equivalents.
Note 8 Net interest-bearing debt
The Group has entered into a standstill agreement with its bondholders in DOFSUB07, DOFSUB08 and DOFSUB09 on the 22nd of April. On the 15th of May the Group entered into a standstill agreement with 93 % of its secured lenders. Towards the remaining secured lenders, the Group has imposed a unilateral standstill on the secured lender not participating in the agreement. Although no assurance can be given DOF Subsea AS have not received any indication that these secure lenders in question will invoke the event of default provision in the relevant loan agreement as a result of such decision.
The effect of not having a long-term financial solution in place or waivers covering more than 12 months after balance sheet date, is that the Group in accordance with IFRS, present debt to credit institution as current debt. Debt to credit institution in the subsidiary DOF Subsea Brasil Ltda is not part of the standstill agreement and is presented as non-current debt in line with the loan agreement. The repayment profile for debt is under negotiations with secured lenders and bondholders.
In March 2020, the Group reported through a press release that the refinancing process has been delayed due to a sudden negative market development caused by Covid-19 and the sharp decline in oil price, in combination of extreme fluctuations in currency. Even though there is still uncertainty if a long-term financial solution will be achieved, the Board of Directors and the Management believes that a long-term financial solution is obtainable, but no assurance can be given.
31 .03 .2020 31 .03 .2019 31 .12 .2019
Non-current interest-bearing debt Bond loans - 2 474 -Debt to credit institutions 291 5 012 256Lease liabilities 324 375 325Total non-current interest-bearing debt 615 7 861 581
Current interest-bearing debtBond loans 2 842 92 2 589Debt to credit institutions 7 186 2 033 6 417Lease liabilities 82 76 79Total current interest-bearing debt 10 110 2 202 9 086
Total non-current and current interest-bearing debt 10 725 10 063 9 667
Net interest-bearing debtCash and cash equivalent 803 812 934Other interest-bearing assets - non-current 198 254 204Total net interest-bearing debt 9 724 8 997 8 528
Current portion of debt in the statement of financial position includes accrued interest expenses. Accrued interest expenses are excluded in the current interest-bearing debt above.

Financial Report Q1 2020 | DOF SUBSEA GROUP
20
Amounts in NOK million
A non-current loan has been provided by Eksportfinans and is invested as a restricted deposit. The repayment terms on the loan from Eksportfinans are equivalent with the reduction on the deposit. The loan is fully repaid in 2020. The cash deposit is included in restricted deposits.
Share of debt secured by fixed interest rate:
Fixed rateBalance
31 .03 .2020
NOK 77 % 3 794USD 60 % 6 135CAD 100 % 418Total debt 68 % 10 347
Financial covenantsThe loan agreements of the Company and the Group include covenants (based on the proportionate consolidation method of accounting for joint ventures):
The Group shall have available cash of at least NOK 500 million at all times
The Group shall have value-adjusted equity to value-adjusted assets of at least 30%
The Group shall have book equity of at least NOK 3 000 million at all times
The Group shall have positive working capital at all times, excl. current portion of debt to credit institutions
The fair value of the Group’s vessels shall always be at least 110-130% of the outstanding loan amount
In addition to the above-mentioned financial covenants, the loan agreements are also subject to the following conditions:
The Group’s assets shall be fully insured
There shall not be any change of classification, flag, management or ownership of the vessels without the prior written approval of the lenders
DOF ASA shall be the principal shareholder in DOF Subsea AS, and own a minimum of 50.1% of the shares
DOF Subsea AS shall not merge, demerge or divest activities without the prior written approval of the lenders
DOF Subsea AS shall report financial information to the lenders and Oslo Stock Exchange on a regular basis
The Group’s vessels shall be operated in accordance with applicable laws and regulations
Cash changes Non-cash changes
Interest bearing debtBalance
31 .12 .19 Cash flowsProceed lease
debtAmortised loan
expenseCurrency
adjustmentBalance
31 .12 .19
Bond loans 2 589 - - -1 254 2 842Debt to credit institutions 6 671 -72 230 2 646 7 477Lease liabilities 404 -22 - - 24 406
Total interest bearing debt 9 665 -94 230 1 924 10 725
Cash and non-cash changes in total borrowingsChanges in total borrowings over a period consists of both cash effects (disbursements and repayments) and non-cash effects (amortisations and currency translation effects). The following is the changes in the Group’s borrowings:
Note 8 Interest-bearing debt (continued from previous page)

| Financial Report Q1 2020DOF SUBSEA GROUP
21
Amounts in NOK million
31 .03 .2020 31 .03 .2019Instrument Received Contract amount Contract amountForeign exchange contracts NOK/EUR - 489Foreign exchange contracts NOK/USD 1 004 1 774Foreign exchange contracts USD/NOK 146 34
Note 9 Financial instruments and hedging activities
31 .03 .2020 31 .03 .2019
Assets Liabilities Assets Liabilities
Non-current and current portionInterest rate swaps 1 59 27 10Foreign exchange contracts - 153 13 42Total non-current and current 1 213 41 53
Non-current portionInterest rate swaps 1 59 27 9Foreign exchange contracts - - 1 3Total non-current portion 1 59 29 12
Total current portion - 154 12 40
As of period end the Group held the following foreign exchange rate derivatives, not qualified for hedge accounting:

Financial Report Q1 2020 | DOF SUBSEA GROUP
22
Amounts in NOK million
Note 12 Shareholder information
Name No . shares Shareholding Voting shares
DOF ASA 167 352 762 100% 100%Total 167 352 762 100 % 100 %
Note 10 Transactions with related parties
Description of transactions with related parties is given in the Group’s Annual Report for 2019. There are no major changes in type of transactions between related parties during the first quarter of 2020. The Group has receivables and liabilities towards DOF ASA, Norskan, DOF Management and Marin IT related to operations.
Note 11 Investments in associates and joint ventures
The Group has the following investments in associated and joint ventures accounted for using the equity method:
Name of entityPlace of business /
country of incorporation Industry% of ownership
interestNature of
relationshipMeasurement
method
DOFCON Brasil Group Norway Subsea Chartering 50% Joint Venture EquityDOF Management Group Norway Vessel management and operation 34% Associate EquityMarin IT AS Norway IT 35% Associate EquityMaster and Commander AS Norway Seismic Chartering 20% Associate Equity
31 .03 .2020Booked value of investments 01.01 1 859Share of net profit / loss for the period 165Share of other comprehensive income 389Booked value of investments 31 .03 2 413
Reconciliation of the aggregate carrying amounts in investments:
| Financial Report Q1 2020DOF SUBSEA GROUP
23
Amounts in NOK million
Note 14 Events after period end
The focus for the Group after period end has been to protect its employees from the impact of the global covid-19 situation and try to execute projects and operate the vessels as close to normal as possible. The Group has so far been able to operate its vessels close to normal, even though the replacement of crew has become and is expected to remain challenging.
Given the unclear situation with the broader impact of covid-19 and the oil price, the medium-term financial situation for the Group is challenging. The Group has entered into a standstill agreement with its bondholders in DOFSUB07, DOFSUB08 and DOFSUB09 on the 22nd of April. On the 15th of May the Group entered into a standstill agreement with 93 % of its secured lenders. Towards the remaining secured lender, the Group has imposed a unilateral standstill on the secured lender not participating in the agreement. Although no assurance can be given, DOF Subsea AS has not received any indication that the secure lender in question will invoke the event of default provision in the relevant loan agreement as a result of such decision. The liquidity facility, the earnings together with the standstill agreements cover the Group’s short-term liquidity need. The Group will continue its effort together with the secured lenders and bond-holders in order to try to reach a robust long-term financial solution. The standstill agreements do not cover DOF Subsea Brasil or the Joint Venture.
After period end the Group has received a contract on Skandi Skansen and Geosund and received a termination on the contract of Skandi Acergy. In addition, several of the Groups clients have asked for renegotiations of contract terms.
Note 13 Going Concern
This Financial Report has been prepared in accordance with the standard for interim reporting (IAS 34). The Financial Report does not include all the information and disclosures required in the annual financial statements, and should be read in conjunction with the Group’s Annual Report for 2019. The Financial Report is unaudited.
The Board of Directors and the Management in DOF Subsea AS are working on a long-term financial solution for the Group, the discussion with the relevant stakeholders is constructive. The Group has entered into a standstill agreement with its bondholders in DOFSUB07, DOFSUB08 and DOFSUB09 on the 22nd of April. On the 15th of May the Group entered into a standstill agreement with 93 % of its secured lenders. Towards the remaining secured lenders, the Group has imposed a unilateral standstill on the secured lender not participating in the agreement. Although no assurance can be given, DOF Subsea AS has not received any indication that these secure lenders in question will invoke the event of default provision in the relevant loan agreement as a result of such decision.
If the Group cannot be treated as ‘going concern’, the valuation of the Group’s assets will be further revised. Valuation of asset without the going concern assumption may result in further impairment of the Group’s assets.
Financial Report Q1 2020 | DOF SUBSEA GROUP
24
Amounts in NOK million
Alternative performance measurementsThe Group’s presents alternative performance measurements (APM) that are regularly reviewed by management and aim to enhance the understanding of the Group’s performance. APMS are calculated consistently over time and are based on financial data presented in accordance with IFRS and other operational data as described in the table below.
Measure Description Reason for including
Operating profit before depreciation (EBITDA)
EBITDA is defined as operating profit, including profit from sale of non-current assets, before impairment of tangible and intangible assets, depreciation of tangible assets and amortisation of contract assets. EBITDA represents earnings before interest, tax, depreciation and amortisation, and is a key financial parameter for the Group.
This measure is useful in evaluating operating profitability on a more variable cost basis as it excludes depreciation, impairment and amortisation expenses related primarily to capital expenditures and acquisitions that occurred in the past. EBITDA shows operating profitability regardless of capital structure and tax situations with the purpose of simplifying comparison in the same industry.
EBITDA marginEBITDA margin presented is defined as EBITDA divided by operating revenue.
Enables comparability of profitability relative to operating revenue.
Operating profit (EBIT) EBIT represents earnings before interest and taxEBIT shows operating profitability regardless of capital structure and tax situations.
EBIT marginEBIT margin presented is defined as EBIT divided by operating revenue.
Enables comparability of profitability relative to operating revenue.
Net interest-bearing debt
Net interest-bearing debt consists of both current and non-current interest-bearing liabilities less interest bearing financial assets, cash and cash equivalents. Non-current receivables from joint ventures are not included in net interest-bearing debt. Cash and cash equivalents will include restricted cash. Current interest-bearing debt includes interest-bearing debt related to asset held for sale.
Net interest-bearing debt is a measure of the Group’s net indebtedness that provides an indicator of the overall statement. It measures the Group’s ability to pay all interest-bearing liabilities within available interest bearing financial assets, cash and cash equivalents, if all debt matured on the day of the calculation. It is therefore a measurement of the risk related to the Group’s capital structure.
Working capitalThe working capital position of the Group is equal to current assets less current liabilities.
It is a measure of the Group’s liquidity and efficiency, and demonstrates the Group’s ability to pay its current liabilities.
Return on net capital Profit / loss for the period divided by equity.
Return on net capital represents the total return on equity capital and shows the Group’s ability to turn assets into profits.
Equity ratio Equity divided by assets at the reporting date.Measure capital contributed by shareholders to fund the Group’s assets.
Value-adjusted equity ratio
Value-adjusted equity divided by value-adjusted assets at the reporting date. The market value is used for the vessels.
Measure capital contributed by shareholders to fund the Group’s assets.
Book value equity per share Equity divided by number of shares outstanding.Measures the Group’s net asset value on a per-share basis.
Value-adjusted equity per share
Value-adjusted equity divided by number of shares outstanding. The market value is used for the vessels.
Measures the Group’s net asset value on a per-share basis.
Other definitions
Measure Description
Market valueCalculated average vessel value between several independent brokers’ estimates based on the principle of “willing buyer and willing seller”.
Vessel utilisation
Vessel utilisation is a measure of the Group`s ability to keep vessels in operation and on contract with clients, expressed as a percentage. The vessel utilisation numbers are based on actual available days, including yard-stay days for dry docking, repair and upgrade/conversion, transits and idle time.
Contract backlog
Sum of undiscounted revenue related to secured contracts in the future and optional contract extensions as determined by the client in the future. Contract backlog excludes master service agreements (MSAs) within the Subsea/IMR Projects segment. Under the MSAs only confirmed POs are included.
Firm contract backlogSum of undiscounted revenue related to secured contracts in the future. Secured contracts are contracts signed with clients in the past, covering future delivery of services.
Backlog optionsSum of undiscounted revenue related to optional contract extensions as determined by the client in the future.
Note 15 Performance measurement definitions

| Financial Report Q1 2020DOF SUBSEA GROUP
25
Amounts in NOK million
Supplemental information
Condensed statement of comprehensive income 5 last quarters
1Q 2020 4Q 2019 3Q 2019 2Q 2019 1Q 2019
Operating revenue 1329 1 329 1 458 1 257 1 103
Operating expenses -826 -763 -909 -809 -738Share of net income of associates and joint ventures -12 -22 -7 -3 -Profit from sale of non-current assets - - 3 - -Operating profit before depreciation and impairment (EBITDA)
491 543 545 445 365
Depreciation and impairment -1 090 -396 -938 -238 -209Operating profit (EBIT) -599 148 -393 207 156
Financial income 6 9 6 6 6Financial expenses -214 -237 -204 -193 -200Realised gain / loss on financial instruments -395 51 -47 27 -56Unrealised gain / loss on financial instruments -886 90 -340 11 102Net financial income / loss -1 489 -87 -585 -148 -148
Profit / loss before tax -2 088 61 -261 59 9Tax expenses 141 -90 -112 -45 -33
Profit / loss for the period -1 947 -30 -1 090 14 -25
The supplemental information below is presented according to management reporting, based on the proportionate consolidation method. Proportionate consolidation method implies full consolidation for subsidiaries, and consolidation of 50% of the comprehensive income and financial position for the joint ventures.

Financial Report Q1 2020 | DOF SUBSEA GROUP
26
Amounts in NOK million
Condensed statement of financial position 5 last quarters
Assets 1Q 2020 4Q 2019 3Q 2019 2Q 2019 1Q 2019
Intangible assets 400 276 314 651 679Tangible assets 17 062 16 783 17 366 17 489 17 707Financial assets 329 357 422 431 453Total non-current assets 17 791 17 417 18 102 18 571 18 840
Other current assets 1 212 1 120 1 342 1 128 1 165Cash and cash equivalents 1 248 1 238 1 051 1 092 1 152
Total current assets 2 460 2 358 2 393 2 219 2 317
Total assets 20 251 19 775 20 495 20 790 21 156
Equity and liabilities 1Q 2020 4Q 2019 3Q 2019 2Q 2019 1Q 2019
Paid in equity 2 753 4 344 4 344 4 344 4 344Other equity 110 171 193 1 191 1 170Non-controlling interests 146 181 182 197 195Total equity 3 010 4 697 4 719 5 732 5 708
Bond loans - 2 122 2 168 2 087 2 474Debt to credit institutions 4 968 7 913 8 564 8 664 9 030Other non-current liabilities 439 352 387 375 412Total non-current liabilities 5 407 10 387 11 119 11 126 11 915
Current portion of debt to credit institutions 10 742 3 876 3 618 3 090 2 715Other current liabilities 1 092 815 1 039 843 817Total current liabilities 11 834 4 692 4 657 3 932 3 533
Total liabilities 17 241 15 079 15 776 15 058 15 448
Total equity and liabilities 20 251 19 775 20 495 20 790 21 156
Key figures
1Q 2020 4Q 2019 3Q 2019 2Q 2019 1Q 2019
Profit per share (NOK) -11.64 -0,18 -6.52 0.09 -0.15EBITDA margin 37% 41 % 39 % 35 % 33 %EBIT margin -48% 11 % -27 % 16 % 14 %Return on equity -65% -1 % -21 % 0 % -0 %Book value equity per share (NOK) 17.98 28.06 28.20 34.25 34.11Net interest-bearing debt (NOK million) 14 468 12 633 13 280 12 721 12 774

| Financial Report Q1 2020DOF SUBSEA GROUP
27
Financial Report Q1 2020 | DOF SUBSEA GROUP
28
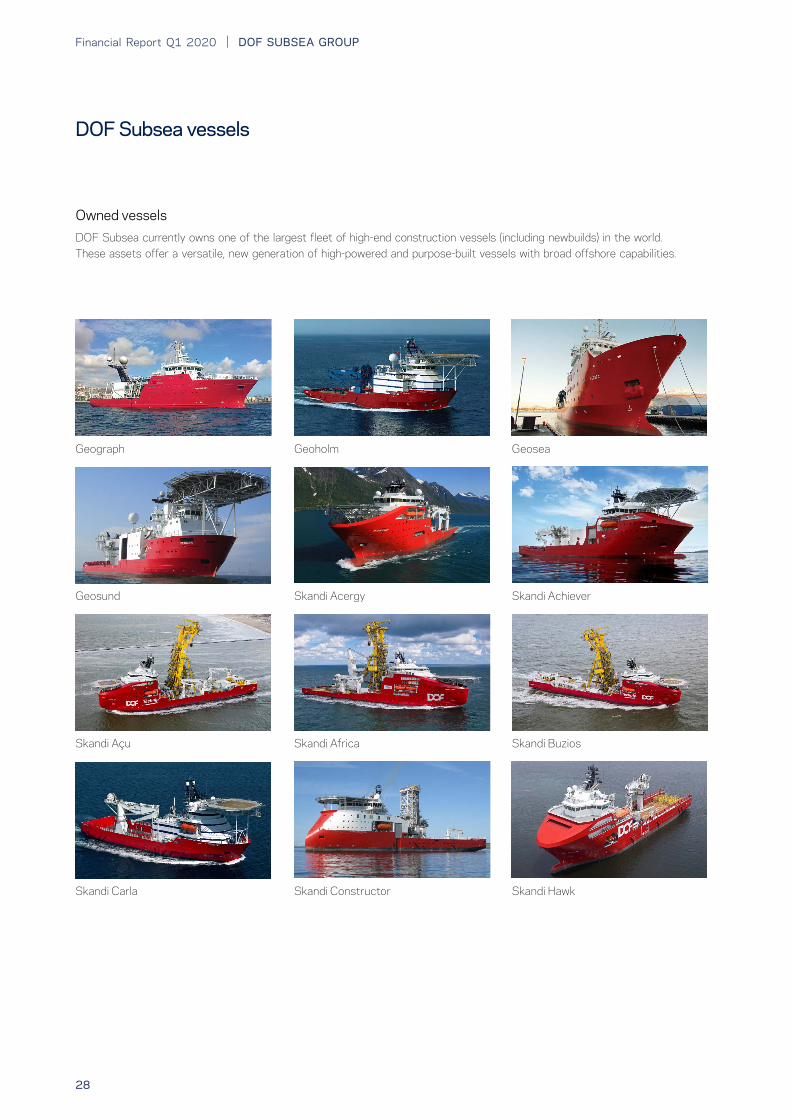
DOF Subsea currently owns one of the largest fleet of high-end construction vessels (including newbuilds) in the world. These assets offer a versatile, new generation of high-powered and purpose-built vessels with broad offshore capabilities.
Owned vessels
Skandi Acergy
Geograph Geoholm Geosea
Geosund
Skandi Carla Skandi Constructor
Skandi Achiever
Skandi Hawk
Skandi Africa Skandi BuziosSkandi Açu
DOF Subsea vessels

| Financial Report Q1 2020DOF SUBSEA GROUP
29
Skandi Patagonia
Skandi Skansen
Skandi Salvador
Skandi Neptune Skandi NiteroiSkandi Hercules
Skandi Vitoria
Skandi Seven Skandi Singapore
Skandi Vinland
Skandi RecifeSkandi Olinda
Financial Report Q1 2020 | DOF SUBSEA GROUP
30
Harvey Deep-Sea Harvey Blue-Sea
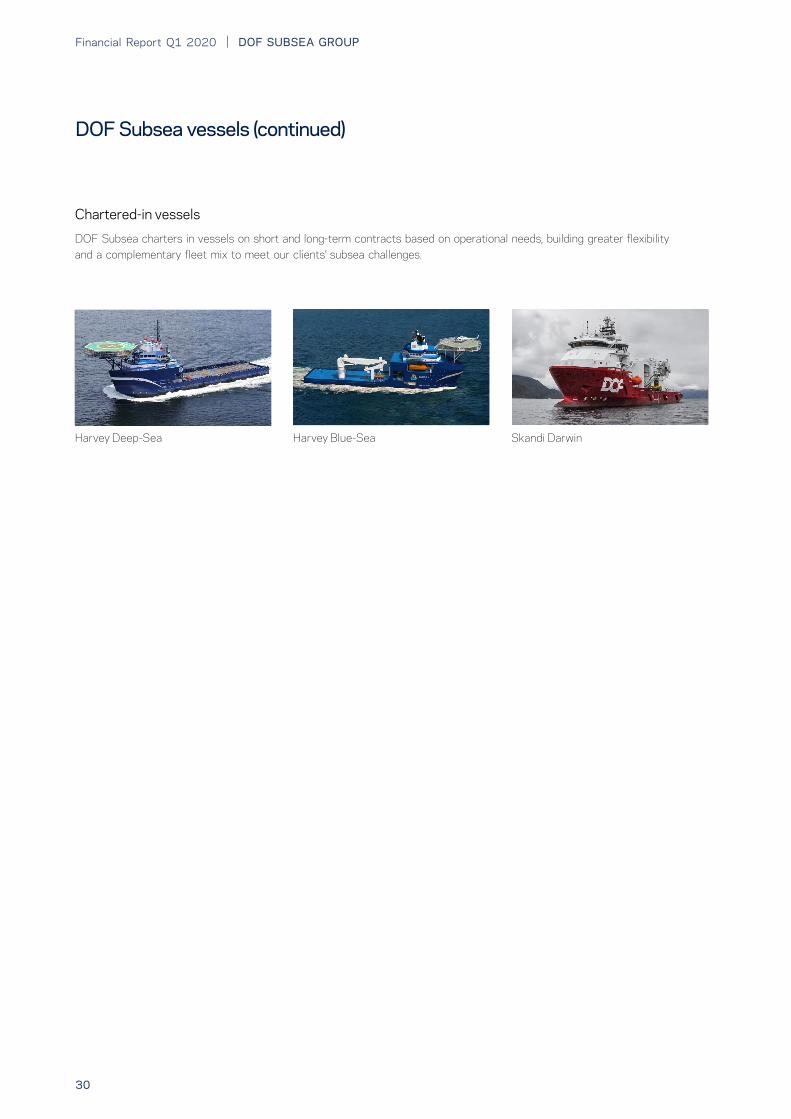
Chartered-in vessels
DOF Subsea charters in vessels on short and long-term contracts based on operational needs, building greater flexibility and a complementary fleet mix to meet our clients’ subsea challenges.
Skandi Darwin
DOF Subsea vessels (continued)
AUSTRALIA
DOF Subsea Australia Pty Ltd5th Floor, 181 St. Georges TcePerth, Wa 6000 AUSTRALIAPhone: +61 8 9278 8700Fax: +61 8 9278 8799
DOF Management Australia5th Floor, 181 St. Georges TcePerth, Wa 6000 AUSTRALIAPhone: +61 3 9556 5478 Mobile: +61 418 430 939
BRAZIL
DOF Subsea Brasil Serviços LtdaRua Fiscal Juca, 330 Q: W2 – L: 0001 Loteamento Novo Cavaleiros Vale Encantado – Macaé/RJ BRAZIL - CEP 27933-450 Rio address: Rua Lauro Muller 116 – Offices1701 – BotafogoRio de Janeiro – RJBRAZIL – CEP: 22290-160Phone: +55 21 2103-5708
CANADA
DOF Subsea Canada26 Allstone Street, Unit 2Mount Pearl, NewfoundlandCANADA, A1N 0A4Phone: +1 709 576 2033Fax: +1 709 576 2500
SINGAPORE
DOF Subsea Asia Pacific Pte Ltd25 Loyang CrescentBlock 302 TOPS Avenue 1#01-11Singapore 508988Phone: +65 6561 2780Fax: +65 6561 2431
DOF Management Pte Ltd25 Loyang CrescentBlock 302 TOPS Avenue 3#01-11Singapore 508988Phone: +65 6868 1001Fax: +65 6561 2431
GLOBAL HQ
DOF Subsea ASThormøhlensgate 53 C5006 Bergen NORWAYPhone: +47 55 25 22 00Fax: +47 55 25 22 01
NORWAY
DOF Subsea Norway ASThormøhlensgate 53 C5006 Bergen NORWAYPhone: +47 55 25 22 00Fax: +47 55 25 22 01
SEMAR ASOksenøystein 121366 Lysaker NORWAYPhone: +47 67 12 40 06Fax: +47 67 12 40 06
DOF Management ASAlfabygget5392 StorebøNORWAY
Thormøhlensgate 53 C5006 Bergen NORWAYPhone: +47 56 18 10 00Fax: +47 56 18 10 06
ANGOLA
DOF Subsea AngolaBelas Business Park-Talatona Edificio Bengo, 1º AndarSala 106/107, LuandaRepublic of AngolaPhone: +244 222 43 28 58Fax: +244 222 44 40 68Mobile: +244 227 28 00 96 +244 277 28 00 95
UNITED KINGDOM
DOF Subsea UK LtdHorizons House, 81-83 Waterloo Quay Aberdeen, AB11 5DE UNITED KINGDOMPhone: +44 1224 614 000Fax: +44 1224 614 001
DOF Subsea S&P UK LtdHorizons House, 81-83 Waterloo Quay Aberdeen, AB11 5DE UNITED KINGDOMPhone: +44 1224 614 000Fax: +44 1224 614 001
CSL EngineeringHorizons House, 81-83 Waterloo Quay Aberdeen, AB11 5DE UNITED KINGDOMPhone: +44 1224 285 566Fax: +44 1224 285 599
DOF (UK) LtdHorizons House, 81-83 Waterloo Quay Aberdeen, AB11 5DE UNITED KINGDOMPhone: +44 12 24 58 66 44Fax: +44 12 24 58 65 55
USA
DOF Subsea USA Inc5365 W. Sam Houston Parkway Suite 400, Houston, Texas 77041, USAPhone: +1 713 896 2500Fax: +1 713 726 5800

DOF Subsea ASThormøhlens gate 53 C
5006 BergenNORWAY
www.dofsubsea.com