Embed Size (px)
Citation preview
Q2 Financial Presentation 2017
DOF ASA
2DOF ASA – Q2 presentation 2017
Highlights Group
DOF ASA – Q2 presentation 2017 3
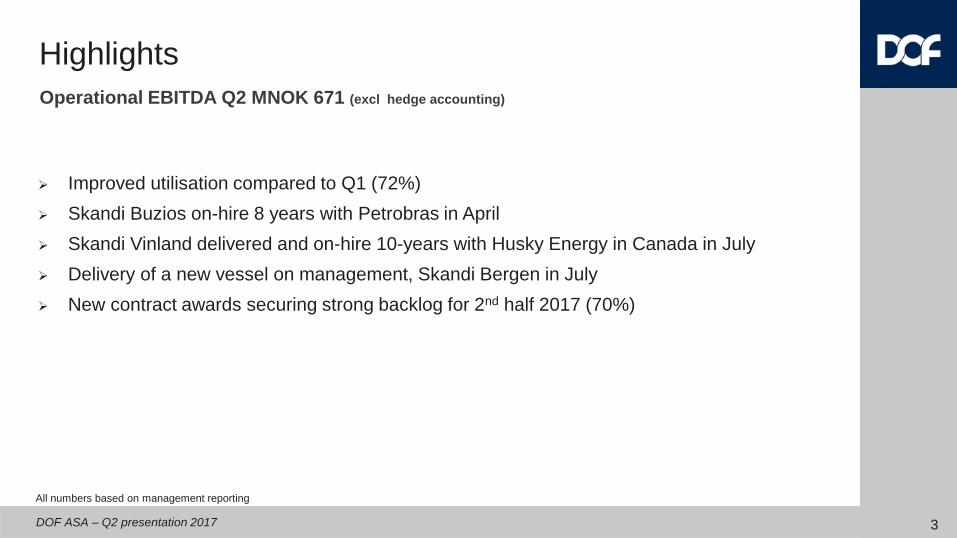
➢ Improved utilisation compared to Q1 (72%)
➢ Skandi Buzios on-hire 8 years with Petrobras in April
➢ Skandi Vinland delivered and on-hire 10-years with Husky Energy in Canada in July
➢ Delivery of a new vessel on management, Skandi Bergen in July
➢ New contract awards securing strong backlog for 2nd half 2017 (70%)
All numbers based on management reporting
Operational EBITDA Q2 MNOK 671 (excl hedge accounting)
Highlights
DOF ASA – Q2 presentation 2017
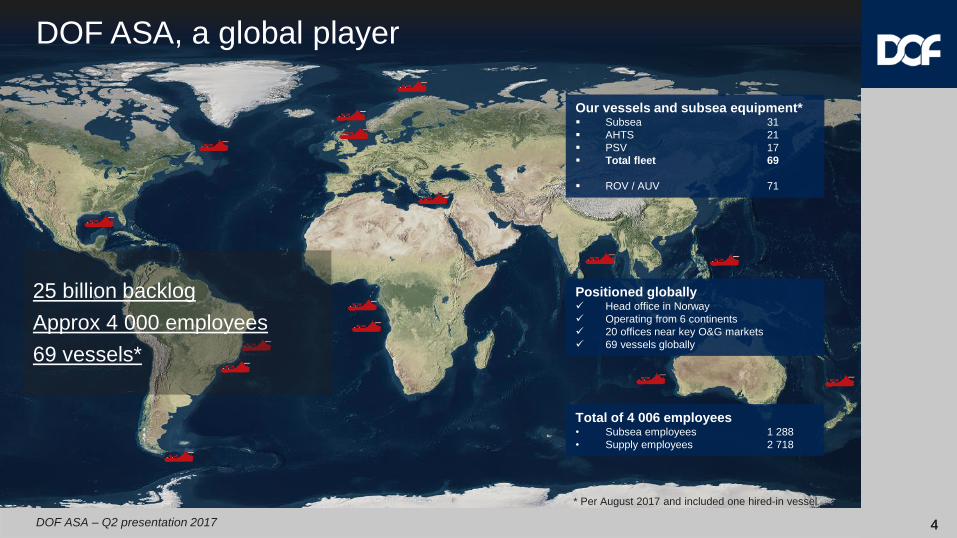
Total of 4 006 employees• Subsea employees 1 288
• Supply employees 2 718
Positioned globally✓ Head office in Norway
✓ Operating from 6 continents
✓ 20 offices near key O&G markets
✓ 69 vessels globally
Our vessels and subsea equipment*▪ Subsea 31
▪ AHTS 21
▪ PSV 17
▪ Total fleet 69
▪ ROV / AUV 71
DOF ASA, a global player
25 billion backlog
Approx 4 000 employees
69 vessels*
44
* Per August 2017 and included one hired-in vessel
DOF ASA – Q2 presentation 2017
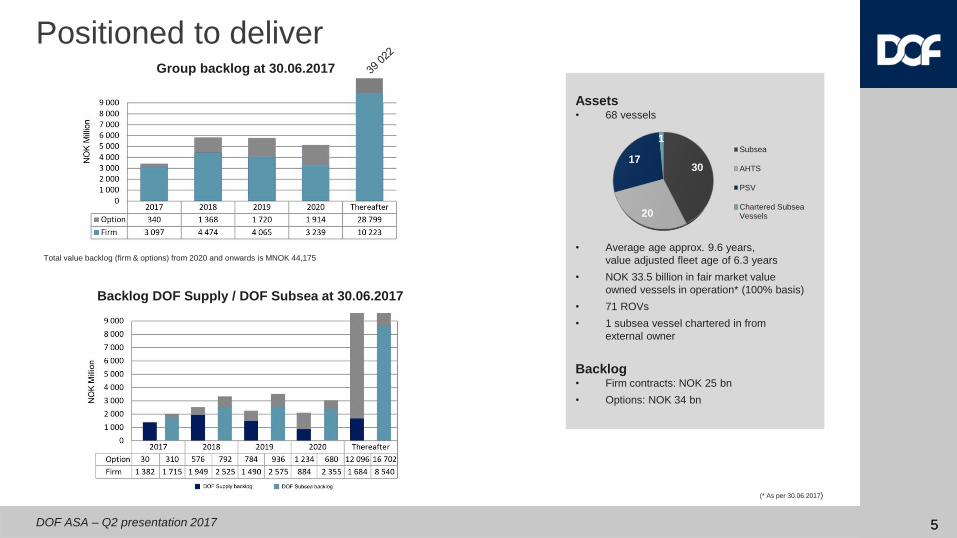
Positioned to deliver
Assets• 68 vessels
• Average age approx. 9.6 years,
value adjusted fleet age of 6.3 years
• NOK 33.5 billion in fair market value
owned vessels in operation* (100% basis)
• 71 ROVs
• 1 subsea vessel chartered in from
external owner
Backlog• Firm contracts: NOK 25 bn
• Options: NOK 34 bn
Total value backlog (firm & options) from 2020 and onwards is MNOK 44,175
30
20
17
1Subsea
AHTS
PSV
Chartered SubseaVessels
55
Backlog DOF Supply / DOF Subsea at 30.06.2017
(* As per 30.06.2017)
Group backlog at 30.06.2017
DOF ASA – Q2 presentation 2017
DOF Supply - New contracts & vessels
6
New contracts in the North Sea
➢ Skandi Flora (PSV) awarded a 5-yr contract commencing in Q3
➢ Skandi Mongstad (PSV) awarded a 5-yr contract commencing in Q4
➢ Skandi Vega (AHTS) 1-yr extension from May
Contract in Brazil
➢ Skandi Admiral awarded a 1-yr contract with Petrobras in Brazil with start up in June
Vessels added to the fleet
➢ Skandi Hera (AHTS), on management from Feb, operating in the North Sea spot market
➢ Skandi Darwin (Subsea), on management from Feb, completed a conversion as IRM
vessel in August. Committed to DOF Subsea to serve their contract with Shell at the
Prelude field in Australia
➢ Skandi Bergen (AHTS), on management from July, in transit from Asia Pacific
DOF ASA – Q2 presentation 2017
DOF Subsea - New contracts & vessels
7
Contracts
➢ Skandi Buzios (PLSV) on-hire 8-yr contract with Petrobras in April
➢ Skandi Chieftain awarded a 5-month contract in Canada with commencement in June 2017
➢ Extension chartered-in JAC vessel, Harvey Deep Sea (MPSV), until end 2018 + 2x1-yr
options
➢ Skandi Carla (Subsea) awarded a 2-yr extension with Fugro
➢ Skandi Constructor (Subsea) awarded a 120-day contract with Siemens on the Galloper
Offshore Wind Farm Project in North Sea,
➢ Skandi Salvador (RSV) awarded a 6-month extension with Petrobras
➢ Various IRM and diving contracts in the Asia Pacific, Atlantic region, and
the North America region
New vessels
➢ Skandi Vinland (IRM) delivered and on-hire on a 10-yr contract with Husky Energy in
Canada in July
DOF ASA – Q2 presentation 2017 8
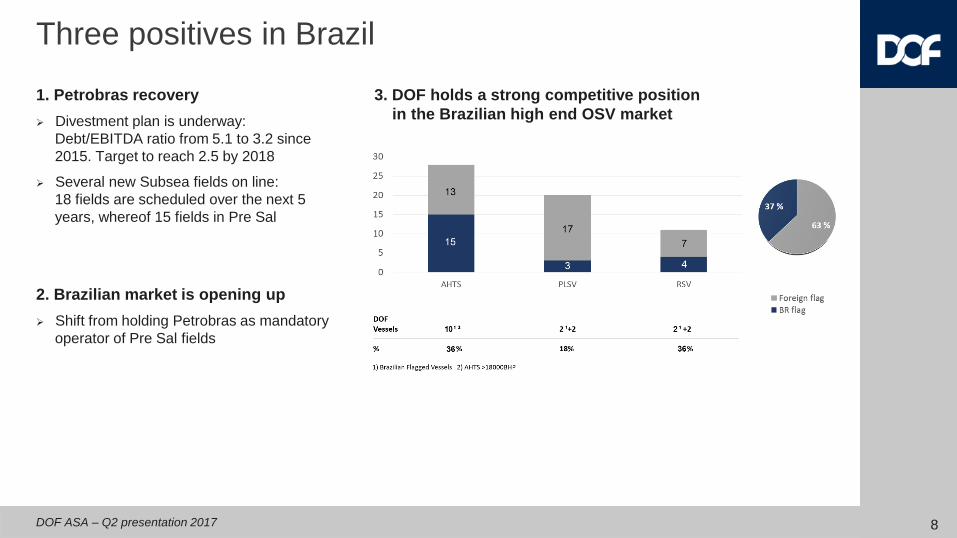
Three positives in Brazil
1. Petrobras recovery
➢ Divestment plan is underway:
Debt/EBITDA ratio from 5.1 to 3.2 since
2015. Target to reach 2.5 by 2018
➢ Several new Subsea fields on line:
18 fields are scheduled over the next 5
years, whereof 15 fields in Pre Sal
2. Brazilian market is opening up
➢ Shift from holding Petrobras as mandatory
operator of Pre Sal fields
3. DOF holds a strong competitive position
in the Brazilian high end OSV market

9DOF ASA – Q2 presentation 2017
FinancialsManagement Reporting
DOF ASA – Q2 presentation 2017 10
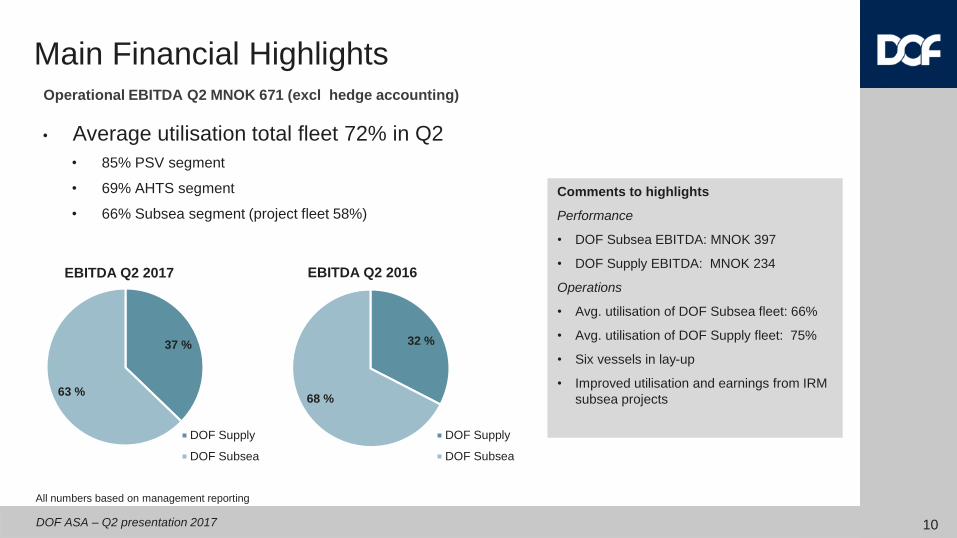
• Average utilisation total fleet 72% in Q2
• 85% PSV segment
• 69% AHTS segment
• 66% Subsea segment (project fleet 58%)
All numbers based on management reporting
Operational EBITDA Q2 MNOK 671 (excl hedge accounting)
Main Financial Highlights
Comments to highlights
Performance
• DOF Subsea EBITDA: MNOK 397
• DOF Supply EBITDA: MNOK 234
Operations
• Avg. utilisation of DOF Subsea fleet: 66%
• Avg. utilisation of DOF Supply fleet: 75%
• Six vessels in lay-up
• Improved utilisation and earnings from IRM
subsea projects
37 %
63 %
EBITDA Q2 2017
DOF Supply
DOF Subsea
32 %
68 %
EBITDA Q2 2016
DOF Supply
DOF Subsea
DOF ASA – Q2 presentation 2017
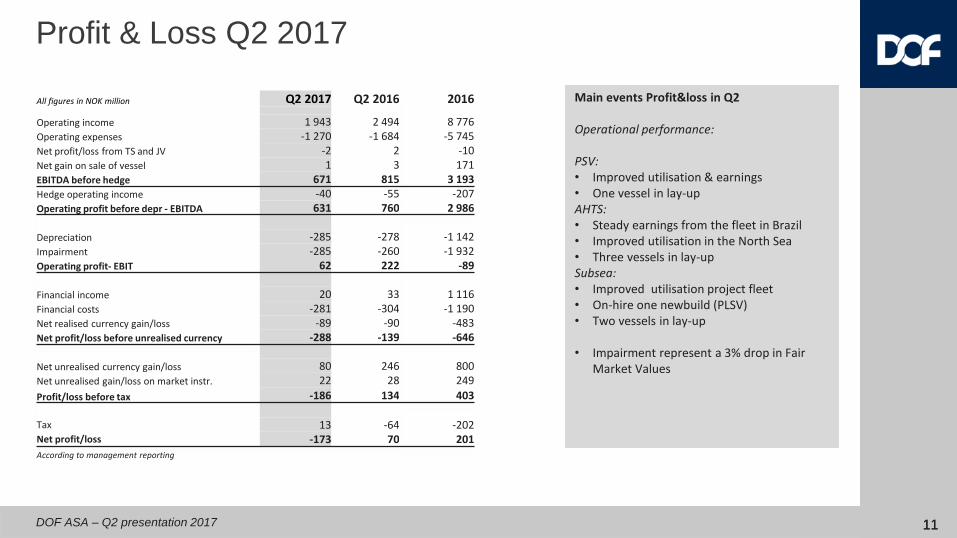
Profit & Loss Q2 2017
Main events Profit&loss in Q2
Operational performance:
PSV:• Improved utilisation & earnings• One vessel in lay-up AHTS:• Steady earnings from the fleet in Brazil• Improved utilisation in the North Sea• Three vessels in lay-upSubsea:• Improved utilisation project fleet• On-hire one newbuild (PLSV)• Two vessels in lay-up
• Impairment represent a 3% drop in Fair Market Values
All figures in NOK million Q2 2017 Q2 2016 2016
Operating income 1 943 2 494 8 776 Operating expenses -1 270 -1 684 -5 745 Net profit/loss from TS and JV -2 2 -10 Net gain on sale of vessel 1 3 171 EBITDA before hedge 671 815 3 193 Hedge operating income -40 -55 -207 Operating profit before depr - EBITDA 631 760 2 986
Depreciation -285 -278 -1 142 Impairment -285 -260 -1 932 Operating profit- EBIT 62 222 -89
Financial income 20 33 1 116 Financial costs -281 -304 -1 190 Net realised currency gain/loss -89 -90 -483 Net profit/loss before unrealised currency -288 -139 -646
Net unrealised currency gain/loss 80 246 800 Net unrealised gain/loss on market instr. 22 28 249
Profit/loss before tax -186 134 403
Tax 13 -64 -202 Net profit/loss -173 70 201
According to management reporting
1111
DOF ASA – Q2 presentation 2017
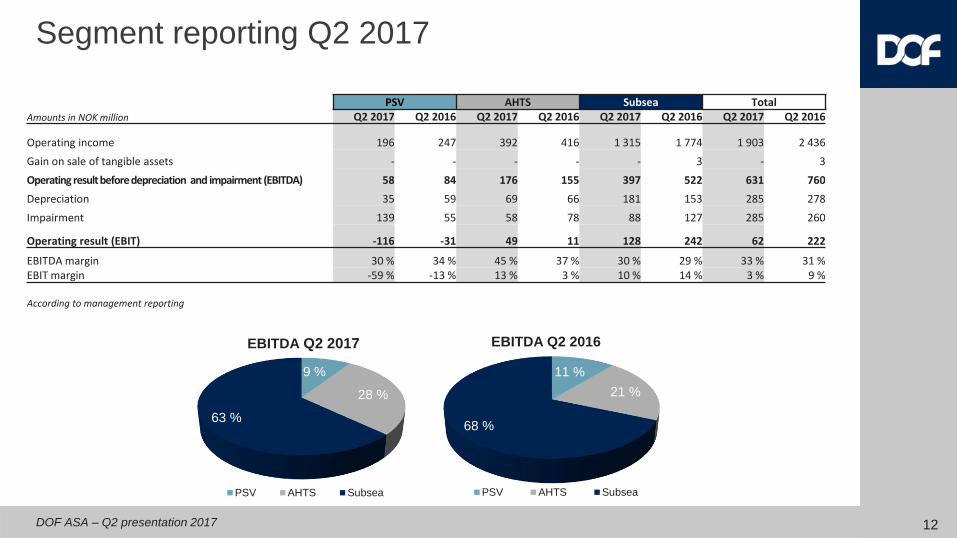
Segment reporting Q2 2017
PSV AHTS Subsea TotalAmounts in NOK million Q2 2017 Q2 2016 Q2 2017 Q2 2016 Q2 2017 Q2 2016 Q2 2017 Q2 2016
Operating income 196 247 392 416 1 315 1 774 1 903 2 436
Gain on sale of tangible assets - - - - - 3 - 3
Operating result before depreciation and impairment (EBITDA) 58 84 176 155 397 522 631 760
Depreciation 35 59 69 66 181 153 285 278
Impairment 139 55 58 78 88 127 285 260
Operating result (EBIT) -116 -31 49 11 128 242 62 222
EBITDA margin 30 % 34 % 45 % 37 % 30 % 29 % 33 % 31 %EBIT margin -59 % -13 % 13 % 3 % 10 % 14 % 3 % 9 %
According to management reporting
12
9 %
28 %
63 %
EBITDA Q2 2017
PSV AHTS Subsea
11 %
21 %
68 %
EBITDA Q2 2016
PSV AHTS Subsea
DOF ASA – Q2 presentation 2017
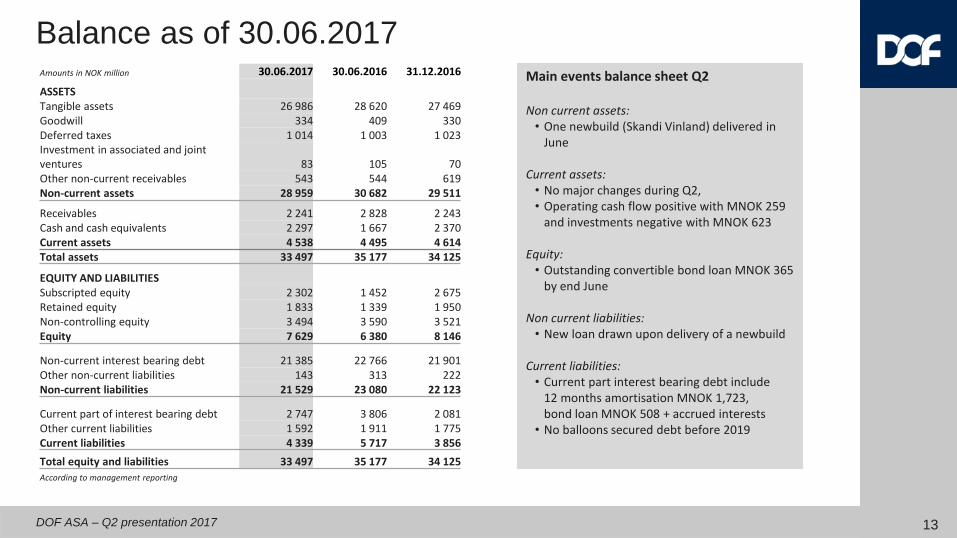
Balance as of 30.06.2017Main events balance sheet Q2
Non current assets:• One newbuild (Skandi Vinland) delivered in
June
Current assets:• No major changes during Q2, • Operating cash flow positive with MNOK 259
and investments negative with MNOK 623
Equity:• Outstanding convertible bond loan MNOK 365
by end June
Non current liabilities:• New loan drawn upon delivery of a newbuild
Current liabilities:• Current part interest bearing debt include
12 months amortisation MNOK 1,723, bond loan MNOK 508 + accrued interests
• No balloons secured debt before 2019
Amounts in NOK million 30.06.2017 30.06.2016 31.12.2016
ASSETSTangible assets 26 986 28 620 27 469Goodwill 334 409 330Deferred taxes 1 014 1 003 1 023Investment in associated and joint ventures 83 105 70Other non-current receivables 543 544 619Non-current assets 28 959 30 682 29 511
Receivables 2 241 2 828 2 243Cash and cash equivalents 2 297 1 667 2 370Current assets 4 538 4 495 4 614Total assets 33 497 35 177 34 125
EQUITY AND LIABILITIESSubscripted equity 2 302 1 452 2 675Retained equity 1 833 1 339 1 950Non-controlling equity 3 494 3 590 3 521Equity 7 629 6 380 8 146
Non-current interest bearing debt 21 385 22 766 21 901Other non-current liabilities 143 313 222Non-current liabilities 21 529 23 080 22 123
Current part of interest bearing debt 2 747 3 806 2 081Other current liabilities 1 592 1 911 1 775Current liabilities 4 339 5 717 3 856
Total equity and liabilities 33 497 35 177 34 125
According to management reporting
13
14DOF ASA – Q2 presentation 2017
DOF Subsea
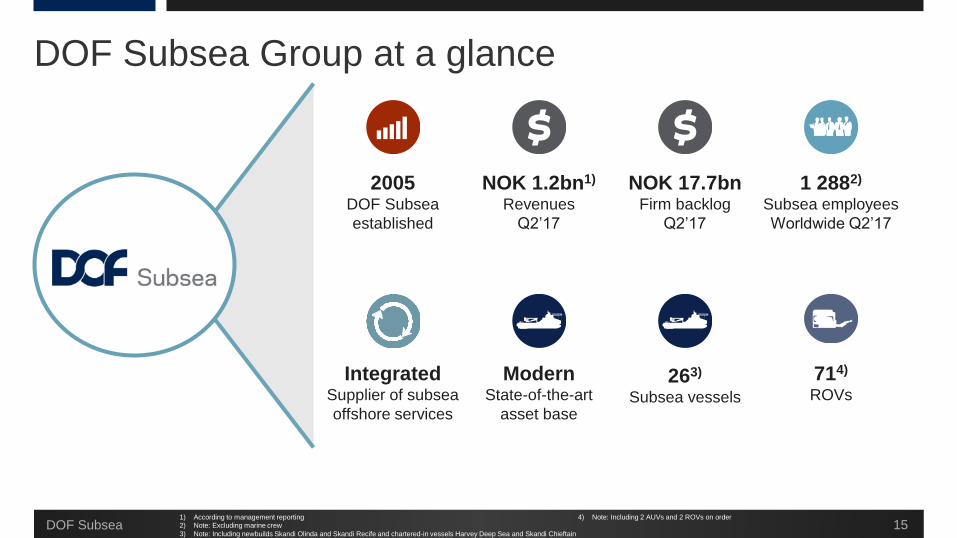
DOF Subsea Group at a glance
15
2005DOF Subsea
established
NOK 1.2bn1)
Revenues
Q2’17
1 2882)
Subsea employees
Worldwide Q2’17
NOK 17.7bnFirm backlog
Q2’17
263)
Subsea vessels
714)
ROVs
ModernState-of-the-art
asset base
IntegratedSupplier of subsea
offshore services
1) According to management reporting
2) Note: Excluding marine crew
3) Note: Including newbuilds Skandi Olinda and Skandi Recife and chartered-in vessels Harvey Deep Sea and Skandi Chieftain
4) Note: Including 2 AUVs and 2 ROVs on order
DOF Subsea
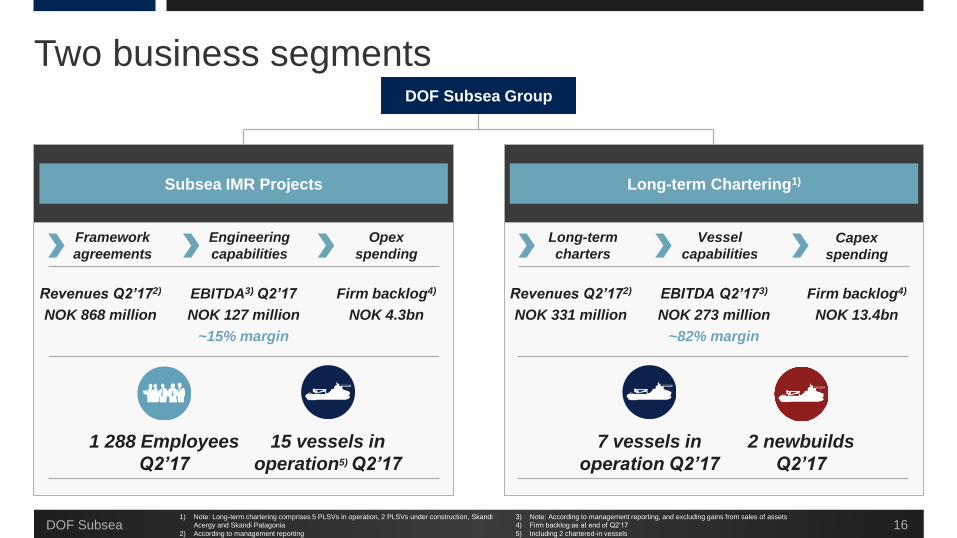
Two business segments
DOF Subsea 16
DOF Subsea Group
Long-term Chartering1)
Revenues Q2’172)
NOK 331 million
EBITDA Q2’173)
NOK 273 million
~82% margin
Firm backlog4)
NOK 13.4bn
1) Note: Long-term chartering comprises 5 PLSVs in operation, 2 PLSVs under construction, Skandi
Acergy and Skandi Patagonia
2) According to management reporting
3) Note: According to management reporting, and excluding gains from sales of assets
4) Firm backlog as at end of Q2’17
5) Including 2 chartered-in vessels
2 newbuilds
Q2’17
7 vessels in
operation Q2’17
Long-term
charters
Vessel
capabilitiesCapex
spending
Subsea IMR Projects
Revenues Q2’172)
NOK 868 million
EBITDA3) Q2’17
NOK 127 million
~15% margin
Firm backlog4)
NOK 4.3bn
1 288 Employees
Q2’17
15 vessels in
operation5) Q2’17
Engineering
capabilities
Framework
agreements
Opex
spending
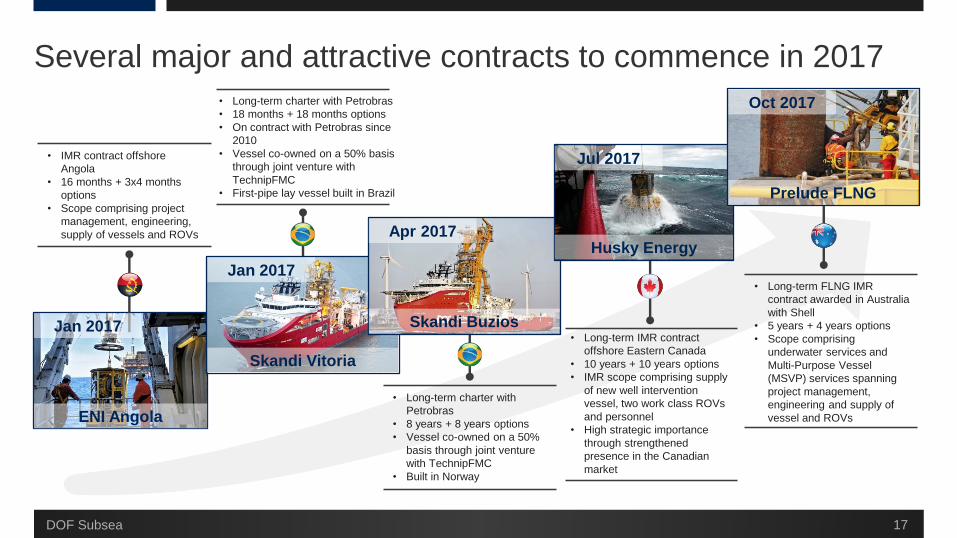
Several major and attractive contracts to commence in 2017
17
ENI Angola
Jan 2017
• IMR contract offshore
Angola
• 16 months + 3x4 months
options
• Scope comprising project
management, engineering,
supply of vessels and ROVs
• Long-term charter with Petrobras
• 18 months + 18 months options
• On contract with Petrobras since
2010
• Vessel co-owned on a 50% basis
through joint venture with
TechnipFMC
• First-pipe lay vessel built in Brazil
• Long-term charter with
Petrobras
• 8 years + 8 years options
• Vessel co-owned on a 50%
basis through joint venture
with TechnipFMC
• Built in Norway
• Long-term IMR contract
offshore Eastern Canada
• 10 years + 10 years options
• IMR scope comprising supply
of new well intervention
vessel, two work class ROVs
and personnel
• High strategic importance
through strengthened
presence in the Canadian
market
• Long-term FLNG IMR
contract awarded in Australia
with Shell
• 5 years + 4 years options
• Scope comprising
underwater services and
Multi-Purpose Vessel
(MSVP) services spanning
project management,
engineering and supply of
vessel and ROVs
Skandi Vitoria
Jan 2017
Skandi Buzios
Apr 2017Husky Energy
Jul 2017
Prelude FLNG
Oct 2017
DOF Subsea
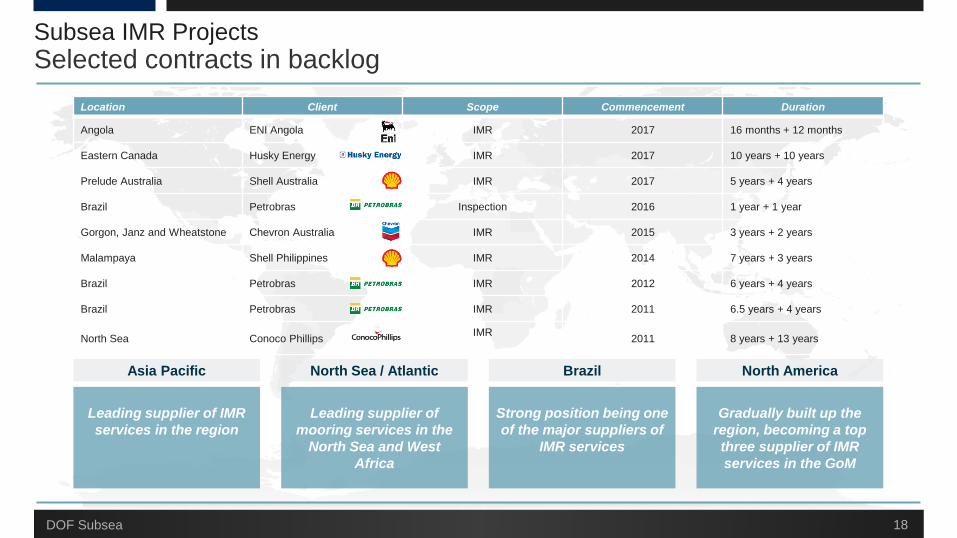
Selected contracts in backlog
18
Location Client Scope Commencement Duration
Angola ENI Angola IMR 2017 16 months + 12 months
Eastern Canada Husky Energy IMR 2017 10 years + 10 years
Prelude Australia Shell Australia IMR 2017 5 years + 4 years
Brazil Petrobras Inspection 2016 1 year + 1 year
Gorgon, Janz and Wheatstone Chevron Australia IMR 2015 3 years + 2 years
Malampaya Shell Philippines IMR 2014 7 years + 3 years
Brazil Petrobras IMR 2012 6 years + 4 years
Brazil Petrobras IMR 2011 6.5 years + 4 years
North Sea Conoco PhillipsIMR
2011 8 years + 13 years
Subsea IMR Projects
North America
Gradually built up the
region, becoming a top
three supplier of IMR
services in the GoM
Brazil
Strong position being one
of the major suppliers of
IMR services
North Sea / Atlantic
Leading supplier of
mooring services in the
North Sea and West
Africa
Asia Pacific
Leading supplier of IMR
services in the region
DOF Subsea
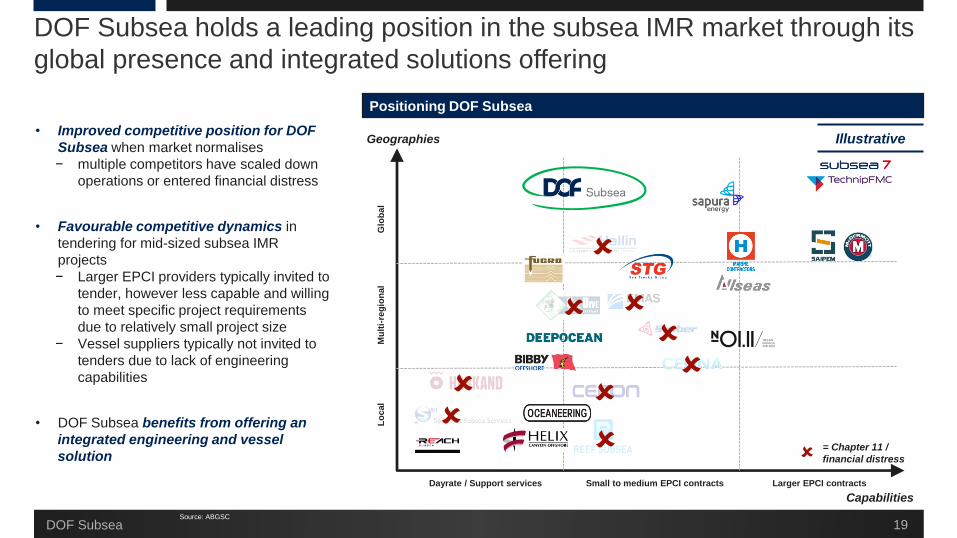
DOF Subsea holds a leading position in the subsea IMR market through its
global presence and integrated solutions offering
19
Positioning DOF Subsea
• Improved competitive position for DOF
Subsea when market normalises
− multiple competitors have scaled down
operations or entered financial distress
• Favourable competitive dynamics in
tendering for mid-sized subsea IMR
projects
− Larger EPCI providers typically invited to
tender, however less capable and willing
to meet specific project requirements
due to relatively small project size
− Vessel suppliers typically not invited to
tenders due to lack of engineering
capabilities
• DOF Subsea benefits from offering an
integrated engineering and vessel
solution
Lo
cal
Mu
lti-
reg
ion
al
Glo
ba
l
Dayrate / Support services Small to medium EPCI contracts Larger EPCI contracts
Source: ABGSC
= Chapter 11 /
financial distress
Geographies
Capabilities
Illustrative
DOF Subsea
DOF ASA – Q2 presentation 2017
No change in guidance for 2017 (MNOK 2 400 – MNOK 2 800)
New vessels added to the fleet from 2nd half 2017
Strong back-log for 2nd half 2017 (70%)
Two remaining newbuild to be delivered in 2018 and 2019 are committed on firm
contracts
Markets continues to be challenging
Outlook
20
Thank youPresented by
Mons Aase - CEO
Hilde Drønen - CFO
DOF ASA – Q2 presentation 2017
DISCLAIMER
This presentation by DOF ASA designed to provide a high level overview of aspects of the operations of the DOF ASA Group.
The material set out in the presentation is current as at 23 August 2017.
This presentation contains forward-looking statements relating to operations of the DOF ASA Group that are based on management’s owncurrent expectations, estimates and projections about matters relevant to DOF ASA‘s future financial performance. Words such as “likely”,“aims”, “looking forward”, “potential”, “anticipates”, “expects”, “predicts”, “plans”, “targets”, “believes” and “estimates” and similarexpressions are intended to identify forward-looking statements.
References in the presentation to assumptions, estimates and outcomes and forward-looking statements about assumptions, estimatesand outcomes, which are based on internal business data and external sources, are uncertain given the nature of the industry, businessrisks, and other factors. Also, they may be affected by internal and external factors that may have a material effect on future businessperformance and results.
No assurance or guarantee is, or should be taken to be, given in relation to the future business performance or results of the DOF ASAGroup or the likelihood that the assumptions, estimates or outcomes will be achieved.
While management has taken every effort to ensure the accuracy of the material in the presentation, the presentation is provided forinformation only. DOF ASA , its officers and management exclude and disclaim any liability in respect of anything done in reliance on thepresentation.
All forward-looking statements made in this presentation are based on information presently available to management and DOF ASAassumes no obligation to update any forward looking- statements. Nothing in this presentation constitutes investment advice and thispresentation shall not constitute an offer to sell or the solicitation of any offer to buy any securities or otherwise engage in any investmentactivity.
You should make your own enquiries and take your own advice (including financial and legal advice) before making an investment in thecompany's shares or in making a decision to hold or sell your shares.
22