Embed Size (px)
Citation preview

Quality Assurance Project Plan
Newaukum River Monitoring of the
Effectiveness of Best Management
Practices (BMPs) for Sediment and
Nutrient Reduction
January 2018 (revised March 2019)
Publication No. 18-03-101

Publication Information
Each study conducted by the Washington State Department of Ecology (Ecology) must have an
approved Quality Assurance Project Plan (QAPP). The plan describes the objectives of the study
and the procedures to be followed to achieve those objectives. After completing the study,
Ecology will post the final report of the study to the Internet.
This Quality Assurance Project Plan is available on Ecology’s website at
https://fortress.wa.gov/ecy/publications/SummaryPages/1803101.html
Data for this project will be available on Ecology’s Environmental Information Management
(EIM) website: https://www.ecology.wa.gov/Research-Data/Data-resources/Environmental-
Information-Management-database. Search on Study ID WHM_EFF3 and WHM_EFF3_P.
Ecology’s Activity Tracker Code for this study is 17-007.
Author and Contact Information
Scott Collyard, Paul Anderson, Niamh O’Rourke, and Jenny Wolfe
P.O. Box 47600
Environmental Assessment Program
Washington State Department of Ecology
Olympia, WA 98504-7710
Communications Consultant: phone 360-407-6834.
Washington State Department of Ecology – https://ecology.wa.gov
Location of Ecology Office Phone
Headquarters, Lacey 360-407-6000
Northwest Regional Office, Bellevue 425-649-7000
Southwest Regional Office, Lacey 360-407-6300
Central Regional Office, Union Gap 509-575-2490
Eastern Regional Office, Spokane 509-329-3400
Any use of product or firm names in this publication is for descriptive purposes only and
does not imply endorsement by the author or the Department of Ecology.
Accommodation Requests: To request ADA accommodation including materials in a format
for the visually impaired, call Ecology at 360-407-6834. People with impaired hearing may call
Washington Relay Service at 711. People with speech disability may call TTY at 877-833-6341.

QAPP: Newaukum River - Page 1 – January 2018
Template Version 1.0, 10/07/2016
Quality Assurance Project Plan
Newaukum River Monitoring of the
Effectiveness of Best Management Practices (BMPs)
for Sediment and Nutrient Reduction
January 2018
Approved by:
Signature: Date:
Scott Collyard, Author and Project Manager, EAP
Signature: Date:
Jenny Wolfe / Principal Investigator, EAP
Signature: Date:
Stacy Polkowske, Author’s Unit Supervisor, EAP
Signature: Date:
Jessica Archer, Author’s Section Manager, EAP
Signature: Date:
Dale Norton, Section Manager for Project Study Area, EAP
Signature: Date:
Alan Rue, Director, Manchester Environmental Laboratory
Signature: Date:
Bill Kammin, Ecology Quality Assurance Officer
Signatures are not available on the Internet version.
WQP: Water Quality Program
EAP: Environmental Assessment Program

QAPP: Newaukum River - Page 2 – January 2018
Template Version 1.0, 10/07/2016
1.0 Table of Contents Page
2.0 Abstract ....................................................................................................................6
3.0 Background ..............................................................................................................7 3.1 Introduction and problem statement ............................................................7 3.2 Study area and surroundings ........................................................................8
Land use .....................................................................................................10 Hydrology ..................................................................................................11
3.2.1 History of study area .....................................................................13 3.2.2 Summary of previous studies and existing data ............................14 3.2.3 Implementation assessment ...........................................................18 3.2.3 Parameters of interest and potential sources .................................20 3.2.4 Regulatory criteria or standards ....................................................21
4.0 Project Description.................................................................................................22 Scale of Monitoring ...............................................................................................23 4.1 Project goals ...............................................................................................25
4.2 Project objectives .......................................................................................25 4.3 Information needed and sources ................................................................26
4.4 Tasks required ............................................................................................27 4.5 Systematic planning process used ..............................................................27
5.0 Organization and Schedule ....................................................................................28
5.1 Key individuals and their responsibilities ..................................................28
5.2 Special training and certifications ..............................................................29 5.3 Organization chart ......................................................................................29
5.4 Proposed project schedule ..........................................................................29
5.5 Budget and funding ....................................................................................31
6.0 Quality Objectives .................................................................................................33 6.1 Data quality objectives ...............................................................................33
6.2 Measurement quality objectives ................................................................33 6.2.1 Targets for precision, bias, and sensitivity........................................33
6.2.2 Targets for comparability, representativeness, and completeness ....37 6.3 Model quality objectives ............................................................................39
7.0 Study Design ..........................................................................................................40
7.1 Study boundaries ........................................................................................40 7.2 Field data collection ...................................................................................41
7.2.1 Sampling locations and frequency .................................................41 7.2.2 Field parameters and laboratory analytes to be measured..............43
7.3 Modeling and analysis design ....................................................................44
8.0 Field Procedures.....................................................................................................44 8.1 Invasive species evaluation ........................................................................44 8.2 Measurement and sampling procedures .....................................................44 8.3 Containers, preservation methods, and holding times ...............................44 8.4 Equipment decontamination ......................................................................46 8.5 Sample ID ..................................................................................................46

QAPP: Newaukum River - Page 3 – January 2018
Template Version 1.0, 10/07/2016
8.6 Chain-of-custody........................................................................................46
8.7 Field log requirements ...............................................................................46
8.8 Other activities ...........................................................................................47
9.0 Laboratory Procedures ...........................................................................................48
9.1 Lab procedures table ..................................................................................48 9.2 Sample preparation method(s) ...................................................................49 9.3 Special method requirements .....................................................................49 9.4 Laboratories accredited for methods ..........................................................49
10.0 Quality Control Procedures....................................................................................50
Field Quality Control Procedures ..........................................................................50
10.1 Table of field and laboratory quality control .............................................51 10.2 Corrective action processes ........................................................................52
11.0 Management Procedures ........................................................................................53
11.1 Data recording and reporting requirements ...............................................53
11.2 Laboratory data package requirements ......................................................53 11.3 Electronic transfer requirements ................................................................53
11.4 EIM/STORET data upload procedures ......................................................53 11.5 Model and statistical information management .........................................53
12.0 Audits and Reports .................................................................................................54 12.1 Field, laboratory, and other audits .............................................................54
12.2 Responsible personnel ...............................................................................54 12.3 Frequency and distribution of reports ........................................................54 12.4 Responsibility for reports ...........................................................................54
13.0 Data Verification ....................................................................................................55
13.1 Field data verification, requirements, and responsibilities ........................55
13.1.1 In-field data verification ................................................................55
13.1.2 Post-field work data verification ....................................................55 13.1.3 Raw sensor data verification and adjustment .................................55 13.1.4 EIM data verification .....................................................................56
13.2 Verification of laboratory data ...................................................................57 13.3 Validation requirements, if necessary ........................................................57
13.4 Model quality assessment ..........................................................................57
14.0 Data Quality (Usability) Assessment .....................................................................58
14.1 Process for determining if project objectives were met .............................58 14.2 Treatment of non-detects ...........................................................................58 14.3 Data analysis and presentation methods ....................................................58 14.4 Sampling design evaluation .......................................................................59
14.5 Documentation of assessment ....................................................................59
15.0 References ..............................................................................................................59
16.0 Appendices .............................................................................................................64 Appendix A. Glossaries, Acronyms, and Abbreviations ......................................65 Appendix B. Watershed Health Assessment Metrics ...........................................73

QAPP: Newaukum River - Page 4 – January 2018
Template Version 1.0, 10/07/2016
List of Figures and Tables Page
Figures
Figure 1. Newaukum River watershed study area. .............................................................9
Figure 2. Land use classification in the Newaukum River watershed, 2016. ...................10
Figure 3. Land use classification changes in the Newaukum River watershed, 2006-
2016. ..................................................................................................................11
Figure 4. USGS stream-gage monthly flow statistics for Newaukum River near
mouth, 1929-2017. .............................................................................................12
Figure 5. Annual peak flow from USGS (120205000) gage station at Newaukum
River near Chehalis, 1942-2013. .......................................................................12
Figure 6. Map showing the locations and types of past monitoring in the Newaukum
River watershed. ................................................................................................15
Figure 7. Summary of relevant water quality data from the Newaukum River
watershed, 1960 to present. ...............................................................................16
Figure 8. Overview of projects implemented in the Newaukum River watershed,
1990-2017. .........................................................................................................19
Figure 9. Sampling activities within a watershed health assessment reach. .....................24
Figure 10. Map of the Newaukum River watershed with the proposed water quality
and watershed health sampling locations. .......................................................40
Figure 11. Road crossings in the Newaukum River watershed and potential bracketed
sampling locations. ..........................................................................................41
Tables
Table 1. Results of a limiting factors analysis and proposed actions for the Newaukum
River watershed. ...................................................................................................8
Table 2. Water quality impairments for the Newaukum River watershed. ......................13
Table 3. Newaukum River water quality, habitat, and biological data in EIM. ...............14
Table 4. Results of Watershed Health Monitoring (WHM) downstream and upstream
of culvert on the Middle Fork Newaukum River. ..............................................18
Table 5. Additional sources of Newaukum River water quality data. ..............................20
Table 6. Permitted point sources in the Newaukum River watershed. .............................21
Table 7. Applicable water quality criteria for the Newaukum River watershed. .............22
Table 8. Core water quality sampling locations, scale of assessment, sampling
schedule, and expected time for water quality response to implementation
actions .................................................................................................................23

QAPP: Newaukum River - Page 5 – January 2018
Template Version 1.0, 10/07/2016
Table 9. Organization of project staff and responsibilities. ..............................................28
Table 10. Proposed schedule for completing field and laboratory work, data entry into
EIM, and reports for 2017-2019 study period. .................................................30
Table 11. Proposed long-term monitoring schedule for completing project. ...................30
Table 12. Annual project budget. ......................................................................................31
Table 13. Field procedure MQOs and field equipment information. ...............................35
Table 14. MQOs for inorganic/general chemistry lab procedures. ...................................36
Table 15. MQOs for multi-parameter sondes. ..................................................................37
Table 16. Sampling locations for the monitoring study. ...................................................42
Table 17. Parameters to be collected during the study. ....................................................43
Table 18. Sample containers, preservation, and holding times. ........................................45
Table 19. Measurement methods (laboratory). .................................................................48
Table 20. Rating of accuracy for field instruments...........................................................51
Table 21. Quality control samples, types, and frequency. ................................................52
QAPP: Newaukum River - Page 6 – January 2018
Template Version 1.0, 10/07/2016
2.0 Abstract
The Newaukum River, a tributary to the Chehalis River, and its tributaries are on the 2012
303(d) list of impaired waterbodies due to violations of one or more water quality criteria. Total
maximum daily loads (TMDLs) for bacteria, temperature, and dissolved oxygen were established
between 1994 and 2000. In 2004, a water quality cleanup plan recommended actions to increase
stream shade and reduce sediment loads in order to improve water quality in the Newaukum
River watershed.
Recently, the Newaukum River became an area of focus within the Chehalis Basin for
implementing actions to restore and protect salmon habitat. Many of the factors identified as
limiting or threatening salmon populations within the watershed are also responsible for water
quality impairments identified in the TMDL. It is expected that projects and actions
implemented over the next several years to support salmon will also improve water quality over
time. To support both efforts, the Washington State Department of Ecology (Ecology) will
conduct a long-term effectiveness monitoring study that will provide (1) monitoring support to
both TMDL water-cleanup and salmon-recovery efforts in order to assess the effectiveness of
actions and (2) information to assist stakeholders in adaptively managing water cleanup and
recovery plans.
This Quality Assurance Project Plan describes a long-term monitoring strategy which leverages
existing statewide programs implemented by Ecology to support the federal Clean Water Act and
the Endangered Species Act listings in Washington State. Specifically, overall effectiveness of
restoration actions will be assessed by measuring nutrient and sediment loading in relation to
implementation actions over time. In addition, biological and instream habitat measures will be
used to assess the effectiveness of a selection of individual projects at the site scale. Additional
water quality data will also be collected to provide assessment of 303(d) listed areas and identify
locations which need additional improvement. This information is intended to provide a holistic
assessment of watershed health in relation to restoration or water cleanup activities over time that
is consistent with other data being collected statewide.

QAPP: Newaukum River - Page 7 – January 2018
Template Version 1.0, 10/07/2016
3.0 Background
3.1 Introduction and problem statement
The Newaukum River is a major tributary to the Chehalis River and provides important habitat
for salmonid spawning and rearing. Within this Newaukum River drainage area, there are no
Endangered Species Act (ESA) listed species of salmon (CRBFA, 2010); however, water quality
and habitat issues are threatening the health of all aquatic species. In 2004, Ecology developed a
plan to address high temperatures and low dissolved oxygen in the Newaukum River watershed
(Rountry 2004). The plan recommended increasing shade and decreasing width to depth ratios
to improve water quality. Although numerous projects have been implemented throughout the
Chehalis River watershed, relatively few have been implemented with the Newaukum River
watershed.
In a recent effort to improve water quality and restore and protect instream and riparian habitat
conditions in a systematic way, the Newaukum River watershed has been designated a focus area
by the Chehalis Basin Lead Entity (Chehalis Basin Lead Entity, 2016). As part of this effort
stakeholders are coordinating work to identify, prioritize and implement restoration activities
which support clean water and salmon recovery in the watershed. Ecology’s nonpoint source
pollution reduction program staff, Lewis County Conservation District, Lewis County Public
Works, Coast Salmon Partnership, the Wild Fish Conservancy, Natural Resources Conservation
Service, Washington Department of Fish and Wildlife, US Fish and Wildlife Service, Chehalis
Tribe, and the Fish Barrier Removal Board are all actively working cooperatively to support
restoration and monitoring activities in the watershed.
Because of the current focus on the watershed, Ecology’s Environmental Assessment Program
will conduct a long term monitoring study. The intent of this study is to provide support to
stakeholders by assessing the effectiveness of restoration actions on improving water quality and
habitat conditions in the watershed at multiple scales. This Quality Assurance Project Plan
(QAPP) outlines data collection efforts that will be used for this assessment.
The Chehalis River Basin Salmon Habitat Restoration and Preservation Strategy for WRIA 22
and 23 outlines the most pressing limiting factors identified within the subbasins of the Chehalis
(Grays Harbor Lead Entity Work Group, 2011). Restoration and protection actions within the
Newaukum River watershed (a subbasin) will largely be driven by addressing limiting factors
which were identified as impacting salmonid populations. The limiting factors and actions to
remedy causes were used to develop the study design for this project (Table 1).

QAPP: Newaukum River - Page 8 – January 2018
Template Version 1.0, 10/07/2016
Table 1. Results of a limiting factors analysis and proposed actions for the Newaukum River
watershed.
Limiting
Factor Cause Actions
Expected Instream
Response
Riparian
Conversion of forestland to
agriculture and rural residences
Bank vegetation loss
Riparian Fencing
Protection of sensitive areas
Revegetate open riparian areas
Sediment and nutrient
reductions
Decreased temperature
Fish
Passage Undersized culverts and or fish
barriers
Replace barrier culverts
Remove dams where feasible
Increase in LWD
Reduced scouring of
channel
Sediment
Likely due to the livestock
access, high road densities,
landslides caused by roads, and
high amounts of bank erosion
Remove roads on steep
geologically sensitive areas.
Riparian fencing
Revegetate open riparian areas
Natural bank stabilization
Sediment and nutrient
reductions
Decreased temperature
Water
Quality/
Quantity
Over allocation or misuse of
water resources
Loss of wetlands
Poor riparian canopy conditions
Revegetate open riparian areas
Assess water withdrawals
Restoration and protection of
wetlands
Sediment, temperature
and nutrient
reductions.
Changes in flow
regime
Large
Woody
Debris
Instream wood removal
Undersized culverts
Lack of recruitment
Installation of log jams
Riparian fencing
Revegetate open riparian areas
Increase in LWD
Floodplain
Riprap, parallel roads limit
meandering
Lack of wetlands restricts flood
water storage capacity
Removal of beaver
Reconnect, enhance, and/or
restore potential off-channel,
floodplain, and wetland habitat
Remove hard armoring (riprap)
Changes in flow
metrics
Sediment and nutrient
reductions
3.2 Study area and surroundings
The Newaukum River watershed drains 158 square miles and is located within the Upper
Chehalis watershed (Figure 1). The mainstem Newaukum River enters the Chehalis River near
river mile (RM) 75.2, south of the City of Chehalis. It has a low gradient and runs through
farmland. The mainstem Newaukum River is formed by the convergence of the North Fork
Newaukum River and the South Fork Newaukum River.
The North Fork Newaukum River originates in steep hills and then flows into a broad
valley in its lower reaches. Stream gradients are steep in the upper North Fork watershed. In
the lower ten miles of the river the stream gradient is moderate. The middle and upper
watershed are dominated by private timber lands. Land use in the lower watershed is
primarily agriculture. Larger tributaries to the North Fork include the Middle Fork
Newaukum River and also Lucas, Bear, Mitchell, and Johns Fork Creeks.
The Middle Fork Newaukum River is the shortest of the three forks and originates near the
base of the Cascade Mountain Range. Gradients are moderate, and the stream flows through
mostly open and hilly terrain. The Middle Fork joins the North Fork approximately one mile
upstream of the North and South Fork confluence. Land use in the watershed is primarily
timber lands.

QAPP: Newaukum River - Page 9 – January 2018
Template Version 1.0, 10/07/2016
The South Fork Newaukum River originates in the steep terrain of the Cascade Mountain
Range. In the upper watershed, the stream gradients are steep and the channel is narrow. As
the river heads into Newaukum Lake, the terrain begins to broaden and the gradient
moderates. Land use in the upper watershed is dominated by forestry, while land use in the
lower watershed is a mix of agriculture, residential, and forestry.
The City of Napavine is the only incorporated city within the Newaukum River watershed.
Napavine has a population of 1988 and covers approximately 4.8 square miles across the upper
mainstem of the Newaukum River. Portions of the City of Chehalis and its urban growth cross
the watershed boundary near the mainstem Newaukum River. The second largest community
within the watershed is the unincorporated town of Onalaska, located near the South Fork
Newaukum River.
Figure 1. Newaukum River watershed study area.

QAPP: Newaukum River - Page 10 – January 2018
Template Version 1.0, 10/07/2016
Land use
Figure 2 shows land use in the Newaukum River watershed. Greater than 70% of the land use in
the watershed is classified as resource production (timber harvest). Residential and agricultural
land uses make up 12% and 10% respectively. Resource production is dominant in the upper
watershed while residential and agricultural parcels are along the stream corridors of the
waterways.
A comparison of land use classification between 2006 and 2016 indicate major land use
categories which increased in land coverage (acres) within the watershed, including resource
production and residential parcels. Major land categories that decreased in size over time
included agriculture and undeveloped properties (Figure 3). The total number of parcels in the
watershed increased from 6066 in 2006 to 6389 in 2016. Most of the increase was from the sub-
division of undeveloped land into residential.
Figure 2. Land use classification in the Newaukum River watershed, 2016.

QAPP: Newaukum River - Page 11 – January 2018
Template Version 1.0, 10/07/2016
Figure 3. Land use classification changes in the Newaukum River watershed, 2006-2016.
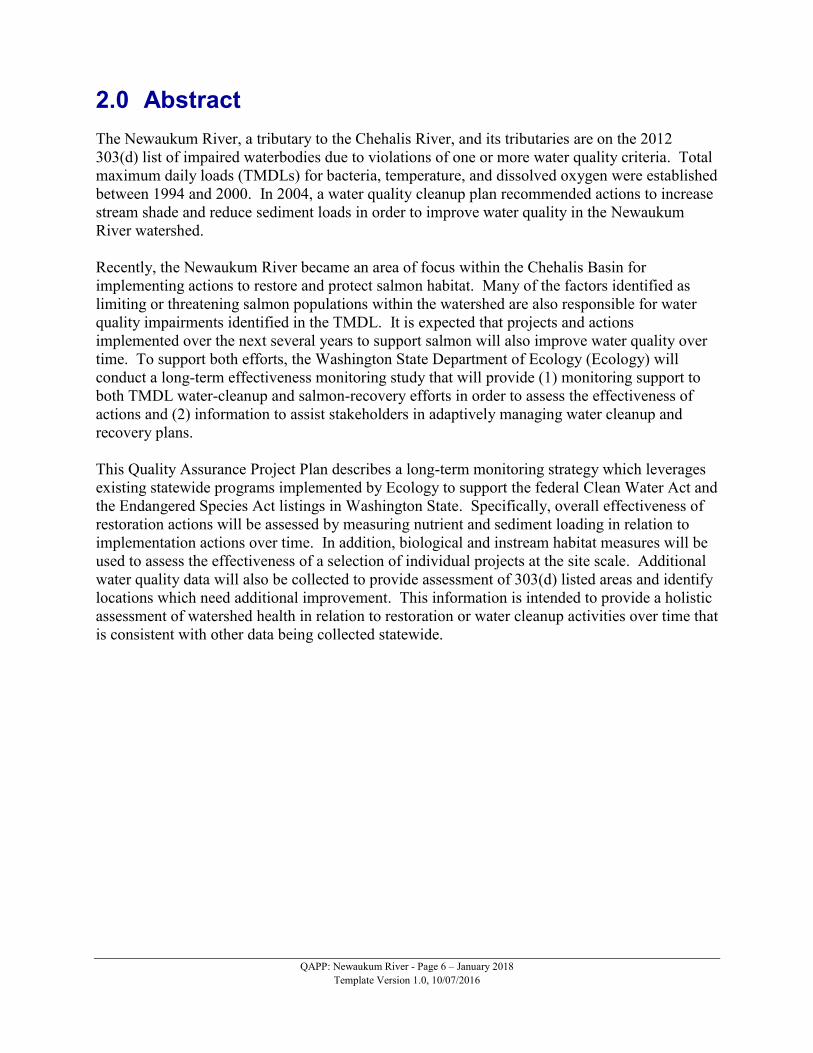
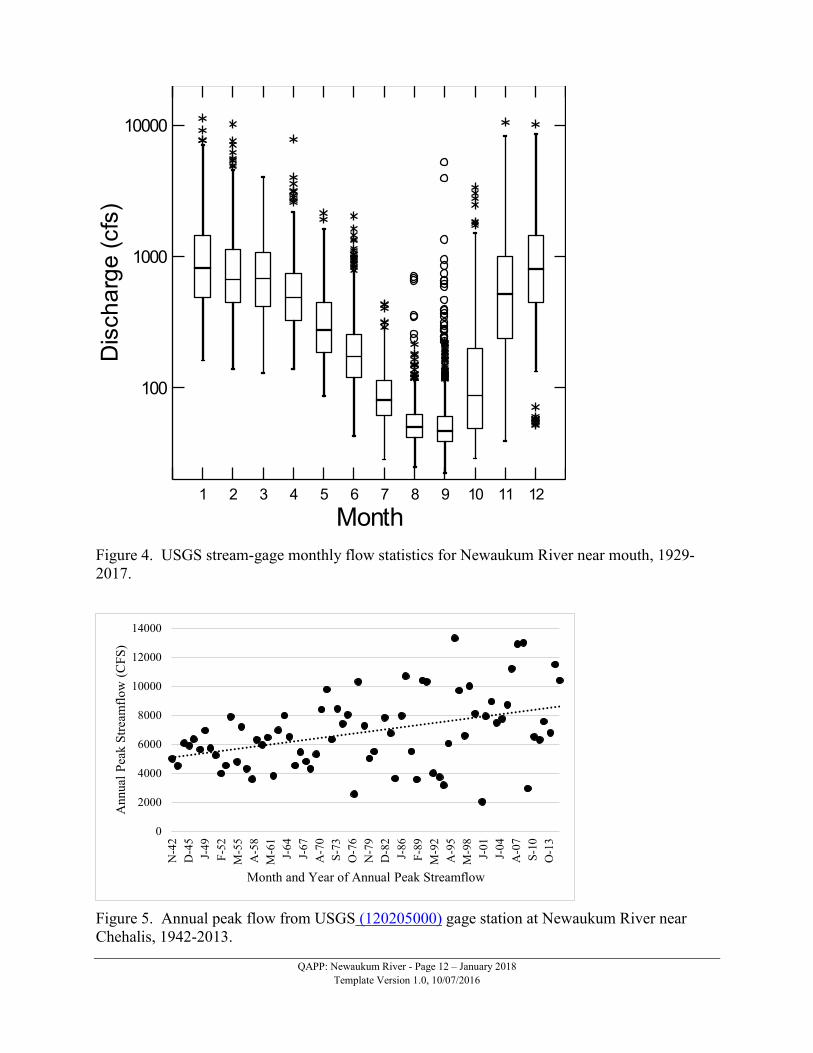
Hydrology
Figure 4 illustrates stream discharge patterns of the Newaukum River 4.1 miles upstream of the
confluence with the Chehalis River (USGS 120205000). Flows typically begin increasing in
October-November before peaking in January. Flows drop quickly from April through July and
reach the yearly low-flow period in September. Discharges in excess of 10,000 cfs occasionally
occur. Figure 5 illustrates annual peak flow at this station from 1929-2015. Best fit line
indicates peak flows have been increasing over time in addition to becoming more variable.
-4000 -3000 -2000 -1000 0 1000 2000 3000 4000 5000
Agriculture
Undeveloped
Not Classified
Retail Trade
Transportation and Utilities
Manufacturing
Open Space
Culture and Recreation
Residential
Resource Production
Change in acres (2006-2016)
QAPP: Newaukum River - Page 12 – January 2018
Template Version 1.0, 10/07/2016
Figure 4. USGS stream-gage monthly flow statistics for Newaukum River near mouth, 1929-
2017.
Figure 5. Annual peak flow from USGS (120205000) gage station at Newaukum River near
Chehalis, 1942-2013.
1 2 3 4 5 6 7 8 9 10 11 12
Month
100
1000
10000D
isch
arg
e (
cfs
)
0
2000
4000
6000
8000
10000
12000
14000
N-4
2
D-4
5
J-4
9
F-5
2
M-5
5
A-5
8
M-6
1
J-6
4
J-6
7
A-7
0
S-7
3
O-7
6
N-7
9
D-8
2
J-8
6
F-8
9
M-9
2
A-9
5
M-9
8
J-0
1
J-0
4
A-0
7
S-1
0
O-1
3
Annual
Pea
k S
trea
mfl
ow
(C
FS
)
Month and Year of Annual Peak Streamflow

QAPP: Newaukum River - Page 13 – January 2018
Template Version 1.0, 10/07/2016
3.2.1 History of study area
Many of the streams in the Upper Chehalis watershed are of great significance to the commercial
and sport fishing industry locally and up and down the western coast of North America (Wildrick
et al., 1995). The Newaukum River is a part of the Upper Chehalis watershed and is an
important stream for anadromous fish (Verd and Wilson, 2002). Spring Chinook, fall Chinook,
Coho, winter steelhead, cutthroat trout and other native char all use the watershed for spawning,
rearing, and summer habitat (Wildrick et al., 1995).
As early as 1975, it was documented that low summer flows coupled with habitat degradation
were factors limiting the size of fish populations (Phinney and Bucknell, 1975). Further study in
the early 1990s showed that common degradations in the Upper Chehalis watershed included:
canopy and vegetation loss along stream banks, bank erosion by livestock and vehicles, barriers
and logjams, excessive stream siltation, logging impacts, and poor water quality (Wampler et al.,
1993).
Water quality degradations in the Upper Chehalis watershed were documented in a Total
Maximum Daily Load (TMDL) study in 1994 (Pickett, 1994) as well as a separate TMDL study
for dissolved oxygen in 2000 (Jennings and Pickett, 2000). Currently, the mainstem and three
tributaries of the Newaukum River have at least one water quality impairment. There are
multiple water quality impairments on several sections of the South Fork Newaukum River.
Table 2 summarizes the water quality impairments for the Newaukum River watershed.
Table 2. Water quality impairments for the Newaukum River watershed.
Waterbody
Name Parameter
Impairment
Category
Mainstem
Newaukum
Temperature 4a
Dissolved Oxygen 4a
Bacteria 4a
South Fork
Newaukum
Temperature 4a
Dissolved Oxygen 4a
Bacteria 2
Temperature 2
Middle Fork
Newaukum
Dissolved Oxygen 4a
Bacteria 2
pH 2
Temperature 2
North Fork
Newaukum
Temperature 4a
Dissolved Oxygen 4a
Carlisle Lake Bacteria 5
Total Phosphorus 5
Category 2 – water of concern
Category 4a – impaired with a water quality improvement project in place
Category 5 – impaired with no water quality improvement project in place

QAPP: Newaukum River - Page 14 – January 2018
Template Version 1.0, 10/07/2016
3.2.2 Summary of previous studies and existing data
No studies specific to the Newaukum River watershed were identified with Ecology’s
Environmental Information Management System (EIM). Instead, studies were focused on the
Upper Chehalis River watershed or the greater Chehalis River basin (Table 3).
Table 3. Newaukum River water quality, habitat, and biological data in EIM.
EIM
Study ID Description
Collection
Date
AMS001-2 Statewide River and Stream Ambient Monitoring 2015-present
AMS001B Statewide River and Stream Ambient Monitoring 1960-1977
AMS001D Statewide River and Stream Ambient Monitoring 1992-1997
BEDI0001 Chehalis River Basin Water Quality Screening Study 1991
fwbenth1 Ecology's Freshwater Ambient Biological Assessment Program 1998
G0200280 Chehalis River Council Volunteer Monitoring Project 2002-2006
G0700116 WRIA 22-23 Water Quality Monitoring 2006-2009
GAP0001 GAP Chehalis 2003
PPIC0002 Upper Chehalis River TMDL 1991-1992
SWROSWDB Ecology’s Southwest Regional Office Surface Water 1986-1991
WHM_WAM0 Ecology's Watershed Health Monitoring 2010, 2014

QAPP: Newaukum River - Page 15 – January 2018
Template Version 1.0, 10/07/2016
Relevant sample parameters from each monitoring effort are summarized in the preceding
sections. Figure 6 shows the monitoring locations, and Figure 7 summarizes data described from
the preceding sections. Flow data collected by the United States Geological Survey (USGS) in
the watershed is presented in Figures 4 and 5.
Figure 6. Map showing the locations and types of past monitoring in the Newaukum River
watershed.

QAPP: Newaukum River - Page 16 – January 2018
Template Version 1.0, 10/07/2016
Figure 7. Summary of relevant water quality data from the Newaukum River watershed, 1960 to
present.

QAPP: Newaukum River - Page 17 – January 2018
Template Version 1.0, 10/07/2016
3.2.2.1 Ecology Ambient Water Quality Monitoring Program
Ecology has a statewide network of stations that are sampled monthly for conventional water
quality parameters. There are 62 long-term stations and 20 rotating stations. Monitoring occurs
on a water year basis which runs from October 1 to September 30. The Newaukum River does
not have any long-term stations but had two short-term stations. One station was located at the
mouth of the mainstem Newaukum River in water year 1993. The other station was located on
the mainstem Newaukum River at LaBree Road in water year 1997. This station has recently
been reinstated and now has continuous and discrete data collection.
3.2.2.1 Chehalis River Basin Water Quality Screening Study
To better manage the Chehalis basin, the Chehalis Tribe in collaboration with Grays Harbor
Community College studied water quality in the Chehalis River and its tributaries. Beginning in
2006, monthly water samples were collected from 86 sites. These samples were analyzed for
dissolved oxygen, pH, temperature, turbidity, and fecal coliform. Sampling continued through
2009. Data from the Newaukum River show that overall pH falls within water quality criteria.
The exception is the mainstem Newaukum River at Shorey Road. Dissolved oxygen, turbidity,
and water temperature data show degraded water quality at all sampling locations when
compared to water quality criteria. As is described in Green et al. (2009), impacts to water
quality were seasonal and parameter specific.
3.2.2.2 Upper Chehalis River TMDL
Data collected from the Newaukum River by the Upper Chehalis River Dry Season TMDL show
degraded water quality in the Newaukum River watershed. Dissolved oxygen and temperature
do not meet water quality standards. The study indicates that the temperature problems in the
Newaukum River watershed are due to loss of riparian canopy vegetation as documented by the
USFWS (Pickett, 1994). To improve temperature and riparian canopy the TMDL recommends
implementing best management practices (BMPs) to restore riparian vegetation.
3.2.2.3 Washington State Department of Ecology's Watershed Health Monitoring Program
The Watershed Health Monitoring (WHM) program samples streams and rivers across the state
to provide a consistent representation of habitat and biological conditions. WHM is designed to
answer questions about the overall conditions within watersheds and how conditions change over
time (Hartman, 2015). Although the WHM program uses a statistical survey design to answer
larger scale (Salmon Recovery Regions) questions of watershed health, the methodologies are
applicable to smaller scale, targeted designs. This allows data to be compared and assessed with
a larger statewide and national network of similar data collection efforts.
3.3.2.4 Watershed Health Assessment of Culvert Replacement
In 2016, Ecology conducted watershed health assessments on the Middle Fork Newaukum River
above and below the site of a culvert replacement project. The primary goal of this project was
to assess the practicality of using WHM methods to detect impacts from undersized culverts on
instream habitat and biological conditions. A secondary goal of this assessment was to use the
same methods to measure habitat and biological changes after replacement of the culvert with a
bridge over time. In total, 11 habitat metrics used to describe bed load/stability, channel

QAPP: Newaukum River - Page 18 – January 2018
Template Version 1.0, 10/07/2016
scouring, entrenchment, canopy cover and pool area were identified. Downstream and upstream
results and expected change to downstream metrics over time are presented in Table 4.
These metrics provide the basis for development of the long-term monitoring of selected BMPs
described in this QAPP.
A full list of available WHM metrics are presented in Appendix B.
Table 4. Results of Watershed Health Monitoring (WHM) downstream and upstream of culvert
on the Middle Fork Newaukum River.
Metric Units Downstream Upstream Expected
Downstream Change
Mean Substrate size mm 33.1 12.9 Decrease
Mean Embeddedness % 35 27 Decrease
Large Woody Debris (m3/100m) 0.011 0.007 Unknown
Bed Stability - -1.9 -2.1 Increase
Canopy Cover % 58 51 None
Sinuosity - 1.26 1.39 Increase
Slope % 2 1.7 Decrease
With to Depth cm 32.6 25.0 Decrease
Bankfull Area m2 4107 2948 Decrease
Pool Area m2 27 17 Decrease
Pool Depth cm 74.4 49.6 Decrease
3.2.3 Implementation assessment
Each year in Washington State, several federal, state, and local agencies award millions of
dollars in grants and loans to protect, restore, or enhance degraded waterbodies. Although many
of these projects are not implemented as the result of the TMDL process, most contribute to net
improvements in water quality and watershed health. When effectiveness assessments are made
at a watershed scale, all such actions should be taken into account in order to provide a
comprehensive assessment. With a more holistic view of actions, stakeholders from various
groups may more easily become aligned with similar goals and make informed decisions
regarding future projects.
Washington’s Recreation and Conservation Office (RCO) provides funding for building
community recreational opportunities and for protecting and restoring wild areas. Grants and
projects implemented within this framework are tracked via two databases. RCO’s Project
Information System (PRISM) tracks both recreational and restoration grants. Habitat Work
Schedule system is a mapping and project tracking tool that allows community-based salmon
recovery programs (Lead Entity Program) to share habitat protection and restoration projects
with funders and the public. Both databases provided summaries and outcomes of grant projects
at a site scale.
QAPP: Newaukum River - Page 19 – January 2018
Template Version 1.0, 10/07/2016
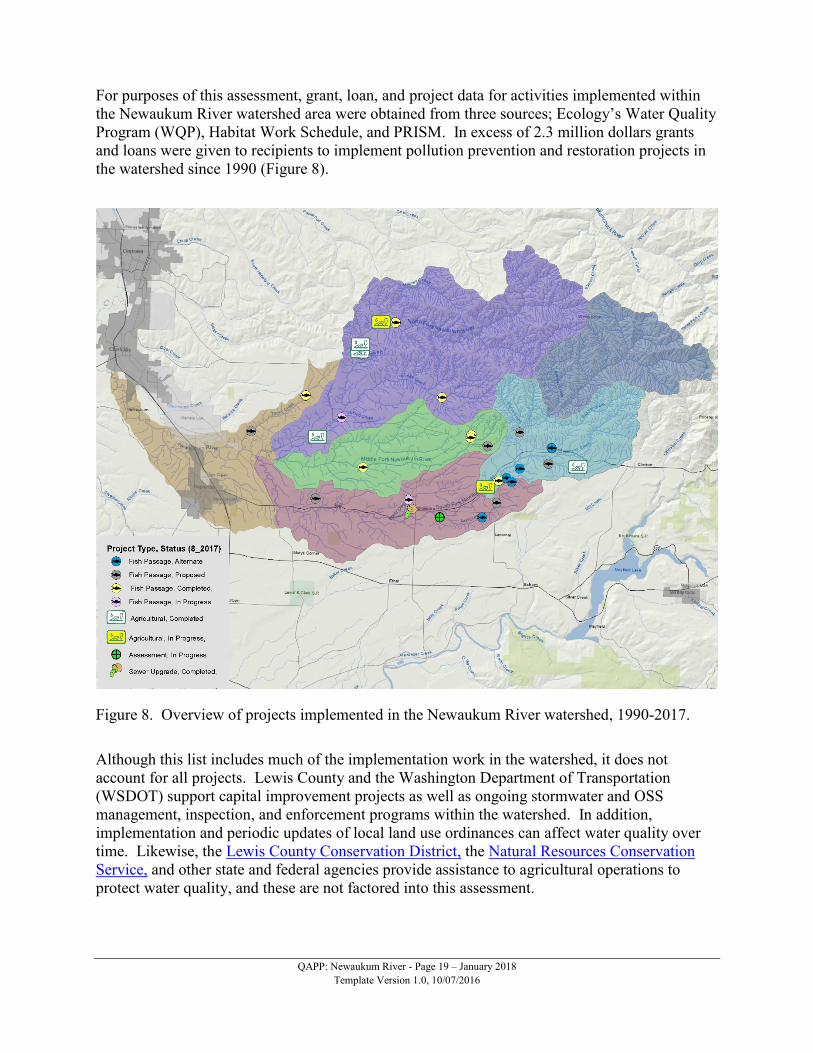
For purposes of this assessment, grant, loan, and project data for activities implemented within
the Newaukum River watershed area were obtained from three sources; Ecology’s Water Quality
Program (WQP), Habitat Work Schedule, and PRISM. In excess of 2.3 million dollars grants
and loans were given to recipients to implement pollution prevention and restoration projects in
the watershed since 1990 (Figure 8).
Figure 8. Overview of projects implemented in the Newaukum River watershed, 1990-2017.
Although this list includes much of the implementation work in the watershed, it does not
account for all projects. Lewis County and the Washington Department of Transportation
(WSDOT) support capital improvement projects as well as ongoing stormwater and OSS
management, inspection, and enforcement programs within the watershed. In addition,
implementation and periodic updates of local land use ordinances can affect water quality over
time. Likewise, the Lewis County Conservation District, the Natural Resources Conservation
Service, and other state and federal agencies provide assistance to agricultural operations to
protect water quality, and these are not factored into this assessment.

QAPP: Newaukum River - Page 20 – January 2018
Template Version 1.0, 10/07/2016
Table 5. Additional sources of Newaukum River water quality data.
Site ID Description Period of
Record Parameters
USGS 12024000 Newaukum River near Chehalis 1929-present Discharge
USGS 12024400 NF Newaukum River above Bear Creek 1997-present Flow, precipitation
USGS 12025000 SF Newaukum River near Onalaska 1998-present Flow, precipitation
3.2.3 Parameters of interest and potential sources
3.2.3.1 Parameters of interest
This study addresses all 303(d) parameters in the Newaukum watershed (Table 2). Past studies
within the Chehalis River basin indicate that these parameters are generally driven by excess
nutrients, sediment, high temperature and low streamflows (Pickett, 1994). Because of this, the
study will also focus on using temperature, discharge, sediment and nutrient loading as the
primary indicators of water quality improvements. Monitoring of these parameters will occur at
the watershed (Hydrologic Unit Code (HUC) 10) and sub-watershed scale (HUC 12). In
addition, biological and habitat data obtained from watershed health surveys will be used to
assess changes over time at the project scale as appropriate.
3.2.3.2 Nonpoint sources
Nonpoint sources of pollutants contributing to water quality issues in the watershed may include
diffuse sources of nutrients, sediment, heat and lack of flow. Excess nutrients and lack of
riparian vegetation along reaches can cause excessive growth of aquatic plants and algae. This
may lead to low dissolved oxygen levels in the summer months.
Residential and urban areas supply nutrients via overland run-off and can have bare riparian
areas. Fertilizers, on-site septic systems, and pets or small hobby farms can be sources of
nutrients as well as sediment. Riprap used to prevent channel migration and flooding to
residential areas is not uncommon in this watershed and can cause downstream scouring of the
stream channel.
Timber management and farming practices are potential sources of nutrients and sediment.
Much of the watershed is designated as private timberlands which are managed through
implementation of Washington forest and fish laws to meet federal Clean Water Act
requirements. The majority of the farming in the Newaukum includes hay production and
commercial tree farming. Also, there are five dairies operating in the watershed and several
small livestock operations.
3.2.3.3 Point Sources
The Newaukum River watershed has one permitted wastewater facility. Residences and
businesses in the town of Onalaska rely on a small facility for wastewater treatment which
discharges into the South Fork of the Newaukum River at river mile 20.1. The facility is
operated by the Lewis County water district (Table 6).

QAPP: Newaukum River - Page 21 – January 2018
Template Version 1.0, 10/07/2016
The City of Napavine operates its own wastewater collection system; however, wastewater is
processed by a regional wastewater treatment plant in Chehalis.
Stormwater in the watershed is covered under the City of Chehalis Municipal Stormwater Permit
which regulates pollutants carried to waterbodies within the urban growth areas by stormwater.
The Washington State Department of Transportation (WSDOT) also has a stormwater permit
which covers runoff from state highways and associated facilities. Table 6 lists all current
permitted point sources in the Newaukum River watershed.
Table 6. Permitted point sources in the Newaukum River watershed.
Facility Permit
Number
Permit
Type City Waterbody
Lewis County Water District 2 WA0024546 Municipal Onalaska SF Newaukum
Butteville Lumber Company WAR010301 Industrial Onalaska SF Newaukum
Onalaska Wood Energy WAR303014 Industrial Onalaska SF Newaukum
WSDOT SR 508 SF Newaukum Bridge WAR304722 Construction Onalaska SF Newaukum
Lewis County PW Union Vegetation WAG501487 Sand and Gravel Chehalis Newaukum
3.2.4 Regulatory criteria or standards
The Clean Water Act (CWA) established a process to identify and clean up polluted waters. The
CWA requires each state to develop and maintain water quality standards that protect, restore,
and preserve water quality. Water quality standards consist of:
A set of designated uses for all water bodies, such as salmon spawning, swimming, and fish
and shellfish harvesting.
Numeric and narrative criteria to achieve those uses (Table 7).
An antidegradation policy to protect high-quality waters that surpass these conditions.
Ecology has established designated uses for the mainstem Newaukum River and all three of its
forks: North, Middle, and South. These are established to protect aquatic life, recreation, water
supply, and other miscellaneous uses. The Newaukum River and all three forks are designated
for primary contact recreation, core summer habitat, and char spawning and rearing (WAC 173-
201A-600).

QAPP: Newaukum River - Page 22 – January 2018
Template Version 1.0, 10/07/2016
Table 7. Applicable water quality criteria for the Newaukum River watershed.
Parameter Criteria
Bacteria
Fecal coliform organism levels must not exceed a geometric mean value of 100 colonies /100 mL, with
not more than 10 percent of all samples (or any single sample when less than ten sample points exist)
obtained for calculating the geometric mean value exceeding 200 colonies /100 mL.
Dissolved
Oxygen
Dissolved oxygen (DO) concentration will not fall below 9.5 mg/L more than once every ten years on
average. When a water body's DO is lower than 9.5 mg/L (or within 0.2 mg/L) and that condition is
due to natural conditions, then human actions considered cumulatively may not cause the DO of that
water body to decrease more than 0.2 mg/L
Temperature
7-day average of the daily maximum temperature (7-DADMax) will not exceed 12°C for char spawning
and rearing and 16°C for core summer salmonid habitat more than once every ten years on average.
When a water body's temperature is warmer than the criteria (or within 0.3°C) and that condition is due
to natural conditions, then human actions considered cumulatively may not cause the 7-DADMax
temperature of that water body to increase more than 0.3°C.
Turbidity
Turbidity shall not exceed: 5 nephelometric turbidity units (NTU) over background when the
background is 50 NTU or less or a 10 percent increase in turbidity when the background is more than
50 NTU.
pH pH shall be within the range of 6.5 to 8.5 with a human-caused variation within above range of less
than 0.5 units.
4.0 Project Description
This Quality Assurance Project Plan (QAPP) serves jointly with the following documents:
Programmatic QAPP for Water Quality Impairment Studies (McCarthy and Mathieu, 2017).
Standard Operating Procedures for the Collection, Processing, and Analysis of Stream
Samples (Ward, 2016).
Guidance for Effectiveness Monitoring of Total Maximum Daily Loads in Surface Water
(Collyard and Onwumere, 2013).
QAPP: Ambient Biological Monitoring in Rivers and Stream: Benthic Macroinvertebrates
and Periphyton (Merritt, 2009).
The above documents address elements that apply to all water quality impairment projects, while
this QAPP addresses elements specific to this project.
Several best management practice (BMP) projects designed to enhance fish passage, stabilize
river banks, and improve riparian habitat have been selected for implementation. While the fish
passage BMPs are intended to enhance fish passage by removing barriers, they will ultimately
help to restore sediment and nutrient transport as well as improve the overall quality of the water
and aquatic habitat. Riparian habitat improvement and bank stabilization BMPs will reduce bank
erosion and improve riparian vegetation, which will reduce fine sediment concentrations and
lower water temperature in streams (Medina et al., 2005; Roni et al., 2008; Lawrence et al.,
2013; Bassett, 2009).

QAPP: Newaukum River - Page 23 – January 2018
Template Version 1.0, 10/07/2016
The intention of this study is to collect data to help assess the collective effectiveness of best
management practices (BMPs) on improving water quality and habitat conditions in the
watershed at multiple scales over time (Table 8). Many, if not all of actions identified in both the
TMDL (Pickett, 1999) and the Chehalis Basin Salmon Habitat Restoration and Preservation
Strategy for WRIA 22 & 23 (Grays Harbor County Lead Entity Habitat Work Group, 2011)
would address sediment and nutrient inputs into surface waters as well as improve temperature.
Thus the primary focus of this study will be to use discharge, sediment, and nutrient data to
estimate loading in the Newaukum River mainstem and its three main tributaries (South Fork,
Middle Fork and North Fork) over time.
A secondary focus of this study is to assess the effectiveness of a subset of individual BMPs
implemented during the study period using standard habitat and biological assessments. In
addition, a combination of bracketed discrete and continuous water quality monitoring will occur
to assess 303(d) listed parameters and help identify or eliminate potential sources of pollutants.
Table 8. Core water quality sampling locations, scale of assessment, sampling schedule, and
expected time for water quality response to implementation actions.
Location Scale Anticipated Period
of Record
Expected
Response Time
Mainstem Newaukum near mouth HUC 10 2017-2027 Decades
North Fork Newaukum HUC 12 2017, 2022, 2027 Years-Decades
Middle Fork Newaukum HUC 12 2017, 2022, 2027 Years-Decades
South Fork Newaukum HUC 12 2017, 2022, 2027 Years-Decades
Middle Fork Newaukum Site Scale 2016, 2017, 2022, 2027 Years
Scale of Monitoring
Watershed (HUC 10)
Beginning in 2017, nutrient and sediment loading be will estimated continuously at the mouth of
the mainstem Newaukum River. These data will be considered baseline and used to assess long-
term changes over time at a watershed scale. Data collection at Ecology’s ambient and
continuous water quality monitoring station (23B070) will be used for this assessment.
Implementation actions categorized and summarized at this scale will be compared with water
quality data over time.
Sub-watershed (HUC12)
Short-term sediment and nutrient loads will be estimated near the mouths of the North, Middle,
and South Forks of the Newaukum using a combination of continuous stage, turbidity, and
monthly grab samples. Effectiveness of BMPs at these scales will be assessed by estimating load
reductions over time in relation to cumulative implementation of projects above each sampling
location over time.

QAPP: Newaukum River - Page 24 – January 2018
Template Version 1.0, 10/07/2016
Project scale monitoring
To assess changes in habitat and biological conditions, watershed health assessments will be
conducted over time for a select number of BMPs. These assessments will be conducted by
Ecology’s Watershed Health Monitoring (WHM) program. An overview of sampling activities
by station is provided in Figure 9. Monitoring will begin before the BMPs are implemented and
continue over a 10-year period. Currently, two culvert-replacement projects within the Middle
Fork Newaukum River have been identified and will be assessed. Monitoring will occur either
upstream, downstream or within BMP treatment areas in order to capture the overall change. If
opportunity arises within the study period, additional BMPs will be considered for this type of
assessment.
Figure 9. Sampling activities within a watershed health assessment reach.

QAPP: Newaukum River - Page 25 – January 2018
Template Version 1.0, 10/07/2016
4.1 Project goals
The goals of this study are to:
Assess the collective effectiveness of BMPs at a watershed (HUC 10) and sub-watershed
scale (HUC 12) at reducing sediment and nutrient loading over time.
Assess the effectiveness of a sub-set of individual BMPs at the site scale using water quality,
habitat and biological parameters over time.
Identify and quantify sources of pollutants to help focus implementation activities in the
watershed.
Determine if water quality standards are being met in the watershed.
4.2 Project objectives
The goals of this study will be met by achieving the following project objectives:
Watershed Scale
Using existing USGS flow (12025000), Ecology ambient and continuous monitoring
(23B070) on the Newaukum River near the mouth (Labree Rd) to develop continuous
estimates of sediment and nutrient loading.
Supplement existing ambient monitoring during the wet season and high-flow events.
Establish one watershed health assessment site upstream of Labree Road.
Catalog and map BMP activities and changes in land use throughout the watershed using
geographic information systems (GIS) technology.
Provide assessment of 303(d) listed parameters at this location.
Compare and evaluate changes in water quality and habitat in relation to BMP
implementation.
Sub-Watershed Scale
Collect continuous stage and turbidity sites at North Fork Newaukum River near mouth
(North Fork Rd), Middle Fork Newaukum River near mouth (off Rosebrook Rd), and the
South Fork Newaukum near mouth (North Fork Road).
Establish ambient monitoring stations at these locations.
Establish one watershed health assessment site upstream of water quality sampling locations.
Catalog and map BMP activities and land use changes throughout the sub-watershed using
geographic information systems (GIS) technology.
Provide assessment of 303(d) listed parameters at these locations.
Compare and evaluate changes in water quality and habitat in relation to BMP
implementation.
Site Scale
Establish monitoring stations above and below two culvert replacement projects on the
Middle Fork Newaukum River prior to replacement.

QAPP: Newaukum River - Page 26 – January 2018
Template Version 1.0, 10/07/2016
Evaluate changes in habitat, biological condition, and fish populations over time above and
below culvert replacement.
Compare and evaluate changes in water quality and habitat in relation to BMP
implementation.
Additional Sampling
Conduct periodic discrete or continuous bracketed sampling of fecal coliform, nutrients,
dissolved oxygen, pH, optical brighteners, and temperature within the watershed to assess
water quality standards and identify or eliminate potential sources of pollution. Optical
brighteners, contained in many laundry detergents, will be used to help identify potential
sources of pollution. Because household plumbing systems mix effluent from washing
machines and toilets together, optical brighteners are associated with human sewage in septic
systems and wastewater treatment plants (Hartel, 2008).
Collect periphyton biomass and use nutrient, metal, and nitrogen isotope measurements at
bracketed sampling locations to identify potential sources of nutrient inputs. Periphyton
readily accumulate both nutrients and metals in aquatic systems and can be indicative of
surrounding land-use practices. Soil amendments such as fertilizers and chelates, which are
commonly used in agricultural areas, can create acidic soils and promote the release of
metals such as aluminum, iron, and phosphates as well as other compounds from the soils
into aquatic systems (Yang, 2013).
If the opportunity arises, additional site-scale BMP projects may be assessed during this study.
Study of these BMP projects will be dealt with through addenda to this QAPP.
4.3 Information needed and sources
Nutrient, organic carbon, and sediment sample data – to be collected by Ecology’s Watershed
Health & Effectiveness Monitoring Unit (WHEMU) during this project.
Continuous dissolved oxygen, pH, temperature, and turbidity data at the mouth of the
Newaukum River mainstem – to be collected by Ecology’s Freshwater Monitoring Unit.
Continuous streamflow data – three USGS gaging stations will be used.
Continuous gauge height, temperature, and turbidity data collected near the mouths of NF,
MF, and SF of the Newaukum River – to be collected by WHEMU during this project.
Habitat and biological data – to be collected by WHEMU during this project.
Meteorology data – daily precipitation will be obtained from the National Weather Service
stations at the Chehalis Airport and USGS gaging stations.
Stream Shade data – will be assessed by WHEMU with ArcGIS data.
Periphyton biomass data – to be collected by WHEMU during this project.
Implementation information of water quality and habitat improvement projects – to be
collected though the Newaukum River watershed group, habitat work schedule, Washington
State Fish Passage Map Application, and Ecology’s grant management system.

QAPP: Newaukum River - Page 27 – January 2018
Template Version 1.0, 10/07/2016
4.4 Tasks required
A general overview of the tasks required to meet the project goals for this effort are discussed
below and in Section 4.2. Additional detail on the technical approach and field and lab tasks are
described in Section 7.
The following tasks will be performed to support the goals and objectives of this study:
Collect surface water samples, flow measurements, continuous stage, turbidity and
temperature from NF, MF and SF Newaukum River near the confluences with the
Newaukum River main stem.
Perform watershed health assessments one time per year in conjunction with tributary water
quality and flow monitoring.
Document locations of BMPs, changes in land uses, and land use practices during the study
period.
4.5 Systematic planning process used
This QAPP, in combination with the Programmatic QAPP for Water Quality Impairment
Studies, represent the systematic planning process.

QAPP: Newaukum River - Page 28 – January 2018
Template Version 1.0, 10/07/2016
5.0 Organization and Schedule
5.1 Key individuals and their responsibilities
Table 9 lists the key people involved with this project and their responsibilities.
Table 9. Organization of project staff and responsibilities.
Staff (All EAP except client)
Title Responsibilities
Jessica Archer
SCS
Phone: 360-407-6698
Client and Section
Manager for the
Project Manager
Clarifies scope of the project. Provides internal review of the
QAPP and approves the final QAPP.
Scott Collyard
WHEM Unit, SCS
Phone: 360-407-6455
Project Manager
Writes the QAPP. Conducts QA review of data, analyzes and
interprets data, and enters data into EIM. Writes the mid-term
monitoring report and final report. Reviews web content and
story maps.
Jennifer Wolfe
WHEM Unit, SCS
Phone: 360-407-6672
Principal
Investigator
Co-authors technical sections of the mid-term monitoring report
and final report. Creates web content and story maps related to
monitoring data and final report. Collects field samples and
records field information. Assists project manager with project
duties as needed.
Niamh O’Rourke
WHEM Unit, SCS
Phone: 360-407-7614
Field Lead Collects samples and records field information. Oversees field
sampling and transportation of samples to the laboratory.
Stacy Polkowske
WHEM Unit, SCS
Phone: 360-407-6730
Unit Supervisor for
the Project Manager
Reviews and approves the project scope and budget, and tracks
progress. Provides internal review of the QAPP, approves the
final QAPP, and project associated reports.
Dale Norton
Western Operations Section
Phone: 360-407-6596
Section Manager for
the Study Area Reviews the draft QAPP and approves the final QAPP.
Alan Rue
Manchester Environmental
Laboratory
Phone: 360-871-8801
Director Reviews and approves the final QAPP.
William R. Kammin
Phone: 360-407-6964
Ecology Quality
Assurance
Officer
Reviews and approves the draft QAPP and the final QAPP.
EAP: Environmental Assessment Program
EIM: Environmental Information Management database
QAPP: Quality Assurance Project Plan
SCS: Statewide Coordination Section
WHEM: Watershed Health and Effectiveness Monitoring

QAPP: Newaukum River - Page 29 – January 2018
Template Version 1.0, 10/07/2016
5.2 Special training and certifications
Key personnel involved in the collection of biological and habitat data and interpretation of
results have extensive experience in similar efforts.
5.3 Organization chart
Table 9 lists the individuals involved in this project. All are employees of Ecology unless
otherwise noted.
5.4 Proposed project schedule
This study is a multiyear study and is expected to be conducted over a ten year period (2017-
2027). Water quality monitoring at the Newaukum River mainstem location is expected to be
monitored yearly by Ecology Freshwater Monitoring Unit while other sampling is expected to
occur every 5 years by Ecology Watershed Health & Effectiveness Unit. Field work described in
proposed project schedule is for 2017-2018 however it is expected to be duplicated in subsequent
years.
Field work will be performed during the following time periods:
Water quality sampling – July 2017 through September 2018.
Dry season bracketed water quality sampling – August through September 2017.
Wet season bracketed water quality sampling – December 2017 through May 2018.
Watershed health assessments – September 2017.
Table 10 shows the schedule for completing field and laboratory work, data entry into EIM, and
reports. Field, laboratory, and EIM dates are for the 2017 study year. The final report due dates
are at the end of the 10-year study period. Table 10 shows annual deliverables over the 10-year
study period.
Scheduling future work will be addressed in addenda to this QAPP prior to each proposed
sampling event (Table 11). Interim results will be reported through development of a project
web page and data summary reports. A final report is expected to be produced following
completion of the final study.

QAPP: Newaukum River - Page 30 – January 2018
Template Version 1.0, 10/07/2016
Table 10. Proposed schedule for completing field and laboratory work, data entry into EIM,
and reports for 2017-2019 study period.
Field and laboratory work Due date Lead staff
Field work completed Oct 2018 Jenny Wolfe
Post sample processing Jan 2019
Laboratory analyses completed Feb 2019
Taxonomic analyses completed May 2019
Environmental Information System (EIM) database
EIM Study ID WHM_EFF3
Product Due date Lead staff
EIM data loaded Jan 2019 TBD
EIM data entry review Feb 2019 TBD
EIM complete Mar 2019 TBD
Taxonomic data loaded (EIM) May 2019 TBD
Taxonomic data entry review (EIM) June 2019 Chad Larson
Taxonomic data complete (EIM) July 2019 TBD
Final report
Author lead / Support staff Scott Collyard
Schedule
Draft due to supervisor Dec 2028
Draft due to client/peer reviewer Jan 2029
Draft due to external reviewer(s) Feb 2029
Final (all reviews done) due to
publications coordinator Mar 2029
Final report, story map update due
on web April 2029
TBD – to be determined
Table 11. Proposed long-term monitoring schedule for completing project.
Sampling period Station
2017-2029 Ambient and continuous water quality monitoring of mainstem Newaukum River
2017, 2022, 2027 North Fork (NF) Newaukum River
2017, 2022, 2027 South Fork (SF) Newaukum River
2017, 2022, 2027 Middle Fork Newaukum River

QAPP: Newaukum River - Page 31 – January 2018
Template Version 1.0, 10/07/2016
5.5 Budget and funding
The estimated annual laboratory budget and number of lab samples shown in Table 12 are based
on the proposed schedule in Tables 9 and 10. Efforts will be made to keep the submitted number
of samples within the estimate; however, this is only an estimate.
Table 12. Annual project budget.
Parameter /Analysis Sites Surveys Field
Replicates
Total
Samples
Cost per
Sample
($)
Subtotal
($)
Ambient Monitoring
Ammonia-N 4 22 3 91 $15 1365
Nitrate + nitrite-N 4 22 3 91 $15 1365
Total persulfate nitrogen 4 22 3 91 $20 1820
Orthophosphate 4 22 3 91 $20 1820
Phosphorus, total 4 22 3 91 $20 1820
Total suspended solids 4 22 3 91 $15 1365
Suspended sediment
concentration 4 22 3 91 $20 1820
Fecal coliform (MF) 4 22 3 91 $25 2275
E. coli (MF) 4 22 3 91 $25 2275
Total $15925
Storm-Event Ambient Monitoring
Persulfate nitrogen, total 4 5 1 21 $20 420
Phosphorus, total 4 5 1 21 $20 420
Total suspended solids 4 10 1 41 $15 615
Suspended sediment
concentration 4 10 1 41 $20 820
Total $2275
Watershed Health Assessment
Periphyton taxonomy 10 1 1 11 $310 $3,410
Macroinvertebrate taxonomy 10 1 1 11 $300 $3,300
Sediment metals1 10 1 1 11 $193 $2,123
Sediment total organic carbon 10 1 1 11 $50 $550
Persulfate nitrogen, total 10 1 1 11 $20 $220
Phosphorus, total 10 1 1 11 $20 $220
Chloride 10 1 1 11 $15 $165
Turbidity 10 1 1 11 $15 $165
Total suspended solids 10 1 1 11 $15 $165
Chlorophyll a, periphyton 10 1 1 11 $50 $550
Ash free dry weight, periphyton 10 1 1 11 $25 $275
Total solids, periphyton 10 1 1 11 $30 $330
Total metals1 , periphyton 10 1 1 11 $193 $2,123

QAPP: Newaukum River - Page 32 – January 2018
Template Version 1.0, 10/07/2016
Parameter /Analysis Sites Surveys Field
Replicates
Total
Samples
Cost per
Sample
($)
Subtotal
($)
Percent total organic carbon,
periphyton 10 1 1 11 $50 $550
Total carbon/nitrogen,
periphyton 10 1 1 11 $50 $550
15N, 13C periphyton 10 1 1 11 $58 $638
Total $15,334
Periphyton Source Assessment
Ash free dry weight, periphyton 10 1 1 11 $25 $275
Total solids, periphyton 10 1 1 11 $12 $132
Total metals1, periphyton 10 1 1 11 $193 $2123
Percent total organic carbon,
periphyton 10 1 1 11 $46 $506
Total carbon/nitrogen,
periphyton 10 1 1 11 $50 $550
15N, 13C periphyton 10 1 1 11 $58 $638
Total $8184
Carlisle Lake
Chlorophyll-a 3 4 1 15 $50 $750
Orthophosphate 3 4 1 15 $20 $300
Total Phosphorus 3 4 1 15 $20 $300
Fecal coliform 3 4 1 15 $25 $375
$1725
Water Quality Source Assessment
Fecal coliform (MF) 10 12 2 120 $25 $3000
E. coli (MF) 10 12 2 120 $25 $3000
Total $6000
Study Total $49443
¹ Al, As, Cd, Cu, Fe, K, Mn, Mg, TP, Pb, Zn

QAPP: Newaukum River - Page 33 – January 2018
Template Version 1.0, 10/07/2016
6.0 Quality Objectives
Quality objectives are statements of the precision, bias, and lower reporting limits necessary to
meet project objectives. Precision and bias together express data accuracy. Other considerations
of quality objectives include representativeness, completeness, and comparability. Quality
objectives apply equally to laboratory and field data collected by Ecology, to data used in this
study collected by entities external to Ecology, and to other analysis methods used in this study
6.1 Data quality objectives
The main data quality objective (DQO) for this project is to collect water quality, biological, and
habitat data in the Newaukum River watershed using standard methods that meet the
measurement quality objectives (MQOs) for this project.
6.2 Measurement quality objectives
MQOs are performance or acceptance criteria for individual data quality indicators, including
precision, bias, sensitivity, completeness, comparability, and representativeness. Field sampling
procedures and laboratory analyses inherently have associated uncertainty, which results in data
variability. Together precision and bias express data accuracy. MQOs apply equally to
laboratory and field data collected by Ecology, to data collected by entities external to Ecology,
and to other analysis methods used in water quality impairment studies (Lombard and Kirchmer,
2004).
Table 13 presents MQOs for precision and bias, as well as the manufacturer’s stated accuracy,
resolution, and range for field equipment that will be used in water quality impairment studies.
These MQOs are intended for use in both major and minor work projects; however, a project-
specific QAPP may set different MQOs, provided a justification for the deviation is given.
6.2.1 Targets for precision, bias, and sensitivity
6.2.1.1 Precision
Precision is a measure of the variability in the results of replicate measurements due to random
error. Precision is usually assessed by analyzing duplicate field measurements or lab samples.
Random error is imparted by the variation in concentrations of samples from the environment as
well as other introduced sources of variation (e.g., field and laboratory procedures). Field
sampling precision will be addressed by submitting replicate samples or collecting replicate
measurements.
Precision is also influenced by random error. Potential sources of random error include:
Field sampling procedures.
Handling, transporting, and preparing samples for shipment to the laboratory.
Obtaining a subsample from the field sample for analysis.
Preparing the sample for analysis at the laboratory.
Analysis of the sample (including data handling errors).

QAPP: Newaukum River - Page 34 – January 2018
Template Version 1.0, 10/07/2016
Precision for replicates will be expressed as percent relative standard deviation (% RSD) or
absolute error and assessed following the MQOs outlined in Tables 13, 14, and 15. The targets
for precision of field duplicates are based on historical performance by Ecology’s Manchester
Environmental Laboratory (MEL) for environmental samples taken around the state by EAP
(Mathieu, 2006).
6.2.1.2 Bias
Bias is the difference between the population mean and the true value of the parameter being
measured. Bias is usually addressed by calibrating field and laboratory instruments and also by
analyzing lab control samples, matrix spikes, and standard reference materials. MQOs for
laboratory QC samples (e.g., blanks, check standards, and spiked samples) presented in Tables
13 and 14 will provide a measure of any bias affecting sampling and analytical procedures. Bias
affecting measurement procedures can be inferred from the results of QC procedures. MEL will
assess bias in the laboratory through the use of blanks (further explained in Section 8.3). Field
staff will minimize bias in field measurements and samples by strictly following equipment
calibration, measurement, sampling, and handling protocols (explained in detail in Section 10.0).
Potential sources of field and laboratory bias in samples include the following sampling
procedures:
Instability of samples during transportation, storage, or processing.
Interference and matrix effects.
Inability to measure all forms of the parameter of interest.
Calibration problems with the measurement system or instruments.
Contamination of equipment, reagents, or containers.
Table 13 presents the bias data quality objectives for multi-parameter sonde data for instrument
QC checks. First the sonde measurement data are reviewed, adjusted (if applicable), and
finalized (see Data Verification section). The median residual of the finalized data and QC
checks is then calculated and compared to the MQOs listed in Table 13.
6.2.1.3 Sensitivity
Sensitivity is a measure of the capability of a lab or field method used to detect a substance. It is
commonly described as detection limit.
For field data, the sensitivity of the instrument is described by its range, accuracy, and resolution.
This is usually reported for each instrument by the manufacturer. Examples of this information
are provided in Table 13.
For laboratory data in a regulatory context, the method detection limit (MDL) is usually used to
describe sensitivity. The method reporting limit (MRL) is usually a little higher than the MDL
and can also be used. The MRL for each laboratory method is reported in Tables 14 and 15, and
MDLs are presented in Section 9.1 (Table 11). The reporting limits of the methods listed in
Tables 14 and 15 are appropriate for the expected range of results and the required level of
sensitivity to meet the objectives outlined in this QAPP.

QAPP: Newaukum River - Page 35 – January 2018
Template Version 1.0, 10/07/2016
Table 13. Field procedure MQOs and field equipment information.
Parameter Equipment/
Method
Bias
(median)
Precision-
Field
Duplicates
(median)
Equipment Information
Equipment
Accuracy
Equipment
Resolution
Equipment
Range
Expected
Range
Water Quality Measurements
Water
Temperature
YSI Exo ±0.2 ◦C ± 0.01 ◦C ± 0.001 ◦C -5 to 50 ◦C 0-30◦C
FTS DTS-12 ±0.2 ◦C ± 0.1 ◦C ± 0.01 ◦C 0 to + 40 ◦C 0-30◦C
YST Pro DSS ± 0.2°C ± 0.2°C 0.1°C -5 - 70°C 0-30°C
Conductivity/ Specific
Conductance
YSI EXO
5% RSD
±0.5% of reading
or .001 mS/cm,
w.i.ga
0.0001 to
0.1 mS/cm (range
dependent)c
0 - 200 mS/cm
20 – 1,000 uS/cm
YSI ProDSS
±0.5% of reading
or 0.001 mS/cm, w.i.g. a
0.001 mS/cm
(range
dependent)c
0 - 200
mS/cm
20 – 1,000
uS/cm
Dissolved
Oxygen
YSI EXO 5 % RSD
0 to 20 mg/L: ±0.1
mg/L or 1% of
reading, w.i.g. a
0.01 mg/La 0 - 50 mg/L 0.1 - 15 mg/L
YSI ProDSS ± 0.1 mg/L or ± 1% of reading,
w.i.ga
0.01 or 0.1 mg/L (auto-
scaling)a
0 - 50 mg/L 0.1 - 15 mg/L
pH YSI EXO
± 0.2 s.u. ± 0.2 s.u. 0.01 s.u. 0 - 14 s.u. 6 - 10 s.u. YSI ProDSS
Optical
Brighteners
Turner Designs
Cyclops 7 10% RSD NA 0.1 ppb
0.6-2,500
ppb 0-500 ppb
Turbidity
FTS DTS-12
15% RSD
0 – 399.99 NTU: ±
2% of reading 400 – 1600 NTU: ±4%
of reading
0.01 NTU 0 – 1,600 NTU
0 - 500 NTU ProDSS
Flow Measurements
Streamflow SOP EAP024 n/a 10% RSD n/a n/a n/a 0.01-2,000 cfs
Velocity SonTek® FlowTracker®
Handheld ADV®
<0.03 ft/s 5% RSD ±1% 0.01 ft/s 0.0003 - 13
ft/s 0.01 - 10 ft/s
Water Level Hobo barometric
pressure transducer n/a 5% RSD ±1.5 mbar at 25°C 0.1 mbar
660 –
1,070 mbar
660 – 1,070
mbar
w.i.g., whichever is greater
a for 1,4 m cables; for 10 m, 20 m, 30 m cables: ±2.0% of the reading or 1.0 uS/cm, whichever is greater b for 1,4 m cables; for 20 m cable: ±1% of reading or 0.001 mS/cm, whichever is greater
c range dependent, for 0.501 to 50.00 mS/cm: 0.01; for 50.01 to 200 mS/cm: 0.1

QAPP: Newaukum River - Page 36 – January 2018
Template Version 1.0, 10/07/2016
Table 14. MQOs for inorganic/general chemistry lab procedures.
Analysis
Method Lower
Reporting and
(Detection) Limita
Method
Blank
Limit
Calibration
Standards/
Blanks
Lab Control
Samples
(% recovery
limits)
Matrix Spikes
or SRMs
(% recovery
limits)
Precision –
Lab Duplicates
(RPD)
Precision –
Field Duplicates
(median)b
Water Quality
Dissolved Oxygen -
Winkler 0.1 mg/L n/a n/a n/a n/a ± 0.2 mg/L ± 0.2 mg/L
Chlorophyll a - water
0.05 ug/L <½ RLc n/a n/a n/a 20% 20% RSD
Ammonia 0.01 (0.002)
mg/L <MDLc
ICV/CCV:
90-110%
ICB/CCB: <MDLc
80-120% 75-125% 20% 10% RSD
Nitrate + nitrite-N 0.01 (0.005)
mg/L <½ RLc
Chloride 0.1 (0.03) mg/L
<MDLc
90-110% 75-125% 20% 5% RSD
Persulfate Nitrogen,
Total
0.025 (0.013)
mg/L
80-120%
75-125% 20% 10% RSD Orthophosphate 0.003 (0.0013)
mg/L
Phosphorus, total 0.005 (0.0024)
mg/L
<2.2x
MDLc
Total suspended
solids 1 mg/L
±0.3 mg/Ld
n/a
n/a 5%b 15% RSD
Suspended sediment
concentration 1 mg/L
n/a
90-110% n/a n/a 15% RSD
Fecal coliform - MF 1 cfu/100 mL <MDL n/a n/a n/a 40% RPD
50% of replicate
pairs
< 20% RSD 90% of replicate
pairs <50% RSDb
E. coli – MPN or
MF 1 cfu/100 mL <MDL n/a n/a n/a 40% RPD
50% of replicate
pairs < 20% RSD
90% of replicate
pairs <50% RSDb
Periphyton Tissue
Ash Free Dry Weight
10 mg/kg DW ±0.6 mg/Ld
<MDLce n/a n/a n/a
20% 50% RSD
Chl a 0.05 mg/L
<½ RLc
n/a n/a n/a
Total Solids 1 mg/L n/a n/a n/a 5%b 15% RSD
Total Metals a
ICV/CCV:
90-110% ICB/CCB:
<MDLc
80-120% 75-125% 20% 10% RSD
Total Carbon/Nitrogen
10 mg/kg DW
<2.2x MDLc
ICV/CCV:
90-110% ICB/CCB:
<MDLc
90-110% 90-110% 20% 50% RSD
15N, 13Cf a na na 90-110% n/a 20% 10% RSD
RL: reporting limit; MDL: method detection limit; CCV: Continuing Calibration Verification CCB: Continuing Calibration Blank; ICV: Initial Calibration Verification; ICB: Initial Calibration Blank
a reporting limit may vary depending on dilutions; detection limit in parentheses, no parentheses means MDL = lowest possible RL
b field duplicate results with a mean of less than or equal to 5x the reporting limit will be evaluated separately c or less than 10% of the lowest sample concentration for all samples in the batch
d filter blank
e reinstate blank f standard reference material (SRM) recovery, no matrix spikes preformed on this analyte

QAPP: Newaukum River - Page 37 – January 2018
Template Version 1.0, 10/07/2016
Table 15. MQOs for multi-parameter sondes.
Parameter Unit Accept Quality Reject
Dissolved Oxygen % Saturation ≤ ± 5% ≤ ± 5% ≤ ± 5%
mg/L ≤ ± 0.5 ≤ ± 0.5 ≤ ± 0.5
pH ≤ ± 0.5 ≤ ± 0.5 ≤ ± 0.5 ≤ ± 0.5
Specific Conductance uS/cm ≤ ± 10% ≤ ± 10% ≤ ± 10%
Water Temperature °C ≤ ± 0.2 > ± 0.2 and ≤ ± 0.8 > ± 0.8
Turbidity NTU ≤ ± 10% ≤ ± 10% ≤ ± 10%
Criteria expressed as a percentage of readings. For example, buffer = 100.2 uS/cm and Hydrolab = 98.7 uS/cm;
(100.2-98.7)/100.2 = 1.49% variation, which would fall into the acceptable data criteria of less than 5%.
* Turbidity use stand-alone probe (i.e., FTS DTS-12).
6.2.2 Targets for comparability, representativeness, and completeness
6.2.2.1 Comparability
To improve comparability to previously collected Ecology data, field staff will strictly follow
EAP protocols and adhere to data quality criteria. In addition, all field measurements will follow
approved EAP SOPs (see Table 9, Section 8.2).
Factors that influence comparability between studies can include the availability and extent of
previous data, training of field staff, field data-collection similarities including site locations,
duration, time of year and weather conditions, lab methods, SOPs, and sensitivity.
Ecology may compare data collected from the study to data collected by other entities or for
other projects, if:
Data were collected with approved QAPP(s) and functionally equivalent SOP(s), and also
accredited laboratories analyzed the data. The entity that collected the data is an organization
whose data are regularly used and is known to produce known and usable data (see Section
4.3),
Documentation such as QAPPs, SOPs, and data QC assessments are available to demonstrate
that the data are of known and usable quality, or
The minimum analytical sensitivity for the methods used is comparable to the detection and
reporting limits in this QAPP and is lower than applicable regulatory criteria.
6.2.2.2 Representativeness
Representativeness is mainly a function of individual study design. Each study is designed to collect
sufficient data, meet study-specific objectives, and assess spatial and temporal variability of the
measured parameters throughout the study area. Sampling locations and frequency are distributed
throughout the watershed or water body in a manner designed to meet study objectives.
Typically, a combination of continuous measurements, grab samples, spot measurements, and
historic data will be needed to represent the expected variability of spatial and temporal
conditions. These elements that influence data quality are addressed in greater detail in Study
Design (Section 7.0).

QAPP: Newaukum River - Page 38 – January 2018
Template Version 1.0, 10/07/2016
The ability for continuous monitoring equipment (such as temperature loggers or multi-
parameter sondes) to capture the representativeness of the river or stream’s characteristics at the
deployment location is assessed through recommended spot and check measurements.
For shallow or well-mixed rivers and streams:
o A transect of spot measurements may be taken across the width of the channel that
includes, at a minimum, a measurement at the desired deployment location, within
several feet of both banks, and in the thalweg (if different from the deployment location).
o Good reconnaissance of the deployment location (both in the field and with GIS/aerial
photography) to ensure there are no tributaries, outfalls, or groundwater seepage
immediately upstream. As a general rule, equipment should be deployed upstream of
bridge crossings to avoid influence from roadside drainage ditches and also upstream of
recreational wading/swimming.
For deeper or vertically-stratified rivers and streams:
o In addition to the above, vertical profiles of spot measurements should be made at the
deployment location and in the thalweg or deepest location nearby. At a minimum,
profile measurements should be taken just below the water surface, at the deployment
depth, and near the streambed, with measurements at other levels to provide a
representative profile.
6.2.2.3 Completeness
EPA has defined completeness as a measure of the amount of valid data needed to be obtained
from a measurement system to meet project objectives (Lombard and Kirchmer, 2004). The goal
for the water quality impairment study is to correctly collect and analyze 100% of the samples
for each project. However, problems occasionally arise during sample collection, such as site
access problems, equipment malfunction, or sample container shortages, that cannot be
controlled; thus, a completeness of 95% is acceptable for sampling and discrete measurements.
If equipment fails or samples are damaged, Ecology will attempt to recollect the data under
similar conditions, such as the following day, if possible. In general, each project should be
designed to accommodate some data loss and still meet project goals and objectives.
For continuous deployed measurements, additional variables can negatively impact completeness
including vandalism/theft/tampering, equipment failure, unacceptable fouling or drift, and
unpredictable hydrologic events (large storms or steep drops in water level between visits). For
these reasons, a completeness of 80% is acceptable for continuous measurements. Given these
difficulties, redundancy is an important component when designing studies with continuous data
collection, particularly at key boundary conditions and within the most critical areas.
If completeness targets are not achieved, then a determination will be made as to whether the
data that were successfully collected are sufficient to meet project needs. This will depend on a
number of factors, such as the needs of the modeling/analysis framework, and the times and
locations where data were lost. If successfully collected data are not sufficient, then one or a
combination of the following approaches will be used:
Estimate missing data values from existing data if this can be done with reasonable
confidence.

QAPP: Newaukum River - Page 39 – January 2018
Template Version 1.0, 10/07/2016
Conduct targeted additional sampling to fill data gaps.
Re-collect all or a portion of data.
If completeness targets are not met, the study report will analyze the effect of the incomplete
data on meeting the study objectives, account for data completeness (or incompleteness) in any
data analyses, and document data completeness and its consequences in any study reports.
Investigative samples may not meet the minimum requirements for statistical or other data
analysis, but will still be useful for source location identification, recommendations, or other
analyses.
6.3 Model quality objectives
To meet project goals and objectives, model quality results for nutrient and sediment estimates
should be comparable to models used in similar TMDL or other water quality impairment
modeling studies. A summary of results for comparison purposes is available in A Synopsis of
Model Quality from the Department of Ecology’s Total Maximum Daily Load Technical Studies
(Sanderson and Pickett, 2014). Sensitivity and uncertainty analyses should also be conducted to
assess the variability of the model results to specific parameters and level confidence in key
output values.
Model quality includes the following considerations:
Goodness-of-fit: The accuracy with which the model is able to predict observed data. This
can be described by (1) precision, using statistics such as Root Mean Squared Error (RMSE),
(2) bias, using statistics such as the relative error and (3) accuracy, visually using plots of
modeled and observed values.
Accurate representation of processes: Mechanistic models should achieve accurate
predictions by invoking correct explanations of observed data and reasonably simulating
real-world processes. For example, a model might accurately predict low stream
temperatures by incorrectly invoking groundwater instead of shade. Such a model might
have good goodness-of-fit, but for the wrong reasons, which is termed “curve-fitting”.
Selection of model parameters based on physical principles and careful multi-dimensional
analysis of model results should help to ensure that curve-fitting is not occurring.
Sensitivity to key inputs: Estimates should accurately predict the sensitivity of water body
response to key inputs, such as the sensitivity of temperature to shade or of dissolved oxygen
(DO) to nutrients.

QAPP: Newaukum River - Page 40 – January 2018
Template Version 1.0, 10/07/2016
7.0 Study Design
7.1 Study boundaries
All field activities will be conducted within the Newaukum River watershed (Figure 10). These
represent planned locations for field activities. Additional sampling locations could be added if
additional BMP projects or water quality sampling locations become available. Figure 11
presents possible bracketed water quality sampling locations at road crossings.
Figure 10. Map of the Newaukum River watershed with the proposed water quality and
watershed health sampling locations.
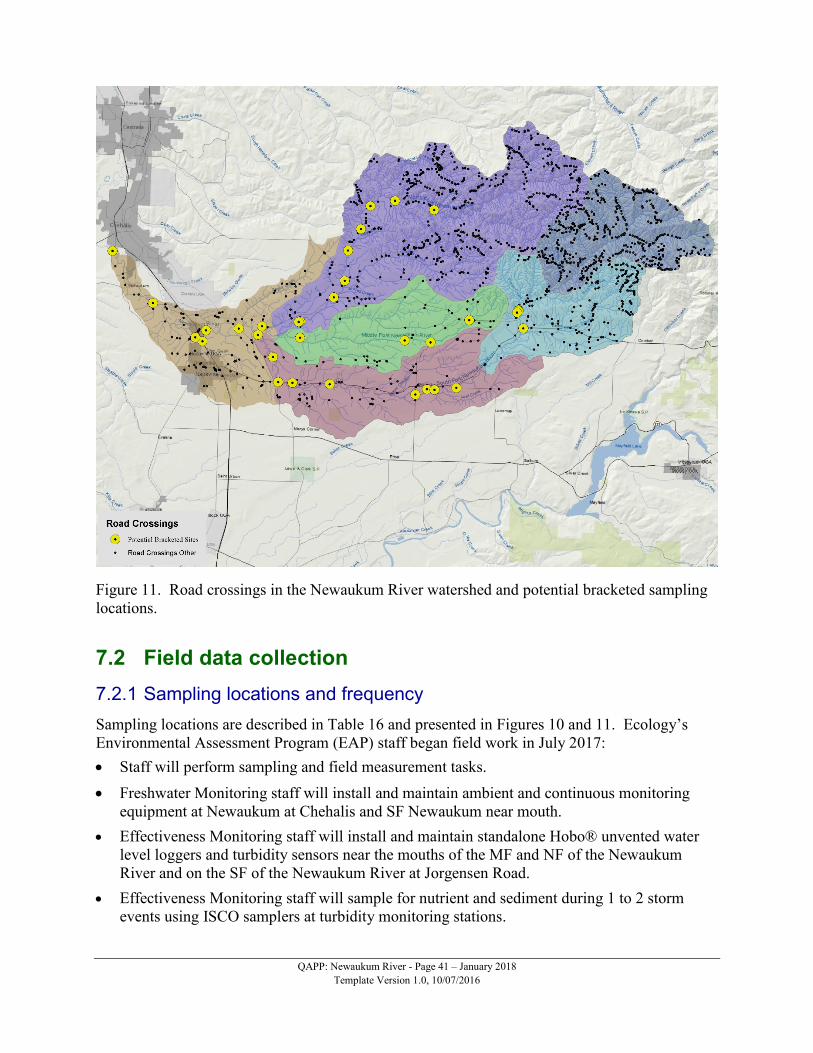
QAPP: Newaukum River - Page 41 – January 2018
Template Version 1.0, 10/07/2016
Figure 11. Road crossings in the Newaukum River watershed and potential bracketed sampling
locations.
7.2 Field data collection
7.2.1 Sampling locations and frequency
Sampling locations are described in Table 16 and presented in Figures 10 and 11. Ecology’s
Environmental Assessment Program (EAP) staff began field work in July 2017:
Staff will perform sampling and field measurement tasks.
Freshwater Monitoring staff will install and maintain ambient and continuous monitoring
equipment at Newaukum at Chehalis and SF Newaukum near mouth.
Effectiveness Monitoring staff will install and maintain standalone Hobo® unvented water
level loggers and turbidity sensors near the mouths of the MF and NF of the Newaukum
River and on the SF of the Newaukum River at Jorgensen Road.
Effectiveness Monitoring staff will sample for nutrient and sediment during 1 to 2 storm
events using ISCO samplers at turbidity monitoring stations.

QAPP: Newaukum River - Page 42 – January 2018
Template Version 1.0, 10/07/2016
Effectiveness Monitoring staff will collect monthly water quality monitoring, record stage,
and measure flow during the low-flow period (July-Aug) and biweekly during the high-flow
period (Oct-May).
Watershed Health Monitoring staff will perform watershed health assessments (1 event per
site) between September and October of 2017.
Effectiveness Monitoring staff will collect biweekly nutrient and pathogen data from Carlisle
Lake and from Gheer Creek above Carlisle Lake during the low-flow period.
Effectiveness Monitoring staff will deploy artificial periphyton samplers, and continuous
water quality sensors during low-flow periods as needed.
Table 16. Sampling locations for the monitoring study.
Station ID
Am
bie
nt
Wa
ter
Qu
ali
ty S
am
pli
ng
Co
nti
nu
ou
s T
urb
idit
y
Eco
logy
Un
ven
ted
Flo
w
US
GS
Co
nti
nu
ou
s F
low
Wa
ters
hed
Hea
lth
Ass
essm
ent
Description NAD83
Latitude
NAD83
Longitude
23-NEW4.6 X X X X Mainstem Newaukum near Chehalis 46.619293 -122.935618
23-NFN1.9 X X X X North Fork Newaukum near Mouth 46.608513 -122.830521
23-MFN-0.2 X X X X Middle Fork Newaukum near Mouth 46.602414 -122.836617
23-MFN3.7 X Middle Fork Newaukum below Culvert 46.59995 -122.76656
23-MFN3.9 X Middle Fork Newaukum above Culvert 46.600062 -122.764626
23-MFN6.8 X Middle Fork Newaukum below Culvert 46.6010534 -122.70867
23-SFN1.3 X X X X South Fork Newaukum near Mouth 46.603437 -122.854435
23-SFN4.5 X South Fork Newaukum river mile (RM) 4.5 46.573145 -122.820755
23-SFN6.3 X South Fork Newaukum RM 6.3 46.568989 -122.72856
23-CAR0.01 X Carlisle Lake Outfall 46.57802 -122.727217
23-CAR0.51 X Carlisle Lake Center 46.582354 -122.727504
23-GHE1.11 X Gheer Creek above Carlisle Lake 46.582398 -122.725796
23-SFN19 X South Fork Newaukum above Gheer Creek 46.568989 -122.72856
23-SFN22.8 X X2 X South Fork Newaukum at Jorgenson Rd bridge 46.5757 -122.68485
2 USGS flow station will serve as a quality assurance check for development of flow rating curve using pressure sensors.

QAPP: Newaukum River - Page 43 – January 2018
Template Version 1.0, 10/07/2016
7.2.2 Field parameters and laboratory analytes to be measured
Table 17 shows the list of parameters required to meet the data needs of the study. Parameters
may be added or removed from the study design as the project advances.
Table 17. Parameters to be collected during the study.
Parameter Ambient Storm
Event
Watershed
Health
Carlisle
Lake
Bracketed
Monitoring
Laboratory sample parameters
Ammonia-N X X
Nitrate + nitrite-N X X X
Chloride X
Chlorophyll a X
Persulfate Nitrogen, Total X X X
Ortho Phosphate X X
Phosphorus, soluble reactive X X X
Phosphorus, total X X X X X
Total suspended solids X X X
Suspended sediment concentration X X
Fecal coliform X
E. coli X X X
Field measurement parameters (continuous or discrete)
Conductivity X X X
Dissolved Oxygen X X X
Nitrate-nitrite X
Optical brighter X
pH X X X X
Turbidity X X
Streamflow X X
Temperature X X
Biological parameters
Macroinvertebrates X
Periphyton X
Chlorophyll a X X
Ash Free Dry Weight X X
Total Solids X X
Total Metals X X
Percent Total Organic Carbon X X
Total Carbon/Nitrogen X X
NO3- (15N, 17O, 18O) X X
Habitat Parameters
Mean substrate size X
Mean embeddedness X
Large woody debris X
Bed stability X
Canopy Cover X
Sinuosity X
Width-to-depth ratio X
Bankfull area X
Pool area X
Pool depth X
Slope X

QAPP: Newaukum River - Page 44 – January 2018
Template Version 1.0, 10/07/2016
7.3 Modeling and analysis design
Because flow and sediment conditions in streams are dynamic, especially during the winter and
spring months, this study will assess the relative contribution of sediment and nutrients using
continuous monitoring. Continuous flow and turbidity data will be collected and correlated with
discrete measurements of total phosphorus (TP), total nitrogen (TN), total suspended solids
(TSS) and suspended sediment concentrations (SSC). Continuous flow will be collected using
either existing USGS flow gauges or by using stand-alone unvented pressure sensors.
Seasonal average loads of TP, TN, SSC, and TSS will be calculated for each of the ambient
monitoring stations. This will be performed using one or more of the following methods:
Cohn multiple-regression model (Cohn et al., 1989; Cohn et al., 1992).
Beales ratio estimator (Thomann and Mueller, 1987).
Uncertainty analysis will be performed on each of these methods by evaluating the
correlations/regressions on which they are based.
8.0 Field Procedures
8.1 Invasive species evaluation
Field staff will follow SOP EAP070 on minimizing the spread of invasive species (Parsons et al.,
2012). The Newaukum River watershed is not in an area of extreme concern. Areas of extreme
concern have, or may have invasive species like New Zealand mud snails that are particularly
hard to clean off equipment and are especially disruptive to native ecological communities. For
more information, please see Ecology’s website on minimizing the spread of invasive species at
www.ecy.wa.gov/programs/eap/InvasiveSpecies/AIS-PublicVersion.html.
8.2 Measurement and sampling procedures
All ambient water samples will be collected using Ecology SOP EAP034 (Ward, 2016).
Periphyton tissue samples will be collected following Ecology SOP EAP085 (Anderson et al.,
2016). Stream habitat measurement will be collected using methods in (Merritt, 2009). Benthic
macroinvertebrates will be collected using Ecology SOP EAP073 (Larson, 2016).
Continuous measurement of water quality parameters will be made following Ecology SOP
EAP033 (Swanson, 2007). When continuous measurements are being made in conjunction with
a data logger Ecology SOP EAP072 will be followed (Bookter, 2016). Streamflow
measurements will be performed following Ecology SOP EAP024 (Mathieu, 2016).
8.3 Containers, preservation methods, and holding times
Field staff will collect discrete samples directly into pre-cleaned containers supplied by
Manchester Environmental Laboratory (MEL) and described in their Lab Users Manual (MEL,
2016). Table 18 lists the sample parameters, containers, volumes, preservation requirements,

QAPP: Newaukum River - Page 45 – January 2018
Template Version 1.0, 10/07/2016
and holding times. Field staff will store samples for laboratory analysis on ice and deliver to
MEL via courier. MEL follows standard analytical methods outlined in their Lab Users Manual
(MEL, 2016).
Table 18. Sample containers, preservation, and holding times.
Parameter Matrix Minimum
Quantity Container Holding Time Preservative
Ammonia-N Water 125 mL 125 mL clear w/m poly
bottle 28 days
H2SO4 to pH <2;
Cool to ≤6°C
Nitrate + nitrite-N Water 125 mL 125 mL clear w/m poly
bottle 28 days
H2SO4 to pH <2;
Cool to ≤6°C
Total persulfate
nitrogen Water 125 mL
125 mL clear w/m poly
bottle 0.45 um pore size
filters for dissolved
TPN
28 days
H2SO4 to pH <2;
Cool to ≤6°C
Phosphorus, soluble
reactive Water 125 mL
125 mL amber w/m
poly bottle 0.45 um
pore size
48 hrs
Filter in field with
0.45 um pore size
filter;
Cool to ≤6°C
Phosphorus, total Water 60 mL 125 mL clear n/m poly
bottle 28 days
1:1 HCl to pH <2;
Cool to ≤6°C
Total suspended solids Water 1,000 mL 1,000 mL w/m poly
bottle 7 days Cool to ≤6°C
Suspended sediment
concentration Water 1,000 mL
1,000 mL w/m poly
bottle 7 days Cool to ≤6°C
Fecal coliform/E. coli Water 250 mL
250 mL
glass/polypropylene
autoclaved bottle
24 hours
Fill the bottle to the
shoulder;
Cool to ≤10°C
Invertebrates Tissue NA
Wide mouth
polyethylene jar
(128 oz or 3.8 L)
Roughly 3
months
95% Ethanol (add 3
parts by volume for
each part sample)
Periphyton Tissue <1,000 mL 1,000 mL amber w/m
poly jar (1 L)
24 hours to
filtration;
28 days after
filtration (frozen)
Cool to ≤6°C
Chlorophyll a Tissue 10 mL Glass test tube
w/acetone
Cool to <6°C
keep in dark 28 days post
Total Carbon &
Nitrogen - Periphyton Tissue 1 g ww
50 mL poly centrifuge
tube 6 months
Cool to ≤6°C
store in dark
Total Metals
Periphyton1 Tissue 1 g ww
50 mL poly centrifuge
tube 6 months
Cool to ≤6°C
store in dark
Ash Free Dry Weight
Periphyton Tissue 30 mL 50 mL amber poly jar Cool to <6°C 7 Days
Total Solids Periphyton Tissue 30 50 mL amber poly jar Cool to <6°C 7 Days
15N, 18O Tissue 1 g ww 50 mL poly centrifuge
tube Cool to <6°C 200 days
Metals Sediment 50 g ww 4 oz glass jar Cool to <4°C
keep in dark 6 months
Percent Total Organic
Carbon Sediment 50 g ww 4 oz glass jar
Cool to <4°C
keep in dark 6 months
¹ Al, As, Cd, Cu, Fe, K, Mn, P, Pb, Zn
QAPP: Newaukum River - Page 46 – January 2018
Template Version 1.0, 10/07/2016
8.4 Equipment decontamination
Staff will follow all recommended protocols from instrument manufacturers for cleaning and, if
needed, re-calibrating sensors. For in-situ equipment, staff will follow Ecology’s SOP EAP090,
Decontamination of Sampling Equipment for Use in Collecting Toxic Chemical Samples when
cleaning equipment used for in-situ sample collection and sample preparation (Friese, 2014).
8.5 Sample ID
All samples will be labeled with station, date, time, parameter and sample identification
numbers, and these are recorded in the field log. Each lab sample is automatically given a
unique identification number once loaded in the database. This number is transferred to analyses
logs (for internal lab samples) or chain-of-custody forms sent to external labs. All sample bottles
are reconciled against forms to verify completeness as samples move through the analytical
process, described in the Quality Control section of this QAPP.
8.6 Chain-of-custody
During sample collection, a chain–of-custody form is generated for samples, based on field logs.
Chain-of-custody logs are delivered to the lab with the corresponding samples for management
of sample counts, scheduling, and tracking analysis. Once the samples are delivered, lab
personnel log in each sample and assign a lab number to each, using the sample label number
and date. Each laboratory sample number must correspond to a particular date, station, and
depth.
When data results are received from labs, chain-of-custody forms are reconciled with data to
ensure complete delivery and correct invoicing for all results. If discrepancies exist, research
and investigation of the discrepancy is conducted in coordination with the lab(s) until the
problem is resolved.
8.7 Field log requirements
In-situ measurements made in surface waters will either be recorded internally within the data
logger or collected as water samples and analyzed at the laboratory. Information on samples will
be recorded in a digital field log. The field log form also includes data logger information for
data processing, such as cast start time, file names, replicate cast number, instrument
information, and survey ID. In addition, any changes or deviations from the sampling plan or
unusual circumstances that might affect interpretation of results are recorded.
Collection data sheets will also be generated on each survey, to record collected samples to be
sent to the lab. A paper log is brought along on every survey to use as a backup if the electronic
form or device fails. Digital copies of the field and sample logs are stored for future reference on
a shared, secure, frequently backed up network server. Photos will be taken during each survey
to record observations and events. These photos are used to document each sampling event and
for the creation of reports, procedures, and other documents.

QAPP: Newaukum River - Page 47 – January 2018
Template Version 1.0, 10/07/2016
8.8 Other activities
The project manager or field lead for each survey crew is the designated safety officer for that
survey. The safety officer will have the following responsibilities:
Cancelling assessments if conditions warrant.
Complying with field and safety procedures.
Knowledge of radio use.
Knowledge of use and location of the safety equipment.
Sample handling and processing, including chemical safety protocols.
Emergency procedures.

QAPP: Newaukum River - Page 48 – January 2018
Template Version 1.0, 10/07/2016
9.0 Laboratory Procedures
9.1 Lab procedures table
Ecology’s Manchester Environmental Laboratory (MEL) conducts laboratory analyses and
laboratory procedures following Standard Operating Procedures (SOPs) and other guidance
documents. Analytical methods and lower reporting limits are listed in Table 19. University of
Washington Seattle will conduct the periphyton nitrogen isotope analyses following laboratory
procedures and methods.
Table 19. Measurement methods (laboratory).
Analyte Matrix Expected Range
of Results Method
Method Detection
Limit
Ammonia-N Water <0.01 – 30 mg/L SM 4500 NH3H 0.002 mg/L
Nitrate + nitrite-N Water <0.01 – 30 mg/L SM 4500NO3I 0.005 mg/L
Total persulfate nitrogen Water 0.5 – 50 mg/L SM 4500-NB 0.013 mg/L
Phosphorus, soluble reactive Water 0.01 – 5.0 mg/L SM 4500PG 0.0013 mg/L
Phosphorus, total Water 0.01 – 10 mg/L SM 4500-PH 0.0024 mg/L
Total suspended solids Water <1 – 2,000 mg/L SM 2540D 1.0 mg/L (RL)
Suspended sediment concentration Water
Fecal coliform Water 1 – 15,000 cfu/100 mL SM 9222 D 1.0 cfu/100 mL (RL)
E. coli (MF or MPN) Water 1-15,000 SM 9223B or EPA1105 1
Chlorophyll a Tissue 10 – 10,000 ug/L SM 10200H(3) .05 mg/L (RL)
Total carbon periphyton Tissue 1 – 20% EPA 440.0 0.1% of DW
Total nitrogen periphyton Tissue 0.1 – 5% EPA 440.0 0.1% of DW
Ash free dry weight periphyton Tissue 50-3200 mg/kg SM 10300C 0.05 mg/kg
Total solids periphyton Tissue 400-20,000 mg/L SM 2540B 0.01 mg/L
15N Tissue -1.0 – 20 permil Continuous flow isotope
MS with CHN analyzer 0.049911 permil
13C Tissue -40 – (-18) permil Continuous flow isotope
MS with CHN analyzer -0.00373 permil
Al Tissue 200-250,000 mg/kg SW6010D 1.1 mg/kg
As Tissue 0.05-500 mg/kg SW6020B 0.10 mg/kg
Cd Tissue 0.001-50 mg/kg SW6020B 0.34 mg/kg
Cu Tissue 0.5-2000 mg/kg SW6020B 0.36 mg/kg
K Tissue 100-40,000 mg/kg SW6010D 10.6 mg/kg
Fe Tissue 300-500,000 mg/kg SW6010D 5.0 mg/kg
Mn Tissue 10-200,000 mg/kg SW6020B 0.14 mg/kg
Ni Tissue 0.5-500 mg/kg SW6020B 0.17 mg/kg
Pb Tissue 0.05-500 mg/kg SW6020B 0.052 mg/kg
P Tissue 100-30,000 mg/kg SW6020B 1.71 mg/kg
Zn Tissue 1-25,000 mg/kg SW6020B 0.43 mg/kg
Permil: parts per thousand

QAPP: Newaukum River - Page 49 – January 2018
Template Version 1.0, 10/07/2016
9.2 Sample preparation method(s)
Periphyton tissue samples will be prepared for analysis using Ecology SOP EAP085 (Anderson,
et al., 2016).
Sample preparation methods are listed in standard operating procedures for lab analyses or in
analytical methods.
9.3 Special method requirements
Not applicable.
9.4 Laboratories accredited for methods
All chemical analysis, except for periphyton nitrogen isotopes, will be performed at MEL, which
is accredited for all methods (Table 14). University of Washington’s Isotope Laboratory is not
accredited by Ecology for periphyton isotopes of nitrogen and carbon. The lab has a rigorous
quality control program, and analysis of stable isotopes is a routine analysis for this lab. Because
there is currently no other lab accredited by Ecology to do this analysis, a request to waive
required use of accredited lab has been obtained. Rhithron Associates, Inc. in Missoula,
Montana will process and analyze macroinvertebrate and periphyton taxonomy samples.

QAPP: Newaukum River - Page 50 – January 2018
Template Version 1.0, 10/07/2016
10.0 Quality Control Procedures
Implementing quality control (QC) procedures provides the information needed to assess the quality
of the data that is collected. These procedures also help identify problems or issues associated with
data collection, data analysis, or modeling, while the project is underway.
Field Quality Control Procedures
Field blanks are used to check for sample contamination. Field staff will prepare blanks in the
field by:
Filling the bottles directly with deionized water for most water quality samples. For filtered
parameters, deionized water will be filtered through a new syringe and filtered into the
sample bottle.
For samples where a secondary container other than the sample bottle is used (such as
composite), the secondary container will be cleaned and used in the same way to produce
blanks as for field samples.
Handling and transporting the filtering equipment and blank samples to MEL in the same
manner that the rest of the samples are processed.
For field instruments, EAP staff will perform the following QC procedures:
Pre-calibration: Minimize bias in the Hydrolab® or other multi-parameter sonde field
measurements by pre-calibrating the instrument before each run, using NIST standards when
possible.
NIST post check: Assess any potential bias from instrument drift, fouling, or interference in
probe measurements by:
o For pH and conductivity, post-checking the probes against NIST-certified pH and
conductivity standards.
o For dissolved oxygen (DO), post-checking the probe against 100% saturation with an air
check or saturated water bath (as recommended by the meter instruction manual).
o For temperature, checking the probe’s temperature readings before and after each project
using an NIST-certified thermometer.
o For turbidity, post-checking the probes against NIST-certified turbidity standards.
o For other parameters, post-check with a NIST-certified, if feasible.
o The results from each field instrument will be assigned an accuracy rating based on the
criteria in Table 20.
QC meter field checks
o Collect a minimum of three field checks using an NIST calibrated field meter (MQO) or
a meter of comparable accuracy, resolution, and range.
o One field check will be collected at deployment, one mid-deployment, and one upon
retrieval of the deployed instrument.
o DO meters used for field checks must use an optical DO technology, such as
Luminescent Dissolved Oxygen (LDO).

QAPP: Newaukum River - Page 51 – January 2018
Template Version 1.0, 10/07/2016
Winkler QC field checks
o For DO deployments, in addition to field DO meter checks, a minimum of three Winkler
samples must be collected.
Fouling checks
o For deployments of longer than two weeks or sites with heavy fouling, assess bias from
instrument fouling by collecting a final measurement upon retrieval of a deployed sonde,
then immediately cleaning the sensors at the site, and finally taking another measurement
immediately after cleaning.
Field calibration frequency
o For discrete/field check instruments, these should be checked weekly, unless otherwise
specified in a project-specific QAPP. If the instrument’s check results exceed the
Excellent criteria in Table 20, then the instrument must be recalibrated. For instruments
capable of holding a calibration for an extended period of time such as optical DO
sensors, it is recommended to avoid recalibrating instruments that pass check criteria; this
allows for more consistent results throughout the course of the project.
o For deployed instruments, these are checked during pre-deployment and after retrieval
only. Deployed instruments are not buffer checked or recalibrated mid-deployment,
unless otherwise specified in a project-specific QAPP.
Table 20. Rating of accuracy for field instruments.
Measured Field
Parameter Excellent Good Fair Poor
Water
temperature ≤ ± 0.2°C > ± 0.2 – 0.5°C > ± 0.5 – 0.8°C > ± 0.8°C
Specific
conductance ≤ ± 3% > ± 3 – 10% > ± 10 – 15% > ± 15%
Dissolved
Oxygen*
≤ ± 0.3 mg/L
or ≤ ± 5%,
whichever is greater
> ± 0.3 – 0.5 mg/L or
> ± 5 – 10%,
whichever is greater
> ± 0.5 – 0.8 mg/L
or > ± 10 – 15%,
whichever is greater
> ± 0.8 mg/L
or > ± 15%,
whichever is greater
pH ≤ ± 0.2 units > ± 0.2 – 0.5 units > ± 0.5 – 0.8 units > ± 0.8 units
Turbidity
≤ ± 0.5 units or
≤ ± 5%,
whichever is greater
> ± 0.5 – 1.0 units or
> ± 5 – 10%,
whichever is greater
> ±1.0 – 2.0 units or
> ± 10 – 20%,
whichever is greater
> ± 2.0 units
or > ± 20%,
whichever is greater
*Percent criteria based on saturation check; mg/L criteria based on Winkler field checks
10.1 Table of field and laboratory quality control
The primary types of QC samples used to evaluate and control the accuracy of laboratory
analyses are check standards, duplicates, spikes, and blanks (MEL, 2016). Check standards
serve as an independent check on the calibration of the analytical system and can be used to
evaluate bias. MEL routinely duplicates sample analyses in the laboratory to determine
laboratory precision. Matrix spikes are used to check for matrix interference with detection of
the analyte and can be used to evaluate bias as it relates to matrix effects. Blanks are used to
check for sample contamination in the laboratory process. Laboratory and field QC procedures
are presented in Tables 21 and 14 for field measurements.

QAPP: Newaukum River - Page 52 – January 2018
Template Version 1.0, 10/07/2016
Table 21. Quality control samples, types, and frequency.
Parameter
Field Laboratory
Blanks Replicates Check
Standards
Method
Blanks
Analytical
Duplicates
Matrix
Spikes
Water
Ammonia-N n/a 10% 1/batch 1/batch 1/batch 1/batch
Nitrate + nitrite-N n/a 10% 1/batch 1/batch 1/batch 1/batch
Total persulfate nitrogen n/a 10% 1/batch 1/batch 1/batch 1/batch
Phosphorus, soluble reactive n/a 10% 1/batch 1/batch 1/batch 1/batch
Phosphorus, total n/a 10% 1/batch 1/batch 1/batch 1/batch
Total suspended solids n/a 10% 1/batch 1/batch 1/batch 1/batch
Suspended sediment
concentration n/a 10% 1/batch 1/batch 1/batch 1/batch
Fecal coliform n/a 10% n/a n/a 1/batch n/a
E. coli n/a 10% n/a n/a 1/batch n/a
Periphyton Tissue
Chlorophyll a n/a 10% n/a n/a 1/batch n/a
Total Carbon Periphyton n/a 10% 1/batch n/a 1/batch n/a
Total Nitrogen Periphyton n/a 10% 1/batch n/a 1/batch n/a
Ash Free Dry Weight
Periphyton n/a 10% n/a n/a 1/batch n/a
Total Solids Periphyton n/a 10% n/a n/a 1/batch n/a
Sediment
Total metals n/a 10% 1/batch 1/batch 1/batch 1/batch
Total Carbon n/a 10% 1/batch n/a 1/batch n/a
Taxonomy
Periphyton n/a 10% n/a n/a n/a n/a
Macroinvertebrate n/a 10% n/a n/a n/a n/a
10.2 Corrective action processes
QC results may indicate problems with data during the course of the project. Corrective action
processes will be used if activities are found to be inconsistent with the QAPP, if field
instruments yield unusual results, if results do not meet MQOs or performance expectations, or if
some other unforeseen problem arises. There may be cause for field instruments to be
recalibrated, following SOPs, while still on site. For data analysis and modeling work, this may
involve activity from project personnel and technical experts to decide on the next steps that
need to be taken to improve model performance. Options for corrective actions might include:
Retrieving missing information.
Re-calibrating the measurement system.
Re-analyzing samples within holding time requirements.
Modifying the analytical procedures.
Requesting additional sample collection or additional field measurements.
Qualifying results.

QAPP: Newaukum River - Page 53 – January 2018
Template Version 1.0, 10/07/2016
11.0 Management Procedures
11.1 Data recording and reporting requirements
Staff will record all field data in a field notebook or an equivalent electronic collection platform.
Before leaving each site, staff will check field notebooks or electronic data forms for missing or
improbable measurements. Staff will enter field-generated data into Microsoft (MS) Excel®
spreadsheets as soon as is practical after they return from the field. If data were collected
electronically, data will be backed up on Ecology servers when staff returns from the field. The
field assistant will check data entry against the field notebook data for errors and omissions. The
field assistant will notify the field lead or project manager of missing or unusual data.
Lab results will be checked for missing and/or improbable data. MEL will send data through
Ecology’s Laboratory Information Management System (LIMS). The field lead will check
MEL’s data for omissions against the “Request for Analysis” forms. The project manager will
review data requiring additional qualifiers.
In addition, data summaries and web maps will be either presented in free form on Ecology’s
Effectiveness Monitoring web page (https://ecology.wa.gov/Research-Data/Monitoring-
assessment/Water-quality-improvement-effectiveness-monitoring), or Ecology’s EIM.
11.2 Laboratory data package requirements
Laboratory-generated data reduction, review, and reporting will follow procedures outlined in
MEL’s Lab Users Manual (MEL, 2016). Variability in lab duplicates will be quantified, also
using procedures in this manual. Any estimated results will be qualified and their use restricted
as appropriate. A standard case narrative of laboratory QA/QC results will be sent to the project
manager for each set of samples.
11.3 Electronic transfer requirements
MEL will provide all data electronically to the project manager through the LIMS to EIM data
feed. There is already a protocol in place for how and what MEL transfers to EIM through
LIMS.
11.4 EIM/STORET data upload procedures
All water quality data will be entered into EIM, following all existing Ecology business rules and
the EIM User’s Manual for loading, data quality checks, and editing.
11.5 Model and statistical information management
Data management for modeling work ranges from basic spreadsheets to the development of large
relational databases. Modeling data can include input data, version management, output files,
and post-processing of results.

QAPP: Newaukum River - Page 54 – January 2018
Template Version 1.0, 10/07/2016
Ecology will maintain and provide the final version of the model, including input, output,
executables, electronic copies of the data, GIS, and other supporting documentation (including
records documenting model development). Intermediate versions will be saved during model
development; some data from intermediate versions may be archived to document the
development process or preserve critical earlier versions. Ecology will maintain copies of these
in a task subdirectory, subject to regular system backups, for a maximum period of 3 years after
task termination, unless otherwise directed by agency management. The underlying data sets,
having been determined to be of acceptable quality and used for the model, will be organized
prior to the public comment phase of the project, so that they can be easily shared upon request.
Staff will be instructed about the importance of routinely archiving work assignment data files
from hard drive to compact disc or server storage. Information will be stored on Ecology servers
that are routinely backed up. Screening for viruses on electronic files loaded on microcomputers
or the network is standard company policy. Automated screening systems are updated regularly
to ensure that viruses are identified and destroyed. Annual maintenance of software is performed
to keep up with evolutionary changes in computer storage, media, and programs.
12.0 Audits and Reports
12.1 Field, laboratory, and other audits
There is no need for audits for this study. However, there could be a field consistency review by
another experienced EAP field staff during this project. The aim of this review is to improve
field work consistency, improve adherence to SOPs, provide a forum for sharing innovations,
and strengthen our data QA program.
12.2 Responsible personnel
The project manager conducts audits of all data and works with field and lab technicians to
complete reviews. The senior field lead participates in checking data before it is finalized and
made public.
12.3 Frequency and distribution of reports
A peer-reviewed technical report or water quality improvement report will be completed and
published to Ecology’s website. The final report will also be distributed to all managers, clients,
tribes, municipalities, and other stakeholders involved or interested in the study as determined by
the EAP publications distribution form. EAP has specific publication guidelines depending on
the type of final report that describe the exact requirements necessary for publication.
12.4 Responsibility for reports
Given the long-term nature of the study, the data set will be extensive. Analyzing and
interpreting data results require an intensive team approach. The project manager leads reporting

QAPP: Newaukum River - Page 55 – January 2018
Template Version 1.0, 10/07/2016
on status and trends on various products and presentation of results. Members of the WHM team
assist in reports and presentations.
13.0 Data Verification
Data verification and review is conducted by the project manager and WHM team by examining
all field and laboratory-generated data to ensure:
Specified methods and protocols were followed.
Data are consistent, correct, and complete, with no errors or omissions.
Data specified in the Sampling Process Design section were obtained.
Results for QC samples, as specified in the Measurement Quality Objectives and Quality
Control, accompany the sample results.
Established criteria for QC results were met.
Data qualifiers (QC codes) are properly assigned.
13.1 Field data verification, requirements, and responsibilities
Throughout field sampling, the field lead and all crew members are responsible for carrying out
station-positioning, sample-collection, and sensor deployment procedures as specified in the
QAPP and SOPs. Additionally, technicians systematically review all field documents (such as
field logs, chain-of-custody sheets, and sample labels) to ensure data entries are consistent,
correct, and complete, with no errors or omissions. A second staff person always checks the
work of the staff person who primarily collected or generated data results.
13.1.1 In-field data verification
Field notebooks and electronic information storage will be checked for missing or improbable
measurements, and initial data will be verified before leaving each site. This process involves
checking the data sheet (written or electronic) for omissions or outliers. If measurement data are
missing or a measurement is determined to be an outlier, the measurement will be flagged in the data
sheet and repeated if possible. The field lead is responsible for in-field data verification.
13.1.2 Post-field work data verification
Upon returning from the field, data are either manually entered (data recorded on paper) or
downloaded from instruments and then uploaded into the appropriate database or project folder (see
Data Management Section). Manually entered data will be verified/checked by a staff member who
did not enter the data. Downloaded electronic data files will also be checked for completeness and
appropriate metadata (e.g., filename, time code).
13.1.3 Raw sensor data verification and adjustment
Following data entry verification, raw field measurement data will undergo a quality analysis
verification process to evaluate the performance of the sensors. Field measurement data may be
adjusted for bias or drift (increasing bias over time) based on the results of fouling, field, or standards
checks following general USGS guidelines (Wagner, 2007) and this process:

QAPP: Newaukum River - Page 56 – January 2018
Template Version 1.0, 10/07/2016
Review discrete field QC checks
1. Review post-check data for field QC check instruments, reject data as appropriate.
2. Assign a quality rating to the field check values (excellent, good, fair, poor) based on the
post-check criteria in Table 20.
Review/adjust time series (continuous) data
1. Plot raw time series with field checks.
2. Reject data based on deployment/retrieval times, site visit disruption, blatant fouling events,
and sensor/equipment failure.
3. Review sensor offsets for both pre-calibration and post-deployment buffer/standard checks.
Flag any potential chronic drift or bias issues specific to the instrument.
4. If applicable, review fouling check and make drift adjustment if necessary. In some
situations, an event fouling adjustment may be warranted based on abrupt changes in flow,
stage, sediment loading, etc.
5. Review residuals from both field checks and post-checks, together referred to as QC checks.
Adjust data as appropriate, using a weight-of-evidence approach. Give the most weight to
post-checks with NIST standards, then field checks rated excellent, then good, and then fair.
Do not use field checks rated poor. Potential data adjustments include:
a. Bias – Data are adjusted by the average difference between the QC checks and deployed
sonde. Majority of QC checks must show bias to use this method.
b. Regression – Data adjusted using regression, typically linear, between QC checks and
deployed data sonde. This accounts for both a slope and bias adjustment. The regression
must have at least 5 data points and an R2 value of >0.95 to use for adjustment. Do not
extrapolate regressions beyond the range of the QC checks.
c. Calibration/Sensor Drift – Data adjusted using linear regression with time from
calibration or deployment to post-check or retrieval. Majority of QC checks, particularly
post checks, must confirm pattern of drift.
6. Typically, choose the adjustment that results in the smallest residuals and bias between the
adjusted values and QC checks. Best professional judgement and visual review are necessary
to confirm adjustment.
7. If the evidence is weak or inconclusive, do not adjust the data.
If Ecology staff adjust any data, it will be noted in the final report. Data adjustment must be
performed or reviewed by a project manager or principal investigator with the appropriate
training and experience in processing raw sensor data. Water quality impairment staff are
currently drafting an SOP for continuous data collection and adjustment; this SOP will contain
more detail and be referenced in a subsequent version of this QAPP.
13.1.4 EIM data verification
After data have been finalized and entered into the EIM database, a staff member who was not
involved in the EIM data entry will review the data in EIM for completeness and potential errors
following Ecology’s internal EIM review protocols.

QAPP: Newaukum River - Page 57 – January 2018
Template Version 1.0, 10/07/2016
13.2 Verification of laboratory data
MEL staff will perform laboratory verification following standard laboratory practices (MEL,
2016). After the lab verification, the field lead, principal investigator, or project manager will
perform a secondary verification of each data package. This secondary verification will entail a
detailed review of all parts of the lab data package with special attention to lab QC results. The
reviewer will bring any discovered issues to the project manager for resolution. The project
manager will review data requiring additional qualifiers.
13.3 Validation requirements, if necessary
Data validation is an analyte- and sample-specific process that extends the evaluation of data
beyond method, procedural, or contractual compliance (i.e., data verification) to determine the
analytical quality of a specific data set (EPA, QA/G-8, 2002).
The data validation process follows verification and is almost always performed by a qualified
chemist who is independent of the data collectors and users. Validation involves a detailed
review of laboratory data packages, using professional judgment and objective criteria, to
determine if MQOs for precision, bias, and sensitivity specified in an approved QAPP have been
met. However, validation also requires the reviewer to assess data quality using instrument
calibration records, results for QC samples (e.g., blanks, replicates, spiked recovery samples,
standard reference materials), sample-specific instrument records, and other appropriate
information. All laboratory data that have been verified by MEL staff will be validated by a
project staff member. Field measurements data that was verified by a project staff member will
be validated by a different staff member.
After data entry and data validation tasks are completed, all field and laboratory data will be
entered into the EIM system. EIM data will be independently reviewed by staff for errors at an
initial 10% frequency. If significant entry errors are discovered, a more intensive review will be
undertaken.
13.4 Model quality assessment
To provide a credible basis for predicting and evaluating water quality scenarios and
management options, the ability of the model to represent real-world conditions should be
optimized and evaluated through a process of model calibration and, if appropriate, through
validation (CREM, 2009; EPA, 2002).
Model calibration is necessary because of the inherent uncertainty of water quality models. The
water quality models used are mechanistic, based on mass balance processes, but use kinetics to
quantify these processes that may be derived empirically, from laboratory studies or from other
ecological systems. Model calibration is the method of adjusting model parameters and kinetics
to achieve an optimal match between the predicted trends of the model to the observed
conditions. Model calibration involves a qualitative graphical comparison and basic statistical
methods that are used to compare model predictions and observations. See Programmatic QAPP
for Water Quality Impairment Studies (McCarthy and Mathieu, 2017).

QAPP: Newaukum River - Page 58 – January 2018
Template Version 1.0, 10/07/2016
14.0 Data Quality (Usability) Assessment
14.1 Process for determining if project objectives were met
After all laboratory and field data are verified and validated, the field lead or project manager
will thoroughly examine the data package, using statistics and professional judgment, to
determine if MQOs have been met. The project manager will examine the entire data package to
determine if all the criteria for MQOs, completeness, representativeness, and comparability have
been met. If the criteria have not been met, the field lead and project manager will decide if
affected data should be qualified or rejected based upon the decision criteria in the QAPP. The
project manager will decide how any qualified data will be used in the technical analysis.
14.2 Treatment of non-detects
A general practice for data management is that results or concentrations between the method
detection limit (MDL) and the reporting limit are reported as detected but not quantified due to
the potential for misuse or misinterpretation of low-level data which has relatively high
quantitative uncertainty.
Data results or concentrations of all analytes reported between the MDL and reporting limit are
quantified and annotated with a “J” qualifier (estimated concentration); this indicates a higher
level of uncertainty in the quantitative value. Statistical evaluations of data whose uncertainties
are “high” can lead to erroneous conclusions, especially if the sample populations are limited in
size or have high percentages of non-detect data results where analytes are not present at
detectable concentrations.
For lab data, the only sample results considered “detected” are those quantified at concentrations
at least three times greater than the corresponding results in the method blank and in the field
blank samples. Sample results that are not at least three times greater than the corresponding
results in the method blank are qualified with a “U” to indicate “not detected.” Sample results
that are not at least three times greater than the corresponding results in the field or reagent blank
samples are qualified with a “JB” to indicate “not detected due to contamination of the field or
reagent blank”.
14.3 Data analysis and presentation methods
Data analysis consists of comparing results to water quality standards and detecting changes in
monitoring parameters over time. Procedures comparing results to water quality standards are
defined in:
Ecology’s Water Quality Program Policy 1-11, https://ecology.wa.gov/Water-Shorelines/Water-
quality/Water-improvement/Assessment-of-state-waters-303d/Assessment-policy-1-11
Guidance for Effectiveness Monitoring of Total Maximum Daily Loads in Surface Waters
(Collyard and Onwumere, 2013), and
Programmatic QAPP for Water Quality Impairment Studies (McCarthy and Mathieu, 2017).
The sampling design will be considered successful if project objectives are met.

QAPP: Newaukum River - Page 59 – January 2018
Template Version 1.0, 10/07/2016
14.4 Sampling design evaluation
The project manager will decide whether the data package meets the MQOs, criteria for
completeness, representativeness, and comparability, and whether meaningful conclusions (with
enough statistical power) can be drawn from the results and analysis. If so, the sampling design
will be considered effective.
14.5 Documentation of assessment
In the technical report, the project manager will include a summary of the data quality
assessment findings. This summary will be included in the data quality section of the report.
15.0 References
Anderson, P.D., N. Mathieu, and S. Collyard, 2016. Standard Operating Procedures for
Collection and Processing of Periphyton Sample for TMDL and Effectiveness Monitoring
Studies, Version 2.0. Washington State Department of Ecology, Olympia, WA. SOP Number
EAP085.
https://www.ecology.wa.gov/About-us/How-we-operate/Scientific-services/Quality-assurance
Bassett, C., 2009. Changes in Fish Populations and Habitat Following Removal of a Perched,
Undersized Culvert on Big Murphy Creek. Hiawatha National Forest, Schoolcraft County,
Michigan.
https://www.fs.fed.us/t-d/programs/eng/aop/_assets/Big%20Murphyculvert%20replacement.pdf
Bookter, A., 2016. Standard Operating Procedure for Basic Use and Maintenance of
WaterLOG® Data Loggers and Peripheral Equipment, Version 2.0. Washington State
Department of Ecology, Olympia, WA. SOP Number EAP072.
https://www.ecology.wa.gov/About-us/How-we-operate/Scientific-services/Quality-assurance
Chehalis Lead Entity, 2016. Our Work – The Chehalis Watershed – Focus on The Newaukum.
http://www.chehalisleadentity.org/our-work/ Viewed December 22, 2016.
Cohn, T.A., DeLong, L., Gilroy, E.J, Hirsch, R.M., and D. Wells, 1989. Estimating Constituent
Loads. Water Resources Research, Vol. 25, No. 5. Pp 937-942.
Cohn, T.A., Caulder, D. L., Gilroy, E.J., Zynjuk, L.D., and R.M Summers, 1992. The Validity
of a Simple Statistical Model for Estimating Fluvial Constituent Loads: An Empirical Study
Involving Nutrient Loads Entering Chesapeake Bay. Water Resources Research, Vol. 28, Pp
2353-2363.
Collins, M., K. Lucey, B. Lambert, J. Kachmar, J. Turek, E. Hutchins, T. Purinton, and D. Neils,
2007. Steam Barrier Removal Monitoring Guide. Gulf of Maine Council on the Marine
Environment.
www.habitat.noaa.gov/pdf/Stream-Barrier-Removal-Monitoring-Guide-12-19-07.pdf

QAPP: Newaukum River - Page 60 – January 2018
Template Version 1.0, 10/07/2016
Collyard, S. and Onwumere, G., 2013. Guidance for Effectiveness Monitoring of Total
Maximum Daily Loads in Surface Water. Washington State Department of Ecology, Olympia,
WA. Publication No. 13-03-024.
https://fortress.wa.gov/ecy/publications/SummaryPages/1303024.html
CRBFA, 2010. Chehalis River Basin Flood Authority. Chehalis River Basin Comprehensive
Flood Hazard Management Plan. Prepared by: ESA Adolfson.
http://www.ci.chehalis.wa.us/sites/default/files/fileattachments/building_and_planning/page/104
8/d4_flood_authority_haz_mgmt_plan_06-10.pdf
CREM (Council for Regulatory Environmental Modeling), 2009. Guidance on the
Development, Evaluation, and Application of Environmental Models. EPA/100/K-09/003. Office
of the Science Advisor, Council for Regulatory Environmental Modeling, U.S. Environmental
Protection Agency, Washington, DC.
EPA, 2002. Guidance for Quality Assurance Project Plans for Modeling. U.S. Environmental
Protection Agency, Office of Environmental Information, Washington, D.C. EPA/240/R-02/007.
Friese, M., 2014. Standard Operating Procedures for Decontaminating Field Equipment of
Sampling Toxics in the Environment. Washington State Department of Ecology, Olympia, WA.
SOP Number EAP090.
https://www.ecology.wa.gov/About-us/How-we-operate/Scientific-services/Quality-assurance
Grays Harbor County Lead Entity Habitat Work Group, 2011. The Chehalis Basin Salmon
Habitat Restoration and Preservation Strategy for WRIA 22 & 23. Prepared by Grays Harbor
County Lead Entity Habitat Work Group.
http://www.chehalisleadentity.org/wp-content/uploads/2011_CBP_strategy_update_20111.pdf
Green, J., D. Loft, and R. Lehr, 2009. State-of-the-River Report for the Chehalis River Basin,
2006-2009. Grays Harbor College, Aberdeen, WA. http://chehalisbasinpartnership.org/wp-
content/uploads/2015/12/State-of-the-River-JAG-10-11-09.pdf
Hartel, P.G., K. Rodgers, G.L. Moody, S.N.J. Hemmings, J.A. Fisher, and J.L. McDonald, 2008.
Combining Targeted Sampling and Fluorometry to Identify Human Fecal Contamination in a
Freshwater Creek. Journal of Water and Health 6(1): 105-116.
http://www.ncbi.nlm.nih.gov/pubmed/17998611
Hartman, C., 2015. Focus on Environmental Monitoring: 2015 Stream Surveys in the Mid
Columbia Region. Washington State Department of Ecology, Olympia, WA. Publication No.
15-03-005. https://fortress.wa.gov/ecy/publications/SummaryPages/1503005.html
Jennings, K., and P. Pickett, 2000. Revised – Upper Chehalis River Basin Dissolved Oxygen
Total Maximum Daily Load Submittal Report. Washington State Department of Ecology,
Olympia, WA. Publication No. 00-10-018.
https://fortress.wa.gov/ecy/publications/SummaryPages/0010018.html

QAPP: Newaukum River - Page 61 – January 2018
Template Version 1.0, 10/07/2016
Larson, C., 2016. Standard Operating Procedures and Minimum Requirements for the Collection
of Freshwater Benthic Macroinvertebrates in Streams and Rivers, Version 2.0. Washington State
Department of Ecology, Olympia, WA. SOP Number EAP073.
https://www.ecology.wa.gov/About-us/How-we-operate/Scientific-services/Quality-assurance
Lawrence, J. E., M.R. Cover, C.L. May, and V. H. Resh, 2013. Short-term geomorphic impacts
of culvert removal following Best Management Practices in streams of Northern California.
Water Resources Collections and Archives. University of California Berkeley.
Lombard, S. and C. Kirchmer, 2004. Guidelines for Preparing Quality Assurance Project Plans
for Environmental Studies. Washington State Department of Ecology, Olympia,
WA. Publication No. 04-03-030.
https://fortress.wa.gov/ecy/publications/SummaryPages/0403030.html
Mathieu, N., 2006. Replicate Precision for Twelve Total Maximum Daily Load (TMDL) Studies
and Recommendations for Precision Measurement Quality Objectives for Water Quality
Parameters. Washington State Department of Ecology, Olympia, WA. Publication No. 06-03-
044. https://fortress.wa.gov/ecy/publications/SummaryPages/0603044.html
Mathieu, N., 2016. Standard Operating Procedure for Measuring Streamflow for Water Quality
Studies, Version 3.0. Washington State Department of Ecology, Olympia, WA. SOP Number
EAP024.
https://www.ecology.wa.gov/About-us/How-we-operate/Scientific-services/Quality-assurance
McCarthy, S. and Mathieu, N. 2017. Programmatic Quality Assurance Project Plan. Water
Quality Impairment Studies. March 2017. Publication No. 17-03-107.
https://fortress.wa.gov/ecy/publications/SummaryPages/1703107.html
Medina, A. L., J. N. Rinne, and P. Roni, 2005. Riparian restoration through grazing
management: Considerations for monitoring project effectiveness. Methods for Monitoring
Stream and Watershed Restoration. American Fisheries Society, Bethesda, MD. Pages 97-126.
MEL, 2016. Manchester Environmental Laboratory Lab Users Manual, Tenth Edition.
Manchester Environmental Laboratory, Washington State Department of Ecology, Manchester,
WA.
Merritt, G., 2009. Draft. Status and Trends Monitoring for Watershed Health and Salmon
Recovery: Field Data Collection Protocol. Washington State Department of Ecology, Olympia,
WA. Publication No. 09-03-xxx.
http://www.ecy.wa.gov/programs/eap/stsmf/docs/01SnTWadeableManA-Vv3bhfl.pdf
Parsons, J., D. Hallock, K. Seiders, B. Ward, C. Coffin, E. Newell, C. Deligeannis, and K.
Welch, 2012. Standard Operating Procedures to Minimize the Spread of Invasive Species,
Version 2.1. Washington State Department of Ecology, Olympia, WA. SOP Number EAP070.
https://www.ecology.wa.gov/About-us/How-we-operate/Scientific-services/Quality-assurance

QAPP: Newaukum River - Page 62 – January 2018
Template Version 1.0, 10/07/2016
Phinney, L. and Bucknell, P., 1975. A Catalog of Washington Streams and Salmon Utilization.
Volume 2 Coastal Region. Washington Department of Fisheries.
Pickett, P., 1994. Upper Chehalis River Dry Season Total Maximum Daily Load Study.
Washington State Department of Ecology, Olympia, WA. Publication No. 94-126
https://fortress.wa.gov/ecy/publications/SummaryPages/94126.html
Roni, P, Hanson, K., and Beechie, T., 2008. Global Review of the Physical and Biological
Effectiveness of Stream Habitat Rehabilitation Techniques. North American Journal of Fisheries
Management. Vol 28: Pgs 856-890.
Rountry, D., 2004. The Chehalis/Grays Harbor Watershed Dissolved Oxygen (DO),
Temperature, and Fecal Coliform Bacteria TMDL. Detailed Implementation (Cleanup) Plan.
Publication No. 04-10-065.
https://fortress.wa.gov/ecy/publications/SummaryPages/0410065.html
Sanderson, T. and P. Pickett, 2014. A Synopsis of Model Quality from the Department of
Ecology’s Total Maximum Daily Load Technical Studies. Washington State Department of
Ecology, Olympia, WA. https://fortress.wa.gov/ecy/publications/documents/1403042.pdf
Swanson, T., 2007. Standard Operating Procedure for Hydrolab® DataSonde® and
MiniSonde® Multiprobes, Version 1.0. Washington State Department of Ecology,
Olympia, WA. SOP Number EAP033.
https://www.ecology.wa.gov/About-us/How-we-operate/Scientific-services/Quality-assurance
Thomann, R.V. and J.A. Mueller, 1987. Principles of Surface Water Quality Monitoring and
Control. Harper and Row, New York. 1987. ISBN. 0060466774
Verd, K. and N. Wilson, 2002. Newaukum Watershed Culvert Assessment: Water Resource
Inventory Area 23. Lewis County Conservation District.
WAC 173-201A. Water Quality Standards for Surface Waters in the State of Washington
Washington State Department of Ecology, Olympia, WA.
http://app.leg.wa.gov/WAC/default.aspx?cite=173
Wagner, C.R., 200. Simulation of water-surface elevations and velocity distributions at the U.S.
Highway 13 bridge over the Tar River at Greenville, North Carolina, using one- and two-
dimensional steady-state hydraulic models: U.S. Geological Survey Scientific Investigations
Report 2007–5263, 33 p. http://pubs.water.usgs.gov/sir2007-5263/.
Wampler, P.L., Knudsen, E.E., Hudson, M., and Young, T.A., 1993. Chehalis River basin fishery
resources: salmon and steelhead habitat degradations. US Department of the Interior, Fish and
Wildlife Service. Lacey, WA.
Ward, B.J., 2016. Standard Operating Procedure for the Collection, Processing, and Analysis of
Stream Samples, Version 1.5. Washington State Department of Ecology, Olympia, WA. SOP
Number EAP034.
https://www.ecology.wa.gov/About-us/How-we-operate/Scientific-services/Quality-assurance

QAPP: Newaukum River - Page 63 – January 2018
Template Version 1.0, 10/07/2016
Wildrick, L., D. Davidson, R. Sinclair, and B. Barker, 1995. Initial watershed assessment: water
resource inventory area 23 Upper Chehalis River. Open File Technical Report 95-03.
Yang, S., Zhou, D., Yu, H., and B. Pan, 2013. Distribution and speciation of metals (Cu, Zn, Cd,
and Pb) in agricultural and non-agricultural soils near a stream upriver from the Pearl River,
China. Environmental Pollution 177C:64-70.
https://www.sciencedirect.com/science/article/pii/S0269749113000596

QAPP: Newaukum River - Page 64 – January 2018
Template Version 1.0, 10/07/2016
16.0 Appendices

QAPP: Newaukum River - Page 65 – January 2018
Template Version 1.0, 10/07/2016
Appendix A. Glossaries, Acronyms, and Abbreviations
Glossary of General Terms
Ambient: Background or away from point sources of contamination. Surrounding
environmental condition.
Bankfull stage: Formally defined as the stream level that “corresponds to the discharge at
which channel maintenance is most effective, that is, the discharge at which moving sediment,
forming or removing bars, forming or changing bends and meanders, and generally doing work
that results in the average morphologic characteristics of channels (Dunne and Leopold, 1978).
Baseflow: The component of total streamflow that originates from direct groundwater
discharges to a stream.
Clean Water Act: A federal act passed in 1972 that contains provisions to restore and maintain
the quality of the nation’s waters. Section 303(d) of the Clean Water Act establishes the TMDL
program.
Designated uses: Those uses specified in Chapter 173-201A WAC (Water Quality Standards
for Surface Waters of the State of Washington) for each water body or segment, regardless of
whether or not the uses are currently attained.
Dissolved oxygen (DO): A measure of the amount of oxygen dissolved in water.
Nonpoint source: Pollution that enters any waters of the state from any dispersed land-based or
water-based activities, including but not limited to atmospheric deposition, surface-water runoff
from agricultural lands, urban areas, or forest lands, subsurface or underground sources, or
discharges from boats or marine vessels not otherwise regulated under the NPDES program.
Generally, any unconfined and diffuse source of contamination. Legally, any source of water
pollution that does not meet the legal definition of “point source” in section 502(14) of the Clean
Water Act.
Nutrient: Substance such as carbon, nitrogen, and phosphorus used by organisms to live and
grow. Too many nutrients in the water can promote algal blooms and rob the water of oxygen
vital to aquatic organisms.
pH: A measure of the acidity or alkalinity of water. A low pH value (0 to 7) indicates that an
acidic condition is present, while a high pH (7 to 14) indicates a basic or alkaline condition. A
pH of 7 is considered to be neutral. Since the pH scale is logarithmic, a water sample with a pH
of 8 is ten times more basic than one with a pH of 7.
Pollution: Contamination or other alteration of the physical, chemical, or biological properties
of any waters of the state. This includes change in temperature, taste, color, turbidity, or odor of
the waters. It also includes discharge of any liquid, gaseous, solid, radioactive, or other
substance into any waters of the state. This definition assumes that these changes will,
or are likely to, create a nuisance or render such waters harmful, detrimental, or injurious to

QAPP: Newaukum River - Page 66 – January 2018
Template Version 1.0, 10/07/2016
(1) public health, safety, or welfare, or (2) domestic, commercial, industrial, agricultural,
recreational, or other legitimate beneficial uses, or (3) livestock, wild animals, birds, fish, or
other aquatic life.
Primary contact recreation: Activities where a person would have direct contact with water to
the point of complete submergence including, but not limited to, skin diving, swimming, and
water skiing.
Reach: A specific portion or segment of a stream.
Riparian: Relating to the banks along a natural course of water.
Salmonid: Fish that belong to the family Salmonidae. Any species of salmon, trout, or char.
Sediment: Soil and organic matter that is covered with water (for example, river or lake
bottom).
Stormwater: The portion of precipitation that does not naturally percolate into the ground or
evaporate but instead runs off roads, pavement, and roofs during rainfall or snow melt.
Stormwater can also come from hard or saturated grass surfaces such as lawns, pastures,
playfields, and from gravel roads and parking lots.
Streamflow: Discharge of water in a surface stream (river or creek).
Total Maximum Daily Load (TMDL): A distribution of a substance in a water body designed
to protect it from not meeting (exceeding) water quality standards. A TMDL is equal to the sum
of all of the following: (1) individual waste load allocations for point sources, (2) the load
allocations for nonpoint sources, (3) the contribution of natural sources, and (4) a margin of
safety to allow for uncertainty in the waste load determination. A reserve for future growth is
also generally provided.
Turbidity: A measure of water clarity. High levels of turbidity can have a negative impact on
aquatic life.
Watershed: A drainage area or basin in which all land and water areas drain or flow toward a
central collector such as a stream, river, or lake at a lower elevation.
Acronyms and Abbreviations
BMP Best management practice
DO (see Glossary above)
e.g. For example
Ecology Washington State Department of Ecology
EIM Environmental Information Management database
EPA U.S. Environmental Protection Agency
et al. And others
GIS Geographic Information System software
i.e. In other words

QAPP: Newaukum River - Page 67 – January 2018
Template Version 1.0, 10/07/2016
MEL Manchester Environmental Laboratory
MQO Measurement quality objective
NF North Fork
QA Quality assurance
QAPP Quality Assurance Project Plan
QC Quality control
RM River mile
RPD Relative percent difference
RSD Relative standard deviation
SF South Fork
SOP Standard operating procedure
TMDL (See Glossary above)
TOC Total organic carbon
USFS United States Forest Service
USGS United States Geological Survey
WAC Washington Administrative Code
WDFW Washington Department of Fish and Wildlife
WRIA Water Resource Inventory Area
Units of Measurement
°C degrees centigrade
cfs cubic feet per second
cm2 square centimeters
dw dry weight
ft2 square feet
ft/s feet per second
g gram, a unit of mass
kg kilograms, a unit of mass equal to 1,000 grams
m meter
m2 square meters
m3 cubic meters
m3/100 m cubic meters per 100 meters
mm millimeter
mg milligram
mg/Kg milligrams per kilogram (parts per million)
mg/L milligrams per liter (parts per million)
mL milliliter
NTU nephelometric turbidity units
oz ounces
s.u. standard units
ug/L micrograms per liter (parts per billion)
uS/cm microsiemens per centimeter, a unit of conductivity
ww wet weight

QAPP: Newaukum River - Page 68 – January 2018
Template Version 1.0, 10/07/2016
Quality Assurance Glossary
Accreditation: A certification process for laboratories, designed to evaluate and document a
lab’s ability to perform analytical methods and produce acceptable data. For Ecology, it is
“Formal recognition by (Ecology)…that an environmental laboratory is capable of producing
accurate analytical data.” [WAC 173-50-040] (Kammin, 2010)
Accuracy: The degree to which a measured value agrees with the true value of the measured
property. USEPA recommends that this term not be used, and that the terms precision and bias
be used to convey the information associated with the term accuracy. (USGS, 1998)
Analyte: An element, ion, compound, or chemical moiety (pH, alkalinity) which is to be
determined. The definition can be expanded to include organisms, e.g., fecal coliform,
Klebsiella. (Kammin, 2010)
Bias: The difference between the population mean and the true value. Bias usually describes a
systematic difference reproducible over time, and is characteristic of both the measurement
system, and the analyte(s) being measured. Bias is a commonly used data quality indicator
(DQI). (Kammin, 2010; Ecology, 2004)
Blank: A synthetic sample, free of the analyte(s) of interest. For example, in water analysis,
pure water is used for the blank. In chemical analysis, a blank is used to estimate the analytical
response to all factors other than the analyte in the sample. In general, blanks are used to assess
possible contamination or inadvertent introduction of analyte during various stages of the
sampling and analytical process. (USGS, 1998)
Calibration: The process of establishing the relationship between the response of a
measurement system and the concentration of the parameter being measured. (Ecology, 2004)
Check standard: A substance or reference material obtained from a source independent from
the source of the calibration standard; used to assess bias for an analytical method. This is an
obsolete term, and its use is highly discouraged. See Calibration Verification Standards, Lab
Control Samples (LCS), Certified Reference Materials (CRM), and/or spiked blanks. These are
all check standards, but should be referred to by their actual designator, e.g., CRM, LCS.
(Kammin, 2010; Ecology, 2004)
Comparability: The degree to which different methods, data sets and/or decisions agree or can
be represented as similar; a data quality indicator. (USEPA, 1997)
Completeness: The amount of valid data obtained from a project compared to the planned
amount. Usually expressed as a percentage. A data quality indicator. (USEPA, 1997)
Continuing Calibration Verification Standard (CCV): A QC sample analyzed with samples
to check for acceptable bias in the measurement system. The CCV is usually a midpoint
calibration standard that is re-run at an established frequency during the course of an analytical
run. (Kammin, 2010)

QAPP: Newaukum River - Page 69 – January 2018
Template Version 1.0, 10/07/2016
Control chart: A graphical representation of quality control results demonstrating the
performance of an aspect of a measurement system. (Kammin, 2010; Ecology 2004)
Control limits: Statistical warning and action limits calculated based on control charts. Warning
limits are generally set at +/- 2 standard deviations from the mean, action limits at +/- 3 standard
deviations from the mean. (Kammin, 2010)
Data integrity: A qualitative DQI that evaluates the extent to which a data set contains data that
is misrepresented, falsified, or deliberately misleading. (Kammin, 2010)
Data Quality Indicators (DQI): Commonly used measures of acceptability for environmental
data. The principal DQIs are precision, bias, representativeness, comparability, completeness,
sensitivity, and integrity. (USEPA, 2006)
Data Quality Objectives (DQO): Qualitative and quantitative statements derived from
systematic planning processes that clarify study objectives, define the appropriate type of data,
and specify tolerable levels of potential decision errors that will be used as the basis for
establishing the quality and quantity of data needed to support decisions.
(USEPA, 2006)
Data set: A grouping of samples organized by date, time, analyte, etc. (Kammin, 2010)
Data validation: An analyte-specific and sample-specific process that extends the evaluation of
data beyond data verification to determine the usability of a specific data set. It involves a
detailed examination of the data package, using both professional judgment, and objective
criteria, to determine whether the MQOs for precision, bias, and sensitivity have been met. It
may also include an assessment of completeness, representativeness, comparability and integrity,
as these criteria relate to the usability of the data set. Ecology considers four key criteria to
determine if data validation has actually occurred. These are:
Use of raw or instrument data for evaluation.
Use of third-party assessors.
Data set is complex.
Use of EPA Functional Guidelines or equivalent for review.
Examples of data types commonly validated would be:
Gas Chromatography (GC).
Gas Chromatography-Mass Spectrometry (GC-MS).
Inductively Coupled Plasma (ICP).
The end result of a formal validation process is a determination of usability that assigns
qualifiers to indicate usability status for every measurement result. These qualifiers include:
No qualifier, data is usable for intended purposes.
J (or a J variant), data is estimated, may be usable, may be biased high or low.
REJ, data is rejected, cannot be used for intended purposes (Kammin, 2010; Ecology, 2004).
QAPP: Newaukum River - Page 70 – January 2018
Template Version 1.0, 10/07/2016
Data verification: Examination of a data set for errors or omissions, and assessment of the Data
Quality Indicators related to that data set for compliance with acceptance criteria (MQOs).
Verification is a detailed quality review of a data set. (Ecology, 2004)
Detection limit (limit of detection): The concentration or amount of an analyte which can be
determined to a specified level of certainty to be greater than zero. (Ecology, 2004)
Duplicate samples: Two samples taken from and representative of the same population, and
carried through and steps of the sampling and analytical procedures in an identical manner.
Duplicate samples are used to assess variability of all method activities including sampling and
analysis. (USEPA, 1997)
Field blank: A blank used to obtain information on contamination introduced during sample
collection, storage, and transport. (Ecology, 2004)
Initial Calibration Verification Standard (ICV): A QC sample prepared independently of
calibration standards and analyzed along with the samples to check for acceptable bias in the
measurement system. The ICV is analyzed prior to the analysis of any samples. (Kammin,
2010)
Laboratory Control Sample (LCS): A sample of known composition prepared using
contaminant-free water or an inert solid that is spiked with analytes of interest at the midpoint of
the calibration curve or at the level of concern. It is prepared and analyzed in the same batch of
regular samples using the same sample preparation method, reagents, and analytical methods
employed for regular samples. (USEPA, 1997)
Matrix spike: A QC sample prepared by adding a known amount of the target analyte(s) to an
aliquot of a sample to check for bias due to interference or matrix effects. (Ecology, 2004)
Measurement Quality Objectives (MQOs): Performance or acceptance criteria for individual
data quality indicators, usually including precision, bias, sensitivity, completeness,
comparability, and representativeness. (USEPA, 2006)
Measurement result: A value obtained by performing the procedure described in a method.
(Ecology, 2004)
Method: A formalized group of procedures and techniques for performing an activity (e.g.,
sampling, chemical analysis, data analysis), systematically presented in the order in which they
are to be executed. (EPA, 1997)
Method blank: A blank prepared to represent the sample matrix, prepared and analyzed with a
batch of samples. A method blank will contain all reagents used in the preparation of a sample,
and the same preparation process is used for the method blank and samples. (Ecology, 2004;
Kammin, 2010)

QAPP: Newaukum River - Page 71 – January 2018
Template Version 1.0, 10/07/2016
Method Detection Limit (MDL): This definition for detection was first formally advanced in
40CFR 136, October 26, 1984 edition. MDL is defined there as the minimum concentration of
an analyte that, in a given matrix and with a specific method, has a 99% probability of being
identified, and reported to be greater than zero. (Federal Register, October 26, 1984)
Percent Relative Standard Deviation (%RSD): A statistic used to evaluate precision in
environmental analysis. It is determined in the following manner:
%RSD = (100 * s)/x
where s is the sample standard deviation and x is the mean of results from more than two
replicate samples. (Kammin, 2010)
Parameter: A specified characteristic of a population or sample. Also, an analyte or grouping
of analytes. Benzene and nitrate + nitrite are all “parameters.” (Kammin, 2010; Ecology, 2004)
Population: The hypothetical set of all possible observations of the type being investigated.
(Ecology, 2004)
Precision: The extent of random variability among replicate measurements of the same
property; a data quality indicator. (USGS, 1998)
Quality assurance (QA): A set of activities designed to establish and document the reliability
and usability of measurement data. (Kammin, 2010)
Quality Assurance Project Plan (QAPP): A document that describes the objectives of a
project, and the processes and activities necessary to develop data that will support those
objectives. (Kammin, 2010; Ecology, 2004)
Quality control (QC): The routine application of measurement and statistical procedures to
assess the accuracy of measurement data. (Ecology, 2004)
Relative Percent Difference (RPD): RPD is commonly used to evaluate precision. The
following formula is used:
[Abs(a-b)/((a + b)/2)] * 100
where “Abs()” is absolute value and a and b are results for the two replicate samples. RPD can
be used only with 2 values. Percent Relative Standard Deviation is (%RSD) is used if there are
results for more than 2 replicate samples (Ecology, 2004).
Replicate samples: Two or more samples taken from the environment at the same time and
place, using the same protocols. Replicates are used to estimate the random variability of the
material sampled. (USGS, 1998)
Representativeness: The degree to which a sample reflects the population from which it is
taken; a data quality indicator. (USGS, 1998)
Sample (field): A portion of a population (environmental entity) that is measured and assumed
to represent the entire population. (USGS, 1998)

QAPP: Newaukum River - Page 72 – January 2018
Template Version 1.0, 10/07/2016
Sample (statistical): A finite part or subset of a statistical population. (USEPA, 1997)
Sensitivity: In general, denotes the rate at which the analytical response (e.g., absorbance,
volume, meter reading) varies with the concentration of the parameter being determined. In a
specialized sense, it has the same meaning as the detection limit. (Ecology, 2004)
Spiked blank: A specified amount of reagent blank fortified with a known mass of the target
analyte(s); usually used to assess the recovery efficiency of the method. (USEPA, 1997)
Spiked sample: A sample prepared by adding a known mass of target analyte(s) to a specified
amount of matrix sample for which an independent estimate of target analyte(s) concentration is
available. Spiked samples can be used to determine the effect of the matrix on a method’s
recovery efficiency. (USEPA, 1997)
Split sample: A discrete sample subdivided into portions, usually duplicates (Kammin, 2010)
Standard Operating Procedure (SOP): A document which describes in detail a reproducible
and repeatable organized activity. (Kammin, 2010)
Surrogate: For environmental chemistry, a surrogate is a substance with properties similar to
those of the target analyte(s). Surrogates are unlikely to be native to environmental samples.
They are added to environmental samples for quality control purposes, to track extraction
efficiency and/or measure analyte recovery. Deuterated organic compounds are examples of
surrogates commonly used in organic compound analysis. (Kammin, 2010)
Systematic planning: A step-wise process which develops a clear description of the goals and
objectives of a project, and produces decisions on the type, quantity, and quality of data that will
be needed to meet those goals and objectives. The DQO process is a specialized type of
systematic planning. (USEPA, 2006)
References for QA Glossary
Ecology, 2004. Guidance for the Preparation of Quality Assurance Project Plans for
Environmental Studies. https://fortress.wa.gov/ecy/publications/SummaryPages/0403030.html
Kammin, B., 2010. Definition developed or extensively edited by William Kammin, 2010.
Washington State Department of Ecology, Olympia, WA.
USEPA, 1997. Glossary of Quality Assurance Terms and Related Acronyms. U.S.
Environmental Protection Agency.
https://www.ecology.wa.gov/About-us/How-we-operate/Scientific-services/Quality-assurance
USEPA, 2006. Guidance on Systematic Planning Using the Data Quality Objectives Process
EPA QA/G-4. U.S. Environmental Protection Agency.
http://www.epa.gov/quality/qs-docs/g4-final.pdf
USGS, 1998. Principles and Practices for Quality Assurance and Quality Control. Open-File
Report 98-636. U.S. Geological Survey. http://ma.water.usgs.gov/fhwa/products/ofr98-636.pdf

QAPP: Newaukum River - Page 73 – January 2018
Template Version 1.0, 10/07/2016
Appendix B. Watershed Health Assessment Metrics
Table B-1. Watershed health data matrix and associated metrics.
Matrix
Metric
Category Metric Name Units Method Description
Soli
d/S
edim
ent
Large
Woody
Debris
LWDPieces count Large woody debris count per site of all pieces
LWDPieces100m /100
m Large woody debris count per 100 m of all pieces
LWDSiteVolume m3 Large woody debris volume per site of all pieces
LWDSiteVolume100m m3/1
00m Large woody debris volume per 100 m of all pieces
LWDVolumeMSq m3/m
2
Large woody debris volume per square meter of
bankfull channel surface area of all pieces
Bed
Stability
Dgm mm Geometric mean substrate diameter
DgmLog10 None Log10 estimated geometric mean substrate diameter
LRBS None Log-transformed Relative Bed stability
RBS None
index, of the influence of human disturbance on
stream sediments, as the ratio of bed surface
geometric mean particle diameter (Dgm) divided by
estimated critical diameter (Dcbf) at bankfull flow,
based on a modified Shield criterion for incipient
motion (Kaufmann et al., 2008).
Substrate
PCT Bedrock %
PCT Bedrock - Percent of all transects in a site with a
substrate size class of Bedrock (smooth) or Bedrock
(rough)
PCT BedrockR % PCT Bedrock Rough - Percent of all transects in a
site with a substrate size class of Bedrock (rough)
PCT BedrockS % PCT Bedrock Smooth - Percent of all transects in a
site with a substrate size class of Bedrock (smooth)
PCT Boulder % PCT Boulder - Percent of all transects in a site with a
substrate size class of Large boulder or Small boulder
PCT BoulderL % PCT Boulder Large - Percent of all transects in a site
with a substrate size class of Large boulder
PCT BoulderS % PCT Boulder Small - Percent of all transects in a site
with a substrate size class of Small boulder
PCT Cobble % PCT Cobble - Percent of all transects in a site with a
substrate size class of Cobble
PCT Fines % PCT Fines - Percent of all transects in a site with a
substrate size class of Silt/Clay
PCT GravelC % PCT Gravel Coarse - Percent of all transects in a site
with a substrate size class of Course Gravel
PCT GravelCx %
PCT Gravel Coarse/Above - Percent of all transects
in a site with a substrate size class of: Course gravel,
Cobble, Small boulder, Large boulder,
Concrete/asphalt, Bedrock (smooth) or Bedrock
(rough)
PCT GravelF % PCT Gravel Fine - Percent of all transects in a site
with a substrate size class of Fine gravel

QAPP: Newaukum River - Page 74 – January 2018
Template Version 1.0, 10/07/2016
Matrix
Metric
Category Metric Name Units Method Description
Soli
d/S
edim
ent
Substrate
PCT GravelFb %
PCT Gravel Fine/Below - Percent of all transects in a
site with a substrate size class of Fine gravel, Sand or
Silt/Clay
PCT Hardpan % PCT Hardpan - Percent of all transects in a site with a
substrate size class of Hardpan
PCT Other % PCT Other - Percent of all transects in a site with a
substrate size class of Other
PCT Pavement % PCT Pavement - Percent of all transects in a site with
a substrate size class of Concrete/asphalt
PCT Sand % PCT Sand - Percent of all transects in a site with a
substrate size class of Sand
PCT SandFines % PCT Sand/Fines - Percent of all transects in a site
with a substrate size class of Sand or Silt/Clay
PCT Wood % PCT Wood - Percent of all transects in a site with a
substrate size class of Wood (any size)
X Embed % PCT Embeddedness All - Mean embeddedness for a
site [normally n = 121 for waded streams]
X EmbedCenter % PCT Embeddedness Mid - Mean embeddedness for a
site, mid-channel
Riparian
Cover
X DensioBank %
average as summation of densiometer readings on left
and right banks of each cross-channel transect per
DCE, as Center left, Center right, Center upstream,
Center downstream, for all observations within the
site reach, divided by the number of readings.
X DensioCenter %
average as summation of densiometer readings on left
and right banks of each cross-channel transect per
DCE, as Center left, Center right, Center upstream,
Center downstream, for all observations within the
site reach, divided by the number of readings.
Hab
itat
Riparian
Vegetation
Structure
IDX Canopy %
average, per DCE, as summation of categorical
vegetative cover ratings, as contributed by large and
small trees, on left and right banks of each cross-
channel transect, for all observation within the site
reach, divided by the total number of observations.
IDX CanopyLT %
average per DCE as summation of categorical
vegetative cover ratings, as contributed by large trees,
on left and right banks of each cross-channel transect,
as one reading per bank per transect, for all
observation within the site reach, divided by the total
number of observations.
(table continued on next page)

QAPP: Newaukum River - Page 75 – January 2018
Template Version 1.0, 10/07/2016
Matrix
Metric
Category Metric Name Units Method Description
Hab
itat
Riparian
Vegetation
Structure
IDX CanopyST
%
average per DCE as summation of categorical
vegetative cover ratings, as contributed by small
trees, on left and right banks of each cross-channel
transect, as one reading per bank per transect, for all
observation within the site reach, divided by the total
number of observations.
IDX CanUnderstory
%
average, per DCE, as summation of categorical
vegetative cover ratings, as contributed by two
vegetation layers (overstory and understory) at left
bank and right bank for each cross-channel transect,
for all observations within the site reach, divided by
total number of observations.
IDX
CanUnderstoryGnd
%
average, per DCE, as summation of categorical
vegetative cover ratings, as contributed by three
vegetation layers (overstory, understory,
groundcover), at left bank and right bank for each
cross-channel transect, for all observations within the
site reach, divided by total number of observations.
IDX
CanUnderstoryWood
%
average, per DCE, as summation of categorical
vegetative cover ratings, as contributed by two
vegetation layers (overstory and woody understory)
at left bank and right bank for each cross-channel
transect, for all observations within the site reach,
divided by total number of observations.
IDX
CanUnderstoryWoodG
ndWood
%
average, per DCE, as summation of categorical
vegetative cover ratings, as contributed by three
vegetation layers (overstory, woody understory,
woody groundcover), at left bank and right bank for
each cross-channel transect, for all observations
within the site reach, divided by total number of
observations.
IDX Ground
%
average, per DCE, as summation of categorical
vegetative cover ratings, as contributed by woody and
herbaceous vegetation >0.5 m to <5 m in height, on
left and right banks of each cross-channel transect,
for all observation within the site reach, divided by
the total number of observations.
IDX GroundBare
%
average per DCE as summation of categorical cover
ratings, as contributed by exposed mineral soil and
litter, on left and right banks of each cross-channel
transect, as one reading per bank per transect, for all
observation within the site reach, divided by the total
number of observations.
IDX GroundHerb
%
average per DCE as summation of categorical
vegetative cover ratings, as contributed by
herbaceous vegetation <0.5 m in height, on left and
right banks of each cross-channel transect, as one
reading per bank per transect, for all observation
within the site reach, divided by the total number of
observations.
IDX GroundWood
%
average per DCE as summation of categorical
vegetative cover ratings, as contributed by woody
vegetation <0.5 m in height, on left and right banks of
each cross-channel transect, as one reading per bank

QAPP: Newaukum River - Page 76 – January 2018
Template Version 1.0, 10/07/2016
Matrix
Metric
Category Metric Name Units Method Description
per transect, for all observation within the site reach,
divided by the total number of observations.
IDX Understory
%
average, per DCE, as summation of categorical
vegetative cover ratings, as contributed by woody and
herbaceous understory >0.5 m to <5 m in height, on
left and right banks of each cross-channel transect,
for all observation within the site reach, divided by
the total number of observations.
IDX UnderstoryHerb
%
average per DCE as summation of categorical cover
ratings, as contributed by herbaceous vegetation > 0.5
m and < 5 m in height, on left and right banks of each
cross-channel transect, as one reading per bank per
transect, for all observation within the site reach,
divided by the total number of observations.
IDX UnderstoryWood
%
average per DCE as summation of categorical cover
ratings, as contributed by woody vegetation > 0.5 m
and < 5 m in height, on left and right banks of each
cross-channel transect, as one reading per bank per
transect, for all observation within the site reach,
divided by the total number of observations.
PPN Canopy
None
proportion as count of presence of overstory
vegetation, as contributed by large and small trees, at
left bank and right bank for each cross-channel
transect, per DCE, for all observations within the site
reach, divided by total number of observations.
Hab
itat
Channel
Dimensions
Site Length m
length, per DCE, of the site reach of the main channel
(channel 0) which was measured and surveyed
m
length, per DCE, of the site reach of the main channel
(channel 0) which was measured and surveyed
ResPoolArea
m2
summation, as total vertical cross-sectional area of
residual pools intersected by the thalweg profile as
observed along the site reach, where incremental
cross sectional areas are approximated as (residual
pool depth per thalweg station X thalweg increment).
ResPoolArea100
cm
average, vertical cross-sectional area of residual
pools, as observed along the site reach, per 100 m of
site reach
TWIncrement
m
distance, per DCE, between thalweg stations along
the site reach of the main channel (channel 0) which
was measured and surveyed
X BF WxD
m2
average, per DCE, of paired cross section
calculations, as Bankfull_Width x Bankfull_Depth,
associated with the main channel (channel 0), where
Bankfull_Depth =
Avg_Bankfull_Height+Thalweg_Depth
X BFDepth
cm
Site average Bankfull Depth - Sum of
SiteAverageThalwegDepth and
SiteAverageBankfulHeight. Bankfull depth is vertical
distance between substrate in deepest part of the
channel and bankfull stage height.
X BFHeight cm
Site Average Bankfull Height - Bankfull height
averaged across all transects at a site
X BFWidth m
average, per DCE, sum of bankfull width
observations for the main channel (channel ) divided

QAPP: Newaukum River - Page 77 – January 2018
Template Version 1.0, 10/07/2016
Matrix
Metric
Category Metric Name Units Method Description
by count of bankfull-width observations, for the site
reach.
X Slope
%
estimated elevational change between upstream and
downstream ends of a site reach as observed during a
DCE, derived from a DEM
X TWDepth cm
Site Average Thalweg Depth - Average of thalweg
depth from all Thalweg stations at a site
X Wet WxD
m2
average, per DCE, of paired cross section
calculations, as Bankfull_Width x Bankfull_Depth,
associated with the main channel (channel 0), where
Bankfull_Depth =
Avg_Bankfull_Height+Thalweg_Depth
X WetWidth
m
average, per DCE, as sum of total wetted width
observations for the main channel (channel 0) divided
by count of wetted width observations, for the site
reach.
Sinuosity
None
index, per DCE, of deviation from the straight-line,
point-to-point distance between the upper and lower
ends of the site reach.
Bankfull Area m2
(table continued on next page)

QAPP: Newaukum River - Page 78 – January 2018
Template Version 1.0, 10/07/2016
Matrix
Metric
Category Metric Name Units Method Description
Hab
itat
Fish Cover
XFC
Bryophytes %
XFC Bryophytes - Percent fish cover provided by
bryophytes, averaged for all transects in a site
XFC LWD %
XFC Large Woody Debris - Percent fish cover
provided by large woody debris, averaged for all
transects in a site
XFC
Macrophytes %
XFC Macrophytes - Percent fish cover provided by
macrophytes, averaged for all transects in a site
XFC Natural %
XFC Natural Types - Percent fish cover provided by
all natural cover types, averaged for all transects in a
site
XFC NoAqVeg %
XFC All Types Except Aqua Veg - Percent fish cover
provided by all cover types except aquatic vegetation,
averaged for all transects in a site
XFC OvHgVeg %
XFC Overhanging Vegetation - Percent fish cover
provided by overhanging vegetation, averaged for all
transects in a site
XFC Persistent %
XFC BigTypes - Percent fish cover provided by all
large cover types, averaged for all transects in a site
XFC
TreesRoots %
XFC Live Trees/Roots - Percent fish cover provided
by live trees or roots, averaged for all transects in a
site
XFC Undercut %
XFC Undercut Banks - Percent fish cover provided
by undercut banks, averaged for all transects in a site
Riparian
Disturbance
PCT BankAg %
percent disturbance, per DCE, as sum of weighted
proximity of agricultural human influence types, if
any, observed within or on the banks (L & R) of the
main channel (channel 0), along the site reach,
divided by N HumanInfluence.
PCT BankAny %
percent disturbance, per DCE, as sum of weighted
proximity of all human influence types, if any,
observed within or on the banks (L & R) of the main
channel (channel 0), along the site reach, divided by
N HumanInfluence.
PCT CloseAg %
percent disturbance proximity, per DCE, as count of
plots where at least one agricultural human influence-
type score was >1, divided by count of rated plots
associated with the main channel along the site reach.
PCT CloseAny %
percent disturbance proximity, per DCE, as count of
plots where at least one human influence-type score
was >1, divided by count of rated plots associated
with the main channel along the site reach.