Embed Size (px)
Citation preview
Quality Assurance Project Plan Sampling of Pretreated Industrial Wastewater in Northwestern Washington State
November 2020 Publication 20-03-119
Publication Information Each study conducted by the Washington State Department of Ecology must have an approved Quality Assurance Project Plan (QAPP). The plan describes the objectives of the study and the procedures to be followed to achieve those objectives. After completing the study, Ecology will post the final report of the study to the Internet.
This Quality Assurance Project Plan is available on Ecology’s website at https://fortress.wa.gov/ecy/publications/SummaryPages/2003119.html
Data for this project are available in Ecology’s EIM Database. Study ID: SWON0002.
The Activity Tracker Code for this study is 20-022.
This QAPP was written using QAPP Template Version 1.0. Revision date: 8/27/2018.
Contact Information
Publications Coordinator Environmental Assessment Program P.O. Box 47600, Olympia, WA 98504-7600 Phone: (360) 407-6764
Washington State Department of Ecology – https://ecology.wa.gov • Headquarters, Olympia 360-407-6000 • Northwest Regional Office, Bellevue 425-649-7000 • Southwest Regional Office, Olympia 360-407-6300 • Central Regional Office, Union Gap 509-575-2490 • Eastern Regional Office, Spokane 509-329-3400
Any use of product or firm names in this publication is for descriptive purposes only and does not imply endorsement by the author or the Department of Ecology.
To request ADA accommodation for disabilities or printed materials in a format for the visually impaired, call the Ecology ADA Coordinator at 360-407-6831 or visit https://ecology.wa.gov/accessibility. People with impaired hearing may call Washington Relay Service at 711. People with speech disability may call TTY at 877-833-6341.
Page 1
Quality Assurance Project Plan
Sampling of Pretreated Industrial Wastewater
in Northwestern Washington State November 2020
Approved by:
Signature: Date: Maia Hoffman, Client, Water Quality Program, Northwest Regional Office Signature: Date: Rachel McCrea, Client’s Section Manager, Water Quality Program, Northwest Regional Office
Signature: Date: Siana Wong, Author / Project Manager, EAP Signature: Date: James Medlen, Author’s Unit Supervisor, EAP Signature: Date: Jessica Archer, Author’s Section Manager, EAP Signature: Date: Alan Rue, Director, Manchester Environmental Laboratory, EAP Signature: Date: Arati Kaza, Ecology Quality Assurance Officer
Signatures are not available on the Internet version. EAP: Environmental Assessment Program
Page 2
1.0 Table of Contents Page
List of Figures .....................................................................................................................4
List of Tables ......................................................................................................................4
2.0 Abstract ...................................................................................................................5
3.0 Background ............................................................................................................5 3.1 Introduction and problem statement ............................................................5 3.2 Study area and surroundings ........................................................................6
3.2.1 History of study area ........................................................................6 3.2.2 Summary of previous studies and existing data ..............................7 3.2.3 Parameters of interest and potential sources ...................................8 3.2.4 Regulatory criteria or standards ....................................................12
4.0 Project Description ..............................................................................................13 4.1 Project goals ...............................................................................................13 4.2 Project objectives .......................................................................................13 4.3 Information needed and sources ................................................................13 4.4 Tasks required ............................................................................................13 4.5 Systematic planning process ......................................................................13
5.0 Organization and Schedule .................................................................................14 5.1 Key individuals and their responsibilities ..................................................14 5.2 Special training and certifications ..............................................................14 5.3 Organization chart ......................................................................................14 5.4 Proposed project schedule ..........................................................................15 5.5 Budget and funding ....................................................................................15
6.0 Quality Objectives ................................................................................................17 6.1 Data quality objectives ..............................................................................17 6.2 Measurement quality objectives ................................................................17
6.2.1 Targets for precision, bias, and sensitivity ....................................17 6.2.2 Targets for comparability, representativeness, and completeness 22
6.3 Acceptance criteria for quality of existing data .........................................22 6.4 Model quality objectives ............................................................................22
7.0 Study Design .........................................................................................................23 7.2 Field data collection ...................................................................................23
7.2.1 Sampling locations and frequency .................................................23 7.2.2 Field parameters and laboratory analytes to be measured..............23
7.1 Study boundaries ........................................................................................25 7.3 Modeling and analysis design ....................................................................26 7.4 Assumptions underlying design .................................................................26 7.5 Possible challenges and contingencies .......................................................26
7.5.1 Logistical problems ........................................................................26 7.5.2 Practical constraints........................................................................26 7.5.3 Schedule limitations .......................................................................26
8.0 Field Procedures...................................................................................................26 8.1 Invasive species evaluation ........................................................................26
Page 3
8.2 Measurement and sampling procedures .....................................................26 8.3 Containers, preservation methods, holding times ......................................30 8.4 Equipment decontamination ......................................................................31 8.5 Sample ID ..................................................................................................31 8.6 Chain of custody ........................................................................................32 8.7 Field log requirements ...............................................................................32 8.8 Other activities ...........................................................................................32
9.0 Laboratory Procedures .......................................................................................32 9.1 Lab procedures table ..................................................................................32 9.2 Sample preparation method(s) ...................................................................32 9.3 Special method requirements .....................................................................32 9.4 Laboratories accredited for methods ..........................................................32
10.0 Quality Control Procedures ................................................................................34 10.1 Table of field and laboratory quality control .............................................34 10.2 Corrective action processes ........................................................................35
11.0 Data Management Procedures ............................................................................36 11.1 Data recording and reporting requirements ...............................................36 11.2 Laboratory data package requirements ......................................................36 11.3 Electronic transfer requirements ................................................................36 11.4 EIM/STORET data upload procedures ......................................................36 11.5 Model information management ................................................................36
12.0 Audits and Reports ..............................................................................................36 12.1 Field, laboratory, and other audits .............................................................36 12.2 Responsible personnel ...............................................................................36 12.3 Frequency and distribution of reports ........................................................37 12.4 Responsibility for reports ...........................................................................37
13.0 Data Verification ..................................................................................................37 13.1 Field data verification, requirements, and responsibilities ........................37 13.2 Laboratory data verification .......................................................................37 13.3 Validation requirements, if necessary ........................................................37 13.4 Model quality assessment ..........................................................................37
14.0 Data Quality (Usability) Assessment ..................................................................38 14.1 Process for determining project objectives were met ................................38 14.2 Treatment of non-detects ...........................................................................38 14.3 Data analysis and presentation methods ....................................................38 14.4 Sampling design evaluation .......................................................................38 14.5 Documentation of assessment ....................................................................38
15.0 References .............................................................................................................39
16.0 Appendices ............................................................................................................42 Appendix A. Checklist for Communicating Project Requirements for Validation of Contract Lab Data Packages for Organics Analyses. ......................42 Appendix B. Glossaries, Acronyms, and Abbreviations .......................................44
Page 4
List of Figures Page
Figure 1. Map of study area boundaries.............................................................................25
List of Tables Table 1. Organization of project staff and responsibilities. ...............................................14
Table 2. Proposed schedule................................................................................................15
Table 3. Estimated laboratory cost.....................................................................................15
Table 4. Breakdown of laboratory budget by parameter and number of samples. ............16
Table 5. Measurement quality objectives for laboratory analyses of water samples. ........18
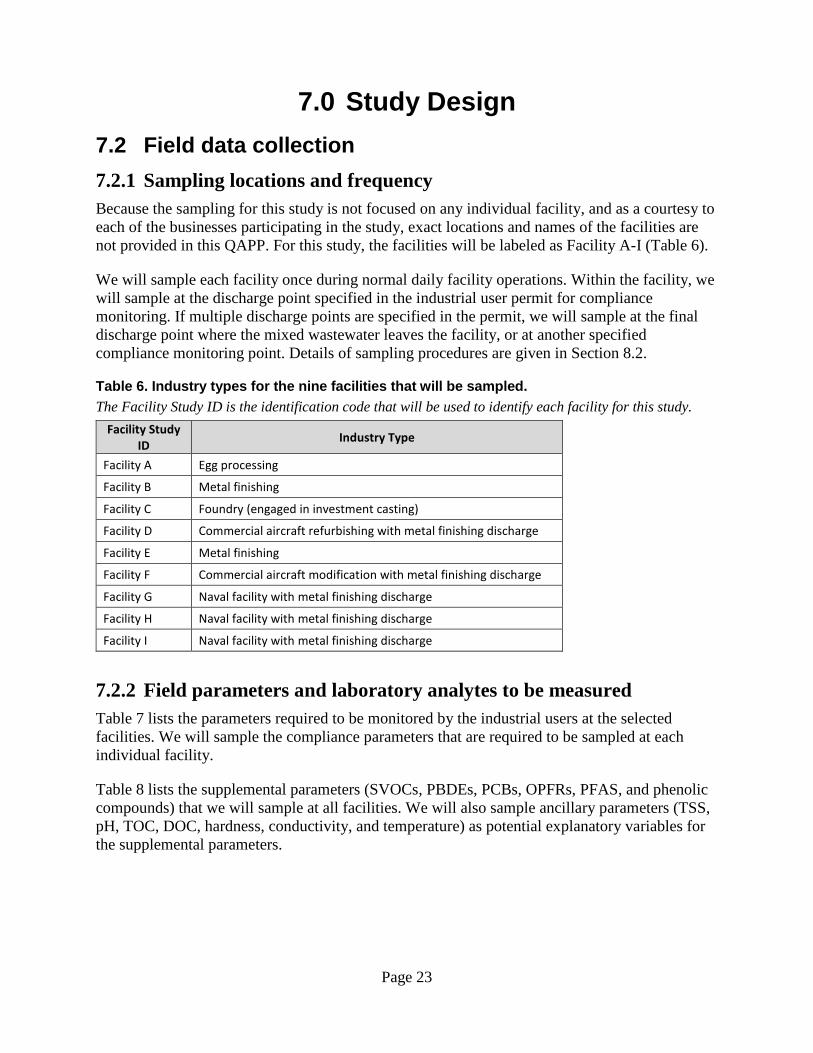
Table 6. Industry types for the nine facilities that will be sampled. ..................................23
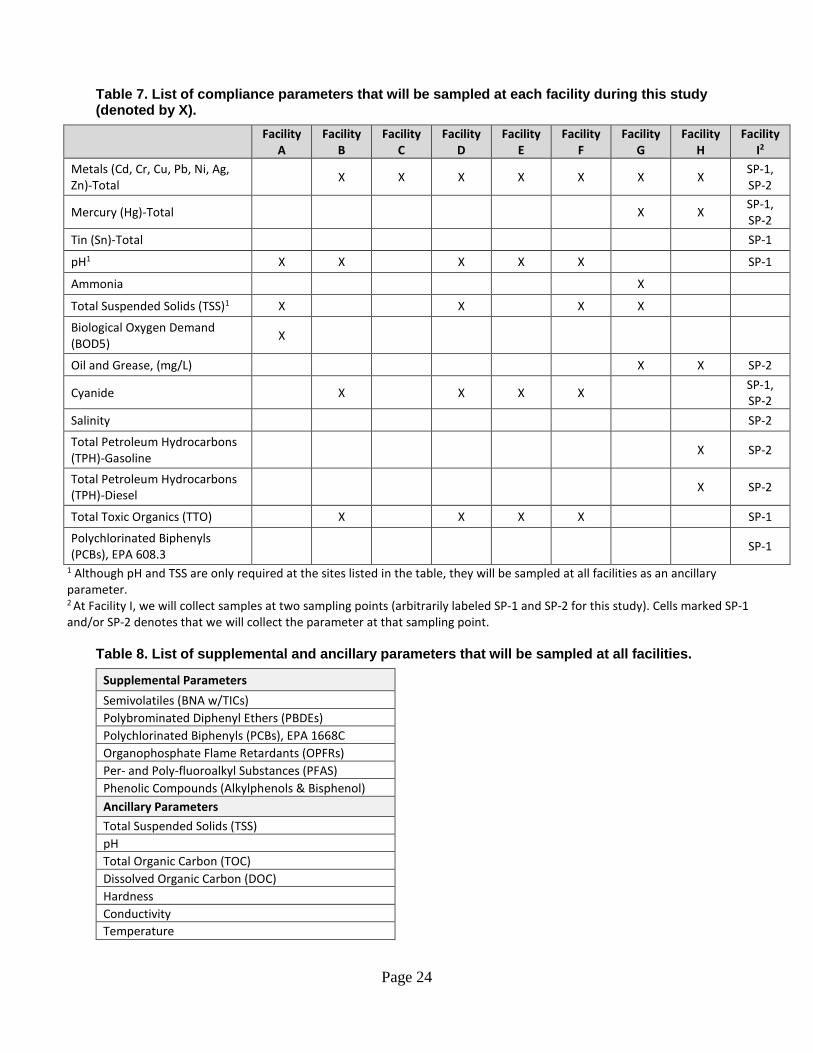
Table 7. List of compliance parameters that will be sampled at each facility during this study. ..................................................................................................................24
Table 8. List of supplemental and ancillary parameters that will be sampled at all facilities ..............................................................................................................24
Table 9. Field methods that will be used to sample each parameter at each facility. ........28
Table 10. Sample containers, preservation, and holding times for parameters that will be analyzed from wastewater effluent samples. .................................................30
Table 11. Measurement methods (laboratory). ..................................................................33
Table 12. Quality control samples, types, and frequency. .................................................34
Page 5
2.0 Abstract The objective of this project is to analyze a suite of conventional and toxic chemicals in samples collected from pretreated industrial wastewater from nine industrial facilities in the Puget Sound region. The selected facilities operate under State Waste Discharge permits to discharge pretreated wastewater to a publicly owned treatment works (POTW). The Washington State Department of Ecology will visit each facility once to collect water samples.
The main purpose of this project is to conduct compliance monitoring required under the National Pretreatment Program, a component of the National Pollutant Discharge Elimination System (NPDES) program.
The second purpose is to screen for supplemental parameters that are not required to be monitored in order to advance research on chemicals of emerging concern (CECs) and other lesser studied chemicals. These pollutants can make their way to POTWs and, ultimately, to the Puget Sound. The supplemental parameters include organophosphate flame retardants (OPFRs), per- and poly-fluoroalkyl substances (PFAS), phenolic compounds, polybrominated diphenyl ethers (PBDEs), polychlorinated biphenyls (PCBs), and semivolatile organic compounds (SVOCs).
This project supports efforts to protect and improve water quality in the Puget Sound, which plays a vital role in maintaining the region’s ecological and economic health.
3.0 Background 3.1 Introduction and problem statement Wastewater treatment plays an important role in ensuring that our surface waters are clean for public health and aquatic wildlife. Wastewaters from homes and industries in urban environments are typically conveyed to a wastewater treatment plant, also referred to as a publicly owned treatment works (POTW). A POTW collects, transports, and treats domestic, commercial, and industrial wastewaters prior to discharging treated wastewater to surface water or groundwater in accordance with water quality permit conditions.
POTWs are designed to treat wastewaters through primary, secondary, and sometimes tertiary treatment processes. Through these treatment processes, solids, organic matter, and harmful organisms are removed from the wastewaters before the wastewaters can be safely discharged to the receiving water. However, POTWs are not intentionally designed to remove many types of pollutants that may be conveyed to the POTW from an industrial facility. Such pollutants may interfere with a POTW’s operation, or pass through the POTW untreated. In many cases, while the POTW reduces pollutant concentrations, the chemical of concern may still be present at low concentrations in the treated discharge. Therefore, wherever possible, the Washington State Department of Ecology (Ecology) emphasizes controlling pollution at its source through product replacement or pretreatment.
The National Pretreatment Program—a component of the National Pollutant Discharge Elimination System (NPDES) program—was established with the goals of helping protect water
Page 6
quality of the nation’s surface waters, as well as infrastructure at the nation’s POTWs (EPA 1999). Pretreatment refers to the treatment of industrial or commercial wastewater prior to its discharge to a POTW. Under a pretreatment program, an industrial or commercial facility that discharges to a POTW (an industrial user) must comply with specific pretreatment requirements and standards as outlined in the industrial user’s State Waste Discharge permit, or pretreatment permit. This typically includes routine self-monitoring and reporting of water quality, following specific best management practices, and complying with prohibited discharge rules. It is the responsibility of the overseeing authority to ensure compliance through monitoring or inspection. For the purposes of this study, Ecology is the overseeing authority.
In the Puget Sound, protecting the quality of fresh and marine waters is vital for the health of the region’s population, economy, quality of life, and iconic wildlife. The Puget Sound Partnership is the state agency that has been leading the region’s efforts to restore and protect the Puget Sound. It identified the reduction of toxic chemicals entering the Puget Sound as a top priority. This includes research to better understand sources, transport, and fate of toxics to the Puget Sound (Norton et al. 2011), especially those regarded as chemicals of emerging concern (CECs) (Roberts 2017). POTWs represent potential pathways of pollutants into the Puget Sound (Ecology and Herrera Environmental Consultants, Inc. 2010). Understanding the sources of different types and magnitudes of toxic chemicals that enter POTWs is an important part of addressing toxic chemicals to the Puget Sound.
In this study, Ecology’s Environmental Assessment Program (EAP) will sample pretreated wastewater effluent for a suite of water quality parameters and toxic contaminants from nine Ecology-permitted industrial facilities in the Puget Sound region. The main purpose is to conduct the compliance monitoring that is required under the pretreatment program. We will also screen the presence and concentration ranges of supplemental parameters in pretreated wastewater effluent, including some CECs. These chemicals include organophosphate flame retardants (OPFRs), per- and poly-fluoroalkyl substances (PFAS), phenolic compounds, polybrominated diphenyl ethers (PBDEs), polychlorinated biphenyls (PCBs), and semivolatile organic compounds (SVOCs).
3.2 Study area and surroundings The geographic focus for this study is the Puget Sound watershed. The entire watershed covers over 12,000 square miles and is contained within 14 of Washington’s 39 counties. The region’s climate is largely driven by its topography. The wet season is from October to early spring, with about 75% of the region’s precipitation occurring during this time (Rice et al. 2015).
The facilities that will be sampled for this project all discharge to POTWs that discharge treated wastewaters to the Puget Sound. A description of the general location and industry type for each of the facilities is provided in Section 7.1.
3.2.1 History of study area Industrial centers in the Puget Sound arose during the late 1800s and early 1900s. During World War II, the Puget Sound became a major center of manufacturing, military staging, and transportation infrastructure expansion. Major industries of the Puget Sound today are the region’s ports, aerospace, information technology, and fish and seafood processing.
Page 7
Local environmental issues include declines in water quality and animal species in the Puget Sound. About 525 of the Puget Sound watershed’s streams, rivers, lakes, and marine water bodies are listed as impaired under Section 303(d) of the Clean Water Act (Rice et al. 2015). Four salmonids (chinook, chum, steelhead, bull trout) are listed as federally threatened, and the iconic Southern Resident killer whale is listed as federally endangered under the Endangered Species Act. Zier and Gaydos (2016) estimated that as of December 2015, there were 125 “species at risk” (those warranting special attention to ensure their conservation) that inhabit or use the Salish Sea.
The region’s rapidly growing population is expected to place additional pressures on environmental issues. The Puget Sound’s shoreline counties account for about 68% of the state’s total population, or over 4.7 million people. By 2030, Puget Sound’s population is expected to increase to over 5.7 million (Rice et al. 2015).
In 2018, the Southern Resident Killer Whale (Orca) Task Force was created to develop a plan for orca recovery. Both the Orca Task Force and Puget Sound Partnership recommend addressing the issue of toxic contaminants as part of the plan to recover the orca whale and the Puget Sound it inhabits.
3.2.2 Summary of previous studies and existing data Compliance Parameters Industrial users characterize their wastewater as part of their permit application, and conduct their own routine monitoring of specific parameters as required by the permit. Parameters to be sampled vary based on the industrial processes and chemicals used at the industrial facility. The industrial user submits monitoring data and reports to Ecology. Any occurrences of noncompliance are handled as outlined in the permit.
The overseeing authority conducts compliance assurance activities, including inspections. Ecology has not been able to routinely conduct independent verification sampling as part of these inspections.
Supplemental Parameters Much work has been done to gather information on the presence of toxic chemicals in the Puget Sound. Stormwater runoff is well recognized as a major player in carrying toxic chemicals to the Puget Sound (Norton et al. 2011, Roberts 2017). POTWs also represent important pathways of toxics to the Sound (Ecology and Herrera Environmental Consultants, Inc. 2010). For example, studies have shown that conventional wastewater treatment does not effectively remove chemicals such as PBDEs and PFAS (North 2004, Clara et al. 2008). In the Puget Sound, about 25–38% of the PBDE loadings is estimated to be from POTWs, the second largest pathway of PBDEs after atmospheric deposition (Norton et al. 2011).
While previous research has examined toxic chemicals from the influent and effluent of POTWs themselves, published studies examining a range of toxic chemicals in pretreated industrial wastewater were not found. Data collection from various pretreated industrial wastewater effluent will provide useful information about the types of toxic chemicals and source categories as inputs to the POTW.
Page 8
3.2.3 Parameters of interest and potential sources A suite of parameters will be collected and analyzed for this study. The first group, compliance parameters, are routinely monitored by the industrial user as required under their permit and will be collected as Ecology’s verification sampling. The second group, to be used for research purposes, consists of supplemental parameters that are of interest as CECs, or because of the limited information about them. A brief description of each parameter is given below.
Compliance Parameters Metals-Priority Pollutants Cadmium (Cd), chromium (Cr), copper (Cu), lead (Pb), mercury (Hg), nickel (Ni), silver (Ag), and zinc (Zn) are among the metals that will be sampled in this study.
Trace amounts of some types of metals occur naturally in the environment and may be important for physiological processing (e.g., Cu, Cr, and Zn). However, excess amounts of these metals can be toxic to aquatic organisms and to human health. Metals such as Hg and Pb are toxic and have no health benefits at trace concentrations. Toxic effects include damage to the kidneys, nervous system, and induction of tumors (Masters 1998).
Sources of metal pollution include various industrial and manufacturing processes or products such as: smelting (Cd); chrome plating, ceramic, and textile glass (Cr); batteries, piping, paints, petrol additives (Pb); chlorine or soda production, pharmaceuticals, mirror coatings, lamps, fungicides (Hg). For this study, industries which perform metal finishing will be sampled.
For this project, we will sample the total form of metals. The total form includes both dissolved and particulate factions in the effluent. Most regulations use total metals because it is more conservative and protective.
Total Suspended Solids Total suspended solids (TSS) include silt, clay, plankton, organic matter, and other particulates greater than about two microns in diameter. The presence of TSS can lead to higher levels of turbidity, impairing water clarity and quality. High amounts of TSS can clog pipes and interfere with the operation of wastewater treatment plants. High levels of TSS can also relate to high levels of toxic chemicals which cling to the suspended particulates. Sources of TSS include industrial discharges, sewage, runoff, and soil erosion.
For this project, TSS monitoring is required at four of the facilities. However, we will sample TSS at all facilities as an ancillary parameter because it can provide useful information about the nature of the effluent, and potentially help explain resulting concentrations of supplemental parameters.
Biological Oxygen Demand Biological Oxygen Demand (BOD) refers to the total amount of oxygen required by microorganisms to oxidize matter in the presence of oxygen. It is typically measured as BOD5—the amount of oxygen consumed by microorganisms in the first five days. The higher the BOD in the water (i.e., the more oxidize-able organic wastes available to reduce oxygen levels in the water), the less oxygen is available for other aquatic organisms.
Page 9
Food processing operations commonly generate wastewater that contain oxygen-demanding organic wastes. Thus, wastewater from these operations commonly need to be managed to prevent high levels of BOD. For this project, BOD will be sampled at one food processing facility.
Total Petroleum Hydrocarbons Total petroleum hydrocarbons (TPH) refers to any mixture of the hundreds of hydrocarbon compounds originating from crude oil, which is used to make petroleum products. The types of compounds that comprise TPH may include hexane, jet fuels, mineral oils, benzene, toluene, xylenes, naphthalene, fluorine, and other petroleum products and gasoline compounds.
Sources of TPH include industries that are involved with extracting and refining crude oil, or manufacturing or using petroleum products. Excess exposure to TPH can affect the central nervous system, lungs, immune system, skin and eyes, and blood (ATSDR 1999).
For this project, TPH will be sampled at two facilities representing the military and metal finishing sectors.
Total Toxic Organics Total toxic organics (TTO) is the sum of the masses or concentrations of specific toxic organic compounds that have concentrations greater than 0.01 mg/L (EPA 1985). In the case of implementing pretreatment standards, the specific compounds to be summed depends on the categorical industry, as regulated by 40 CFR 403-471. An example of the types of chemicals comprising TTO include vinyl chloride, bromomethane, chloroethane, and benzene.
Sources of TTO include various industrial manufacturing processing, including electroplating, metal finishing, electrical components, copper and aluminum forming, and coil coating. Exposure to high levels of TTO include effects to the nervous system (e.g., nausea, drowsiness, and headaches), liver, skin, lungs, and reproductive system.
TTO is an effective parameter to regulate complex matrices found in industrial wastewater. For this project, TTO will be sampled at five facilities representing the metal finishing and military sectors.
Cyanide Cyanide is a chemical compound consisting of triple-bonded carbon and nitrogen atom. Human uses of cyanide are in the form of hydrogen cyanide, potassium cyanide, and sodium cyanide. The compounds are used in industrial and manufacturing processes such as electroplating, metallurgy, synthesis of organic chemicals, photographic developing, plastics manufacturing, fumigation of ships, and metal mining processes (ATSDR 2006). Exposure to harmful levels of cyanide gas can affect the central and peripheral nervous systems, and lead to breathing difficulties, chest pain, vomiting, and headaches (ATSDR 2006).
For this project, cyanide will be sampled at five facilities representing the metal finishing and military sectors.
Page 10
Oil and Grease Oil and grease refers to oils, waxes, fats, and related materials. Sources include manufacturing and food processes that involve lubricating oils, waxes, kerosene, animal fats, vegetable oils, soaps, and grease. If not removed, oil and grease can affect aquatic life and water quality by depleting oxygen and creating surface films in the water. They can also clog pipes and interfere with POTW operations.
For this project, oil and grease will be sampled at three facilities representing the metal finishing and military sectors.
Ammonia Ammonia is a nutrient containing nitrogen and hydrogen. The sum of its unionized form (NH3) and ionized form (NH4
+) is total ammonia, which is commonly what is measured. As a source of nitrogen, it is an important nutrient for plants and is commonly used to make fertilizers. Many industrial and household cleaning detergents also contain ammonia.
In the environment, ammonia can be produced during the decomposition of organic matter, excretion of wastes by animals, and forest fires. High ammonia concentrations in the water are typically associated with pollution by organic wastes including animal wastes, sewage, and fertilizer runoff. At high concentrations in the water, ammonia can be toxic to fish (Thurston and Russo 1981).
For this project, ammonia will be sampled at one facility representing the metal finishing sector.
Supplemental Parameters Semivolatile Organic Compounds SVOCs are a group of volatile organic compounds that have a higher molecular weight and boiling point. They include a range of different structural compounds, including pesticides, phthalate plasticizers, and flame retardants. People may be exposed to SVOCs via inhalation from the air, ingestion of contaminated foods, or absorption through the skin.
Polycyclic aromatic hydrocarbons (PAHs) are a class of semivolatile organic compounds consisting of carbon atoms joined together to form multiple rings. They are formed from the incomplete combustion of coal, oil and gas, garbage, and plant or animal matter. People may be exposed to PAHs through various pathways, such as breathing PAH contaminated air, eating charred meat, or coming into contact with air, water, or soils near hazardous waste sites (ATSDR 1996). Little is known about human health effects at low exposures. Animal tests have shown that exposure to PAHs may affect the skin, body fluids, immune system, and reproductive system, and may be carcinogenic.
Polychlorinated Biphenyls PCBs are synthetic compounds consisting of two benzene rings with one to ten chlorines attached. There are 209 different arrangements of chlorine atoms on the benzene rings, called congeners. PCBs are lipophilic (relatively soluble in fats) and hydrophobic (relatively insoluble in water). PCBs are considered persistent, bioaccumulative, and toxic. While PCBs may be found in surface water at low concentrations, PCBs may accumulate in fish tissue at high concentrations (Limnotech 2016, Rodenburg and Leidos 2017).
Page 11
PCBs were widely used in various industrial capacities because of their flame retardant, insulating, lubricating, and chemically stable properties. Commercial mixtures of PCBs were commonly produced under the tradename Aroclor. The manufacture of PCBs in the U.S. was banned in 1979 after more was learned about their toxic impacts. Some PCB congeners are known carcinogens. Exposures to high levels also affect the immune, reproductive, nervous, and endocrine systems (Davies 2015).
PCB sources include legacy contamination from previous industrial manufacturing and uses, inadvertent production during present-day manufacturing processes (including certain dyes), and transport from other areas. PCBs are widespread in the environment and efforts to understand and control PCB sources are ongoing.
For this project, one facility is required to monitor PCBs as Aroclors. We will also sample each facility for the 209 PCB congeners as part of the supplemental sampling.
Polybrominated Diphenyl Ethers PBDEs are a class of synthetic brominated hydrocarbons that were widely used as flame retardants in electronics, plastics, furniture, textiles, and a variety of consumer products. Like PCBs, they consist of 209 congeners, are lipophilic and hydrophobic, and are persistent, bioaccumulative, and toxic. As there has been increasing concern about their presence and effects in the environment, PBDEs have been categorized as a CEC, and since 2004 have largely been phased out of production.
Pathways of PBDEs into the environment include air emissions from manufacturing processes, recycling of PBDE containing materials, leachate from waste disposal sites, and volatilization or leaching from various products containing PBDEs when they break down (EPA 2017). At high concentrations in animals, there is evidence of carcinogenicity and toxic effects to the nervous, reproductive, and immune systems, liver, pancreas, and thyroid (EPA 2010). In a previous study, PBDEs in juvenile salmonids were detected at levels high enough to potentially cause harmful effects (O’Neill et al. 2015).
Per- and Poly-fluoroalkyl Substances PFAS are synthetic fluorinated chemicals used in household products such as non-stick cookware, water repellant clothing, stain-resistant fabrics and carpets, and firefighting foams. They are highly water soluble and resistant to degradation. Prior to the 2000s, perfluorooctanoic acid (PFOA) and perfluorooctane sulfonate (PFOS) were the most widely manufactured globally. The primary manufacturers in the U.S. phased out production of PFOS in 2002 and PFOA by 2015, and largely replaced them with short-chain PFAS. At high concentrations of some PFAS compounds in animals, there is evidence of toxic effects to the liver and immune, reproductive, and developmental systems (ATSDR 2018).
Organophosphorus Flame Retardants OPFRs are widely used as flame retardants in consumer products such as textiles, electronics, and furniture, hydraulic fluids, plasticizers, and industrial materials. The development and use of OPFRs was spurred on largely because of increasing concerns about PBDEs.
Page 12
OPFR compounds have a wide range of physical and physiological properties. The environmental persistence and toxicity of individual OPFR compounds depend on their unique solubility, vapor pressure, and bioconcentration factor (Yang et al. 2019). In animals, there is evidence of health effects to the brain, kidney, reproductive system, bladder, and liver caused by OPFR compounds, including tris(2-chloroethyl) phosphate (TCEP), tributyl phosphate (TnBP), tributoxyethyl phosphate (TBEP), tris(1,3-Dichloro-2-Propyl)Phosphate (TDCP), and tricresyl phosphate (TCP) (ATSDR 2012).
Phenolic Compounds Alkylphenols are a family of compounds characterized by the alkylation of phenols. They are commonly used to make alkylphenol ethoxylate surfactants, which are used as additives in fuel and are a component of phenolic resins. The most common alkylphenol ethoxylate is nonylphenol ethoxylate, used to make industrial and commercial detergents. Nonylphenol is moderately bioaccumulative, not readily biodegradable, and an estrogenic endocrine disruptor.
Bisphenols are group of compounds consisting of two phenol functional groups, the most common of which is bisphenol A (BPA). BPA is widely used to make polycarbonate plastics and epoxy resins. BPA is a known estrogenic endocrine disruptor. BPA is moderately soluble and biodegradable in the environment. Exposure to BPA can occur through eating food in contact with BPA containing plastics or other containers (National Center for Biotechnology Information). BPA is more likely to be leached from products when heated at high temperatures.
3.2.4 Regulatory criteria or standards The applicable regulation is 40 CFR 403.8 (f)(2)(v), which requires the overseeing authority of an industrial user to:
“Randomly sample and analyze the effluent from Industrial Users and conduct surveillance activities in order to identify, independent of information supplied by Industrial Users, occasional and continuing noncompliance with Pretreatment Standards. Inspect and sample the effluent from each Significant Industrial User at least once a year…”
Each industrial user’s State Waste Discharge permit lists the parameters required to be routinely monitored, as well as the discharge limits for each parameter.
For this project, EAP will collect and analyze the data for these compliance parameters. Compliance will be assessed by Ecology’s Water Quality Program (WQP).
Data collected for the supplemental parameters will be used for research purposes only, and will not be used to assess compliance.
Page 13
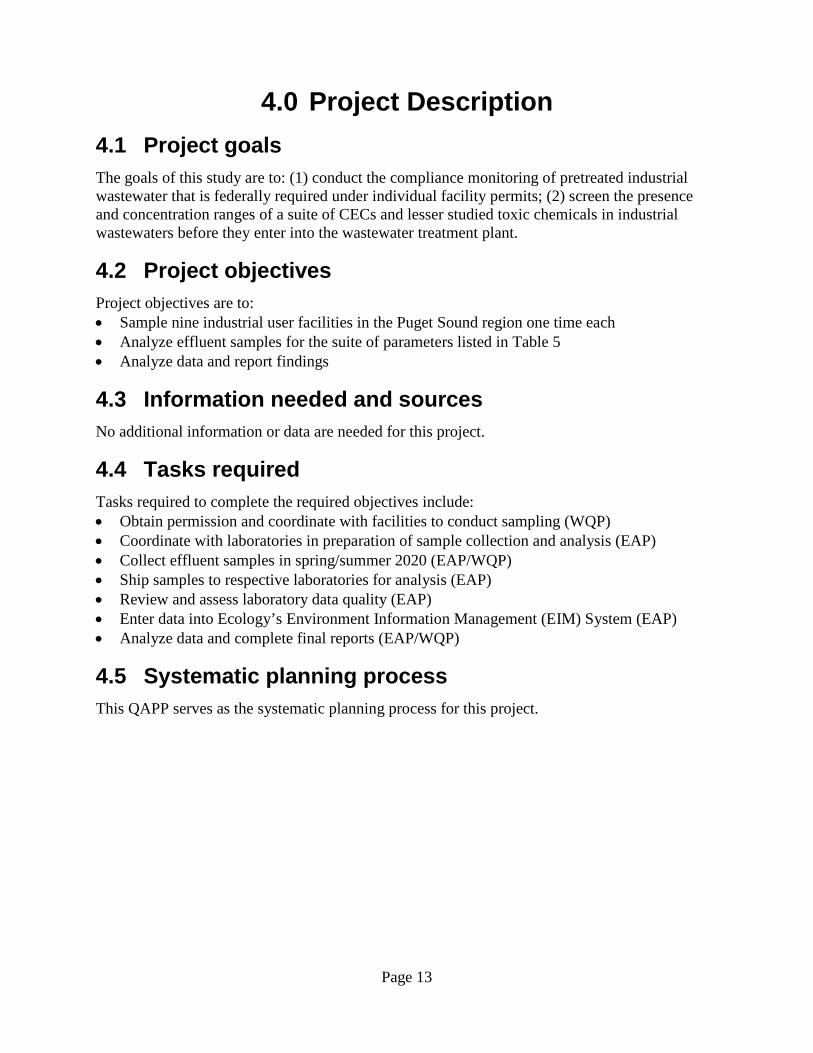
4.0 Project Description 4.1 Project goals The goals of this study are to: (1) conduct the compliance monitoring of pretreated industrial wastewater that is federally required under individual facility permits; (2) screen the presence and concentration ranges of a suite of CECs and lesser studied toxic chemicals in industrial wastewaters before they enter into the wastewater treatment plant.
4.2 Project objectives Project objectives are to: • Sample nine industrial user facilities in the Puget Sound region one time each • Analyze effluent samples for the suite of parameters listed in Table 5 • Analyze data and report findings
4.3 Information needed and sources No additional information or data are needed for this project.
4.4 Tasks required Tasks required to complete the required objectives include: • Obtain permission and coordinate with facilities to conduct sampling (WQP) • Coordinate with laboratories in preparation of sample collection and analysis (EAP) • Collect effluent samples in spring/summer 2020 (EAP/WQP) • Ship samples to respective laboratories for analysis (EAP) • Review and assess laboratory data quality (EAP) • Enter data into Ecology’s Environment Information Management (EIM) System (EAP) • Analyze data and complete final reports (EAP/WQP)
4.5 Systematic planning process This QAPP serves as the systematic planning process for this project.
Page 14
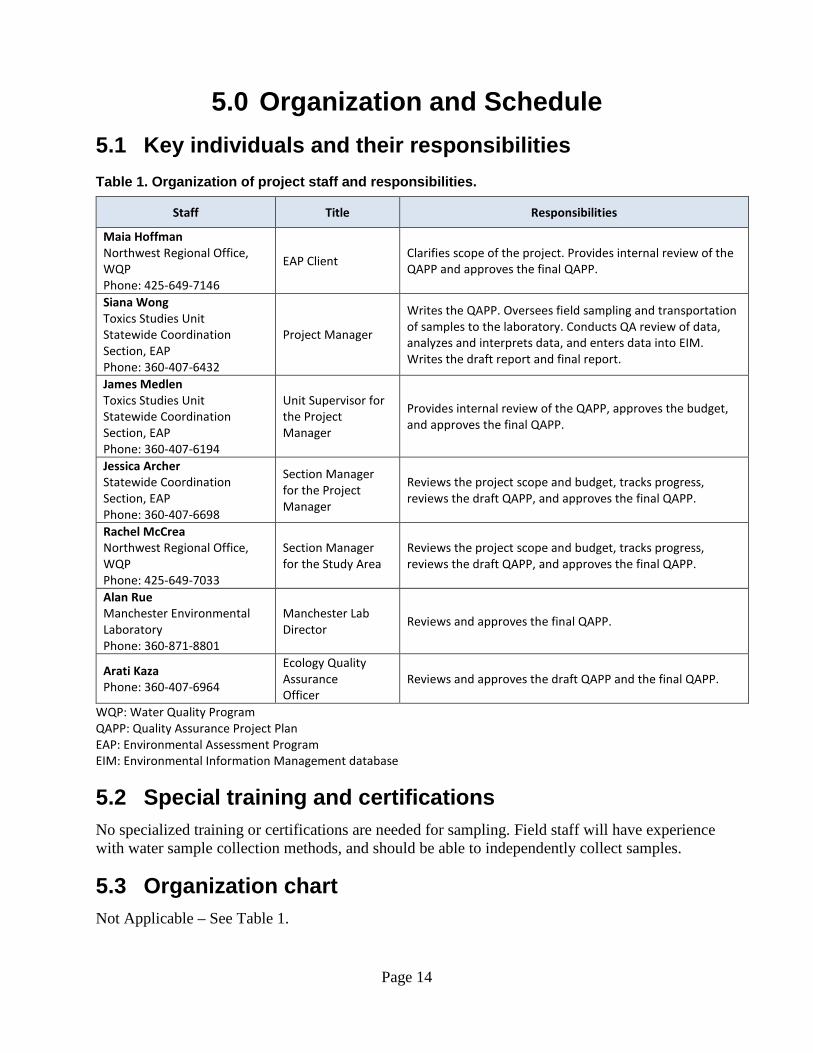
5.0 Organization and Schedule 5.1 Key individuals and their responsibilities Table 1. Organization of project staff and responsibilities.
Staff Title Responsibilities
Maia Hoffman Northwest Regional Office, WQP Phone: 425-649-7146
EAP Client Clarifies scope of the project. Provides internal review of the QAPP and approves the final QAPP.
Siana Wong Toxics Studies Unit Statewide Coordination Section, EAP Phone: 360-407-6432
Project Manager
Writes the QAPP. Oversees field sampling and transportation of samples to the laboratory. Conducts QA review of data, analyzes and interprets data, and enters data into EIM. Writes the draft report and final report.
James Medlen Toxics Studies Unit Statewide Coordination Section, EAP Phone: 360-407-6194
Unit Supervisor for the Project Manager
Provides internal review of the QAPP, approves the budget, and approves the final QAPP.
Jessica Archer Statewide Coordination Section, EAP Phone: 360-407-6698
Section Manager for the Project Manager
Reviews the project scope and budget, tracks progress, reviews the draft QAPP, and approves the final QAPP.
Rachel McCrea Northwest Regional Office, WQP Phone: 425-649-7033
Section Manager for the Study Area
Reviews the project scope and budget, tracks progress, reviews the draft QAPP, and approves the final QAPP.
Alan Rue Manchester Environmental Laboratory Phone: 360-871-8801
Manchester Lab Director Reviews and approves the final QAPP.
Arati Kaza Phone: 360-407-6964
Ecology Quality Assurance Officer
Reviews and approves the draft QAPP and the final QAPP.
WQP: Water Quality Program QAPP: Quality Assurance Project Plan EAP: Environmental Assessment Program EIM: Environmental Information Management database
5.2 Special training and certifications No specialized training or certifications are needed for sampling. Field staff will have experience with water sample collection methods, and should be able to independently collect samples.
5.3 Organization chart Not Applicable – See Table 1.
Page 15
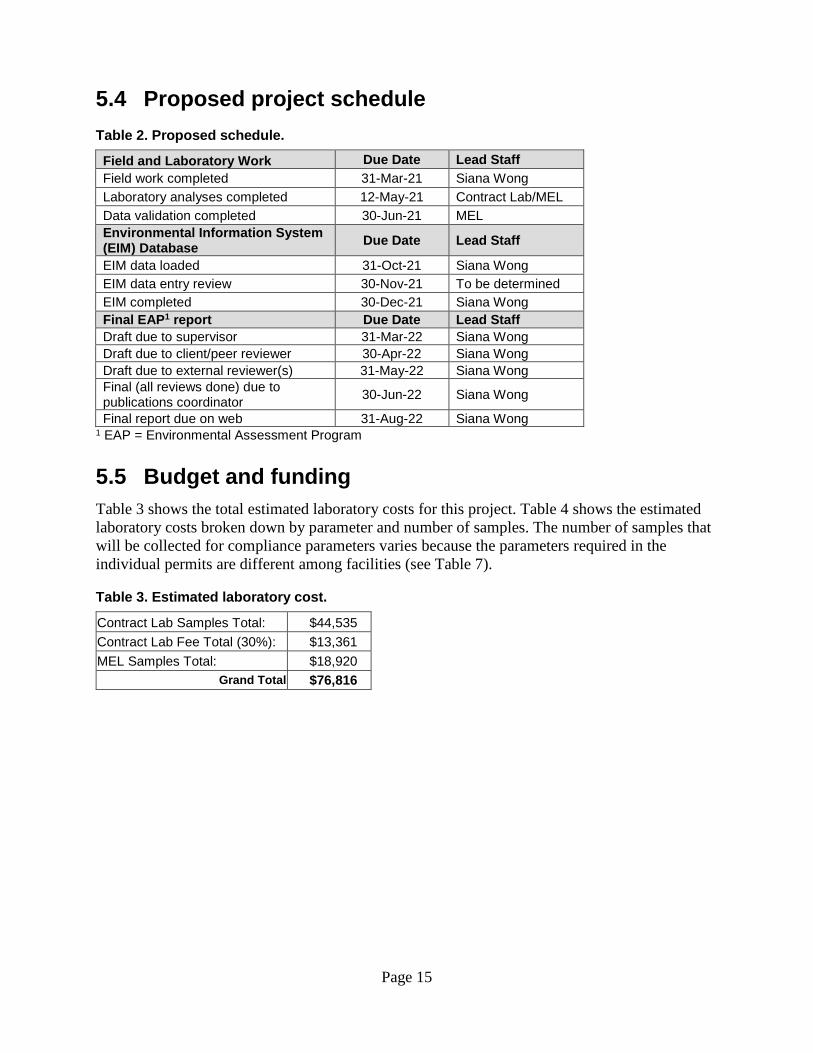
5.4 Proposed project schedule Table 2. Proposed schedule.
Field and Laboratory Work Due Date Lead Staff Field work completed 31-Mar-21 Siana Wong Laboratory analyses completed 12-May-21 Contract Lab/MEL Data validation completed 30-Jun-21 MEL Environmental Information System (EIM) Database Due Date Lead Staff
EIM data loaded 31-Oct-21 Siana Wong EIM data entry review 30-Nov-21 To be determined EIM completed 30-Dec-21 Siana Wong Final EAP1 report Due Date Lead Staff Draft due to supervisor 31-Mar-22 Siana Wong Draft due to client/peer reviewer 30-Apr-22 Siana Wong Draft due to external reviewer(s) 31-May-22 Siana Wong Final (all reviews done) due to publications coordinator 30-Jun-22 Siana Wong
Final report due on web 31-Aug-22 Siana Wong 1 EAP = Environmental Assessment Program
5.5 Budget and funding Table 3 shows the total estimated laboratory costs for this project. Table 4 shows the estimated laboratory costs broken down by parameter and number of samples. The number of samples that will be collected for compliance parameters varies because the parameters required in the individual permits are different among facilities (see Table 7).
Table 3. Estimated laboratory cost.
Contract Lab Samples Total: $44,535 Contract Lab Fee Total (30%): $13,361 MEL Samples Total: $18,920
Grand Total $76,816
Page 16
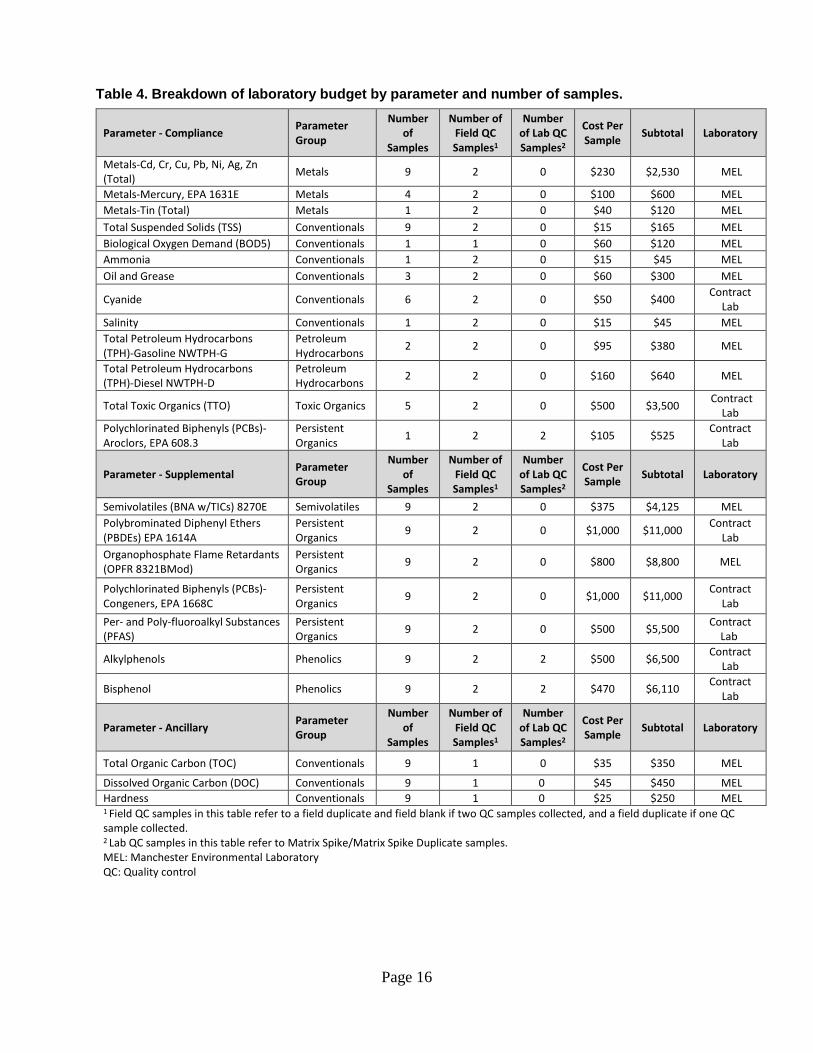
Table 4. Breakdown of laboratory budget by parameter and number of samples.
Parameter - Compliance Parameter Group
Number of
Samples
Number of Field QC Samples1
Number of Lab QC Samples2
Cost Per Sample Subtotal Laboratory
Metals-Cd, Cr, Cu, Pb, Ni, Ag, Zn (Total) Metals 9 2 0 $230 $2,530 MEL
Metals-Mercury, EPA 1631E Metals 4 2 0 $100 $600 MEL Metals-Tin (Total) Metals 1 2 0 $40 $120 MEL Total Suspended Solids (TSS) Conventionals 9 2 0 $15 $165 MEL Biological Oxygen Demand (BOD5) Conventionals 1 1 0 $60 $120 MEL Ammonia Conventionals 1 2 0 $15 $45 MEL Oil and Grease Conventionals 3 2 0 $60 $300 MEL
Cyanide Conventionals 6 2 0 $50 $400 Contract Lab
Salinity Conventionals 1 2 0 $15 $45 MEL Total Petroleum Hydrocarbons (TPH)-Gasoline NWTPH-G
Petroleum Hydrocarbons 2 2 0 $95 $380 MEL
Total Petroleum Hydrocarbons (TPH)-Diesel NWTPH-D
Petroleum Hydrocarbons 2 2 0 $160 $640 MEL
Total Toxic Organics (TTO) Toxic Organics 5 2 0 $500 $3,500 Contract Lab
Polychlorinated Biphenyls (PCBs)-Aroclors, EPA 608.3
Persistent Organics 1 2 2 $105 $525 Contract
Lab
Parameter - Supplemental Parameter Group
Number of
Samples
Number of Field QC Samples1
Number of Lab QC Samples2
Cost Per Sample Subtotal Laboratory
Semivolatiles (BNA w/TICs) 8270E Semivolatiles 9 2 0 $375 $4,125 MEL Polybrominated Diphenyl Ethers (PBDEs) EPA 1614A
Persistent Organics 9 2 0 $1,000 $11,000 Contract
Lab Organophosphate Flame Retardants (OPFR 8321BMod)
Persistent Organics 9 2 0 $800 $8,800 MEL
Polychlorinated Biphenyls (PCBs)-Congeners, EPA 1668C
Persistent Organics 9 2 0 $1,000 $11,000 Contract
Lab Per- and Poly-fluoroalkyl Substances (PFAS)
Persistent Organics 9 2 0 $500 $5,500 Contract
Lab
Alkylphenols Phenolics 9 2 2 $500 $6,500 Contract Lab
Bisphenol Phenolics 9 2 2 $470 $6,110 Contract Lab
Parameter - Ancillary Parameter Group
Number of
Samples
Number of Field QC Samples1
Number of Lab QC Samples2
Cost Per Sample Subtotal Laboratory
Total Organic Carbon (TOC) Conventionals 9 1 0 $35 $350 MEL
Dissolved Organic Carbon (DOC) Conventionals 9 1 0 $45 $450 MEL Hardness Conventionals 9 1 0 $25 $250 MEL 1 Field QC samples in this table refer to a field duplicate and field blank if two QC samples collected, and a field duplicate if one QC sample collected. 2 Lab QC samples in this table refer to Matrix Spike/Matrix Spike Duplicate samples. MEL: Manchester Environmental Laboratory QC: Quality control
Page 17
6.0 Quality Objectives 6.1 Data quality objectives 1 The first data quality objective (DQO) is to collect and analyze the compliance parameters from each of the nine facilities using the sampling and analysis methods specified in the industrial user’s permits. The data may be used in assessing regulatory compliance.
The second DQO is to screen for the presence and magnitude of supplemental parameters from each of the nine facilities. The data will not be used to assess regulatory compliance.
The measurement quality objectives (MQOs) described below will be used to assess overall data quality.
6.2 Measurement quality objectives A brief description of MQOs for precision, bias, sensitivity, comparability, representativeness, and completeness is given in this section.
6.2.1 Targets for precision, bias, and sensitivity 6.2.1.1 Precision Precision is a measure of variability between results of replicate measurements that is due to random error. It is usually assessed using duplicate field measurements or analysis of laboratory-prepared duplicate samples. For each parameter, we will collect field duplicate samples at ≥10% the total number of samples. Field duplicates will be collected as separate samples. Matrix spike duplicates will be conducted by the laboratories. Targets for field duplicates and matrix spike duplicates are given in Table 5.
6.2.1.2 Bias Bias is the difference between the sample mean and the true value. For this project, bias will be measured as a percent recovery of laboratory verification standards, matrix spikes, and surrogate standards. Targets for bias are given in Table 5.
6.2.1.3 Sensitivity Sensitivity measures the capability of an analytical method to detect a substance above background level, and is often described as a detection or reporting limit. Reporting limits for the analytical methods that will be used for each parameter are given in Table 5.
1 DQO can also refer to Decision Quality Objectives. The need to identify Decision Quality Objectives during the planning phase of a project is less common. For projects that do lead to important decisions, DQOs are often expressed as tolerable limits on the probability or chance (risk) of the collected data leading to an erroneous decision. And for projects that intend to estimate present or future conditions, DQOs are often expressed in terms of acceptable uncertainty (e.g., width of an uncertainty band or interval) associated with a point estimate at a desired level of statistical confidence.
Page 18
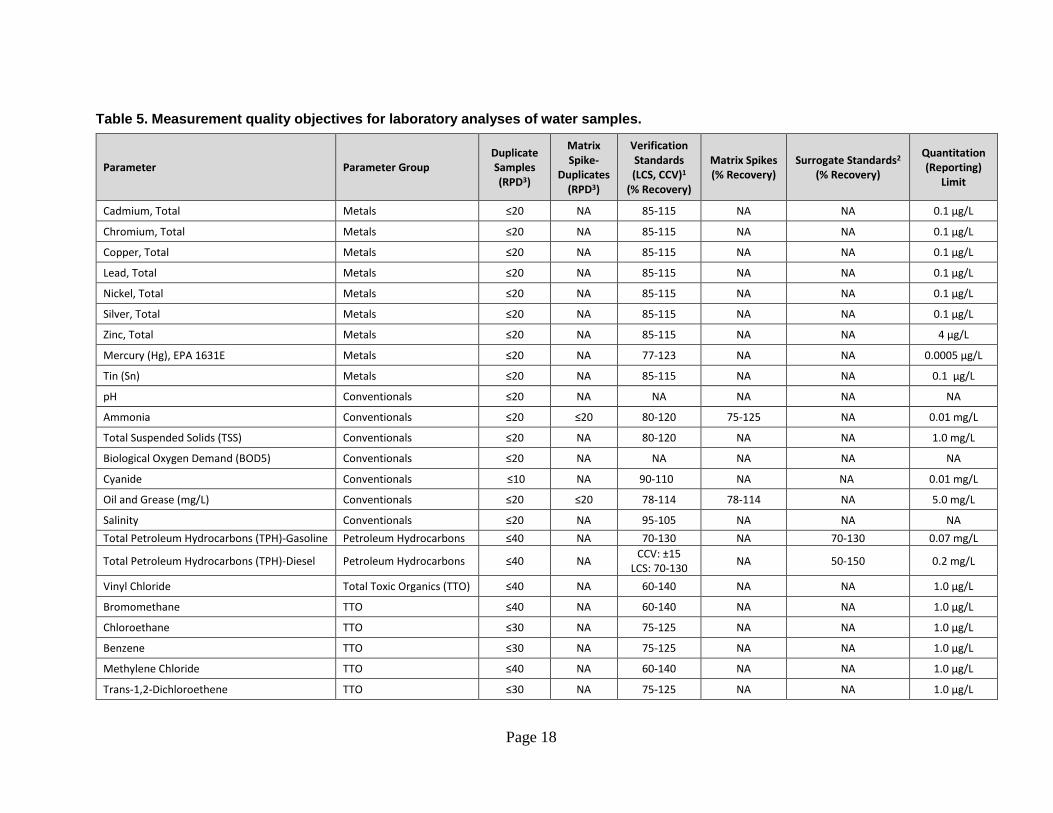
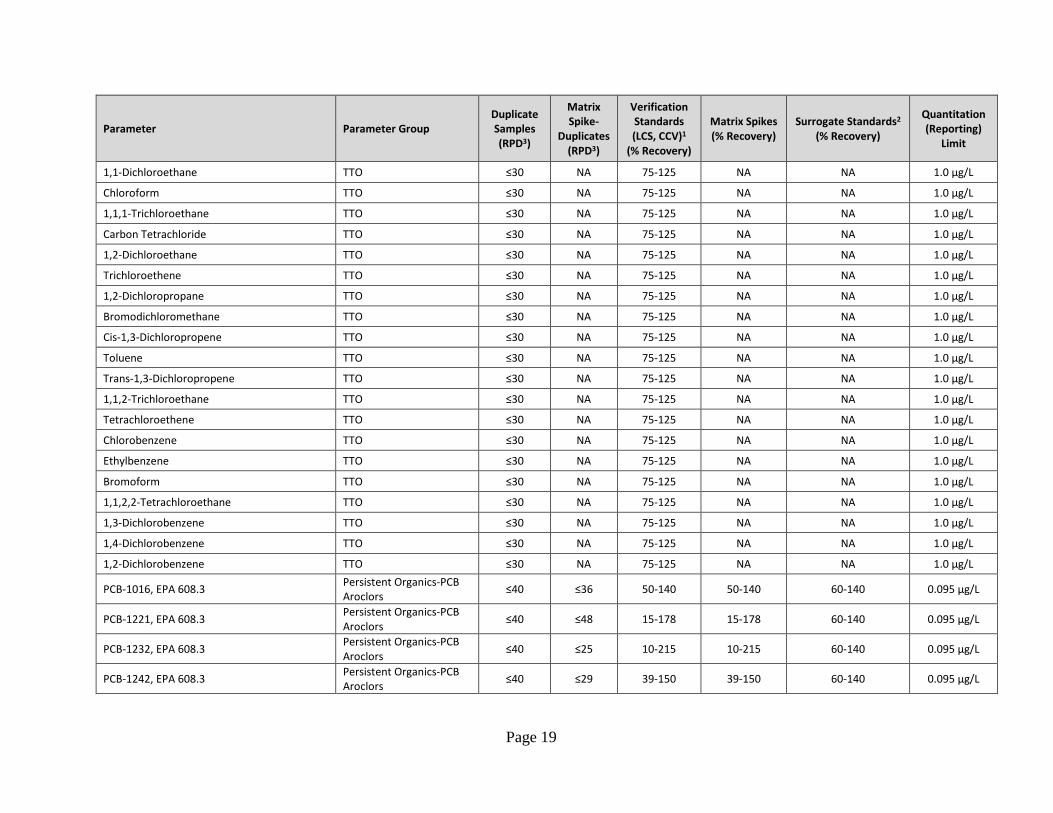
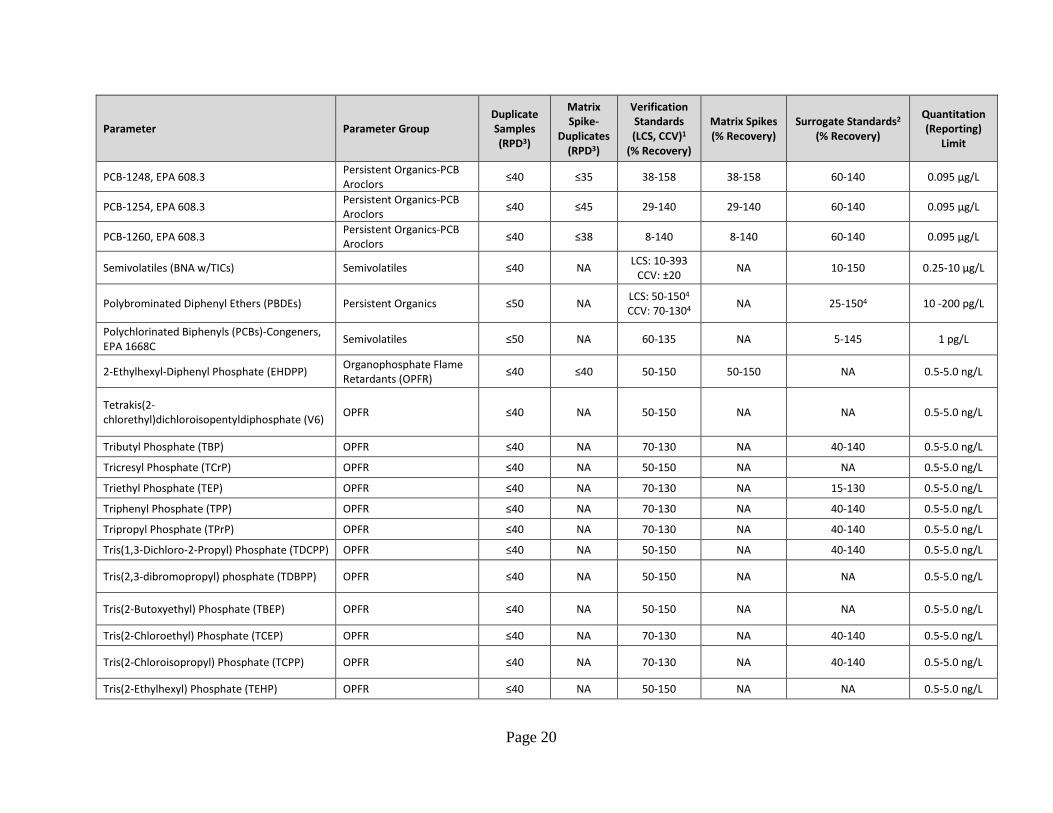
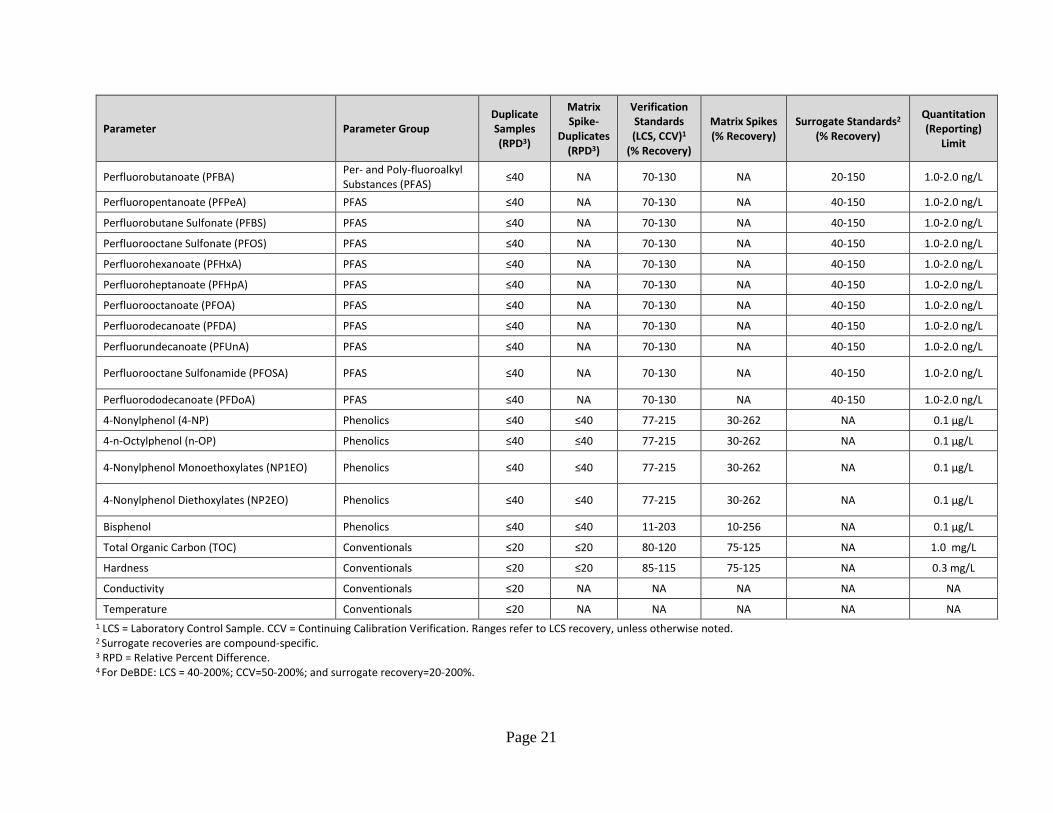
Table 5. Measurement quality objectives for laboratory analyses of water samples.
Parameter Parameter Group Duplicate Samples (RPD3)
Matrix Spike-
Duplicates (RPD3)
Verification Standards (LCS, CCV)1
(% Recovery)
Matrix Spikes (% Recovery)
Surrogate Standards2 (% Recovery)
Quantitation (Reporting)
Limit
Cadmium, Total Metals ≤20 NA 85-115 NA NA 0.1 µg/L
Chromium, Total Metals ≤20 NA 85-115 NA NA 0.1 µg/L
Copper, Total Metals ≤20 NA 85-115 NA NA 0.1 µg/L
Lead, Total Metals ≤20 NA 85-115 NA NA 0.1 µg/L
Nickel, Total Metals ≤20 NA 85-115 NA NA 0.1 µg/L
Silver, Total Metals ≤20 NA 85-115 NA NA 0.1 µg/L
Zinc, Total Metals ≤20 NA 85-115 NA NA 4 µg/L
Mercury (Hg), EPA 1631E Metals ≤20 NA 77-123 NA NA 0.0005 µg/L
Tin (Sn) Metals ≤20 NA 85-115 NA NA 0.1 µg/L
pH Conventionals ≤20 NA NA NA NA NA
Ammonia Conventionals ≤20 ≤20 80-120 75-125 NA 0.01 mg/L
Total Suspended Solids (TSS) Conventionals ≤20 NA 80-120 NA NA 1.0 mg/L
Biological Oxygen Demand (BOD5) Conventionals ≤20 NA NA NA NA NA
Cyanide Conventionals ≤10 NA 90-110 NA NA 0.01 mg/L
Oil and Grease (mg/L) Conventionals ≤20 ≤20 78-114 78-114 NA 5.0 mg/L
Salinity Conventionals ≤20 NA 95-105 NA NA NA Total Petroleum Hydrocarbons (TPH)-Gasoline Petroleum Hydrocarbons ≤40 NA 70-130 NA 70-130 0.07 mg/L
Total Petroleum Hydrocarbons (TPH)-Diesel Petroleum Hydrocarbons ≤40 NA CCV: ±15 LCS: 70-130 NA 50-150 0.2 mg/L
Vinyl Chloride Total Toxic Organics (TTO) ≤40 NA 60-140 NA NA 1.0 µg/L
Bromomethane TTO ≤40 NA 60-140 NA NA 1.0 µg/L
Chloroethane TTO ≤30 NA 75-125 NA NA 1.0 µg/L
Benzene TTO ≤30 NA 75-125 NA NA 1.0 µg/L
Methylene Chloride TTO ≤40 NA 60-140 NA NA 1.0 µg/L
Trans-1,2-Dichloroethene TTO ≤30 NA 75-125 NA NA 1.0 µg/L
Page 19
Parameter Parameter Group Duplicate Samples (RPD3)
Matrix Spike-
Duplicates (RPD3)
Verification Standards (LCS, CCV)1
(% Recovery)
Matrix Spikes (% Recovery)
Surrogate Standards2 (% Recovery)
Quantitation (Reporting)
Limit
1,1-Dichloroethane TTO ≤30 NA 75-125 NA NA 1.0 µg/L
Chloroform TTO ≤30 NA 75-125 NA NA 1.0 µg/L
1,1,1-Trichloroethane TTO ≤30 NA 75-125 NA NA 1.0 µg/L
Carbon Tetrachloride TTO ≤30 NA 75-125 NA NA 1.0 µg/L
1,2-Dichloroethane TTO ≤30 NA 75-125 NA NA 1.0 µg/L
Trichloroethene TTO ≤30 NA 75-125 NA NA 1.0 µg/L
1,2-Dichloropropane TTO ≤30 NA 75-125 NA NA 1.0 µg/L
Bromodichloromethane TTO ≤30 NA 75-125 NA NA 1.0 µg/L
Cis-1,3-Dichloropropene TTO ≤30 NA 75-125 NA NA 1.0 µg/L
Toluene TTO ≤30 NA 75-125 NA NA 1.0 µg/L
Trans-1,3-Dichloropropene TTO ≤30 NA 75-125 NA NA 1.0 µg/L
1,1,2-Trichloroethane TTO ≤30 NA 75-125 NA NA 1.0 µg/L
Tetrachloroethene TTO ≤30 NA 75-125 NA NA 1.0 µg/L
Chlorobenzene TTO ≤30 NA 75-125 NA NA 1.0 µg/L
Ethylbenzene TTO ≤30 NA 75-125 NA NA 1.0 µg/L
Bromoform TTO ≤30 NA 75-125 NA NA 1.0 µg/L
1,1,2,2-Tetrachloroethane TTO ≤30 NA 75-125 NA NA 1.0 µg/L
1,3-Dichlorobenzene TTO ≤30 NA 75-125 NA NA 1.0 µg/L
1,4-Dichlorobenzene TTO ≤30 NA 75-125 NA NA 1.0 µg/L
1,2-Dichlorobenzene TTO ≤30 NA 75-125 NA NA 1.0 µg/L
PCB-1016, EPA 608.3 Persistent Organics-PCB Aroclors ≤40 ≤36 50-140 50-140 60-140 0.095 µg/L
PCB-1221, EPA 608.3 Persistent Organics-PCB Aroclors ≤40 ≤48 15-178 15-178 60-140 0.095 µg/L
PCB-1232, EPA 608.3 Persistent Organics-PCB Aroclors ≤40 ≤25 10-215 10-215 60-140 0.095 µg/L
PCB-1242, EPA 608.3 Persistent Organics-PCB Aroclors ≤40 ≤29 39-150 39-150 60-140 0.095 µg/L
Page 20
Parameter Parameter Group Duplicate Samples (RPD3)
Matrix Spike-
Duplicates (RPD3)
Verification Standards (LCS, CCV)1
(% Recovery)
Matrix Spikes (% Recovery)
Surrogate Standards2 (% Recovery)
Quantitation (Reporting)
Limit
PCB-1248, EPA 608.3 Persistent Organics-PCB Aroclors ≤40 ≤35 38-158 38-158 60-140 0.095 µg/L
PCB-1254, EPA 608.3 Persistent Organics-PCB Aroclors ≤40 ≤45 29-140 29-140 60-140 0.095 µg/L
PCB-1260, EPA 608.3 Persistent Organics-PCB Aroclors ≤40 ≤38 8-140 8-140 60-140 0.095 µg/L
Semivolatiles (BNA w/TICs) Semivolatiles ≤40 NA LCS: 10-393 CCV: ±20 NA 10-150 0.25-10 µg/L
Polybrominated Diphenyl Ethers (PBDEs) Persistent Organics ≤50 NA LCS: 50-1504 CCV: 70-1304 NA 25-1504 10 -200 pg/L
Polychlorinated Biphenyls (PCBs)-Congeners, EPA 1668C Semivolatiles ≤50 NA 60-135 NA 5-145 1 pg/L
2-Ethylhexyl-Diphenyl Phosphate (EHDPP) Organophosphate Flame Retardants (OPFR) ≤40 ≤40 50-150 50-150 NA 0.5-5.0 ng/L
Tetrakis(2-chlorethyl)dichloroisopentyldiphosphate (V6) OPFR ≤40 NA 50-150 NA NA 0.5-5.0 ng/L
Tributyl Phosphate (TBP) OPFR ≤40 NA 70-130 NA 40-140 0.5-5.0 ng/L
Tricresyl Phosphate (TCrP) OPFR ≤40 NA 50-150 NA NA 0.5-5.0 ng/L
Triethyl Phosphate (TEP) OPFR ≤40 NA 70-130 NA 15-130 0.5-5.0 ng/L
Triphenyl Phosphate (TPP) OPFR ≤40 NA 70-130 NA 40-140 0.5-5.0 ng/L
Tripropyl Phosphate (TPrP) OPFR ≤40 NA 70-130 NA 40-140 0.5-5.0 ng/L
Tris(1,3-Dichloro-2-Propyl) Phosphate (TDCPP) OPFR ≤40 NA 50-150 NA 40-140 0.5-5.0 ng/L
Tris(2,3-dibromopropyl) phosphate (TDBPP) OPFR ≤40 NA 50-150 NA NA 0.5-5.0 ng/L
Tris(2-Butoxyethyl) Phosphate (TBEP) OPFR ≤40 NA 50-150 NA NA 0.5-5.0 ng/L
Tris(2-Chloroethyl) Phosphate (TCEP) OPFR ≤40 NA 70-130 NA 40-140 0.5-5.0 ng/L
Tris(2-Chloroisopropyl) Phosphate (TCPP) OPFR ≤40 NA 70-130 NA 40-140 0.5-5.0 ng/L
Tris(2-Ethylhexyl) Phosphate (TEHP) OPFR ≤40 NA 50-150 NA NA 0.5-5.0 ng/L
Page 21
Parameter Parameter Group Duplicate Samples (RPD3)
Matrix Spike-
Duplicates (RPD3)
Verification Standards (LCS, CCV)1
(% Recovery)
Matrix Spikes (% Recovery)
Surrogate Standards2 (% Recovery)
Quantitation (Reporting)
Limit
Perfluorobutanoate (PFBA) Per- and Poly-fluoroalkyl Substances (PFAS) ≤40 NA 70-130 NA 20-150 1.0-2.0 ng/L
Perfluoropentanoate (PFPeA) PFAS ≤40 NA 70-130 NA 40-150 1.0-2.0 ng/L
Perfluorobutane Sulfonate (PFBS) PFAS ≤40 NA 70-130 NA 40-150 1.0-2.0 ng/L
Perfluorooctane Sulfonate (PFOS) PFAS ≤40 NA 70-130 NA 40-150 1.0-2.0 ng/L
Perfluorohexanoate (PFHxA) PFAS ≤40 NA 70-130 NA 40-150 1.0-2.0 ng/L
Perfluoroheptanoate (PFHpA) PFAS ≤40 NA 70-130 NA 40-150 1.0-2.0 ng/L
Perfluorooctanoate (PFOA) PFAS ≤40 NA 70-130 NA 40-150 1.0-2.0 ng/L
Perfluorodecanoate (PFDA) PFAS ≤40 NA 70-130 NA 40-150 1.0-2.0 ng/L
Perfluorundecanoate (PFUnA) PFAS ≤40 NA 70-130 NA 40-150 1.0-2.0 ng/L
Perfluorooctane Sulfonamide (PFOSA) PFAS ≤40 NA 70-130 NA 40-150 1.0-2.0 ng/L
Perfluorododecanoate (PFDoA) PFAS ≤40 NA 70-130 NA 40-150 1.0-2.0 ng/L
4-Nonylphenol (4-NP) Phenolics ≤40 ≤40 77-215 30-262 NA 0.1 µg/L
4-n-Octylphenol (n-OP) Phenolics ≤40 ≤40 77-215 30-262 NA 0.1 µg/L
4-Nonylphenol Monoethoxylates (NP1EO) Phenolics ≤40 ≤40 77-215 30-262 NA 0.1 µg/L
4-Nonylphenol Diethoxylates (NP2EO) Phenolics ≤40 ≤40 77-215 30-262 NA 0.1 µg/L
Bisphenol Phenolics ≤40 ≤40 11-203 10-256 NA 0.1 µg/L
Total Organic Carbon (TOC) Conventionals ≤20 ≤20 80-120 75-125 NA 1.0 mg/L
Hardness Conventionals ≤20 ≤20 85-115 75-125 NA 0.3 mg/L
Conductivity Conventionals ≤20 NA NA NA NA NA
Temperature Conventionals ≤20 NA NA NA NA NA 1 LCS = Laboratory Control Sample. CCV = Continuing Calibration Verification. Ranges refer to LCS recovery, unless otherwise noted. 2 Surrogate recoveries are compound-specific. 3 RPD = Relative Percent Difference. 4 For DeBDE: LCS = 40-200%; CCV=50-200%; and surrogate recovery=20-200%.
Page 22
6.2.2 Targets for comparability, representativeness, and completeness 6.2.2.1 Comparability Section 8.2 of this QAPP lists Ecology’s standard operating procedures (SOPs) that will be used for sample collection at each facility. Details of sampling procedures are also given in Section 8.2.
6.2.2.2 Representativeness We will sample each facility once during normal daily operations of facility. Because discharges from the facilities are fairly consistent year-round, the seasonal timing of collection is not expected to be an important factor in achieving the objectives of this project (B. Zelelow, pers. comm).
Typically, samples representing a single day’s discharge are collected as time or flow-proportional composite samples, or as a single grab sample. Effluent samples for compliance parameters will be collected using the methods specified in the individual user’s permit.
6.2.2.3 Completeness The data will be considered complete if 100% of the planned samples for compliance parameters have been analyzed acceptably, and at least 95% of the planned samples for supplemental parameters have been analyzed acceptably.
6.3 Acceptance criteria for quality of existing data This study will not analyze previously collected data from the facilities.
6.4 Model quality objectives NA
Page 23
7.0 Study Design 7.2 Field data collection 7.2.1 Sampling locations and frequency Because the sampling for this study is not focused on any individual facility, and as a courtesy to each of the businesses participating in the study, exact locations and names of the facilities are not provided in this QAPP. For this study, the facilities will be labeled as Facility A-I (Table 6).
We will sample each facility once during normal daily facility operations. Within the facility, we will sample at the discharge point specified in the industrial user permit for compliance monitoring. If multiple discharge points are specified in the permit, we will sample at the final discharge point where the mixed wastewater leaves the facility, or at another specified compliance monitoring point. Details of sampling procedures are given in Section 8.2.
Table 6. Industry types for the nine facilities that will be sampled. The Facility Study ID is the identification code that will be used to identify each facility for this study.
Facility Study ID Industry Type
Facility A Egg processing
Facility B Metal finishing
Facility C Foundry (engaged in investment casting)
Facility D Commercial aircraft refurbishing with metal finishing discharge
Facility E Metal finishing
Facility F Commercial aircraft modification with metal finishing discharge
Facility G Naval facility with metal finishing discharge
Facility H Naval facility with metal finishing discharge
Facility I Naval facility with metal finishing discharge
7.2.2 Field parameters and laboratory analytes to be measured Table 7 lists the parameters required to be monitored by the industrial users at the selected facilities. We will sample the compliance parameters that are required to be sampled at each individual facility.
Table 8 lists the supplemental parameters (SVOCs, PBDEs, PCBs, OPFRs, PFAS, and phenolic compounds) that we will sample at all facilities. We will also sample ancillary parameters (TSS, pH, TOC, DOC, hardness, conductivity, and temperature) as potential explanatory variables for the supplemental parameters.
Page 24
Table 7. List of compliance parameters that will be sampled at each facility during this study (denoted by X).
Facility A
Facility B
Facility C
Facility D
Facility E
Facility F
Facility G
Facility H
Facility I2
Metals (Cd, Cr, Cu, Pb, Ni, Ag, Zn)-Total X X X X X X X SP-1,
SP-2
Mercury (Hg)-Total X X SP-1, SP-2
Tin (Sn)-Total SP-1
pH1 X X X X X SP-1
Ammonia X
Total Suspended Solids (TSS)1 X X X X
Biological Oxygen Demand (BOD5) X
Oil and Grease, (mg/L) X X SP-2
Cyanide X X X X SP-1, SP-2
Salinity SP-2
Total Petroleum Hydrocarbons (TPH)-Gasoline X SP-2
Total Petroleum Hydrocarbons (TPH)-Diesel X SP-2
Total Toxic Organics (TTO) X X X X SP-1
Polychlorinated Biphenyls (PCBs), EPA 608.3 SP-1
1 Although pH and TSS are only required at the sites listed in the table, they will be sampled at all facilities as an ancillary parameter. 2 At Facility I, we will collect samples at two sampling points (arbitrarily labeled SP-1 and SP-2 for this study). Cells marked SP-1 and/or SP-2 denotes that we will collect the parameter at that sampling point.
Table 8. List of supplemental and ancillary parameters that will be sampled at all facilities.
Supplemental Parameters Semivolatiles (BNA w/TICs) Polybrominated Diphenyl Ethers (PBDEs) Polychlorinated Biphenyls (PCBs), EPA 1668C Organophosphate Flame Retardants (OPFRs) Per- and Poly-fluoroalkyl Substances (PFAS) Phenolic Compounds (Alkylphenols & Bisphenol) Ancillary Parameters Total Suspended Solids (TSS) pH Total Organic Carbon (TOC) Dissolved Organic Carbon (DOC) Hardness Conductivity Temperature
Page 25
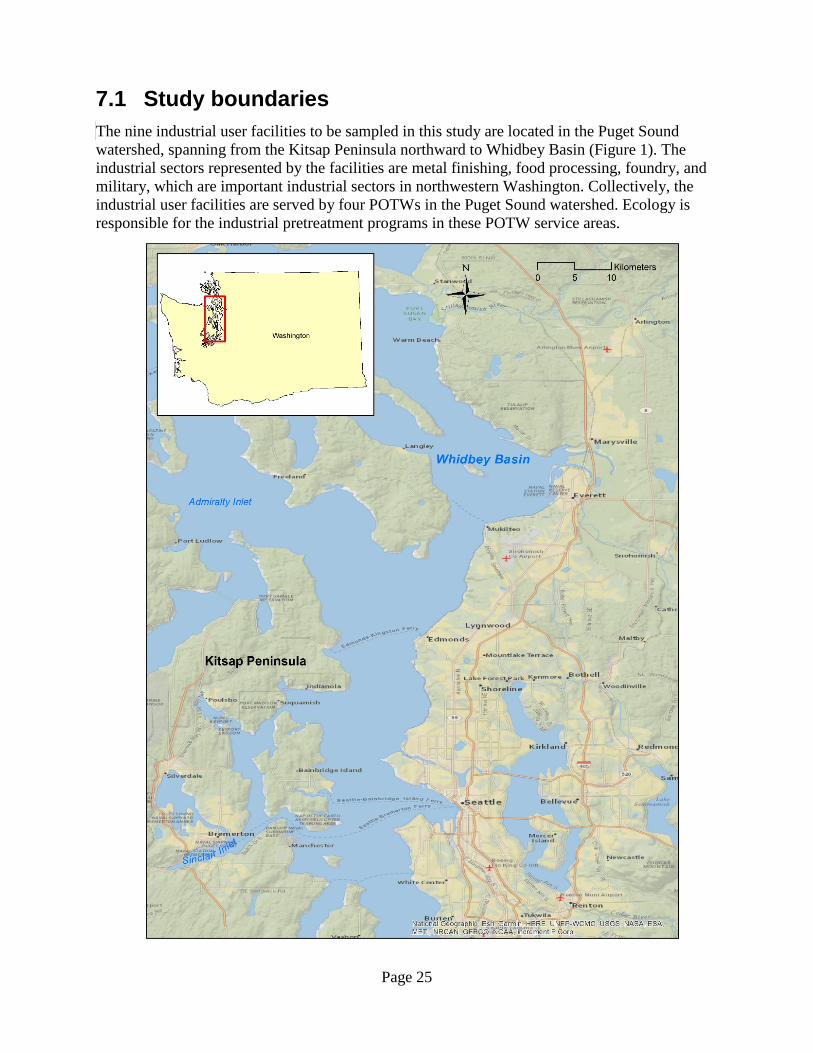
7.1 Study boundaries The nine industrial user facilities to be sampled in this study are located in the Puget Sound watershed, spanning from the Kitsap Peninsula northward to Whidbey Basin (Figure 1). The industrial sectors represented by the facilities are metal finishing, food processing, foundry, and military, which are important industrial sectors in northwestern Washington. Collectively, the industrial user facilities are served by four POTWs in the Puget Sound watershed. Ecology is responsible for the industrial pretreatment programs in these POTW service areas.
Figure 1. Map of study area boundaries
Page 26
7.3 Modeling and analysis design NA
7.4 Assumptions underlying design The study makes the assumption that sampling will occur during “business as usual” operations at each facility. The study also assumes that detection and quantitation limits will be low enough to determine the presence and concentration ranges of each of the supplemental parameters in the wastewater discharges. The study also assumes that supplemental parameter characterization at these facilities will represent the character of wastewater from the same industrial sectors elsewhere in the Puget Sound watershed.
7.5 Possible challenges and contingencies 7.5.1 Logistical problems The potential logistical problem will be coordinating with the prospective industrial user facility to gain access for sampling during routine business operations. WQP will contact and coordinate conversations with each of the prospective facilities to gain permissions for conducting the sampling for this project.
7.5.2 Practical constraints There are no foreseeable practical constraints for this project.
7.5.3 Schedule limitations Coordination and scheduling with the facilities could affect the timings of the proposed schedule for this project.
8.0 Field Procedures 8.1 Invasive species evaluation Not Applicable. We do not expect issues with invasive species contamination. We will not sample in natural waters.
8.2 Measurement and sampling procedures Sampling collection methods are described below, and are adapted from the following Ecology SOPs: • Standard Operating Procedures for Manually Obtaining Surface Water Samples, Version 1.4.
SOP EAP015 (Urmos-Berry 2019) • Standard Operating Procedures for Decontaminating Field Equipment for Sampling Toxics in
the Environment, Version 1.1. SOP EAP090 (Friese, 2014). • Standard Operating Procedures for Hydrolab® DataSonde®, MiniSonde®, and HL4
Multiprobes, Version 2.1. SOP EAP033 (Anderson 2016) • Standard Operating Procedure for Automatic Sampling for Stormwater Monitoring, Version
1.1. SOP WQP002 (Lubliner et al. 2018)
Page 27
There is currently no EAP SOP for sampling of PFAS in wastewaters. We will follow established guidance from the Michigan Department of Environmental Quality (MDEQ) for collecting PFAS samples (MDEQ 2018).
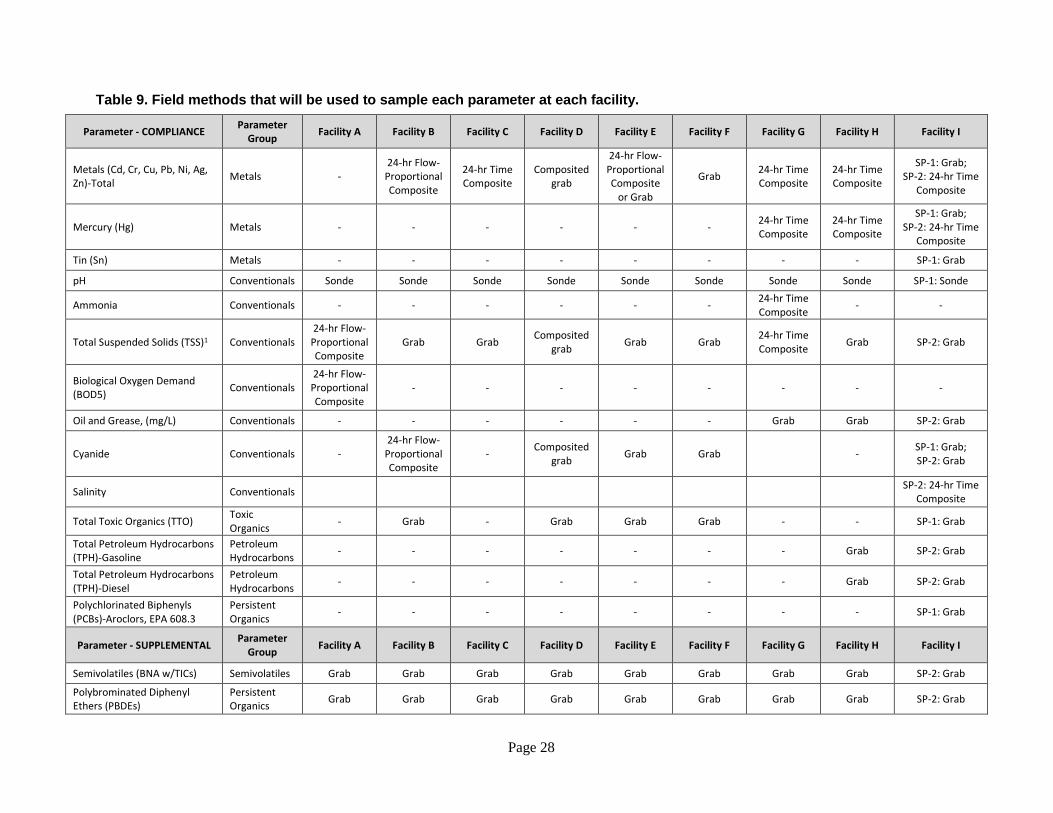
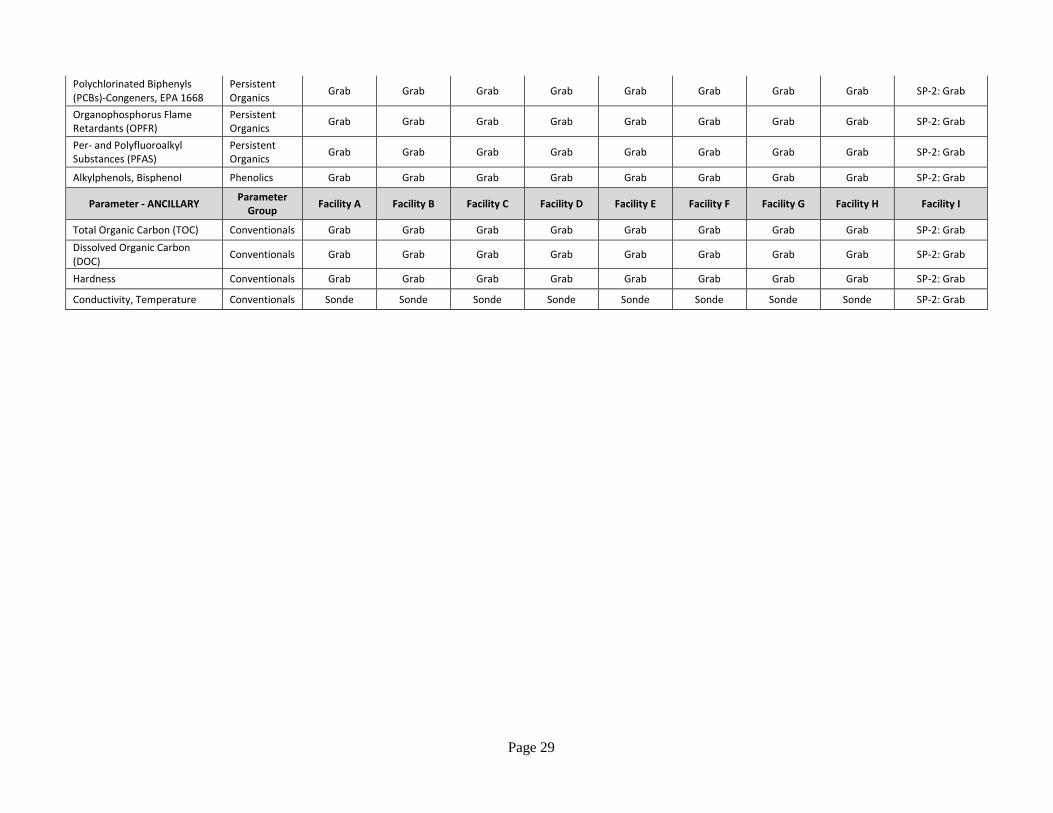
For compliance parameters, effluent samples will be collected from each facility as a grab, composited grab, 24-hour time-composite, or 24-hour flow-proportional composite sample as stated in the permit. For supplemental parameters, effluent samples will be collected as grab samples. Table 9 lists the field methods (grab, composited grab, 24-hour time composite, 24-hour flow-proportional composite, or sonde) that we will use to sample each parameter at each facility.
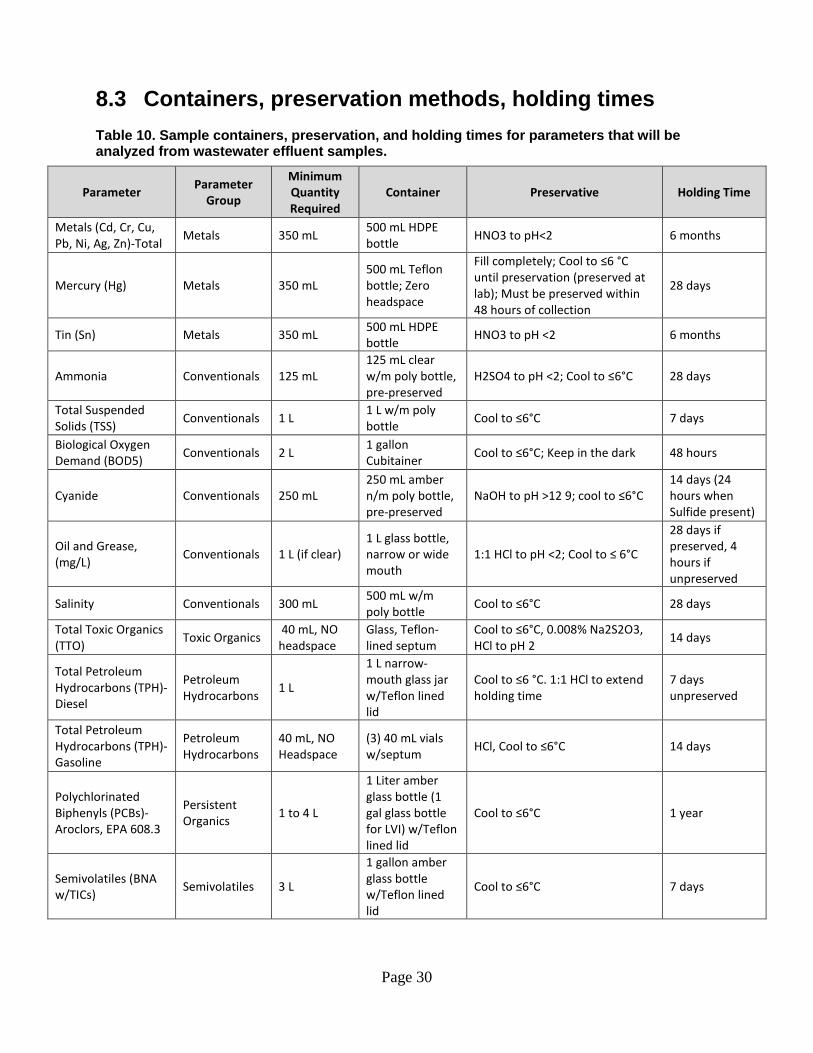
Grab samples will be collected as a one-time discrete sample using a certified clean container, triple-rinsed with site water unless pre-preserved. If necessary, a pole attached to the appropriate container may be used to collect effluent samples. Table 10 lists the appropriate containers for each parameter.
Composited grab samples will be collected as separate grab samples collected at equal time intervals over the course of an approximate eight-hour period. The separate grab samples will then be composited and mixed, then poured into the appropriate containers.
24-hour time and flow-proportional composite samples will be collected using an automated sampler (ISCO 6712). The sampler will be programmed to collect the number of aliquots that is specified in the individual permit during a 24-hour period. Pre-cleaned Teflon®-lined tubing will be used to draw effluent into the sampler.
For time-composites, equal volume aliquots of water collected at equal time intervals will be composited directly into a pre-cleaned ~2.5 gallon Teflon® container. The composited water will then be mixed and poured into the appropriate sample container (Table 10).
For flow-proportional composite samples, equal volume aliquots of water collected at equal time intervals will be drawn into discrete pre-cleaned 1-liter polyethylene bottles. Using the equation below, flow data from the facility will be used to calculate the volume of each aliquot that will be composited (sample aliquot volume):
Sample Aliquot Volume = (Qinst / Qmax) * Vmax where, Qinst = Instantaneous flow rate at the time aliquot was collected (Volume/Time)
Qmax = Maximum flow rate during the 24-hour period (Volume/Time) Vmax = Maximum aliquot volume (Volume).
The sample aliquot volumes will be measured using a pre-cleaned polyethylene graduated cylinder, then composited into a pre-cleaned ~2.5 gallon Teflon® container. The composited water will then be mixed and poured into the appropriate sample container.
All samples will be stored at ≤6°C in a cooler on ice during transportation. Samples will be stored refrigerated or frozen at Ecology’s headquarters until shipped to the respective laboratories for analysis.
Temperature, pH, and conductivity data will be collected using a calibrated YSI sonde.
Page 28
Table 9. Field methods that will be used to sample each parameter at each facility.
Parameter - COMPLIANCE Parameter Group Facility A Facility B Facility C Facility D Facility E Facility F Facility G Facility H Facility I
Metals (Cd, Cr, Cu, Pb, Ni, Ag, Zn)-Total Metals -
24-hr Flow-Proportional Composite
24-hr Time Composite
Composited grab
24-hr Flow-Proportional Composite
or Grab
Grab 24-hr Time Composite
24-hr Time Composite
SP-1: Grab; SP-2: 24-hr Time
Composite
Mercury (Hg) Metals - - - - - - 24-hr Time Composite
24-hr Time Composite
SP-1: Grab; SP-2: 24-hr Time
Composite
Tin (Sn) Metals - - - - - - - - SP-1: Grab
pH Conventionals Sonde Sonde Sonde Sonde Sonde Sonde Sonde Sonde SP-1: Sonde
Ammonia Conventionals - - - - - - 24-hr Time Composite - -
Total Suspended Solids (TSS)1 Conventionals 24-hr Flow-Proportional Composite
Grab Grab Composited grab Grab Grab 24-hr Time
Composite Grab SP-2: Grab
Biological Oxygen Demand (BOD5) Conventionals
24-hr Flow-Proportional Composite
- - - - - - - -
Oil and Grease, (mg/L) Conventionals - - - - - - Grab Grab SP-2: Grab
Cyanide Conventionals - 24-hr Flow-Proportional Composite
- Composited grab Grab Grab - SP-1: Grab;
SP-2: Grab
Salinity Conventionals SP-2: 24-hr Time Composite
Total Toxic Organics (TTO) Toxic Organics - Grab - Grab Grab Grab - - SP-1: Grab
Total Petroleum Hydrocarbons (TPH)-Gasoline
Petroleum Hydrocarbons - - - - - - - Grab SP-2: Grab
Total Petroleum Hydrocarbons (TPH)-Diesel
Petroleum Hydrocarbons - - - - - - - Grab SP-2: Grab
Polychlorinated Biphenyls (PCBs)-Aroclors, EPA 608.3
Persistent Organics - - - - - - - - SP-1: Grab
Parameter - SUPPLEMENTAL Parameter Group Facility A Facility B Facility C Facility D Facility E Facility F Facility G Facility H Facility I
Semivolatiles (BNA w/TICs) Semivolatiles Grab Grab Grab Grab Grab Grab Grab Grab SP-2: Grab
Polybrominated Diphenyl Ethers (PBDEs)
Persistent Organics Grab Grab Grab Grab Grab Grab Grab Grab SP-2: Grab
Page 29
Polychlorinated Biphenyls (PCBs)-Congeners, EPA 1668
Persistent Organics Grab Grab Grab Grab Grab Grab Grab Grab SP-2: Grab
Organophosphorus Flame Retardants (OPFR)
Persistent Organics Grab Grab Grab Grab Grab Grab Grab Grab SP-2: Grab
Per- and Polyfluoroalkyl Substances (PFAS)
Persistent Organics Grab Grab Grab Grab Grab Grab Grab Grab SP-2: Grab
Alkylphenols, Bisphenol Phenolics Grab Grab Grab Grab Grab Grab Grab Grab SP-2: Grab
Parameter - ANCILLARY Parameter Group Facility A Facility B Facility C Facility D Facility E Facility F Facility G Facility H Facility I
Total Organic Carbon (TOC) Conventionals Grab Grab Grab Grab Grab Grab Grab Grab SP-2: Grab Dissolved Organic Carbon (DOC) Conventionals Grab Grab Grab Grab Grab Grab Grab Grab SP-2: Grab
Hardness Conventionals Grab Grab Grab Grab Grab Grab Grab Grab SP-2: Grab
Conductivity, Temperature Conventionals Sonde Sonde Sonde Sonde Sonde Sonde Sonde Sonde SP-2: Grab
Page 30
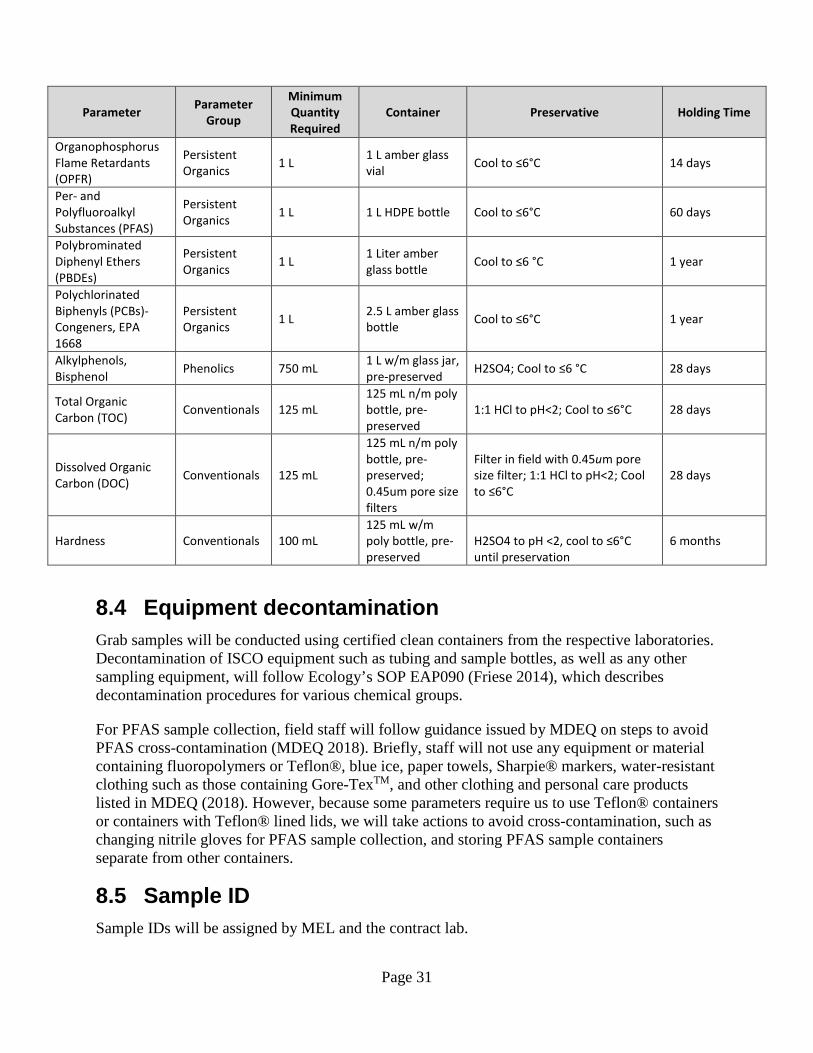
8.3 Containers, preservation methods, holding times Table 10. Sample containers, preservation, and holding times for parameters that will be analyzed from wastewater effluent samples.
Parameter Parameter Group
Minimum Quantity Required
Container Preservative Holding Time
Metals (Cd, Cr, Cu, Pb, Ni, Ag, Zn)-Total Metals 350 mL 500 mL HDPE
bottle HNO3 to pH<2 6 months
Mercury (Hg) Metals 350 mL 500 mL Teflon bottle; Zero headspace
Fill completely; Cool to ≤6 °C until preservation (preserved at lab); Must be preserved within 48 hours of collection
28 days
Tin (Sn) Metals 350 mL 500 mL HDPE bottle HNO3 to pH <2 6 months
Ammonia Conventionals 125 mL 125 mL clear w/m poly bottle, pre-preserved
H2SO4 to pH <2; Cool to ≤6°C 28 days
Total Suspended Solids (TSS) Conventionals 1 L 1 L w/m poly
bottle Cool to ≤6°C 7 days
Biological Oxygen Demand (BOD5) Conventionals 2 L 1 gallon
Cubitainer Cool to ≤6°C; Keep in the dark 48 hours
Cyanide Conventionals 250 mL 250 mL amber n/m poly bottle, pre-preserved
NaOH to pH >12 9; cool to ≤6°C 14 days (24 hours when Sulfide present)
Oil and Grease, (mg/L) Conventionals 1 L (if clear)
1 L glass bottle, narrow or wide mouth
1:1 HCl to pH <2; Cool to ≤ 6°C
28 days if preserved, 4 hours if unpreserved
Salinity Conventionals 300 mL 500 mL w/m poly bottle Cool to ≤6°C 28 days
Total Toxic Organics (TTO) Toxic Organics 40 mL, NO
headspace Glass, Teflon-lined septum
Cool to ≤6°C, 0.008% Na2S2O3, HCl to pH 2 14 days
Total Petroleum Hydrocarbons (TPH)-Diesel
Petroleum Hydrocarbons 1 L
1 L narrow-mouth glass jar w/Teflon lined lid
Cool to ≤6 °C. 1:1 HCl to extend holding time
7 days unpreserved
Total Petroleum Hydrocarbons (TPH)-Gasoline
Petroleum Hydrocarbons
40 mL, NO Headspace
(3) 40 mL vials w/septum HCl, Cool to ≤6°C 14 days
Polychlorinated Biphenyls (PCBs)-Aroclors, EPA 608.3
Persistent Organics 1 to 4 L
1 Liter amber glass bottle (1 gal glass bottle for LVI) w/Teflon lined lid
Cool to ≤6°C 1 year
Semivolatiles (BNA w/TICs) Semivolatiles 3 L
1 gallon amber glass bottle w/Teflon lined lid
Cool to ≤6°C 7 days
Page 31
Parameter Parameter Group
Minimum Quantity Required
Container Preservative Holding Time
Organophosphorus Flame Retardants (OPFR)
Persistent Organics 1 L 1 L amber glass
vial Cool to ≤6°C 14 days
Per- and Polyfluoroalkyl Substances (PFAS)
Persistent Organics 1 L 1 L HDPE bottle Cool to ≤6°C 60 days
Polybrominated Diphenyl Ethers (PBDEs)
Persistent Organics 1 L 1 Liter amber
glass bottle Cool to ≤6 °C 1 year
Polychlorinated Biphenyls (PCBs)-Congeners, EPA 1668
Persistent Organics 1 L 2.5 L amber glass
bottle Cool to ≤6°C 1 year
Alkylphenols, Bisphenol Phenolics 750 mL 1 L w/m glass jar,
pre-preserved H2SO4; Cool to ≤6 °C 28 days
Total Organic Carbon (TOC) Conventionals 125 mL
125 mL n/m poly bottle, pre-preserved
1:1 HCl to pH<2; Cool to ≤6°C 28 days
Dissolved Organic Carbon (DOC) Conventionals 125 mL
125 mL n/m poly bottle, pre-preserved; 0.45um pore size filters
Filter in field with 0.45um pore size filter; 1:1 HCl to pH<2; Cool to ≤6°C
28 days
Hardness Conventionals 100 mL 125 mL w/m poly bottle, pre-preserved
H2SO4 to pH <2, cool to ≤6°C until preservation
6 months
8.4 Equipment decontamination Grab samples will be conducted using certified clean containers from the respective laboratories. Decontamination of ISCO equipment such as tubing and sample bottles, as well as any other sampling equipment, will follow Ecology’s SOP EAP090 (Friese 2014), which describes decontamination procedures for various chemical groups.
For PFAS sample collection, field staff will follow guidance issued by MDEQ on steps to avoid PFAS cross-contamination (MDEQ 2018). Briefly, staff will not use any equipment or material containing fluoropolymers or Teflon®, blue ice, paper towels, Sharpie® markers, water-resistant clothing such as those containing Gore-TexTM, and other clothing and personal care products listed in MDEQ (2018). However, because some parameters require us to use Teflon® containers or containers with Teflon® lined lids, we will take actions to avoid cross-contamination, such as changing nitrile gloves for PFAS sample collection, and storing PFAS sample containers separate from other containers.
8.5 Sample ID Sample IDs will be assigned by MEL and the contract lab.
Page 32
8.6 Chain of custody Chain of custody will be maintained for all samples. We will use the respective laboratory’s chain of custody form for shipment of samples to the laboratories.
8.7 Field log requirements A field notebook will be used to record data and information during each site visit. At minimum, the following will be recorded: • Location, date, time • Field personnel • Description of each sample collected • Field measurement results and calculations • Identity of QC samples collected • Unusual circumstances that might affect interpretation of results • Any changes or deviations from the QAPP
8.8 Other activities We will obtain flow information collected by each facility for the date, time, and discharge points of our sampling. Flow data will be used to calculate aliquot volumes for flow-proportional composite samples.
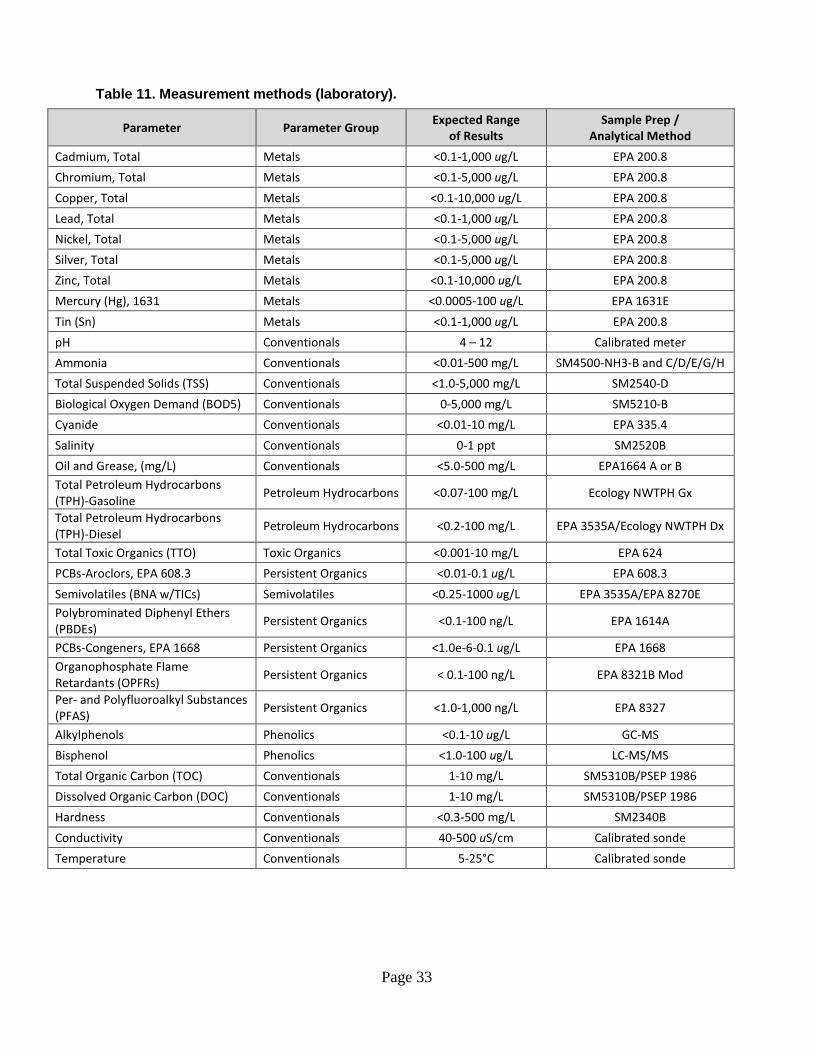
9.0 Laboratory Procedures 9.1 Lab procedures table See Table 11.
9.2 Sample preparation method(s) Sample preparation methods are given in Table 11.
9.3 Special method requirements Because there is no published method for PFAS outside of drinking water at the time this QAPP is being prepared, the specific method for PFAS will be determined by the contract laboratory that is currently accredited to perform PFAS for effluent samples, and that can meet the desired reporting limits for this project.
9.4 Laboratories accredited for methods Samples will be analyzed by MEL or an accredited contract lab. Table 3 lists whether the parameter will be analyzed by MEL or a contract lab.
Page 33
Table 11. Measurement methods (laboratory).
Parameter Parameter Group Expected Range of Results
Sample Prep / Analytical Method
Cadmium, Total Metals <0.1-1,000 ug/L EPA 200.8 Chromium, Total Metals <0.1-5,000 ug/L EPA 200.8 Copper, Total Metals <0.1-10,000 ug/L EPA 200.8 Lead, Total Metals <0.1-1,000 ug/L EPA 200.8 Nickel, Total Metals <0.1-5,000 ug/L EPA 200.8 Silver, Total Metals <0.1-5,000 ug/L EPA 200.8 Zinc, Total Metals <0.1-10,000 ug/L EPA 200.8 Mercury (Hg), 1631 Metals <0.0005-100 ug/L EPA 1631E Tin (Sn) Metals <0.1-1,000 ug/L EPA 200.8 pH Conventionals 4 – 12 Calibrated meter Ammonia Conventionals <0.01-500 mg/L SM4500-NH3-B and C/D/E/G/H Total Suspended Solids (TSS) Conventionals <1.0-5,000 mg/L SM2540-D Biological Oxygen Demand (BOD5) Conventionals 0-5,000 mg/L SM5210-B Cyanide Conventionals <0.01-10 mg/L EPA 335.4 Salinity Conventionals 0-1 ppt SM2520B Oil and Grease, (mg/L) Conventionals <5.0-500 mg/L EPA1664 A or B Total Petroleum Hydrocarbons (TPH)-Gasoline Petroleum Hydrocarbons <0.07-100 mg/L Ecology NWTPH Gx
Total Petroleum Hydrocarbons (TPH)-Diesel Petroleum Hydrocarbons <0.2-100 mg/L EPA 3535A/Ecology NWTPH Dx
Total Toxic Organics (TTO) Toxic Organics <0.001-10 mg/L EPA 624 PCBs-Aroclors, EPA 608.3 Persistent Organics <0.01-0.1 ug/L EPA 608.3 Semivolatiles (BNA w/TICs) Semivolatiles <0.25-1000 ug/L EPA 3535A/EPA 8270E Polybrominated Diphenyl Ethers (PBDEs) Persistent Organics <0.1-100 ng/L EPA 1614A
PCBs-Congeners, EPA 1668 Persistent Organics <1.0e-6-0.1 ug/L EPA 1668 Organophosphate Flame Retardants (OPFRs) Persistent Organics < 0.1-100 ng/L EPA 8321B Mod
Per- and Polyfluoroalkyl Substances (PFAS) Persistent Organics <1.0-1,000 ng/L EPA 8327
Alkylphenols Phenolics <0.1-10 ug/L GC-MS Bisphenol Phenolics <1.0-100 ug/L LC-MS/MS Total Organic Carbon (TOC) Conventionals 1-10 mg/L SM5310B/PSEP 1986 Dissolved Organic Carbon (DOC) Conventionals 1-10 mg/L SM5310B/PSEP 1986 Hardness Conventionals <0.3-500 mg/L SM2340B Conductivity Conventionals 40-500 uS/cm Calibrated sonde Temperature Conventionals 5-25°C Calibrated sonde
Page 34
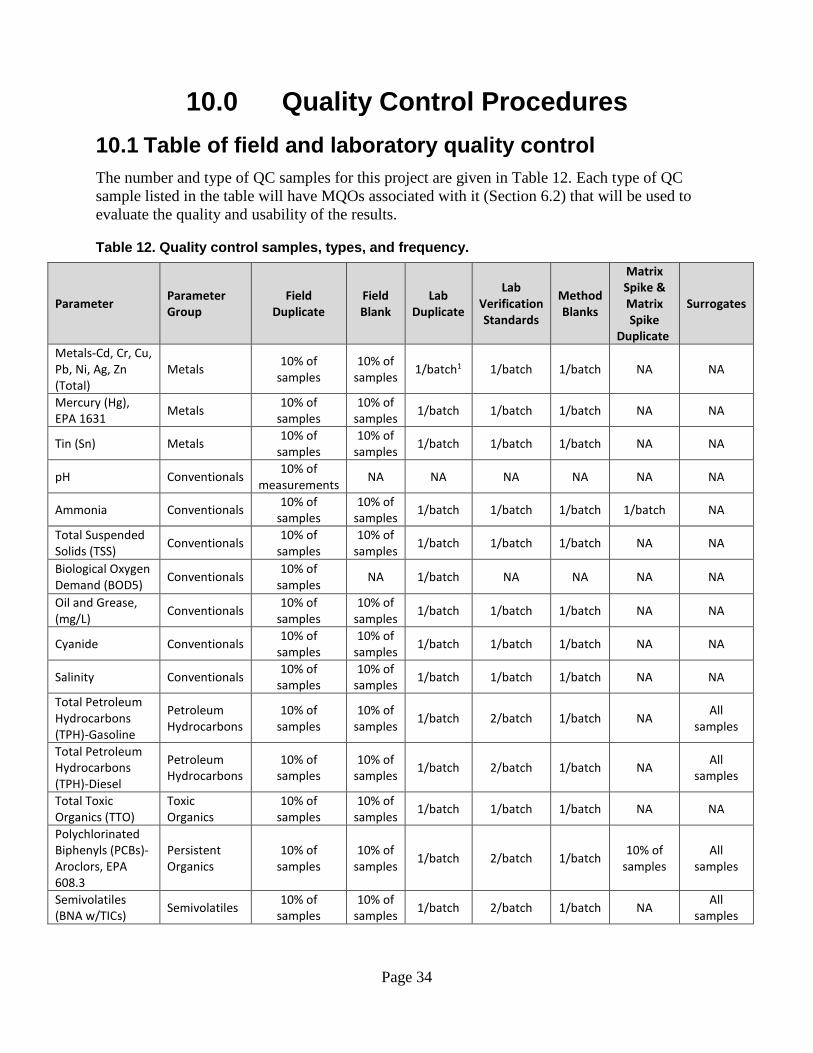
10.0 Quality Control Procedures 10.1 Table of field and laboratory quality control The number and type of QC samples for this project are given in Table 12. Each type of QC sample listed in the table will have MQOs associated with it (Section 6.2) that will be used to evaluate the quality and usability of the results.
Table 12. Quality control samples, types, and frequency.
Parameter Parameter Group
Field Duplicate
Field Blank
Lab Duplicate
Lab Verification Standards
Method Blanks
Matrix Spike & Matrix Spike
Duplicate
Surrogates
Metals-Cd, Cr, Cu, Pb, Ni, Ag, Zn (Total)
Metals 10% of samples
10% of samples 1/batch1 1/batch 1/batch NA NA
Mercury (Hg), EPA 1631 Metals 10% of
samples 10% of
samples 1/batch 1/batch 1/batch NA NA
Tin (Sn) Metals 10% of samples
10% of samples 1/batch 1/batch 1/batch NA NA
pH Conventionals 10% of measurements NA NA NA NA NA NA
Ammonia Conventionals 10% of samples
10% of samples 1/batch 1/batch 1/batch 1/batch NA
Total Suspended Solids (TSS) Conventionals 10% of
samples 10% of
samples 1/batch 1/batch 1/batch NA NA
Biological Oxygen Demand (BOD5) Conventionals 10% of
samples NA 1/batch NA NA NA NA
Oil and Grease, (mg/L) Conventionals 10% of
samples 10% of
samples 1/batch 1/batch 1/batch NA NA
Cyanide Conventionals 10% of samples
10% of samples 1/batch 1/batch 1/batch NA NA
Salinity Conventionals 10% of samples
10% of samples 1/batch 1/batch 1/batch NA NA
Total Petroleum Hydrocarbons (TPH)-Gasoline
Petroleum Hydrocarbons
10% of samples
10% of samples 1/batch 2/batch 1/batch NA All
samples
Total Petroleum Hydrocarbons (TPH)-Diesel
Petroleum Hydrocarbons
10% of samples
10% of samples 1/batch 2/batch 1/batch NA All
samples
Total Toxic Organics (TTO)
Toxic Organics
10% of samples
10% of samples 1/batch 1/batch 1/batch NA NA
Polychlorinated Biphenyls (PCBs)-Aroclors, EPA 608.3
Persistent Organics
10% of samples
10% of samples 1/batch 2/batch 1/batch 10% of
samples All
samples
Semivolatiles (BNA w/TICs) Semivolatiles 10% of
samples 10% of
samples 1/batch 2/batch 1/batch NA All samples
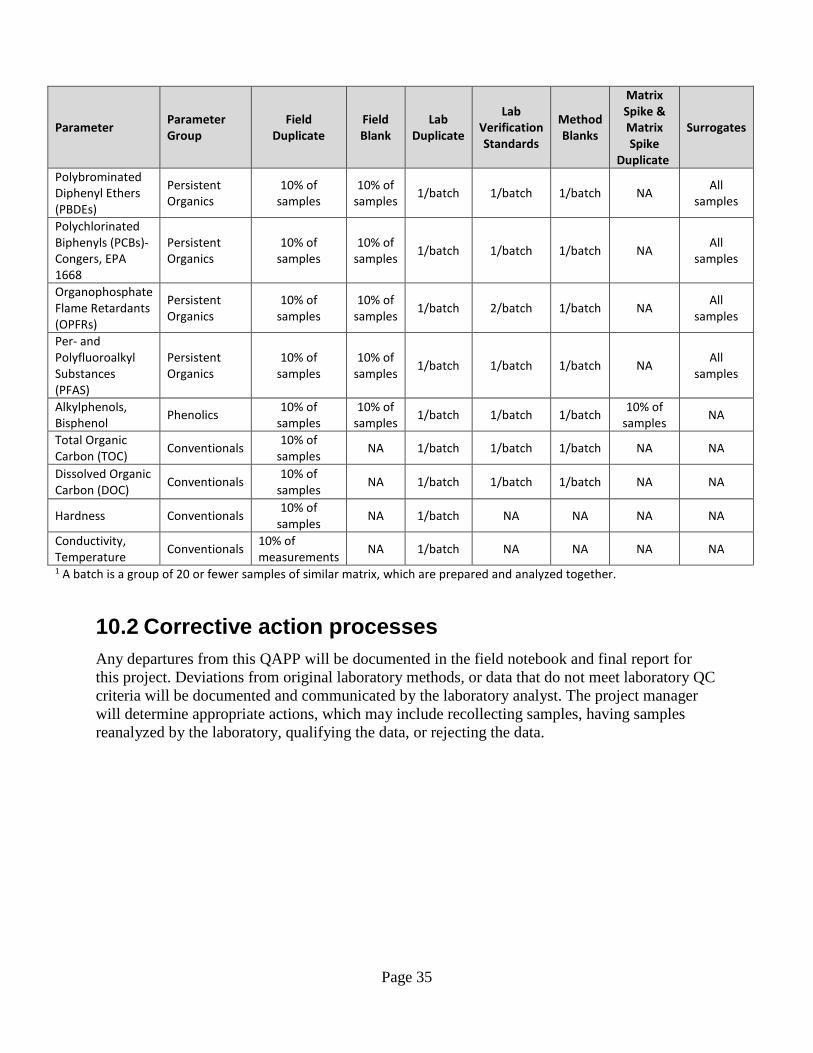
Page 35
Parameter Parameter Group
Field Duplicate
Field Blank
Lab Duplicate
Lab Verification Standards
Method Blanks
Matrix Spike & Matrix Spike
Duplicate
Surrogates
Polybrominated Diphenyl Ethers (PBDEs)
Persistent Organics
10% of samples
10% of samples 1/batch 1/batch 1/batch NA All
samples
Polychlorinated Biphenyls (PCBs)-Congers, EPA 1668
Persistent Organics
10% of samples
10% of samples 1/batch 1/batch 1/batch NA All
samples
Organophosphate Flame Retardants (OPFRs)
Persistent Organics
10% of samples
10% of samples 1/batch 2/batch 1/batch NA All
samples
Per- and Polyfluoroalkyl Substances (PFAS)
Persistent Organics
10% of samples
10% of samples 1/batch 1/batch 1/batch NA All
samples
Alkylphenols, Bisphenol Phenolics 10% of
samples 10% of
samples 1/batch 1/batch 1/batch 10% of samples NA
Total Organic Carbon (TOC) Conventionals 10% of
samples NA 1/batch 1/batch 1/batch NA NA
Dissolved Organic Carbon (DOC) Conventionals 10% of
samples NA 1/batch 1/batch 1/batch NA NA
Hardness Conventionals 10% of samples NA 1/batch NA NA NA NA
Conductivity, Temperature Conventionals 10% of
measurements NA 1/batch NA NA NA NA 1 A batch is a group of 20 or fewer samples of similar matrix, which are prepared and analyzed together.
10.2 Corrective action processes Any departures from this QAPP will be documented in the field notebook and final report for this project. Deviations from original laboratory methods, or data that do not meet laboratory QC criteria will be documented and communicated by the laboratory analyst. The project manager will determine appropriate actions, which may include recollecting samples, having samples reanalyzed by the laboratory, qualifying the data, or rejecting the data.
Page 36
11.0 Data Management Procedures 11.1 Data recording and reporting requirements Data and information will be recorded in a field notebook (See Section 8.7). Errors in the field notebook will be corrected by a single strike-through line, corrected, initialed, and dated. Pertinent field data and information will be transferred to an EIM template that will be uploaded to Ecology’s EIM database. Laboratory data will also be transferred to an EIM template and uploaded to the EIM database.
11.2 Laboratory data package requirements For all supplemental parameter data, a Tier 4 data package will be requested. A level 2B data validation will be conducted by MEL, or contracted out if MEL cannot support the timeline. The data validation will include conversion of contract laboratory qualifiers to MEL-amended qualifiers. The data validator will provide the project manager with a case narrative and final validated dataset. Case narratives will include QC results, any problems encountered during sample analysis, corrective actions, deviations from methods, and explanation of data qualifiers.
11.3 Electronic transfer requirements Laboratory data will be delivered as an electronic data deliverable in Microsoft Excel spreadsheet format that meets MEL’s formatting requirements for uploading to EIM.
11.4 EIM/STORET data upload procedures Data collected from this project will be uploaded into EIM following EAP protocols. A second EAP staff member will review the data uploaded into EIM and make note of any errors. The final corrected data will be reviewed by the project manager.
11.5 Model information management NA
12.0 Audits and Reports 12.1 Field, laboratory, and other audits No field audits are planned specifically for this project. MEL and the contract laboratories undergo regular audits to receive and maintain accreditation.
12.2 Responsible personnel NA
Page 37
12.3 Frequency and distribution of reports For this project, data results will be summarized in the form of a final report using EAP’s report template. At minimum, the EAP report will include:
• Data summary table(s) showing results for each parameter and facility. • Assessment of supplemental parameter results in pretreated industrial wastewater.
An additional report(s) will be produced by WQP, which will provide and assess results of the compliance monitoring.
12.4 Responsibility for reports The project manager will author the final EAP report.
13.0 Data Verification 13.1 Field data verification, requirements, and responsibilities The project manager will verify all field data and information.
13.2 Laboratory data verification The laboratory conducting the analysis will review and verify laboratory results according to the laboratory’s established protocols. MEL’s Quality Assurance Coordinator or a contracted data validation firm will serve as an independent third-party and review, verify, and validate contract lab data.
13.3 Validation requirements, if necessary A Tier 4 data package will be requested for supplemental parameter data. MEL’s Quality Assurance Coordinator or contracted data validation firm will conduct a review equivalent to an EPA Level 2B Data Validation. The data validator will prepare a memo of the data validation results, including an overall assessment of data quality and usability, an evaluation of MQOs, and evaluation of instrument quality control and performance.
To facilitate communication between EAP and the data validator about validation requirements, EAP will complete and send an internal data validation checklist to the data validator (Appendix A).
13.4 Model quality assessment NA
Page 38
14.0 Data Quality (Usability) Assessment 14.1 Process for determining project objectives were met The project manager will make a final assessment of whether project data have met MQOs and are deemed useable. The data will either be accepted, accepted with qualification, or rejected. If MQOs are rejected, the project manager, in consultation with the client and laboratory, will decide whether samples should be re-analyzed.
14.2 Treatment of non-detects The following qualifiers will be used for non-detects, estimates, and tentatively-identified analytes: • U - Analyte was not detected at or above the reported result. • J - Analyte was positively identified. The reported result is an estimate. • UJ - Analyte was not detected at or above the reported estimate. • NJ - Analyte has been “tentatively identified”. The reported result is an estimate. • R - The sample results are rejected due to severe deficiencies in the ability to analyze the
sample and meet the quality control criteria. The presence or absence of the compound cannot be verified.
For this project, U, UJ, and NJ qualified data will be treated as non-detects. Congener results that are less than 10 times the detected method blank concentration will be qualified as non-detect. Non-detect congener results will not be included in calculations of congener sums (e.g. total PCBs, PBDEs).
14.3 Data analysis and presentation methods Summary tables will be used to present and summarize the final data results. Graphs may also be used to summarize and assess results for the supplemental parameters. The WQP will report and analyze compliance monitoring results separate from the EAP report.
14.4 Sampling design evaluation Data results for compliance parameters will either meet or exceed the specified discharge limits in the industrial user’s permit. Data results for supplemental parameters will be used to assess the presence and concentrations of those parameters in effluent samples. The sampling design described in previous sections is expected to be sufficient to answer these questions.
14.5 Documentation of assessment Results and discussion will be documented in the final report.
Page 39
15.0 References Anderson, P. 2016. Standard Operating Procedure for Hydrolab® DataSonde®, MiniSonde®, and HL4 Multiprobes, Version 2.1. Washington State Department of Ecology, Olympia. SOP EAP033.
ATSDR. 1996. ToxFAQs™ for Polycyclic Aromatic Hydrocarbons (PAHs). Agency for Toxic Substances and Disease Registry, Atlanta, GA. https://www.atsdr.cdc.gov/toxfaqs/tf.asp?id=121&tid=25
ATSDR. 1999. ToxFAQsTM for Total Petroleum Hydrocarbons (TPH). Agency for Toxic Substances and Disease Registry, Atlanta, GA. https://www.atsdr.cdc.gov/toxfaqs/tf.asp?id=423&tid=75
ATSDR. 2006. ToxFAQs™ for Cyanide. Agency for Toxic Substances and Disease Registry, Atlanta, GA. https://www.atsdr.cdc.gov/toxfaqs/tf.asp?id=71&tid=19
ATSDR. 2012. ToxFAQs™ for Phosphate Ester Flame Retardants. Agency for Toxic Substances and Disease Registry, Atlanta, GA. https://www.atsdr.cdc.gov/toxfaqs/tf.asp?id=1164&tid=239
ATSDR. 2018. Toxicological Profile for Perfluoroalkyls. Agency for Toxic Substances and Disease Registry. https://www.atsdr.cdc.gov/toxprofiles/tp200.pdf Clara, M., C. Scheffknecht, S. Scharf, S. Weiss, and O. Gans. 2008. Emissions of perfluorinated alkylated substances (PFAS) from point sources—identification of relevant branches. Water Science & Technology, 58.1:59-66.
Davies, H. 2015. PCB Chemical Action Plan. Washington State Department of Ecology, Olympia, WA. Publication 15-07-002. https://fortress.wa.gov/ecy/publications/documents/1507002.pdf
Ecology and Herrera Environmental Consultants, Inc. 2010. Phase 3: Loadings of Toxic Chemicals to Puget Sound from POTW Discharge of Treated Wastewater. Washington State Department of Ecology, Olympia, WA. Publication 10-10-057. https://fortress.wa.gov/ecy/publications/documents/1010057.pdf
EPA. 1985. Guidance Manual for Implementing Total Toxic Organics (TTO) Pretreatment Standards. Diane Publishing Co., Darby, PA. https://www3.epa.gov/npdes/pubs/owm0021.pdf
EPA. 1999. Introduction to the National Pretreatment Program. Office of Wastewater Management, United States Environmental Protection Agency. EPA-833-B-98-002. https://www3.epa.gov/npdes/pubs/final99.pdf
EPA. 2010. An Exposure Assessment of Polybrominated Diphenyl Ethers. United States Environmental Protection Agency, National Center for Environmental Assessment, Washington, DC. EPA-600-R-08-086F.
Page 40
EPA. 2017. Technical Fact Sheet – Polybrominated Diphenyl Ethers (PBDEs). United States Environmental Protection Agency. EPA 505-F-17-015. https://www.epa.gov/sites/production/files/2014-03/documents/ffrrofactsheet_contaminant_perchlorate_january2014_final_0.pdf
Friese, M. 2014. Standard Operating Procedure for Decontaminating Field Equipment for Sampling Toxics in the Environment, Version 1.1. Revised by J. Medlen. Recertified February 2017. Washington State Department of Ecology, Olympia. SOP EAP090.
LimnoTech. 2016. 2016 Comprehensive Plan to Reduce Polychlorinated Biphenyls (PCBs) in the Spokane River. Prepared for the Spokane River Regional Toxics Task Force. http://srrttf.org/wp-content/uploads/2016/04/2016_Comp_Plan_Final_Approved.pdf
Lubliner, B., D. deLeon, and J. Lowe. Standard Operating Procedure for Automatic Sampling for Stormwater Monitoring, Version 1.1. Washington State Department of Ecology, Olympia. SOP EAP090. Publication 18-10-024. https://fortress.wa.gov/ecy/publications/SummaryPages/1810024.html
Masters, G. 1998. Introduction to Environmental Engineering and Science, 2nd ed. Prentice Hall, Inc., Upper Saddle River, NJ.
Michigan Department of Environmental Quality. 2018. Wastewater PFAS Sampling Guidance. https://www.michigan.gov/documents/pfasresponse/Wastewater_PFAS_Sampling_Guidance_636791_7.pdf
National Center for Biotechnology Information. PubChem Database. Bisphenol A, CID=6623, https://pubchem.ncbi.nlm.nih.gov/compound/Bisphenol-A (accessed on Oct. 2, 2019).
North, K. 2004. Tracking Polybrominated Diphenyl Ether Releases in a Wastewater Treatment Plant Effluent, Palo Alto, California. Environmental Science & Technology, 38:4484-4488.
Norton, D., D. Serdar, J. Colton, R. Jack, and D, Lester. 2011. Control of Toxic Chemicals in Puget Sound: Assessment of Selected Toxic Chemicals in the Puget Sound Basin, 2007-2011. Washington State Department of Ecology, Olympia, WA. Publication 11-03-055. https://fortress.wa.gov/ecy/publications/documents/1103055.pdf
O’Neill, S., A.J. Carey, J.A. Lanksbury, L.A. Nielwolny, G. Ylitalo, L. Johnson, and J.E. West. 2015. Toxic contaminants in juvenile Chinook salmon (Oncorhynchus tshawytscha) migrating through estuary, nearshore and offshore habitats of Puget Sound. Washington Department of Fish and Wildlife, Olympia, WA. Report No. FPT 16-02. https://wdfw.wa.gov/publications/01796
Rice, J., J. Baker, K. Biedenweg, P. Christie, T. Francis, J. Gaydos, P. MacCready, C. Milesi, C. Simenstad, A. Snover, and L. Symer. 2015. Puget Sound Fact Book, version 3.1. Encyclopedia of Puget Sound, University of Washington Puget Sound Institute, Tacoma, WA. https://www.eopugetsound.org/sites/default/files/features/resources/PugetSoundFactbook_v3.1.pdf
Page 41
Roberts, T. 2017. Toxics Projects in Puget Sound, 2011-2018, Funded by the NEP Toxics and Nutrients Prevention, Reduction, and Control Cooperative Agreement. Washington State Department of Ecology, Olympia, WA. Publication 17-03-003. https://fortress.wa.gov/ecy/publications/documents/1703003.pdf
Rodenburg, L.A. and Leidos. Green-Duwamish River Watershed: PCB Congener Study: Phase 2 Source Evaluation. Prepared for Washington State Department of Ecology, Toxics Cleanup Program. https://apps.ecology.wa.gov/gsp/CleanupSiteDocuments.aspx?csid=1643
Thurston, R.V. and R.C. Russo. 1981. Ammonia toxicity to fishes. Effect of pH on the toxicity of the un-ionized ammonia species. Environmental Science & Technology, 15:937-840.
Urmos-Berry, E. 2019. Standard Operating Procedure for Manually Obtaining Surface Water Samples, Version 1.4. Washington State Department of Ecology, Olympia. SOP EAP015.
Yang, J., Y. Zhao, M. Li, M. Du, X. Li, and Y. Li. 2019. A Review of a Class of Emerging Contaminants: The Classification, Distribution, Intensity of Consumption, Synthesis Routes, Environmental Effects and Expectation of Pollution Abatement to Organophosphate Flame Retardants (OPFRs). International Journal of Molecular Sciences. 20:2874. https://www.mdpi.com/1422-0067/20/12/2874/htm
Zier, J. and J. Gaydos. 2016. The Growing Number of Species of Concern in the Salish Sea Suggests Ecosystem Decay is Outpacing Recovery. Proceedings of the 2016 Salish Sea Ecosystem Conference, April 13-15, 2016, Vancouver, BC. https://www.eopugetsound.org/sites/default/files/Zier-and-Gaydos-2016-Salish-Sea-Species-of-Concern-FINAL.pdf
Page 42
16.0 Appendices Appendix A. Checklist for Communicating Project Requirements for Validation of Contract Lab Data Packages for Organics Analyses This checklist provides guidance from Project Managers (PMs) to MEL’s validator of contract lab (CL) data packages for the tasks to be completed by MEL’s validator for organics data CL packages. These data packages typically include HRMS analyses, but can also include low level LC-MS/MS methods.
Tier 4 data packages should always be requested in the Statement of Work for contracts unless otherwise stated. This does not mean that all data packages require Stage 4 validation, but the information necessary to conduct Stage 4 validation is available if needed.
Validation checklist:
1. Follow MEL SOP #770043 (In draft) Data Validation of Contracted HRMS Analytical Data.
2. Check that the data package and electronic data deliverables (EDDs) comply with all items in the Statement of Work and the Quality Assurance Project Plan. Make corrections (or have lab correct) where needed. Be certain to check the following: a. Check the EDD for required formatting of all fields, particularly the
“parameter name” for PCB congeners. b. Check that the SOW-required LOQs for all analytes were met for each
sample result (includes lab reps and SRM/CRM).
3. Conduct the following level of Verification and Validation as defined in Appendix A of EPA’s “Guidance for Labeling Externally Validated Laboratory Analytical Data for Superfund Use”: EPA 540-R-08-005, January 2009.
□ Stage 2B □ Stage 3 □ Stage 4
4. Amend the original EDD as described in MEL SOP#770043 by adding and populating the MEL Amended Result and MEL Amended Qualifier. Add “Reason for MEL qualification” code definitions to the case narrative.
MEL Amended Result
MEL Amended Qualifier
Reason for MEL Qualification
Page 43
5. If the CL provided multiple EDDs, amend each one as appropriate (do not combine multiple EDDs into one final EDD).
6. Do not recalculate homolog totals, totals or TEQs, except as requested by the PM. If requested, state in the case narrative whether totals or TEQs have been recalculated based on the validated data.
7. Exclude evaluation of the standard or certified reference materials (SRM/CRM) other than treating it as another sample.
8. Censor results on the Laboratory Method Blank. Do not use other types of blanks.
9. Use the following basis for censoring (recommend 5x the Laboratory Method Blank as default for HRMS):
□ 3x □ 5x □ 8x □ 10x
10. Do not conduct the following as part of validation unless requested: • Do not change NJ qualified results that are greater than EQL (or LOQ) to J
based on chromatograms. • Do not re-censor results based on the IRV (instrument response value) of
method blanks where the CL qualified these as U but review of the chromatogram suggests the analyte is present.
Page 44
Appendix B. Glossaries, Acronyms, and Abbreviations Glossary of General Terms Clean Water Act: A federal act passed in 1972 that contains provisions to restore and maintain the quality of the nation’s waters. Section 303(d) of the Clean Water Act establishes the TMDL program.
Conductivity: A measure of water’s ability to conduct an electrical current. Conductivity is related to the concentration and charge of dissolved ions in water.
Effluent: An outflowing of water from a natural body of water or from a human-made structure. For example, the treated outflow from a wastewater treatment plant.
National Pollutant Discharge Elimination System (NPDES): National program for issuing, modifying, revoking and reissuing, terminating, monitoring, and enforcing permits, and imposing and enforcing pretreatment requirements under the Clean Water Act. The NPDES program regulates discharges from wastewater treatment plants, large factories, and other facilities that use, process, and discharge water back into lakes, streams, rivers, bays, and oceans.
Nutrient: Substance such as carbon, nitrogen, and phosphorus used by organisms to live and grow. Too many nutrients in the water can promote algal blooms and rob the water of oxygen vital to aquatic organisms.
pH: A measure of the acidity or alkalinity of water. A low pH value (0 to 7) indicates that an acidic condition is present, while a high pH (7 to 14) indicates a basic or alkaline condition. A pH of 7 is considered to be neutral. Since the pH scale is logarithmic, a water sample with a pH of 8 is ten times more basic than one with a pH of 7.
Pollution: Contamination or other alteration of the physical, chemical, or biological properties of any waters of the state. This includes change in temperature, taste, color, turbidity, or odor of the waters. It also includes discharge of any liquid, gaseous, solid, radioactive, or other substance into any waters of the state. This definition assumes that these changes will, or are likely to, create a nuisance or render such waters harmful, detrimental, or injurious to (1) public health, safety, or welfare, or (2) domestic, commercial, industrial, agricultural, recreational, or other legitimate beneficial uses, or (3) livestock, wild animals, birds, fish, or other aquatic life.
Publicly Owned Treatment Work (POTW): A municipal or public service district sewage treatment system.
Salmonid: Fish that belong to the family Salmonidae. Species of salmon, trout, or char.
Stormwater: The portion of precipitation that does not naturally percolate into the ground or evaporate but instead runs off roads, pavement, and roofs during rainfall or snow melt. Stormwater can also come from hard or saturated grass surfaces such as lawns, pastures, playfields, and from gravel roads and parking lots.
Page 45
Total suspended solids (TSS): Portion of solids retained by a filter.
Turbidity: A measure of water clarity. High levels of turbidity can have a negative impact on aquatic life.
Watershed: A drainage area or basin in which all land and water areas drain or flow toward a central collector such as a stream, river, or lake at a lower elevation.
303(d) list: Section 303(d) of the federal Clean Water Act, requiring Washington State to periodically prepare a list of all surface waters in the state for which beneficial uses of the water – such as for drinking, recreation, aquatic habitat, and industrial use – are impaired by pollutants. These are water quality-limited estuaries, lakes, and streams that fall short of state surface water quality standards and are not expected to improve within the next two years.
Acronyms and Abbreviations BMP Best management practice CRM Certified reference material CCV Continuing calibration verification DOC Dissolved organic carbon e.g. For example Ecology Washington State Department of Ecology EIM Environmental Information Management database EPA U.S. Environmental Protection Agency et al. And others i.e. In other words LCS Laboratory control sample MEL Manchester Environmental Laboratory MQO Measurement quality objective NPDES (See Glossary above) OPFR Organophosphate flame retardant PBDE Polybrominated diphenyl ether PBT Persistent, bioaccumulative, and toxic substance PCB Polychlorinated biphenyl PFAS Per- and poly-fluoroalkyl substances POTW (See Glossary above) QA Quality assurance QC Quality control RPD Relative percent difference SOP Standard operating procedures TMDL (See Glossary above) TOC Total organic carbon TSS (See Glossary above) USGS United States Geological Survey WAC Washington Administrative Code
Page 46
Units of Measurement
°C degrees centigrade km kilometer, a unit of length equal to 1,000 meters m meter mm millimeter mg milligram mg/L milligrams per liter (parts per million) mL milliliter ng/L nanograms per liter (parts per trillion) pg/L picograms per liter (parts per quadrillion) μg/L micrograms per liter (parts per billion) μS/cm microsiemens per centimeter, a unit of conductivity
Quality Assurance Glossary Accreditation: A certification process for laboratories, designed to evaluate and document a lab’s ability to perform analytical methods and produce acceptable data. For Ecology, it is “Formal recognition by (Ecology)…that an environmental laboratory is capable of producing accurate analytical data.” [WAC 173-50-040] (Kammin, 2010)
Accuracy: The degree to which a measured value agrees with the true value of the measured property. USEPA recommends that this term not be used, and that the terms precision and bias be used to convey the information associated with the term accuracy (USGS, 1998).
Analyte: An element, ion, compound, or chemical moiety (pH, alkalinity) which is to be determined. The definition can be expanded to include organisms, e.g., fecal coliform, Klebsiella (Kammin, 2010).
Bias: The difference between the sample mean and the true value. Bias usually describes a systematic difference reproducible over time and is characteristic of both the measurement system and the analyte(s) being measured. Bias is a commonly used data quality indicator (DQI) (Kammin, 2010; Ecology, 2004).
Blank: A synthetic sample, free of the analyte(s) of interest. For example, in water analysis, pure water is used for the blank. In chemical analysis, a blank is used to estimate the analytical response to all factors other than the analyte in the sample. In general, blanks are used to assess possible contamination or inadvertent introduction of analyte during various stages of the sampling and analytical process (USGS, 1998).
Calibration: The process of establishing the relationship between the response of a measurement system and the concentration of the parameter being measured (Ecology, 2004).
Check standard: A substance or reference material obtained from a source independent from the source of the calibration standard; used to assess bias for an analytical method. This is an obsolete term, and its use is highly discouraged. See Calibration Verification Standards, Lab Control Samples (LCS), Certified Reference Materials (CRM), and/or spiked blanks. These are all check standards but should be referred to by their actual designator, e.g., CRM, LCS (Kammin, 2010; Ecology, 2004).
Page 47
Comparability: The degree to which different methods, data sets and/or decisions agree or can be represented as similar; a data quality indicator (USEPA, 1997).
Completeness: The amount of valid data obtained from a project compared to the planned amount. Usually expressed as a percentage. A data quality indicator (USEPA, 1997).
Continuing Calibration Verification Standard (CCV): A quality control (QC) sample analyzed with samples to check for acceptable bias in the measurement system. The CCV is usually a midpoint calibration standard that is re-run at an established frequency during the course of an analytical run (Kammin, 2010).
Control chart: A graphical representation of quality control results demonstrating the performance of an aspect of a measurement system (Kammin, 2010; Ecology 2004).
Control limits: Statistical warning and action limits calculated based on control charts. Warning limits are generally set at +/- 2 standard deviations from the mean, action limits at +/- 3 standard deviations from the mean (Kammin, 2010).
Data integrity: A qualitative DQI that evaluates the extent to which a data set contains data that is misrepresented, falsified, or deliberately misleading (Kammin, 2010).
Data quality indicators (DQI): Commonly used measures of acceptability for environmental data. The principal DQIs are precision, bias, representativeness, comparability, completeness, sensitivity, and integrity (USEPA, 2006).
Data quality objectives (DQO): Qualitative and quantitative statements derived from systematic planning processes that clarify study objectives, define the appropriate type of data, and specify tolerable levels of potential decision errors that will be used as the basis for establishing the quality and quantity of data needed to support decisions (USEPA, 2006).
Data set: A grouping of samples organized by date, time, analyte, etc. (Kammin, 2010).
Data validation: An analyte-specific and sample-specific process that extends the evaluation of data beyond data verification to determine the usability of a specific data set. It involves a detailed examination of the data package, using both professional judgment and objective criteria, to determine whether the MQOs for precision, bias, and sensitivity have been met. It may also include an assessment of completeness, representativeness, comparability, and integrity, as these criteria relate to the usability of the data set. Ecology considers four key criteria to determine if data validation has actually occurred. These are: • Use of raw or instrument data for evaluation. • Use of third-party assessors. • Data set is complex. • Use of EPA Functional Guidelines or equivalent for review.
Page 48
Examples of data types commonly validated would be: • Gas Chromatography (GC). • Gas Chromatography-Mass Spectrometry (GC-MS). • Inductively Coupled Plasma (ICP).
The end result of a formal validation process is a determination of usability that assigns qualifiers to indicate usability status for every measurement result. These qualifiers include: • No qualifier – data are usable for intended purposes. • J (or a J variant) – data are estimated, may be usable, may be biased high or low. • REJ – data are rejected, cannot be used for intended purposes.
(Kammin, 2010; Ecology, 2004).
Data verification: Examination of a data set for errors or omissions, and assessment of the Data Quality Indicators related to that data set for compliance with acceptance criteria (MQOs). Verification is a detailed quality review of a data set (Ecology, 2004).
Detection limit (limit of detection): The concentration or amount of an analyte which can be determined to a specified level of certainty to be greater than zero (Ecology, 2004).
Duplicate samples: Two samples taken from and representative of the same population, and carried through and steps of the sampling and analytical procedures in an identical manner. Duplicate samples are used to assess variability of all method activities including sampling and analysis (USEPA, 1997).
Field blank: A blank used to obtain information on contamination introduced during sample collection, storage, and transport (Ecology, 2004).
Initial Calibration Verification Standard (ICV): A QC sample prepared independently of calibration standards and analyzed along with the samples to check for acceptable bias in the measurement system. The ICV is analyzed prior to the analysis of any samples (Kammin, 2010).
Laboratory Control Sample (LCS): A sample of known composition prepared using contaminant-free water or an inert solid that is spiked with analytes of interest at the midpoint of the calibration curve or at the level of concern. It is prepared and analyzed in the same batch of regular samples using the same sample preparation method, reagents, and analytical methods employed for regular samples (USEPA, 1997).
Matrix spike: A QC sample prepared by adding a known amount of the target analyte(s) to an aliquot of a sample to check for bias due to interference or matrix effects (Ecology, 2004).
Measurement Quality Objectives (MQOs): Performance or acceptance criteria for individual data quality indicators, usually including precision, bias, sensitivity, completeness, comparability, and representativeness (USEPA, 2006).
Measurement result: A value obtained by performing the procedure described in a method (Ecology, 2004).
Page 49
Method: A formalized group of procedures and techniques for performing an activity (e.g., sampling, chemical analysis, data analysis), systematically presented in the order in which they are to be executed (EPA, 1997).
Method blank: A blank prepared to represent the sample matrix, prepared and analyzed with a batch of samples. A method blank will contain all reagents used in the preparation of a sample, and the same preparation process is used for the method blank and samples (Ecology, 2004; Kammin, 2010).
Method Detection Limit (MDL): The minimum measured concentration of a substance that can be reported with 99% confidence that the measured concentration is distinguishable from method blank results (Revision 2, 40 CFR Appendix B to Part 136).
Percent Relative Standard Deviation (%RSD): A statistic used to evaluate precision in environmental analysis. It is determined in the following manner:
%RSD = (100 * s)/x
where s is the sample standard deviation and x is the mean of results from more than two replicate samples (Kammin, 2010).
Parameter: A specified characteristic of a population or sample. Also, an analyte or grouping of analytes. Benzene and nitrate + nitrite are all parameters (Kammin, 2010; Ecology, 2004).
Population: The hypothetical set of all possible observations of the type being investigated (Ecology, 2004).
Precision: The extent of random variability among replicate measurements of the same property; a data quality indicator (USGS, 1998).
Quality assurance (QA): A set of activities designed to establish and document the reliability and usability of measurement data (Kammin, 2010).
Quality Assurance Project Plan (QAPP): A document that describes the objectives of a project, and the processes and activities necessary to develop data that will support those objectives (Kammin, 2010; Ecology, 2004).
Quality control (QC): The routine application of measurement and statistical procedures to assess the accuracy of measurement data (Ecology, 2004).
Relative Percent Difference (RPD): RPD is commonly used to evaluate precision. The following formula is used:
[Abs(a-b)/((a + b)/2)] * 100
where “Abs()” is absolute value and a and b are results for the two replicate samples. RPD can be used only with 2 values. Percent Relative Standard Deviation is (%RSD) is used if there are results for more than 2 replicate samples (Ecology, 2004).
Page 50
Replicate samples: Two or more samples taken from the environment at the same time and place, using the same protocols. Replicates are used to estimate the random variability of the material sampled (USGS, 1998).
Representativeness: The degree to which a sample reflects the population from which it is taken; a data quality indicator (USGS, 1998).
Sample (field): A portion of a population (environmental entity) that is measured and assumed to represent the entire population (USGS, 1998).
Sample (statistical): A finite part or subset of a statistical population (USEPA, 1997).
Sensitivity: In general, denotes the rate at which the analytical response (e.g., absorbance, volume, meter reading) varies with the concentration of the parameter being determined. In a specialized sense, it has the same meaning as the detection limit (Ecology, 2004).
Spiked blank: A specified amount of reagent blank fortified with a known mass of the target analyte(s); usually used to assess the recovery efficiency of the method (USEPA, 1997).
Spiked sample: A sample prepared by adding a known mass of target analyte(s) to a specified amount of matrix sample for which an independent estimate of target analyte(s) concentration is available. Spiked samples can be used to determine the effect of the matrix on a method’s recovery efficiency (USEPA, 1997).
Split sample: A discrete sample subdivided into portions, usually duplicates (Kammin, 2010).
Standard Operating Procedure (SOP): A document which describes in detail a reproducible and repeatable organized activity (Kammin, 2010).
Surrogate: For environmental chemistry, a surrogate is a substance with properties similar to those of the target analyte(s). Surrogates are unlikely to be native to environmental samples. They are added to environmental samples for quality control purposes, to track extraction efficiency and/or measure analyte recovery. Deuterated organic compounds are examples of surrogates commonly used in organic compound analysis (Kammin, 2010).
Systematic planning: A step-wise process which develops a clear description of the goals and objectives of a project, and produces decisions on the type, quantity, and quality of data that will be needed to meet those goals and objectives. The DQO process is a specialized type of systematic planning (USEPA, 2006).
References for QA Glossary Ecology, 2004. Guidance for the Preparation of Quality Assurance Project Plans for Environmental Studies. Washington State Department of Ecology, Olympia, WA. https://fortress.wa.gov/ecy/publications/SummaryPages/0403030.html
Kammin, B., 2010. Definition developed or extensively edited by William Kammin, 2010. Washington State Department of Ecology, Olympia, WA.
Page 51
USEPA, 2006. Guidance on Systematic Planning Using the Data Quality Objectives Process EPA QA/G-4. http://www.epa.gov/quality/qs-docs/g4-final.pdf
USGS, 1998. Principles and Practices for Quality Assurance and Quality Control. Open-File Report 98-636. U.S. Geological Survey. http://ma.water.usgs.gov/fhwa/products/ofr98-636.pdf