Embed Size (px)
DESCRIPTION
Details about the financials
Citation preview

Results Presentation
Jan-Sep 2014
November 25th, 2014

November 25th 2014 | 2
225
131
131
196
48
48
178
178
178
234
234
234
243
203
0
235
138
27
129
5
5
Disclaimer
This document has been prepared by Grupo Isolux Corsán, S.A.; therefore no part of it may be published, disclosed or distributed in any form or by any means, nor used by any other person or entity, without the prior written consent of Grupo Isolux Corsán, S.A. This document contains statements related to our future business and financial performance and future events or developments involving us that may constitute forward-looking statements. These statements may be identified by words such as “expects,” “looks forward to,” “anticipates,” “intends,” “plans,” “believes,” “seeks,” “estimates,” “will,” “project” or words of similar meaning. We may also make forward-looking statements in other reports, in presentations, in material delivered to shareholders and in press releases. In addition, our representatives may from time to time make oral forward-looking statements. Such forward-looking statements and information are based on the current expectations and assumptions, and are, therefore, subject to certain risks and uncertainties. A variety of factors, which are beyond our control or may be difficult to predict, affect our operations, performance, business strategy and results and could cause our actual results, performance or achievements to be materially different from any future results, performance or achievements that may be expressed or implied by such forward-looking statements or anticipated on the basis of historical trends. Should one or more risks or uncertainties materialize, or should underlying assumptions prove incorrect, our actual results, performance or achievements may vary materially from those described in the relevant forward-looking statement as being expected, anticipated, intended, planned, believed, sought, estimated or projected. We neither intend, nor assume any obligation, to publicly update or revise these forward-looking statements in light of developments which differ from those anticipated. The information contained in this document has not been verified or revised by the auditors of Grupo Isolux Corsán, S.A. Certain data included in this presentation has been subject to rounding adjustments. Accordingly, in certain instances, the sum of the numbers in a column or a row in tables may not conform exactly to the total figure given for that column or row. This document does not constitute or form part of any offer for sale or subscription of or solicitation or invitation of any offer to buy or subscribe for any securities in any jurisdiction, including in the United States, nor shall it or any part of it form the basis of or be relied on in connection with any contract or commitment whatsoever. Specifically, this presentation does not constitute a “prospectus” within the meaning of the Securities Act.

November 25th 2014 | 3
225
131
131
196
48
48
178
178
178
234
234
234
243
203
0
235
138
27
129
5
5
Results Presentation Q3 2014 | Table of Contents
Table of Contents 1. Key Developments
2. Business and Financial Highlights
i. EPC
ii. Concessions
iii. Other
3. Cash flow and debt overview
4. Appendix

November 25th 2014 | 4
225
131
131
196
48
48
178
178
178
234
234
234
243
203
0
235
138
27
129
5
5
1. Key Developments

November 25th 2014 | 5
225
131
131
196
48
48
178
178
178
234
234
234
243
203
0
235
138
27
129
5
5
Results Presentation Q3 2014 | Key Developments
Group
Mandatory adoption of IFRS 10 & 11 effective from January 2014 Isolux Infrastructure now accounted for by the equity method (vs. proportional in 2013) Group consolidated financials therefore consist mainly of the EPC segment(1)
Comparable 2013 figures included in this presentation were prepared under new accounting rules Segment reporting structure: presenting figures before Equity method adjustments for a better
understanding of Income Statement and Balance sheet
Group
Financials
Q3 YTD 2014 Consolidated revenues reached €1,549 million Excluding FX impact, revenues would have been flat.
Q3 YTD 2014 international revenues stood at 82%, up from 71% in Q3 YTD 2013 Q3 YTD 2014 Consolidated EBITDA: €186 million (+6% growth)
Main growth driven by power generation projects in Latam. Concessions EBITDA increased by 25% vs. the first nine months of 2013
1. Proxy for the Bondholders’ relevant perimeter. Companies included in the financials, but excluded from this perimeter, accounted for €14.9 million Revenue and €11,6 million EBITDA in Q3 YTD2014.
EPC
EPC backlog at €6.6 bn (6% Y-o-Y increase) New orders in Q3 2014 amounted to €633m. Cumulative new orders in the YTD period reached €2.2bn Significant new contracts awarded after September (not included in Q3 YTD backlog): 4 roads in India (€277
million), 2 roads in Bolivia (€81 million), transmission lines in Peru (€400 million) and Mexico (€40 million) and substation in Kuwait (€18 million).
Concessions
Car parks: corporate operation with an external investor to jointly develop (or potentially sell) the business. Agreement signed implies that there is joint control and therefore Car parks is currently consolidated under the equity method.

November 25th 2014 | 6
225
131
131
196
48
48
178
178
178
234
234
234
243
203
0
235
138
27
129
5
5
Results Presentation Q3 2014 | Key Developments
Isolux Corsán Group Key metrics by segment (in € MM, unless otherwise stated) Q3 YTD 2013 Q3 YTD 2014 Change
EPC 1,662 1,541 (7%)
Subtotal 2,044 2,009 (2%)
Concessions 381 447 17%
Other and corporate 1 21 -
Adjustments due to change in consolidation method(1) (253) (460) -
REVENUES
Total consolidated 1,791 1,549 (13%)
Q3 YTD 2013 Q3 YTD 2014 Change
219 203 (7%)
391 452 16%
214 267 25%
(42) (18) 57%
(215) (266) (24%)
EBITDA
175 186 6%
Q3 YTD 2013
13%
19%
56%
n.a.
n.a.
EBITDA Margin
10%
Q3 YTD 2014
13%
22%
60%
n.a.
n.a.
12%
1. Mainly due to equity method consolidation of Isolux Infrastructure
Segment reporting structure aligned with internal management report to clearly present current trading on Income Statement and …

November 25th 2014 | 7
225
131
131
196
48
48
178
178
178
234
234
234
243
203
0
235
138
27
129
5
5
Results Presentation Q3 2014 | Key Developments
Isolux Corsán Group Debt breakdown by segment (in € MM, unless otherwise stated)
Sep 30, 2014
Dec 31, 2013
EPC 174 197
Subtotal 1,552 1,325
Concessions 8 9
Corporate and other 1,370 1,119
Adjustments due to change in consolidation method(1) - -
Bank borrowings and Senior Notes
Total consolidated 1,552 1,325
Sep 30, 2014
Dec 31, 2013
32
3,464
3,260
173
(3,226)
Project Finance(2)
238
Sep 30, 2014
Dec 31, 2013
181 232
615 421
372 179
62 10
(368) (179)
Cash and cash equivalents
247 241
29
2,830
2,628
174
(2,628)
203
1. Mainly due to equity method consolidation of Isolux Infrastructure 2. Guarantees given from Grupo Isolux Corsán to Isolux Infrastructure to finance projects amounted to €229M as of December 31 2013, and €183 M as of September 30, 2014
… Balance Sheet figures
November 25th 2014 | 8
225
131
131
196
48
48
178
178
178
234
234
234
243
203
0
235
138
27
129
5
5
Results Presentation Q3 2014 | Key Developments
FY 2013
Q3 2014
Borrowings(1) 1,325 1,552
Cash and cash equivalents before IFRS 11 421 615
Net Corporate Debt as per bank definition 904 937
LTM EBITDA(4) 250 262
LTM Distributions from concessions 68 41
Increase in gross borrowings is mainly due to working capital funding requirements
LTM Adjusted EBITDA 335 322
Total Net Corporate Leverage(3) 2.7x 2.9x
(1) The relevant bondholders’ perimeter figure would also include Project finance (€203 MM) and Real Estate (€24 MM) for FY 2013 and Project finance (€231 MM), Real Estate (€18 MM) for Q3 YTD 2014 (2) “LTM Others” includes indemnities and redundancy costs mainly related to headcount restructuring in our Spanish construction business (3) Net Corporate Leverage calculated as Net Corporate Debt / LTM Adjusted EBITDA (4) For comparability purposes, FY 2013 figures have been restated to include Car Parks, which is no longer classified as an Asset held for sale and is now consolidated by the equity method
LTM Others(2) 17 19
Isolux Corsán Group (in € MM, unless otherwise stated)

November 25th 2014 | 9
225
131
131
196
48
48
178
178
178
234
234
234
243
203
0
235
138
27
129
5
5
2. Business and Financial Highlights
i. EPC

November 25th 2014 | 10
225
131
131
196
48
48
178
178
178
234
234
234
243
203
0
235
138
27
129
5
5
1. Defined as New Orders / Revenue 2. From consolidated Cash Flow Statement which is a proxy to EPC & Other business segments.
EPC (in € MM, unless otherwise stated)
Q3 YTD 2013
Q3 YTD 2014
Change
Change Excl FX Rate
New Orders
Backlog
Own Backlog
2,390 2,223 (7%)
6,245 6,626 6%
20% 17% (3.0 p.p.)
Revenue 1,662 1,541 (7%)
Book to bill ratio(1) 1.4x 1.4x 0.0x
4%
EBITDA 219 203 (7%)
EBITDA Margin 13.2% 13.2% 0.0 p.p.
Operating Cash Flow(2) (18) (49) 172%
Cash Flow from Investments(2) (62) (24) (61%)
Strong growth in our backlog during the first nine months of 2014 (6% increase compared to the same period in 2013). Investments decreased by 61% in line with expectations.
Results Presentation Q3 2014 | Business and Financial Highlights

November 25th 2014 | 11
225
131
131
196
48
48
178
178
178
234
234
234
243
203
0
235
138
27
129
5
5
Q3 YTD2013
Q3 YTD2014
Q3 YTD2013
Q3 YTD2014
Q3 YTD2013
Q3 YTD2014
Q3 YTD2013
Q3 YTD2014
Results Presentation Q3 2014 | Business and Financial Highlights
EPC - Key Financial Highlights
Key Figures EPC Segment (in € MM) Main developments
Strong backlog providing visibility for the next 2.8 years.
Revenues are mainly impacted by FX movements.
EBITDA evolution primarily driven by revenues, as margins remained stable.
Main contracts awarded in 2014: Hydropower plant in Bolivia (€315m) Third combined cycle power plant in
Bangladesh (€213m) Substation in Saudi Arabia (€110m) Pellet Plant in USA (€100m)
Robust new orders and backlog (€ 700 million of new orders awarded after September, hence, not included in these figures). Revenues trend impacted by FX.
EPC Segment New Orders
y-o-y Backlog
y-o-y Revenue
y-o-y EBITDA
y-o-y
Growth (7%) 6% (7%) (7%)
New Orders Backlog Revenue EBITDA
2,390 2,223
6,245 6,626 1,662
1,541
219 203

November 25th 2014 | 12
225
131
131
196
48
48
178
178
178
234
234
234
243
203
0
235
138
27
129
5
5
Spain 27%
Latam 43%
Asia 13%
Middle East and Africa
5%
North America
8%
Rest of Europe
4%
Spain 19%
Latam 53%
Asia 18%
Middle East and Africa
5%
North America
2% Rest of Europe
3%
Results Presentation Q3 2014 | Business and Financial Highlights
EPC Revenue by activity
Q3 YTD 2014
Q3 YTD 2013
EPC Revenue by Geographic Area
Q3 YTD 2014
Q3 YTD 2013
81% International
€1,541 MM
€1,662 MM
73% International
8% increase in weight of
international Revenue
Energy 34%
T&D 26%
Infrastructure 40%
Energy 37%
T&D 29% Infrastructure
33%
EPC revenues well balanced and
diversified by business line

November 25th 2014 | 13
225
131
131
196
48
48
178
178
178
234
234
234
243
203
0
235
138
27
129
5
5
>250M 12%
100M-250M 40% 50M-
100M 11%
10M-50M 32%
<10M 5%
Middle East and
Africa 13%
Asia 15%
LATAM 48%
Rest of Europe
3%
Spain 16%
North America
5% >250M 14%
100M-250M 30% 50M-
100M 20%
10M-50M 26%
<10M 10%
Middle East and
Africa 12%
Asia 17%
LATAM 47%
Rest of Europe
2%
Spain 21%
North America
1%
Energy 20%
T&D 24%
Infrastructure 56%
Q3 2014
Results Presentation Q3 2014 | Business and Financial Highlights
EPC Backlog by Segment EPC Backlog by Geographic Area
Q3 2013
Q3 2014
Q3 2013
EPC Backlog Concentration
Q3 2014
Q3 2013
84% International
79% International
EPC Own Backlog
Q3 2014
Q3 2013
€6.6 Bn
€6.2 Bn
3rd Parties
80%
Concessions Division
20%
Energy 21%
T&D 22%
Infrastructure 57%
3rd Parties
83%
Concessions Division
17%

November 25th 2014 | 14
225
131
131
196
48
48
178
178
178
234
234
234
243
203
0
235
138
27
129
5
5
2. Business and Financial Highlights
ii. Concessions

November 25th 2014 | 15
225
131
131
196
48
48
178
178
178
234
234
234
243
203
0
235
138
27
129
5
5
381
447
Q3 YTD 2013 Q3 YTD 2014
Results Presentation Q3 2014 | Business and Financial Highlights
Concessions - Key Financial Highlights
Key Figures Concessions (in € MM) Main developments
Strong Revenue and EBITDA growth mainly driven by :
Start of operations of transmissions lines in Brazil and US .
Tariff revision of our Brazilian transmission lines granted in June 2014.
Isolux Infrastructure secured the financing of US toll road I-69, by completing the issuance of PABs for $252 million, with interest rate below 5%. The bonds mature between 2034 and 2046.
Isolux Infrastructure accounted for by the equity method from January 2014 (vs. proportional in 2013)
(1) Construction Revenue not included
Revenue Jan-Sep 2014 (1) Revenue Jan-Sep 2013 (1)
Revenue EBITDA
214
267
Q3 YTD 2013 Q3 YTD 2014
30%
39%
28%
3% Transmission lines
Toll roads
Solar
Car parks
+17% +25%
48%
31%
18%
3%
November 25th 2014 | 16
225
131
131
196
48
48
178
178
178
234
234
234
243
203
0
235
138
27
129
5
5
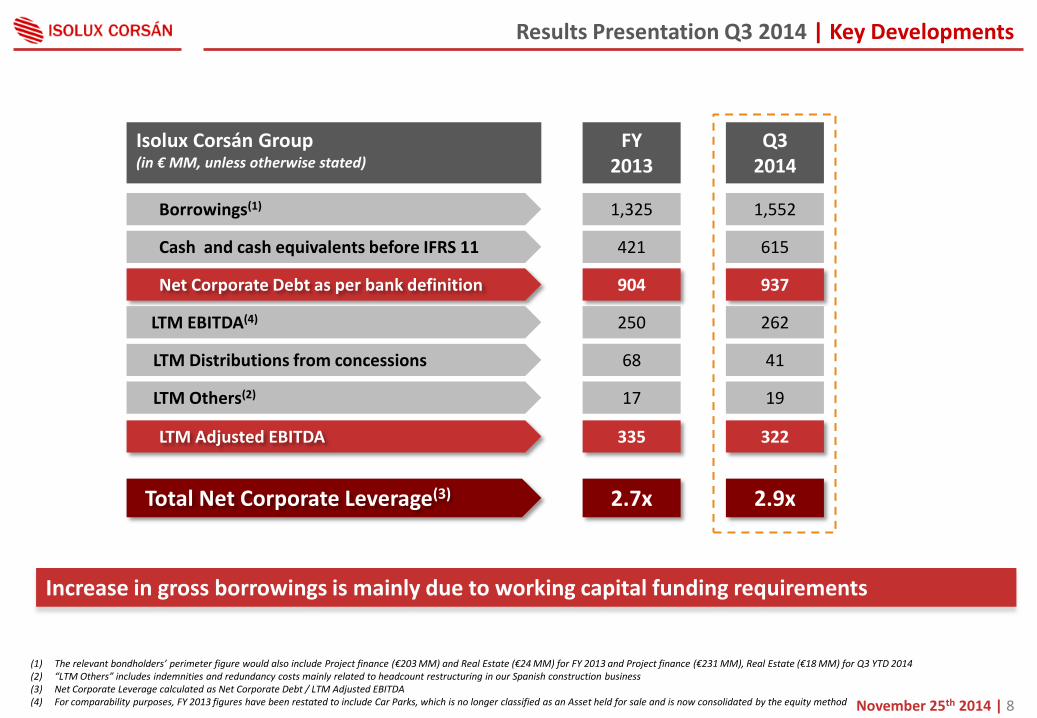
Concessions Key financial metrics (in € MM, unless otherwise stated) Q3 YTD 2013 Q3 YTD 2014 Change
Transmission lines 87 173 98%
Isolux Infrastructure 283 354 25%
Toll roads 114 114 0%
Solar photovoltaic 82 67 (18%)
Revenues
Total Concessions 381 447 17%
Q3 YTD 2013 Q3 YTD 2014 Change
71 140 96%
207 266 29%
70 71 1%
66 55 (16%)
EBITDA
214 267 25%
Q3 YTD 2013
82%
73%
62%
81%
EBITDA Margin
56%
Q3 YTD 2014
81%
75%
62%
82%
60%
Car Parks 9 10 12% 2 3 47% 24% 32%
Toll roads
90%
10%
Total kilometres: 1,644
78%
22%
95%
5%
Total MW: 326 Total spaces: 23,789
In operation Under construction
Other( inc. Construction revenue) 89 82 (8%) 4 (2) (137%) 5% (2%)
Solar PV Car Parks Transmission lines
61%
39%
Total kilometres: 5,959
Results Presentation Q3 2014 | Business and Financial Highlights

November 25th 2014 | 17
225
131
131
196
48
48
178
178
178
234
234
234
243
203
0
235
138
27
129
5
5
Location Asset Stake (1)
(%) Years to Maturity
Demand Risk
Revenue Mechanism(2)
Investment Grade Country
LXTE 100% Availability Payment
LMTE 100% Availability Payment
CPTE 100% Availability Payment
IENNE 50% Availability Payment
JTE 33% Availability Payment
LTTE 100% Availability Payment
LITE 100% Availability Payment
UPTE 95% Availability Payment
WETT 50% Unlimited Availability Payment
BR116 76% Real Toll
NH1 61% Real Toll
NH2 (4) 50% Real Toll
NH6 (4) 50% Real Toll
NH8 (4) 50% Real Toll
CAMS 100% Real Toll
COPEXA 50% Real Toll
Ocaña A4 51% Shadow Toll
I 69 Section 5 51% Availability Payment
T-Solar 88% Unlimited PPA(3)/ Feed in Tariff
24
24
18
24
23
27
29
34
20
10
26
14
13
40
39
12
37
Results Presentation Q3 2014 | Business and Financial Highlights
Concessions – Isolux Infrastructure’s Assets
Toll
-Ro
ads
Tran
smis
sio
n L
ine
s
(1) Stake held by Isolux Infrastructure
(2) Revenues indexed to inflation.
(3) PPA stands for Power Purchase agreement.
(4) 50% stake owned in partnership with Morgan Stanley Infrastructure Partners. So
lar
(Brazil)
(India)
(Mexico)
(Spain)
(USA)
(Brazil)
(India)
(USA)
2013
2004
2013
2013
2007
2009
2012
2013
2010
2009
2010
Operational & under construction
Under construction
Start of operations

November 25th 2014 | 18
225
131
131
196
48
48
178
178
178
234
234
234
243
203
0
235
138
27
129
5
5
2. Business and Financial Highlights
iii. Other

November 25th 2014 | 19
225
131
131
196
48
48
178
178
178
234
234
234
243
203
0
235
138
27
129
5
5
Results Presentation Q3 2014 | Business and Financial Highlights
Others - Key Financial Highlights
Key Figures Others (in € MM) Main developments
Others mainly includes overhead expenses and non-core assets
Corporate costs are declining during the current financial year following the restructuring measures implemented in 2013
Infinita: Castellón plant started production in April, following the agreement with Musim Mas. The plant is producing at normal levels (c. 85% of capacity).
Q3 YTD 2014 EBITDA includes the €12 million impact of a wind farm that started operations in the first half of the year. This asset is classified as “held for sale” in our balance sheet
Others EBITDA
y-o-y
Growth 57%
(42)
(18)
Q3 YTD 2013 Q3 YTD 2014
EBITDA
November 25th 2014 | 20
225
131
131
196
48
48
178
178
178
234
234
234
243
203
0
235
138
27
129
5
5
3. Cash flow and debt overview

November 25th 2014 | 21
225
131
131
196
48
48
178
178
178
234
234
234
243
203
0
235
138
27
129
5
5
204
250
Cash and cash equivalentsSep 2013
Cash and cash equivalentsDec 2013
Operating cash flow Jan-Sep2014
Cash flows from investingactivities Jan - Sep 2014
Cash flow from financingactivities Jan-Sep 2014
Cash and cash equivalentsSep 2014
Consolidated Cash Flow Bridge September 2013 to September 2014 (in € MM)
Cash Flow Bridge
Results Presentation Q3 2014 | Business and Financial Highlights
z
Cash activity is in line with the business plan for the period
77
252
(49)
(24)
Exchange differences
(6)

November 25th 2014 | 22
225
131
131
196
48
48
178
178
178
234
234
234
243
203
0
235
138
27
129
5
5
Corporate debt maturities: breakdown by type of debt (Total €1,552 MM)
Debt Maturities
The outstanding debt to be repaid in 2014 is composed by other term loans and advanced credit debts (factoring).
We have extended the maturity of the majority of our Spanish credit facilities to an average term of 2 years (now maturing between H2 2015 and 2016). The credit lines maturing in 2014 mainly correspond to international subsidiaries (Brazil, Mexico, etc.) and are expected to be renewed without issues, as it has been the case in prior years.
Results Presentation Q3 2014 | Business and Financial Highlights
(1) Senior Notes in accordance with IFRS, at amortized cost
Rest of 2014 2015 2016 2017 2018 2019 2020 and onwards
25
143
51
206
30 27 40 48
30 39
49
34
Rest of 2014 2015 2016 2017 2018 2019 2020 and onwards
Term loans Advanced credit debts Senior notes Credit lines Finance lease liabilities
142
193
86
868
829(1)

November 25th 2014 | 23
225
131
131
196
48
48
178
178
178
234
234
234
243
203
0
235
138
27
129
5
5
4. Appendix

November 25th 2014 | 24
225
131
131
196
48
48
178
178
178
234
234
234
243
203
0
235
138
27
129
5
5
Results Presentation Q3 2014 | Appendix
Detailed Financial Statements - Consolidated Balance Sheet by segment
Consolidated Balance Sheet (in million €)
Property, plant and equipment 94 - 33 127 - 127 83 - 30 113 - 113
Investments in associates and joint ventures - - - - 828 828 - - - - 981 981
Other non-current assets 619 - 294 5,059 -4,048 1,010 611 - 364 5,870 -4,844 1,025
Total non current assets 714 4,145 326 5,185 -3,220 1,965 694 4,895 394 5,983 -3,863 2,120
Inventories 107 0 100 207 0 207 160 8 100 268 -8 260
Accounts receivable 2,585 330 -996 1,919 -261 1,657 2,675 406 -781 2,299 -396 1,903
Derivative financial instruments 3 0 - 3 0 3 1 - - 1 - 1
Financial assets 6 1 2 8 -1 8 11 0 5 16 0 16
Cash and cas equivalents 232 179 10 421 -179 241 181 372 62 615 -368 247
Non-current assets held for sale - 258 400 657 - 657 - - 384 384 - 384
Total current assets 2,932 768 -485 3,215 -441 2,774 3,029 785 -230 3,584 -772 2,811
Total assets 3,645 4,913 -159 8,400 -3,662 4,738 3,723 5,681 163 9,567 -4,636 4,931
Borrowings 197 9 1,119 1,325 - 1,325 174 8 1,370 1,552 - 1,552
Project finance 29 2,628 174 2,830 -2,628 203 32 3,260 173 3,464 -3,226 238
Liabilities held for sale - 160 200 361 - 361 - - 170 170 - 170
Accounts payable 2,327 369 -281 2,415 -224 2,191 2,445 397 -200 2,642 -340 2,302
Other liabilities 208 782 -76 913 -678 235 159 951 89 1,199 -939 260
Total liabilities 2,761 3,948 1,136 7,845 -3,530 4,315 2,810 4,616 1,602 9,028 -4,505 4,523
September 30, 2014
EPC ConcessionsOther and
corporateSub-Total
Change in
consolidation
method
Total
Consolidated
December 31, 2013
Sub-Total
Change in
consolidation
method
Total
ConsolidatedEPC Concessions
Other and
corporate

November 25th 2014 | 25
225
131
131
196
48
48
178
178
178
234
234
234
243
203
0
235
138
27
129
5
5
Results Presentation Q3 2014 | Appendix
Detailed Financial Statements - Consolidated Income Statement by segment
Consolidated Income Statement (in million €)
Revenues/Sales 1,662 381 1 2,044 (253) 1,791 1,541 447 21 2,009 (460) 1,549
Other 152 - - 161 (129) 31 12 - - 13 - 4
Total operating income 1,814 390 0 2,204 (382) 1,822 1,553 447 21 2,021 (468) 1,553
Other operating expenses (1,595) (176) (42) (1,814) 167 (1,647) (1,350) (179) (40) (1,569) 202 (1,367)
EBITDA 219 214 (42) 391 (215) 175 203 267 (18) 452 (266) 186
Depreciation, amortization and impairment losses (13) (59) (16) (88) 59 (29) (15) (64) (21) (100) 65 (35)
Change in trade provisions (3) (16) 0 (19) - (19) (10) 0 (25) (35) - (35)
Operating results 203 139 (58) 284 (156) 128 178 203 (64) 317 (201) 116
Net financial results (10) (190) (64) (264) 144 (119) (17) (189) (120) (326) 169 (158)
Equity method - - - - (5) (5) - - - - 22 22
Profit before income tax 193 (51) (122) 20 (16) 4 161 14 (184) (9) (10) (20)
Income tax - - (5) (5) 5 1 - - (3) (3) 11 8
Results for the period from continuing operations 193 (51) (126) 15 (11) 4 161 14 (187) (12) 1 (11)
Results for the period from discontinuing operations - - (10) (10) - (10) - - (8) (8) - (8)
Results for the period 193 (51) (136) 6 (11) (5) 161 14 (195) (20) 1 (20)
Attributable to: 0 0 0 0 0 0
Owners of the parent - - - 5 - 5 - - - (17) - (17)
Non-controlling interests - - - 1 (11) (10) - - - (3) 1 (3)
Jan-Sep 2014
EPC ConcessionsOther and
corporateSub-Total
Change in
consolidation
method
Total
Consolidated
Change in
consolidation
method
Total
Consolidated
Jan-Sep 2013
EPC ConcessionsOther and
corporateSub-Total

November 25th 2014 | 26
225
131
131
196
48
48
178
178
178
234
234
234
243
203
0
235
138
27
129
5
5
Results Presentation Q3 2014 | Appendix
Detailed Financial Statements – Consolidated Cash Flow Statement
Consolidated Cash Flow (in million €) Jan-Sep 2013 Jan-Sep 2014
Profit/(loss) for the period before taxes (7) (29)
Adjustments for non-cash items 180 209
Changes in working capital (173) (221)
Taxes paid (19) (7)
Net cash generated from /(used in) operating activities (18) (49)
Acquisition of concessionary assets and non-current assets assigned (39) (0)Other Capex, net (25) (27)
Interest received and other financial income 2 4
Net cash used in investing activities (62) (24)
Income/(Reimbursement) of Corporate debt, net 46 (653)
Income/(Reimbursement) of Project finance, net 12 22
Proceeds from issuance of Senior Notes - 840
Interest paid (92) (132)
Net cash flows generated from /(used in) financing activities (34) 78

November 25th 2014 | 27
225
131
131
196
48
48
178
178
178
234
234
234
243
203
0
235
138
27
129
5
5
Thank you
© Isolux Corsán 2014
Isolux Corsán Investor Relations [email protected]