Embed Size (px)
Citation preview

Page
Progressing as planned: on track for 10%+ ROTE in 2017; stable outlook for 2018 Andreas Treichl, CEO Erste Group Gernot Mittendorfer, CFO Erste Group Willibald Cernko, CRO Erste Group
3 November 2017
Erste Group investor presentation Q3 17 results
Page
Disclaimer – Cautionary note regarding forward-looking statements
2
• THE INFORMATION CONTAINED IN THIS DOCUMENT HAS NOT BEEN INDEPENDENTLY VERIFIED AND NO REPRESENTATION OR WARRANTY EXPRESSED OR IMPLIED IS MADE AS TO, AND NO RELIANCE SHOULD BE PLACED ON, THE FAIRNESS, ACCURACY, COMPLETENESS OR CORRECTNESS OF THIS INFORMATION OR OPINIONS CONTAINED HEREIN.
• CERTAIN STATEMENTS CONTAINED IN THIS DOCUMENT MAY BE STATEMENTS OF FUTURE EXPECTATIONS AND OTHER FORWARD-LOOKING STATEMENTS THAT ARE BASED ON MANAGEMENT’S CURRENT VIEWS AND ASSUMPTIONS AND INVOLVE KNOWN AND UNKNOWN RISKS AND UNCERTAINTIES THAT COULD CAUSE ACTUAL RESULTS, PERFORMANCE OR EVENTS TO DIFFER MATERIALLY FROM THOSE EXPRESSED OR IMPLIED IN SUCH STATEMENTS.
• NONE OF ERSTE GROUP OR ANY OF ITS AFFILIATES, ADVISORS OR REPRESENTATIVES SHALL HAVE ANY LIABILITY WHATSOEVER (IN NEGLIGENCE OR OTHERWISE) FOR ANY LOSS HOWSOEVER ARISING FROM ANY USE OF THIS DOCUMENT OR ITS CONTENT OR OTHERWISE ARISING IN CONNECTION WITH THIS DOCUMENT.
• THIS DOCUMENT DOES NOT CONSTITUTE AN OFFER OR INVITATION TO PURCHASE OR SUBSCRIBE FOR ANY SHARES AND NEITHER IT NOR ANY PART OF IT SHALL FORM THE BASIS OF OR BE RELIED UPON IN CONNECTION WITH ANY CONTRACT OR COMMITMENT WHATSOEVER.

Page
Presentation topics
3
• Executive summary • Business environment • Business performance • Assets and liabilities • Outlook • Additional information
Page
Executive summary – Group income statement performance
QoQ net profit reconciliation (EUR m)
YoY net profit reconciliation (EUR m)
4
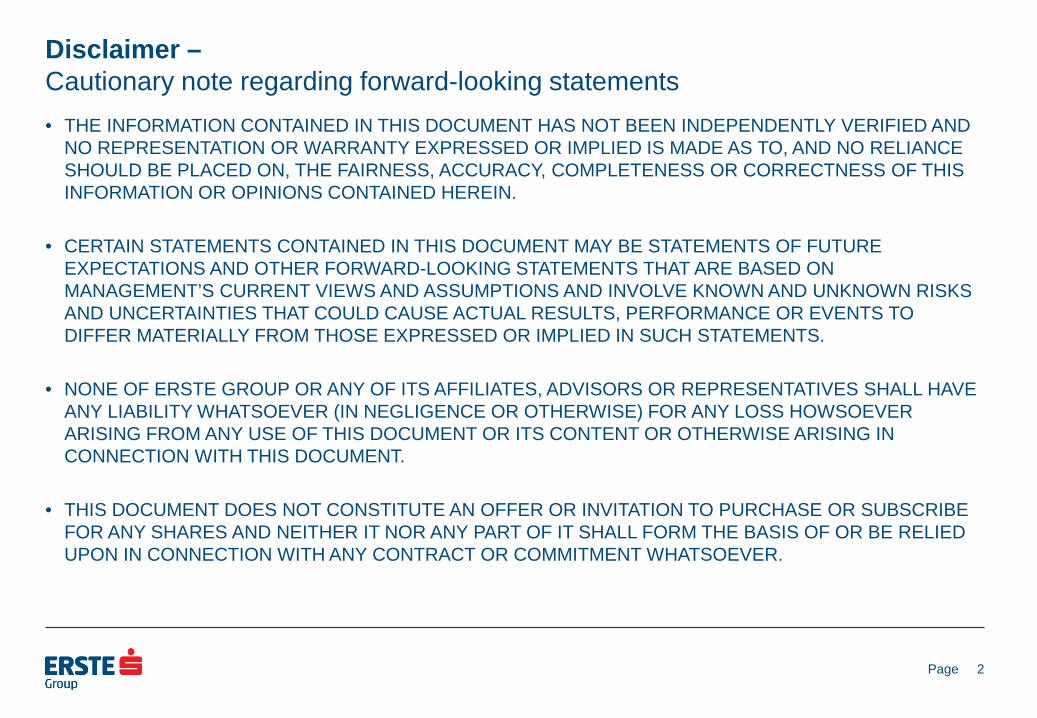
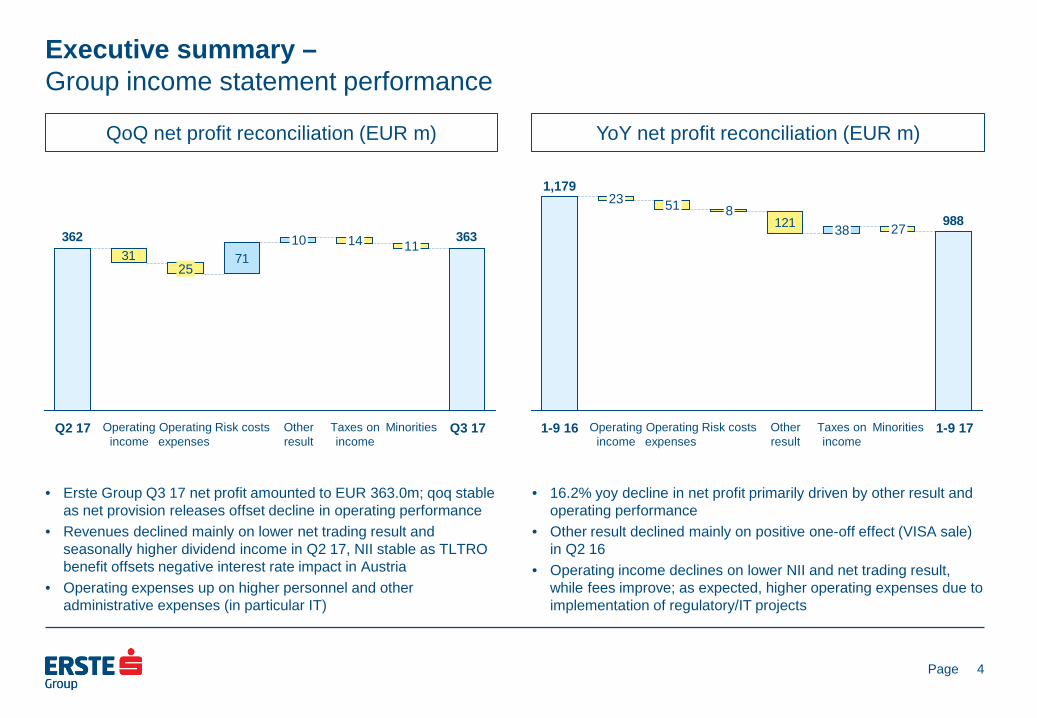
• Erste Group Q3 17 net profit amounted to EUR 363.0m; qoq stable as net provision releases offset decline in operating performance
• Revenues declined mainly on lower net trading result and seasonally higher dividend income in Q2 17, NII stable as TLTRO benefit offsets negative interest rate impact in Austria
• Operating expenses up on higher personnel and other administrative expenses (in particular IT)
• 16.2% yoy decline in net profit primarily driven by other result and operating performance
• Other result declined mainly on positive one-off effect (VISA sale) in Q2 16
• Operating income declines on lower NII and net trading result, while fees improve; as expected, higher operating expenses due to implementation of regulatory/IT projects
31 71
363362
Q3 17 Minorities
11
Taxes on income
14
Other result
10
Risk costs Operating expenses
25
Operating income
Q2 17
988121
Other result
Risk costs
8
Operating expenses
51
Operating income
1-9 17
27
Minorities
38
Taxes on income
23
1-9 16
1,179

Page
Executive summary – Key income statement data
Net interest income & margin
5
Operating result & cost/income ratio Cost of risk
Banking levies
Reported EPS & ROE
Return on tangible equity
-3.7%
1-9 17
1,923
1-9 16
1,997
-33
39
Q3 17
-0.09%
Q2 17
0.11% 63
71
+13.1%
1-9 17 1-9 16 Q3 17
634
61.4%
Q2 17
690
58.8%
Q3 17
1,086
2.39%
Q2 17
1,092
2.44%
2324
Q3 17 Q2 17
82
1-9 17 1-9 16
152
1-9 17
2.26
10.5%
1-9 16
2.73
13.5%
Q3 17
0.85
11.7%
Q2 17
0.80
11.1%
1-9 17
3,229
2.39%
1-9 16
3,267
2.50% in EUR m
in EUR m
in EUR m in EUR m
in EUR
1-9 17
11.9%
1-9 16
15.5%
Q3 17
13.2%
Q2 17
12.6%

Page
Executive summary – Group balance sheet performance
YTD total asset reconciliation (EUR m)
YTD equity & total liability reconciliation (EUR m)
6
• Balance sheet total rose by 6.5% by Sept 17, driven by a 5.6% ytd increase in net customer loans and a temporary increase in loans to banks, mainly in CZ
• Net customer loan growth supported by strong underlying loan demand in CZ and SK; increased money market business, primarily in CZ; and solid contributions from Austria
• Decline in financial assets driven by AfS sales
• Deposit growth further accelerated to 7.5% by Sept 17, the loan/deposit ratio stood at 93.0%; main drivers: customer deposit inflows across all geographies and increased money market business
• Bank deposits increased by 31.4% by Sept 17 on temporarily expanded interbank business, primarily in CZ
30/09/17
221,715
Other assets
541
Intangibles
84
Net loans
7,351
Loans to banks
6,889
Trading, financial assets
4,047
Cash
3,751
31/12/16
208,227
30/09/17
221,715
Equity
1,367
Other liabilities
83
Debt securities
1,531
Customer deposits
10,351
Bank deposits
4,594
Trading liabilities
1,211
31/12/16
208,227
Page
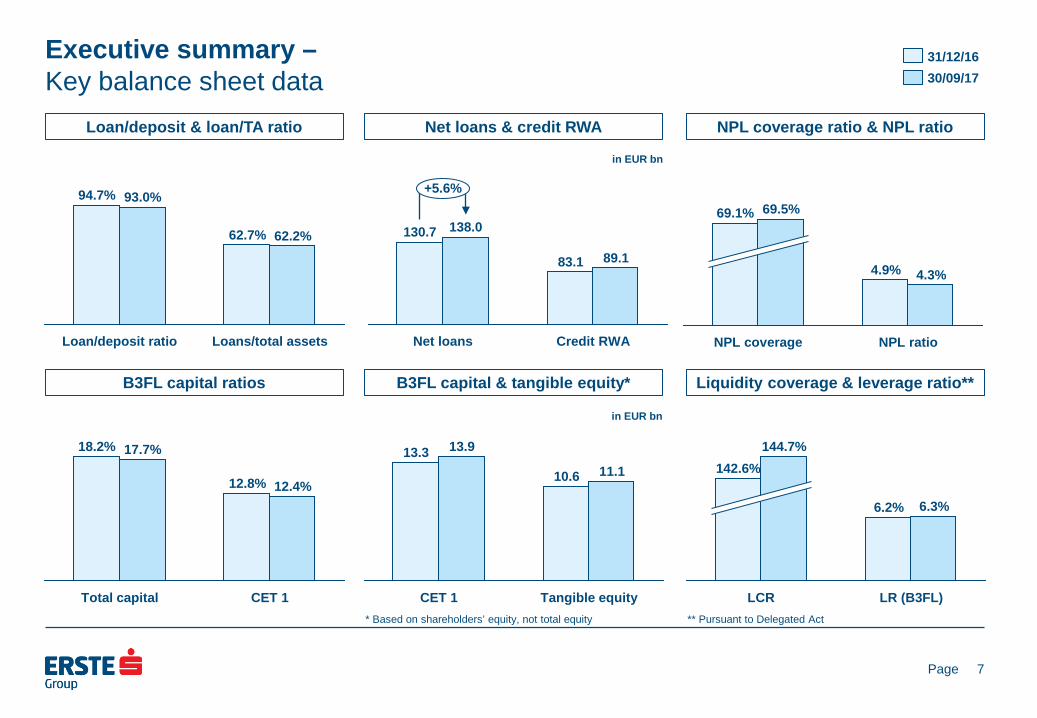
Executive summary – Key balance sheet data
Loan/deposit & loan/TA ratio
7
Net loans & credit RWA NPL coverage ratio & NPL ratio
B3FL capital ratios
B3FL capital & tangible equity*
Liquidity coverage & leverage ratio**
+5.6%
Credit RWA
89.1 83.1
Net loans
138.0 130.7
30/09/17 31/12/16
NPL ratio
4.3% 4.9%
NPL coverage
69.5% 69.1%
Loans/total assets
62.2% 62.7%
Loan/deposit ratio
93.0% 94.7%
Tangible equity
11.1 10.6
CET 1
13.9 13.3
CET 1
12.4% 12.8%
Total capital
17.7% 18.2%
* Based on shareholders’ equity, not total equity
142.6%
LR (B3FL)
6.3% 6.2%
LCR
144.7%
in EUR bn
in EUR bn
** Pursuant to Delegated Act

Page
Presentation topics
8
• Executive summary • Business environment • Business performance • Assets and liabilities • Outlook • Additional information

Page
Business environment – Strong economic outlook for 2017 and 2018
Real GDP growth (in %)
9
Dom. demand contribution* (in %) Net export contribution* (in %)
Unemployment rate (eop, in %)
Current account balance (% of GDP)
Gen gov balance (% of GDP)
Consumer price inflation (ave, in %)
Public debt (% of GDP)
• Erste Group’s core CEE markets expected to grow by about 3-6% in 2017 • Domestic demand is expected to be main driver of economic growth in 2017 • Consumption is supported by improving labour markets, wage increases and relatively low inflation rates across the region
• Solid public finances across Erste Group‘s core CEE markets: almost all countries fulfill Maastricht criteria • Sustainable current account balances, supported by competitive economies with decreasing unemployment rates
HR
2.9 3.4
HU
4.0 4.0
RO
4.5
6.1
SK
2.6 2.7
CZ
3.6 3.1
AT
1.2 1.4
2018 2017
HR
2.8 3.0
HU
3.4 3.7
RO
4.1
6.1
SK
3.9 3.3
CZ
3.4 4.1
AT
2.2 2.6
HR
1.2 1.1
HU
3.4
2.4
RO
3.5
1.3
SK
2.0 1.2
CZ
2.2 2.5
AT
1.9 2.1
HR
10.0 10.9
HU
4.0 4.2
RO
5.5 5.4
SK
7.5 8.2
CZ
3.1 3.1
AT
5.5 5.6
HR
2.9 4.2
HU
3.8 4.1
RO
-3.7 -3.1
SK
1.1 0.4
CZ
0.7 0.9
AT
2.9 2.7
-2.7
RO
-3.4 -3.0
SK
-0.8 -1.5
CZ
0.1 0.4
AT
-0.8 -1.0
HR
-0.6 -0.8
HU
-2.5
8172
3752
35
81 7871
3750
33
79
HR HU RO SK CZ AT
* Contribution to real GDP growth. Domestic demand contribution includes inventory change. Source: Erste Group Research
SK
1.0
RO
-0.6 -0.3
HR AT
0.4
CZ
0.6 1.3
HU
0.2
-0.4 -0.4
-0.2 -0.6
-0.1

Page
Business environment – CZ further increases key policy rate to 50bps in November 2017
Austria
10
Czech Republic Romania
Slovakia
Hungary
Croatia
• ECB cut discount rate to zero in March 16 • Maintains expansionary monetary policy
stance
• National bank decided to lift its benchmark rate from historic low of 0.05% to 0.50% in August and November 2017
• Central bank cut policy rate to historic low of 1.75% in May 2015
• As part of euro zone ECB rates are applicable in SK
• National bank cut the benchmark interest rate to record low of 0.9% in May 2016
• Central bank maintains discount rate at 3.0% since 2015
0.59%
-0.33%
0.35%
-0.25%
1-9 16 1-9 17
10YR GOV 3M Interbank
0.82%
0.32%
0.40%
0.29%
1-9 16 1-9 17
3.77%
0.67%
3.32%
0.58%
1-9 17 1-9 16
0.47%
-0.25%
0.97%
-0.33%
1-9 16 1-9 17
3.18%
0.18%
3.12%
1.11%
1-9 16 1-9 17
0.37% 0.60%
1-9 17 1-9 16
Q3 17
0.63%
-0.33%
Q2 17
0.56%
-0.33%
Q3 17
1.04%
0.40%
Q2 17
0.85%
0.29% Q3 17
3.90%
0.73%
Q2 17
3.75%
0.66%
Q3 17
0.87%
-0.33%
Q2 17
0.98%
-0.33%
Q3 17
2.97%
0.13%
Q2 17
3.11%
0.16%
Q3 17
0.36%
Q2 17
0.35%
Source: Bloomberg

Page
Business environment – CZK enters path of appreciation following depegging in April 2017
EUR/CZK
11
EUR/RON
EUR/HUF
EUR/HRK
• Czech National Bank ended its currency peg in April 17; discount rate increased further to 0.50% in November 2017
• RON movements continued to be marked by limited volatility; policy rate cut to 1.75% in Q2 15
• Stable currency development, despite expansionary monetary stance of the national bank
• Croatian National Bank continues to manage HRK in tight range
-1.8%
1-9 17
26.6
1-9 16
27.0
-1.7%
Q3 17
26.1
Q2 17
26.5
-3.8%
30/09/17
26.0
31/12/16
27.0
+1.5%
1-9 17
4.55
1-9 16
4.49
+0.6%
Q3 17
4.58
Q2 17
4.55 4.60
31/12/16
4.54
+1.3%
30/09/17
-1.2%
1-9 17
308.5
1-9 16
312.1
-1.1%
Q3 17
306.4
Q2 17
309.9
+0.7%
30/09/17
311.6
31/12/16
309.4
-1.3%
1-9 17
7.44
1-9 16
7.54
0.0%
Q3 17
7.43
Q2 17
7.43
31/12/16
7.56
-0.9%
30/09/17
7.49
Source: Bloomberg

Page
Business environment – Market shares: mostly stable or increasing shares across the region
Gross retail loans
12
• CZ and SK: slightly increasing market shares in growing markets
• RO: slightly lower market share mainly due to more restrictive lending standards
• HU: high level of repayments offsets new disbursements
Gross corporate loans
• RO: conservative lending standards impact market share
• HR: market share increase mainly due to substantial sale of NPLs by other market participants
Retail deposits
• Continued inflows in all markets despite low interest rate environment, with broadly stable market shares
• HU: yoy increase driven mainly by consolidation of Citibank since Q1 2017
Corporate deposits
• Changes mainly due to normal quarterly volatility in corporate business
RS 5.1% 4.5% 4.4%
HR 13.3% 13.2% 13.5%
HU 12.0% 12.3% 13.2%
RO 16.1% 16.3% 16.9%
SK 27.7% 27.6% 27.3%
CZ 23.1% 22.9% 22.9%
AT 20.0% 19.6%
30/09/17 30/06/17 30/09/16
RS 4.8% 5.3% 4.8%
HR 15.6%
14.8% 13.9%
HU 5.7% 5.6% 5.7%
RO 12.4% 12.7%
14.1%
SK 11.7% 11.5% 11.0%
CZ 20.2%
19.7% 19.4%
AT 20.1% 19.4%
RS 3.7% 3.5% 3.3%
HR 13.8% 13.6% 13.6%
HU 9.2% 8.9%
6.3%
RO 15.9% 16.0% 16.2%
SK 27.6% 27.4% 26.9%
CZ 25.2% 25.2% 25.2%
AT 19.1% 18.8%
5.3% 5.4%
RS 4.3%
6.2%
HR 13.7% 13.8%
11.3%
HU 6.5% 6.1%
SK
RO 13.8% 14.2% 14.7%
12.7% 11.2% 11.8%
CZ 12.7%
12.2% 12.2%
AT 20.6% 19.6%
AT market shares for 30/09/2017 not yet available

Page
Presentation topics
13
• Executive summary • Business environment • Business performance • Assets and liabilities • Outlook • Additional information

Page
Business performance: performing loan stock & growth – Performing loans continue to grow in Q3 17
• Rising performing loan volume trend continues in Q3 17 across most geographies; underlying loan growth particularly strong in CZ (supported by currency appreciation) and SK
• Yoy growth evenly attributable to Retail and Corporates (mainly SMEs and Group Large Corporates), with contributions also from Savings Banks
• Qoq growth predominantly in Retail (dynamic development in CZ and SK), solid contributions from Corporates (Group Large Corporates and Commercial Real Estate)
• Year-on-year segment trends:
• CZ: Rising volumes in Corporates segment (particularly strong in SMEs, robust in Group Large Corporates), solid growth in Retail continues
• SK: rising loan stock driven by Retail segment • HU: increase driven primarily by Retail due to Citi integration • RS: continued strong growth in Retail and Corporates segments
• Quarter-on-quarter segment trends: • CZ: growth driven by both Retail and Corporates (predominantly
SMEs) • SK: development similar to yoy trend (Retail stronger than
Corporates)
14
Other 0.2 0.2 0.1
RS 0.8 0.7
HR 5.6
0.9
5.5 5.4
HU 3.3 3.3 3.0
SK 11.2 10.8 9.7
RO 7.1 7.0 7.0
CZ 25.1 23.9
21.0
AT/OA 12.2 12.0 11.3
AT/SB 39.8 39.3 38.2
AT/EBOe 30.7 30.2 30.2
Group 136.1
133.1 126.6
4.9% 17.4%
0.5% 2.6%
0.0% 7.4%
3.9% 16.4%
1.3% 1.2%
5.1% 19.8%
1.9% 8.0%
1.3% 4.3%
1.6% 1.8%
2.3% 7.5%
QoQ YoY
30/09/17 30/06/17 30/09/16
in EUR bn Not meaningful

Page
Business performance: customer deposit stock & growth – Deposits still marching ahead in Q3 17
• Exceptional deposit growth across all geographies yoy despite zero interest rate environment as retail and corporate clients parked cash in overnight accounts
• Yoy growth in absolute terms mainly driven by Retail segment (+EUR 5.1bn) and Corporate segment (+EUR 3.6bn), with strong contribution from Savings Banks (+EUR 2.8bn)
• Qoq increase across most geographies
• Year-on-year segment trends: • CZ: growth attributable to Corporates (mainly in Public Sector)
and Retail segment, strong contribution from Group Markets • AT/OA: higher sight and term deposits in the Holding (Group
Markets and Group Large Corporates) • AT/EBOe and AT/SB: increase mainly in Retail, supported by
inflows in Corporates • HU: increase driven primarily in Retail due to Citi integration,
supported by inflows in Corporates (mainly in SMEs and Group Large Corporates) and Group Markets business
• RS: strong inflows in Retail segment, supported by growth in Corporate segment (in particular in SMEs)
• Quarter-on-quarter segment trends: • CZ: increase driven by strong inflows in Group Markets,
supported by robust growth in Retail and Corporates (in particular in Local Large Corporates and Public Sector)
• HR: growth mainly attributable to Corporate segment (driven by SMEs), with strong contribution from Retail
15
RS 0.8 0.7 0.6
HR 6.2 5.8 5.8
HU 5.1 4.9 4.1
SK 12.3 12.1 11.2
RO 10.4 10.4 10.0
CZ 33.9 32.4
28.6
AT/OA 4.7 4.2 3.6
AT/SB 41.5 41.2
Other
AT/EBOe 33.6 33.7
31.3
Group
38.7
145.6 134.0
0.0 0.2 0.2
148.4
7.8% 26.4%
7.8% 7.0%
3.9% 24.9%
1.4% 9.5%
-0.1% 3.4%
4.4% 18.4%
12.8% 31.2%
0.6% 7.3%
-0.3% 7.2%
1.9% 10.7%
QoQ YoY
in EUR bn
30/06/17 30/09/17
30/09/16
Not meaningful

Page
Business performance: NII and NIM – NII slowly stabilising, NIM still under pressure
• Yoy increase reflect higher structural contribution from
Holding ALM and higher NII in CZ resulting from increased volumes, currency appreciation and positive effect of the benchmark rate increase in Aug 17
• Qoq decline mainly attributable to higher TLTRO contribution in Q2 17 as well as passing on of negative interest rates to consumer borrowers in AT; partially offset by improvements in CZ and in the Holding
• Year-on-year segment trends: • HU: higher NII mainly attributable to Citi integration • Other: higher structural contribution from Holding ALM • SK: lower NII from government bonds and declining margins
• Quarter-on-quarter segment trends:
• AT/EBOe and AT/SB: decrease mainly driven by TLTRO impact in Q2 and passing on of negative interest rates to consumer borrowers
• CZ: increase in Retail driven by higher loan volumes; supported by CZK appreciation and rate increase in Aug 17
• RO: lower ALM contribution and declining NII in Commercial Real Estate and Public sector, partially offset by improved Retail business
16
52
13
89
22
12
66
42
98
25
67
93
92
30
13
66
49
92
RS
HR
HU
SK 109 107 113
RO 88
CZ 235 227 231
AT/OA
AT/SB 242 249
241
AT/EBOe 160 166 161
Group 1,086 1,092
1,073
Other
Q3 17 Q2 17 Q3 16
4.75% 4.92% 5.12%
3.33% 3.43% 3.54%
3.04% 3.28%
3.00% 2.96% 2.99% 3.31%
2.97% 3.16% 3.05%
2.53% 2.53%
2.89% 1.34% 1.25% 1.52% 1.81% 1.90% 1.89%
1.60% 1.75% 1.81%
2.39% 2.44% 2.43%
in EUR m Not meaningful

Page
Business performance: operating income – Operating income supported by fees, burdened by trading income
• Yoy flat as higher NII and fees offset lower net trading result • Qoq development burdened by lower net trading result and
seasonally higher dividend income in Q2
• Year-on-year segment trends: • HU: higher NII and fee income supported by Citi integration • AT/SB: increase in NII due to lower interest expense (TLTRO
effect), fees rise on improved securities business and payments • Other: decline mainly driven by net trading result (hedging
impacts)
• Quarter-on-quarter segment trends: • AT/EBOe: lower NII due to lower TLTRO effect, declining fee
income from securities business in Q3 17; and seasonally higher dividend income in Q2
• AT/SB: mainly driven by lower NII (passing on of negative interest rates to consumer borrowers and lower TLTRO effect), decline in trading income and seasonally higher dividend income in Q2
• AT/OA: decline in operating income mainly due to lower fees from bond origination and sales activities in Holding Group Markets and lower net trading result
• RO: lower NII from ALM contribution, Commercial Real Estate and Public sector as well as decline in net trading result
17
170177
143142
12
16
109
86
145
153
344
355
252
-5
17
102
100
159
337
379
268
-9
17
106
101
151
351
167
365
253
Other
RS
HR
HU
SK
RO
CZ
AT/OA
AT/SB
AT/EBOe
Group 1,644 1,675 1,643
Q3 17 Q2 17 Q3 16
in EUR m
2.7% 8.3%
3.8% -2.9%
1.2% 17.0%
-0.4% -1.8%
-5.2% -1.4%
4.2% 1.9%
-5.3% -1.9%
-3.6% 2.8%
-5.5% 0.4%
-1.9% 0.1%
QoQ YoY
Not meaningful

Page
Business performance: operating expenses – Operating costs driven by regulatory and IT project costs
• Yoy cost increase mainly driven by higher personnel expenses related to IT and regulatory projects
• Qoq mirrors yoy development
• Year-on-year segment trends: • AT/SB: higher IT costs across most savings banks • HU: higher personnel expenses and depreciation following
the Citi integration • RO: higher personnel and higher office space expenses
• Quarter-on-quarter segment trends: • AT/OA: higher project costs in the Holding in Q2 17 • AT/SB: improvements on lower personnel expenses and
lower IT costs, partially offset by higher deposit insurance contribution
• Other: higher IT expenses in service entities
18
156
86
70
50
160
51
10
89
49
87
10
46
78
165
234
48
53
67
78
166
100
251
82
11
54
70
82
169
243
160
Other
RS
HR
HU
SK
RO
CZ
AT/OA
AT/SB
AT/EBOe
Group 1,010
985 983
Q3 17 Q2 17 Q3 16
in EUR m 69.7% -5.9%
6.2% 12.7%
-7.1% -0.8%
7.3% 17.0%
3.7% -1.0%
4.9% 5.5%
2.1% 2.9%
-11.1% 2.7%
-3.0% 3.8%
-0.3% 2.7%
2.5% 2.8%
QoQ YoY

Page
Business performance: operating result and CIR – On group level still under pressure, CZ is positive highlight
Operating result
YoY & QoQ change
19
Cost/income ratio
6
59
40
74
84
6
49
49
76
77
6
56
47
73
78
AT/SB 122 128 121
AT/EBOe 93 108 96
Group 634
690 660
Other -92 -54 -76
RS
HR
HU
SK
RO 69 81 75
CZ 182 171 180
AT/OA
64.7% 62.6% 62.2%
46.7% 52.2%
45.7% 53.9% 50.8% 53.8%
49.0% 47.1% 48.6%
54.4% 49.2% 50.9%
48.3% 49.3% 47.8%
53.1% 56.5%
50.7% 66.5% 66.2% 65.9%
63.2% 59.9% 61.8% 61.4% 58.8% 59.8%
in EUR m Not meaningful
-3.1% 1.1%
15.7% -4.7%
-5.2% 17.0%
-4.1% -2.6%
-15.0% -8.5%
6.2% 1.0%
2.1% -6.7%
-4.6% 0.9%
-13.2% -3.3%
-8.1% -4.0%
QoQ YoY
Q3 17 Q2 17 Q3 16
Not meaningful

Page
Business performance: risk costs (abs/rel*) – Risk costs driven by across-the-board provision releases
• Yoy risk performance characterised by net releases across most geographies
• Qoq performance mirrors yoy development; improvement in HR after elevated risk provisions in Q2 17
• Year-on-year segment trends: • RO: net releases in Corporates (in particular Local Large
Corporates and Commercial Real Estate) in Q3 16 • AT/OA: Q3 16 driven by risk provisions in the Holding
(Commercial Real Estate and Group Large Corporates); recoveries of written off loans and net releases in Q3 17
• CZ: net releases in Corporates (mainly Local Large Corporates and SMEs) and Retail, supported by improved recoveries
• Quarter-on-quarter segment trends: • HR: sharp drop in risk costs after elevated risk provisions
in Corporates (Group Large Corporates) in Q2 17
20
13
14
-4
2
20
6
7
0
0
-1
1
10
-13 -10
1
SK 10 9
RO 0
13 -35
CZ -8
Other
AT/OA -17
AT/SB -2
-13
AT/EBOe -7 -2
Group -33
39 37
RS
HR 4
51 12
HU
-17
0.31% -0.05%
0.95% 0.24%
3.19% 0.78%
-1.46% -1.13%
0.08% 0.35% 0.36% 0.36%
-0.01% 0.65%
-1.76% -0.12% -0.28%
0.26% -0.53%
0.01% 0.43%
-0.02% -0.13%
0.20% -0.09% -0.03%
0.08% -0.09%
0.11% 0.11%
Q3 17 Q2 17 Q3 16
in EUR m * Relative risk costs are defined as annualised quarterly risk costs over average gross customer loans.
Not meaningful

Page
Business performance: non-performing loans and NPL ratio – NPL ratio improves again, now standing at 4.3%
• NPL volume declined to EUR 6.2bn in Q3 17 as NPL inflows decline across most geographies (except AT/SB, RO, HU)
• NPL sales of EUR 32.2m in Q3 17 (Q2 17: EUR 85.6m) • Retail: EUR 7.5m (Q2 17: EUR 34.2m) • Corporates: EUR 24.7m (Q2 17: EUR 51.4m) • Q3 17 NPL sales mainly on Holding level (EUR 18.5m), in HU
(EUR 6.1m), HR (EUR 4.2m) and minor sales in CZ, SK and RS
21
35
61
81
50
58
38RS
HR 826 845 793
HU 229 253 461
SK 467 469 527
RO 839 869 1,084
CZ 531 553 720
AT/OA 711 781 821
AT/SB 1,856
Other
2,009
AT/EBOe 635 688
1,908
Group 6,189
6,496 7,308
799
5.5% 6.1% 6.8%
4.5% 4.6% 5.0%
2.0% 2.2% 2.6% 4.3% 4.7% 5.5%
23.2% 30.2%
23.6% 4.2%
3.3%
7.7% 12.9% 13.2% 12.8%
6.5% 7.2%
13.2% 4.0% 4.2% 5.2%
10.5% 11.0%
13.3% 2.1% 2.3%
5.8%
30/09/17 30/06/17 30/09/16
in EUR m

Page
Business performance: allowances for loans and NPL coverage – NPL provision coverage further improves to 69.5%
• NPL provision coverage rose to 69.5%, as NPL stock declined faster than allowances for loans
• Year-on-year segment trends: • RO: coverage improves on significant reduction of NPL stock • SK: continuous increase of coverage ratio following temporary
decline at year-end 2015 (due to adoption of EBA default definition)
• RS: declining NPLs drive provision coverage to a very comfortable level
• Quarter-on-quarter segment trends:
• Strongest increase of provision coverage in RS, SK and CZ • Other: provision coverage improves after temporary increase in
NPLs in residual segment Other in Q2 17
22
50
58
46
53
46
41RS
HR 564 580 551
HU 179 198 318
SK 366 353 349
RO 788 800 863
CZ 468 474 578
AT/OA 403 442 485
AT/SB 1,068
Other
1,203
AT/EBOe 379 413
1,094
Group 4,302
4,451 4,948
492
56.2% 144.1%
110.1% 105.5%
96.0% 68.3% 68.6% 69.5%
78.3% 78.3%
69.0% 78.2% 75.3%
66.3% 94.0% 92.1%
79.4%
88.1% 85.7%
80.2% 56.7% 56.7% 59.2% 57.5% 57.3% 59.9% 59.7% 60.0% 61.5% 69.5% 68.5% 67.7%
79.7%
30/09/17 30/06/17 30/09/16
in EUR m

Page
Business performance: other result – Other result stable with no significant one-offs in Q3 17
• Yoy flat as improvements in HU (provisions booked in prior period) offset lower result in Other segment
• Qoq improvement on provisions for court rulings related to the passing on of negative interest rates to consumer borrowers in AT in Q2 17 (EUR 45.0m), partially offset by one-off effects in AT/OA, HU in Q2 17
• Year-on-year segment trends: • HU: other result improves due to elevated provisions
booked in Q3 16 • Other: lower result in service entities
• Quarter-on-quarter segment trends:
• AT/EBOe and AT/SB: provisions for court rulings related to the passing on of negative interest rates to consumer borrowers booked in Q2 17(see above)
• AT/OA: pos. one-off effect resulting from property sales in Q2 17
23
0
6
0
0
-6
-28
-10
-3
-2
-6
-5
-61
-32
0
-1
12
-4
-20
1
23
-29
-19
-68
-27
0
-2
0
-10
-11
-3
-9
-2
-59
Other
RS
HR
HU
SK
RO
CZ
AT/OA
AT/SB
AT/EBOe
Group
in EUR m
Q3 17
Q3 16 Q2 17
Page
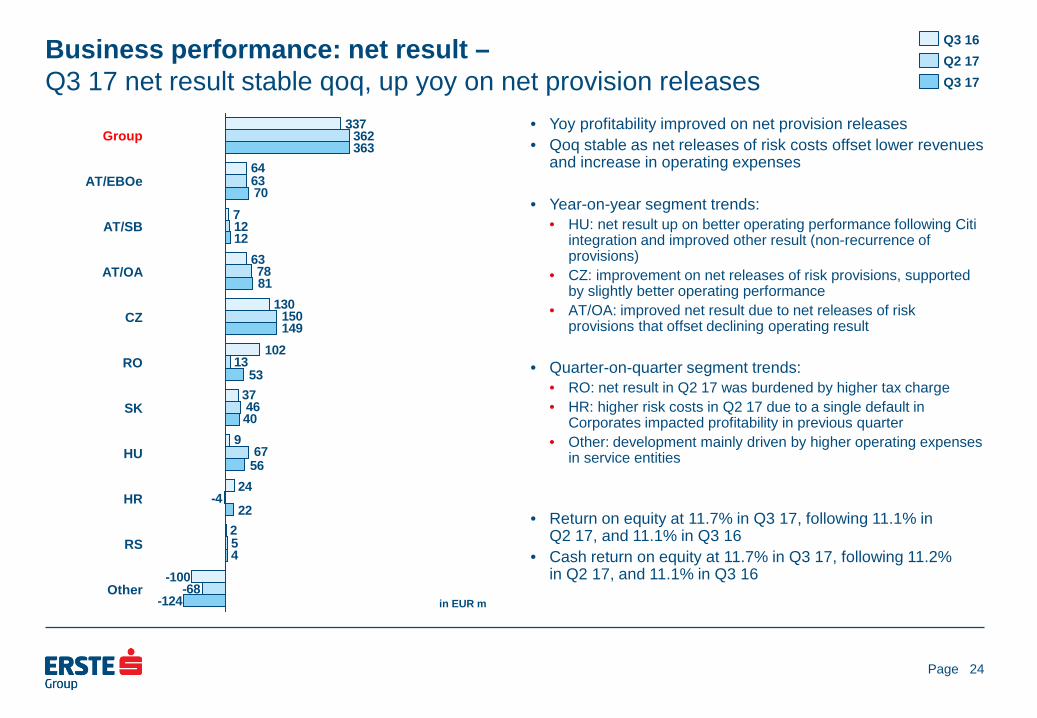
Business performance: net result – Q3 17 net result stable qoq, up yoy on net provision releases
• Yoy profitability improved on net provision releases • Qoq stable as net releases of risk costs offset lower revenues
and increase in operating expenses
• Year-on-year segment trends: • HU: net result up on better operating performance following Citi
integration and improved other result (non-recurrence of provisions)
• CZ: improvement on net releases of risk provisions, supported by slightly better operating performance
• AT/OA: improved net result due to net releases of risk provisions that offset declining operating result
• Quarter-on-quarter segment trends:
• RO: net result in Q2 17 was burdened by higher tax charge • HR: higher risk costs in Q2 17 due to a single default in
Corporates impacted profitability in previous quarter • Other: development mainly driven by higher operating expenses
in service entities
• Return on equity at 11.7% in Q3 17, following 11.1% in
Q2 17, and 11.1% in Q3 16 • Cash return on equity at 11.7% in Q3 17, following 11.2%
in Q2 17, and 11.1% in Q3 16
24
63
24
362
63
13
5
363
12
-100
2
9
37
102
130
7
64
337
-68
-4
67
46
150
78
12
-124
4
22
56
40
53
149
81
70
RS
HR
HU
SK
RO
CZ
AT/OA
AT/SB
AT/EBOe
Group
Other in EUR m
Q3 17
Q3 16 Q2 17

Page
Presentation topics
25
• Executive summary • Business environment • Business performance • Assets and liabilities • Outlook • Additional information

Page
Assets and liabilities: YTD overview – Loan/deposit ratio down to 93.0% at Sep 17 (Dec 16: 94.7%)
Assets (EUR bn)
26
Assets (in %)
Liabilities & equity (EUR bn)
Liabilities & equity (in %)
30/09/17
221.7
6.2 1.5
138.0
10.4
43.5
22.1
31/12/16
208.2
6.8 1.4
130.7
3.5
47.6
18.4
Other assets Intangibles Net loans Loans to banks Trading, financial assets Cash
30/09/17
221.7
18.0 6.9
25.7
148.4
19.2 3.6
31/12/16
208.2
16.6 7.0
27.2
138.0
14.6 4.8
Equity Other liabilities Debt securities Customer deposits Bank deposits Trading liabilities
100%
30/09/17
2.8% 0.7%
62.2%
4.7%
19.6%
10.0%
31/12/16
3.3% 0.7%
62.7%
1.7%
22.9%
8.8% 100%
30/09/17
8.1% 3.1%
11.6%
66.9%
8.7% 1.6%
31/12/16
8.0% 3.4%
13.1%
66.3%
7.0% 2.3%

Page
Assets and liabilities: customer loans by country of risk – Net customer loans up 5.6% ytd, NPLs down 7.3% ytd
Net customer loans (EUR bn)
Performing loans (EUR bn)
27
Non-performing loans (EUR bn)
• Performing loan growth driven by Czech Republic, Austria and Slovakia • Main contributing business lines: Retail and Corporates • Growing performing loans in other geographies, thereof most dynamic development in Serbia
• 15.3% yoy decline in NPL stock mainly driven by recoveries and positive migration trends across most geographies
69.1
21.4
10.4 7.8
3.8 6.0 0.8 6.3 3.3
+7.0%
30/09/17
138.0
71.7
25.3
12.0 7.7
3.9 6.1 1.0 6.8 3.5
31/12/16
130.7
69.9
21.7
10.8 7.6
3.9 6.1 0.9 6.4 3.4
30/09/16
129.0
AT CZ SK RO HU HR RS Other EU Other
+7.5%
30/09/17
136.1
70.9
25.1
11.8 7.7
3.9 5.7 1.0 6.6 3.5
31/12/16
128.6
68.9
21.5
10.6
6.2 3.4
30/09/16
126.6
68.2
21.2
10.2 7.6
3.7 5.7 0.8 6.0 3.3
3.8 5.8 0.9
7.5
-15.3%
30/09/17
6.2
2.0
0.7 0.6
0.9 0.3 1.0
0.1 0.4
0.2
31/12/16
6.5
2.1
0.7 0.6
0.9
0.5 0.2
30/09/16
7.3
2.3
0.9
0.6
1.2
0.5
0.9 0.1
0.5 0.2
1.1 0.1
0.3

Page
Assets and liabilities: allowances for customer loans – As asset quality improves lower interest income from NPLs weighs on NII
Quarterly development (EUR m)
28
Highlights • Development of interest income from NPLs:
• 2013: EUR 270m • 2014: EUR 202m • 2015: EUR 162m • 2016: EUR 106m
• P&L unwinding impact = interest income from impaired loans = EUR 17m in Q3 17 (Q2 17: EUR 23m, Q3 16: EUR 19m)
321
578
476
522458
587
26
371
137212
418
81
450
30/06/17
4,302
30/09/17
23 4,451
19
17
31/03/17
4,526 16
31/12/16
40
30/09/16
4,948
12
1
4,613
Exchange-rate and other changes (+/-) Interest income from impaired loans
Releases Use Allocations
• Erste Group does not accrue interest on NPLs • When a loan turns NPL Erste Group estimates
the recoverable amount and the time frame of recovery
• The recoverable amount is discounted to present (at the effective interest rate of the underlying contract) and a provision reflecting the time value of money is created, ie a higher provision than without discounting
• The time value is released through NII until recovery realisation
Unwinding impact explained

Page
Assets and liabilities: financial and trading assets * – LCR at excellent 144.7%
By geography in EUR bn
By debtor type
29
Liquidity buffer in EUR bn
• Liquidity buffer is defined as unencumbered collateral plus cash
• Total liabilities are defined as total on balance sheet liabilities excluding total equity
-7.3%
30/09/17
39.9
9.8
7.5
5.1
5.2 3.2
0.8
8.3
31/12/16
42.8
10.8
8.5
5.4
4.8 2.4 1.0
9.9
30/09/16
43.1
11.2
8.4
5.8
4.5 2.3 1.1
9.8
AT CZ SK
RO HU DE Other
100%
30/09/17
83.0%
7.8% 9.3%
31/12/16
83.8%
7.3% 8.9%
30/09/16
83.2%
7.5% 9.3%
Sovereign Banks Other
31/12/16
51.2
26.7%
31/12/15
46.1
24.9%
31/12/14
45.4
24.8%
30/09/17
55.5
27.2%
Liquidity buffer as % of total liabilities Liquidity buffer
* Excludes derivatives held for trading.

Page
Assets and liabilities: customer deposit funding – Customer deposits grow by 1.9% qoq, up 7.5% ytd
By customer type in EUR bn
By product type
30
in EUR bn
Highlights • Continued deposit inflows driven by Retail
segment with highest demand for overnight deposits amid low interest rate environment
• Solid growth also in corporate and public sector deposits
• Increased money market activities in CZ and on Holding level
• Increasing share of overnight deposits with significantly longer behavioural maturity provides a cost effective funding source
30/09/17
148.4
96.2
51.3
0.8 0.1
31/12/16
138.0
85.7
52.1
0.2 0.1
30/09/16
134.0
81.4
52.2
0.4 0.1
Overnight deposits Term deposits Repurchase agreements FV deposits
+10.7%
30/09/17
148.4
102.3
28.0
10.2 7.8 0.1
31/12/16
138.0
97.8
25.4
8.3 6.4 0.1
30/09/16
134.0
95.4
23.7
7.7 7.1 0.1
Households Non-financial corporations Other financial corporations General governments FV deposits

Page
Assets and liabilities: debt vs interbank funding – Limited wholesale funding reliance, as customer deposits grow strongly
Debt securities issued in EUR bn
Interbank deposits in EUR bn
31
• Overall reduction in wholesale funding reliance led by decline in outstanding senior unsecured debt
• Money market activities peaked in CZ, interbank deposits increase by 7.5% qoq
-6.0%
30/09/17
25.7
0.2 1.2
8.2
0.8 0.2
9.2
0.0
5.9
31/12/16
27.2
0.1 1.5
7.7
0.9 0.4
10.5
0.0
6.1
30/09/16
27.3
0.1 1.5
7.6
1.0 0.1
10.8
0.0
6.2
Other Public sector CBs Mortgage CBs Other CDs, name cert’s Certificates of deposit Senior unsec. bonds Hybrid issues Sub debt
+26.3%
30/09/17
19.2
2.9
10.9
5.4
31/12/16
14.6
1.5
9.5
3.6
30/09/16
15.2
0.9
9.7
4.6 Repurchase agreements
Overnight deposits Term deposits

Page
Assets and liabilities: LT funding – Limited LT funding needs
Maturity profile of debt
32
• In January 2017 Erste Group opened the covered bond market for Austrian issuers with a EUR 750m 10y mortgage covered bond • Erste Group’s second CRD IV/CRR compliant AT1-benchmark transaction was issued at the beginning of Q2 17 (EUR 500m, perpNC7). The
already comfortable capital position of Erste Group was further strengthened and the issue contributes to the transition towards an optimal CRR-compliant capital structure.
• During the latest TLTRO Erste Group participated with EUR 1.17bn which brings the total utilisation up to approximately EUR 3.5bn. • With the aforementioned benchmark issues and continuous private placements for its retail and institutional clients Erste Group has already
fulfilled its funding needs for the current year
2029+
0.7
2028
0.2
2027
1.3
2026
0.6
2025
1.3
2024
0.8
2023
1.9
2022
2.9
2021
3.0
2020
2.7
2019
2.0
2018
2.9
2017
0.8
Senior unsec. bonds Covered bonds Debt CEE Capital exc Tier 1
in EUR bn
Page
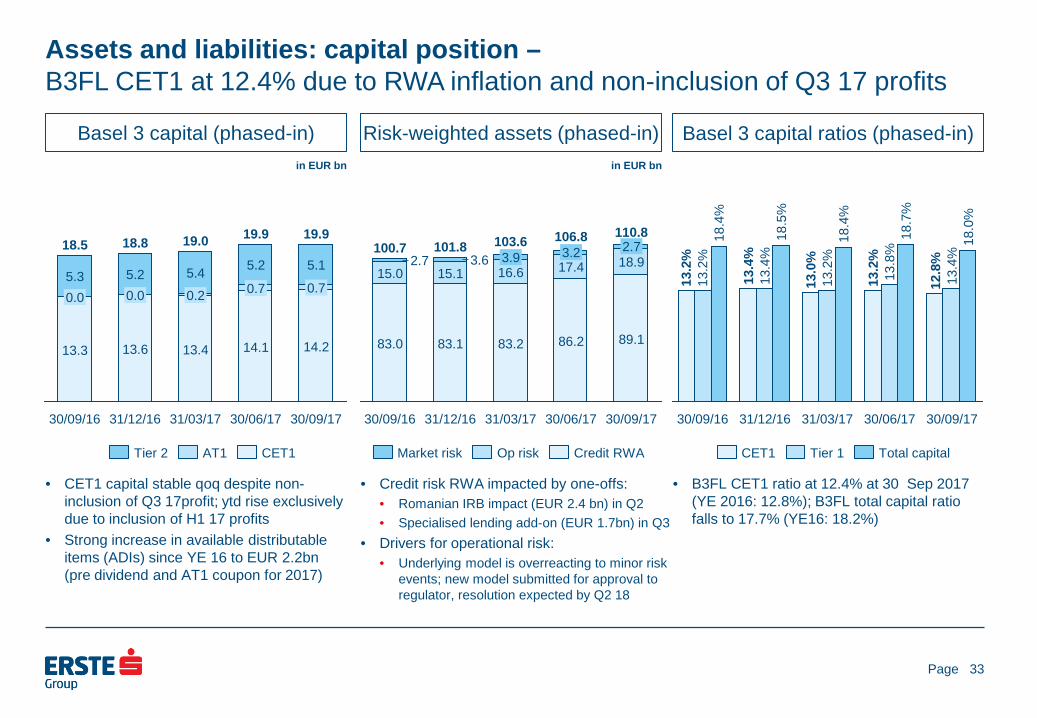
Basel 3 capital (phased-in) in EUR bn
Risk-weighted assets (phased-in)
33
in EUR bn
Basel 3 capital ratios (phased-in)
• CET1 capital stable qoq despite non-inclusion of Q3 17profit; ytd rise exclusively due to inclusion of H1 17 profits
• Strong increase in available distributable items (ADIs) since YE 16 to EUR 2.2bn (pre dividend and AT1 coupon for 2017)
• Credit risk RWA impacted by one-offs: • Romanian IRB impact (EUR 2.4 bn) in Q2 • Specialised lending add-on (EUR 1.7bn) in Q3
• Drivers for operational risk: • Underlying model is overreacting to minor risk
events; new model submitted for approval to regulator, resolution expected by Q2 18
• B3FL CET1 ratio at 12.4% at 30 Sep 2017 (YE 2016: 12.8%); B3FL total capital ratio falls to 17.7% (YE16: 18.2%)
30/09/17
19.9
14.2
0.7
5.1
30/06/17
19.9
14.1
0.7
5.2
31/03/17
19.0
13.4
0.2
5.4
31/12/16
18.8
13.6
0.0 5.2
30/09/16
18.5
13.3
0.0 5.3
CET1 AT1 Tier 2
30/06/17
106.8
86.2
17.4 3.2
31/03/17
103.6
83.2
16.6 3.9
31/12/16
101.8
83.1
15.1 3.6
30/09/16
100.7
83.0
15.0 2.7
30/09/17
110.8
89.1
18.9 2.7
Credit RWA Op risk Market risk
30/06/17
18.7
%
13.8
%
13.2
%
31/03/17
18.4
%
13.2
%
13.0
%
31/12/16
18.5
%
13.4
%
13.4
%
30/09/16
18.4
%
13.2
%
13.2
%
30/09/17
18.0
%
13.4
%
12.8
%
Total capital Tier 1 CET1
Assets and liabilities: capital position – B3FL CET1 at 12.4% due to RWA inflation and non-inclusion of Q3 17 profits

Page
Presentation topics
34
• Executive summary • Business environment • Business performance • Assets and liabilities • Outlook • Additional information
Page
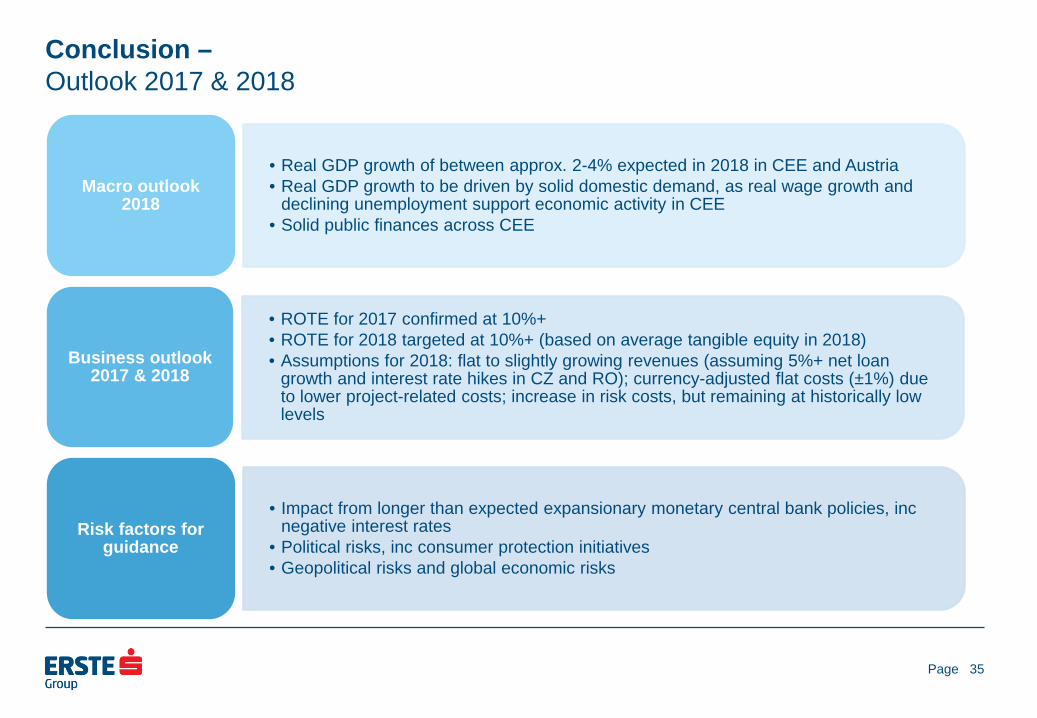
• Real GDP growth of between approx. 2-4% expected in 2018 in CEE and Austria • Real GDP growth to be driven by solid domestic demand, as real wage growth and
declining unemployment support economic activity in CEE • Solid public finances across CEE
Macro outlook 2018
• ROTE for 2017 confirmed at 10%+ • ROTE for 2018 targeted at 10%+ (based on average tangible equity in 2018) • Assumptions for 2018: flat to slightly growing revenues (assuming 5%+ net loan
growth and interest rate hikes in CZ and RO); currency-adjusted flat costs (±1%) due to lower project-related costs; increase in risk costs, but remaining at historically low levels
Business outlook 2017 & 2018
• Impact from longer than expected expansionary monetary central bank policies, inc negative interest rates
• Political risks, inc consumer protection initiatives • Geopolitical risks and global economic risks
Risk factors for guidance
Conclusion – Outlook 2017 & 2018
35

Page
Presentation topics
36
• Executive summary • Business environment • Business performance • Assets and liabilities • Outlook • Additional information

Page
Additional information: new segmentation – Business line and geographic view
Retail
Erste Group – Business segments
Corporates Savings Banks
Group Markets
Group Corporate
Center
Intragroup Elimination
Erste Group – Geographical segmentation
Austria Central and Eastern Europe Other
EBOe & Subsidiaries (AT/EBOe)
Savings Banks (AT/SB)
Other Austria
(AT/OA)
Czech Republic
(CZ)
Romania (RO)
Slovakia (SK)
Hungary (HU)
Croatia (HR)
Serbia (RS)
• Holding Business • Erste Group Immorent • Erste Asset Management
• Asset/Liability Management • Local Corporate Center
• SME • Local Large Corporate • Group Large Corporate • Commercial Real Estate • Public Sector
• Other Subsidiaries • Group bookings • Holding Corporate Center • Free Capital
• Holding ALM • Holding CC • Other Subsidiaries • Group bookings and
IC elimination • Free Capital
37
ALM & Local CC
(ALM&LCC)

Page
Additional information: income statement – Year-to-date and quarterly view
38
in EUR million 1-9 16 1-9 17 YOY-Δ Q3 16 Q2 17 Q3 17 YOY-Δ QOQ-ΔNet interest income 3,267.5 3,229.3 -1.2% 1,073.4 1,091.7 1,086.3 1.2% -0.5%Net fee and commission income 1,319.8 1,361.9 3.2% 434.9 453.2 451.0 3.7% -0.5%Dividend income 36.2 37.5 3.5% 4.8 23.4 10.4 >100.0% -55.5%Net trading result 218.7 139.3 -36.3% 98.7 54.3 36.5 -63.0% -32.8%Result from financial assets and liabilities designated at fair value through profit or loss -27.1 12.1 n/a -14.6 1.5 7.7 n/a >100.0%Net result from equity method investments 5.9 10.1 72.2% 0.2 2.9 4.0 >100.0% 39.6%Rental income from investment properties & other operating leases 138.7 146.6 5.7% 45.7 48.2 48.3 5.7% 0.2%Personnel expenses -1,724.7 -1,747.2 1.3% -572.0 -579.6 -595.9 4.2% 2.8%Other administrative expenses -910.0 -925.2 1.7% -299.9 -291.8 -301.1 0.4% 3.2%Depreciation and amortisation -328.4 -341.1 3.9% -110.8 -113.8 -113.0 2.0% -0.7%Gains/losses from financial assets and liabilities not measured at fair value through profit or loss, net 147.7 70.8 -52.1% -0.7 14.2 28.3 n/a 99.0%Net impairment loss on financial assets -63.2 -71.5 13.1% -37.4 -38.6 32.9 n/a n/aOther operating result -252.4 -296.6 17.5% -60.3 -82.7 -86.8 44.0% 4.9%
Levies on banking activities -151.7 -82.1 -45.9% -44.0 -23.6 -22.7 -48.4% -3.5%Pre-tax result from continuing operations 1,828.7 1,626.1 -11.1% 562.0 583.0 608.5 8.3% 4.4%Taxes on income -403.9 -365.9 -9.4% -125.1 -128.2 -142.0 13.5% 10.7%Net result for the period 1,424.8 1,260.2 -11.6% 436.9 454.7 466.5 6.8% 2.6%
Net result attributable to non-controlling interests 245.6 272.6 11.0% 99.4 92.3 103.5 4.1% 12.2%Net result attributable to owners of the parent 1,179.2 987.6 -16.2% 337.4 362.5 363.0 7.6% 0.1%
Operating income 4,959.7 4,936.9 -0.5% 1,643.1 1,675.2 1,644.2 0.1% -1.9%Operating expenses -2,963.0 -3,013.6 1.7% -982.7 -985.2 -1,010.1 2.8% 2.5%Operating result 1,996.6 1,923.4 -3.7% 660.4 690.0 634.1 -4.0% -8.1%
Year-to-date view Quarterly view

Page
Additional information: group balance sheet – Assets
39
in EUR million Sep 16 Dec 16 Mar 17 Jun 17 Sep 17 YOY-Δ YTD-Δ QOQ-ΔCash and cash balances 14,743 18,353 24,731 25,842 22,104 49.9% 20.4% -14.5%Financial assets - held for trading 9,731 7,950 7,827 7,206 6,850 -29.6% -13.8% -4.9%
Derivatives 5,297 4,475 4,101 3,990 3,639 -31.3% -18.7% -8.8%Other trading assets 4,433 3,476 3,726 3,216 3,211 -27.6% -7.6% -0.2%
Financial assets - at fair value through profit or loss 477 480 518 539 549 15.1% 14.4% 1.8%Financial assets - available for sale 20,406 19,886 17,887 17,786 16,743 -17.9% -15.8% -5.9%Financial assets - held to maturity 18,451 19,270 19,912 19,355 19,398 5.1% 0.7% 0.2%Loans and receivables to credit institutions 5,191 3,469 10,448 4,347 10,358 99.5% >100.0% >100.0%Loans and receivables to customers 128,985 130,654 132,992 135,122 138,005 7.0% 5.6% 2.1%Derivatives - hedge accounting 2,208 1,424 1,297 1,063 1,006 -54.4% -29.3% -5.3%Changes in fair value of portfolio hedged items 0 0 0 0 0 n/a n/a n/aProperty and equipment 2,335 2,477 2,441 2,431 2,414 3.4% -2.5% -0.7%Investment properties 658 1,023 1,025 1,027 1,033 57.0% 1.0% 0.6%Intangible assets 1,443 1,390 1,378 1,458 1,474 2.2% 6.0% 1.1%Investments in associates and joint ventures 185 193 200 196 196 6.1% 1.4% 0.2%Current tax assets 130 124 117 156 123 -5.6% -1.3% -21.3%Deferred tax assets 245 234 238 209 209 -14.6% -10.5% 0.1%Assets held for sale 372 279 262 231 217 -41.6% -22.3% -6.0%Other assets 1,254 1,020 1,525 1,190 1,036 -17.4% 1.6% -12.9%Total assets 206,811 208,227 222,798 218,156 221,715 7.2% 6.5% 1.6%
Quarterly data Change

Page
Additional information: group balance sheet – Liabilities and equity
40
in EUR million Sep 16 Dec 16 Mar 17 Jun 17 Sep 17 YOY-Δ YTD-Δ QOQ-ΔFinancial liabilities - held for trading 6,272 4,762 4,314 3,960 3,551 -43.4% -25.4% -10.3%
Derivatives 4,933 4,185 3,855 3,646 3,206 -35.0% -23.4% -12.1%Other trading liabilities 1,339 577 459 314 344 -74.3% -40.3% 9.6%
Financial liabilities - at fair value through profit or loss 1,737 1,763 1,906 1,819 1,810 4.2% 2.6% -0.5%Deposits from banks 0 0 0 0 0 n/a n/a n/aDeposits from customers 79 74 64 51 51 -35.9% -31.5% -0.9%Debt securities issued 1,658 1,689 1,842 1,768 1,759 6.1% 4.1% -0.5%Other financial liabilities 0 0 0 0 0 n/a n/a n/a
Financial liabilities measured at amortised cost 175,780 178,909 193,523 188,890 192,089 9.3% 7.4% 1.7%Deposits from banks 15,228 14,631 22,935 17,883 19,226 26.3% 31.4% 7.5%Deposits from customers 133,944 137,939 144,643 145,523 148,313 10.7% 7.5% 1.9%Debt securities issued 25,642 25,503 25,285 24,834 23,902 -6.8% -6.3% -3.8%Other financial liabilities 966 836 660 649 649 -32.8% -22.4% 0.0%
Derivatives - hedge accounting 642 473 439 411 409 -36.2% -13.4% -0.5%Changes in fair value of portfolio hedged items 1,128 942 863 772 745 -33.9% -20.9% -3.5%Provisions 1,758 1,702 1,812 1,696 1,645 -6.4% -3.4% -3.0%Current tax liabilities 62 66 61 102 77 23.3% 16.3% -24.6%Deferred tax liabilities 174 68 77 67 110 -36.5% 63.4% 63.6%Liabilities associated with assets held for sale 3 5 5 0 0 -100.0% -100.0% n/aOther liabilities 2,727 2,936 2,905 2,923 3,310 21.4% 12.7% 13.2%Total equity 16,529 16,602 16,894 17,515 17,969 8.7% 8.2% 2.6%
Equity attributable to non-controlling interests 4,063 4,142 4,209 4,262 4,367 7.5% 5.4% 2.5%Equity attributable to owners of the parent 12,466 12,460 12,685 13,253 13,602 9.1% 9.2% 2.6%
Total liabilities and equity 206,811 208,227 222,798 218,156 221,715 7.2% 6.5% 1.6%
Quarterly data Change

Page
Additional information: regulatory capital position – Capital requirements (SREP) for 2017; Erste target of 12.75%+ unchanged • Almost unchanged capital requirements in 2017, excluding P2G significant decline vs 2016
• Buffer to MDA restriction as of 30 Sept 17: 376bps • Available distributable items (ADI) as of 30 Sept 17: EUR 2.18bn (pre dividend and AT1 deduction for 2017)
41
1) 2018e values are based on draft SREP. P2G is expected to be positive in the future. 2) Consolidated capital ratios pursuant to IFRS. Unconsolidated capital ratios pursuant to Austrian Commercial Code (UGB) and on phased-in basis as of June 2017. ADIs pursuant to UGB. 3) Based on Q3 2017 exposure
Fully loaded Phased-in Fully loaded2016 2017 2018e 2019e 2017 2018e 2019e
Pillar 1 CET1 requirement 4.50% 4.50% 4.50% 4.50% 4.50% 4.50% 4.50%Combined buffer requirement 0.88% 1.90% 3.18% 4.81% 1.34% 3.07% 4.69%
Capital conservation buffer 0.63% 1.25% 1.88% 2.50% 1.25% 1.88% 2.50%Countercyclical capital buffer 3 0.15% 0.31% 0.31% 0.09% 0.19% 0.19%OSII/Systemic risk buffer 0.25% 0.50% 1.00% 2.00% 0.00% 1.00% 2.00%
Pillar 2 CET1 requirement 1.75% 1.75% 1.75% 1.75% 1.75% 1.75%Pillar 2 CET1 guidance 1 1.66% 1.66%>P2G>0% 1.66%>P2G>0% 1.00%1.66%>P2G>0% 1.66%>P2G>0%
Regulatory minimum ratios excluding P2GCET1 requirement 9.75% 8.15% 9.43% 11.06% 7.59% 9.32% 10.94%
1.50% AT1 Tier 1 requirement NM 9.65% 10.93% 12.56% 9.09% 10.82% 12.44%2.00% T2 Own funds requirement NM 11.65% 12.93% 14.56% 11.09% 12.82% 14.44%
Regulatory minimum ratios including P2GCET1 requirement 9.75% 9.81% NA NA 8.59% NA NA
1.50% AT1 Tier 1 requirement NM 9.65% NA NA 9.09% NA NA2.00% T2 Own funds requirement NM 11.65% NA NA 11.09% NA NA
Reported CET1 ratio as of September 2017 2 12.80% 12.40% 18.77% NA
Phased-inErste Group Consolidated Erste Group Unconsolidated
4.38%

Page
Additional information: gross customer loans – By risk category, by currency, by industry
Gross cust. loans by risk category (EUR bn)
42
Gross customer loans by currency (EUR bn) Gross customer loans by industry (EUR bn)
Gross customer loans by risk category (in %)
Gross customer loans by currency (in %)
30/09/17
142.3
119.8
14.8 1.5 6.2
30/06/17
139.6
116.9
14.5 1.7 6.5
31/03/17
137.5
114.5
14.6 1.7 6.7
31/12/16
135.3
112.3
14.7 1.6 6.7
30/09/16
133.9
109.9
15.1 1.7 7.3
Low risk
Management attention
Substandard
Non-performing
100%
30/09/17
84.2%
10.4% 1.1% 4.3%
30/06/17
83.8%
10.4% 1.2% 4.7%
31/03/17
83.3%
10.6% 1.3% 4.9%
31/12/16
83.0%
10.9% 1.2% 4.9%
30/09/16
82.0%
11.3% 1.2% 5.5%
142.3
103.1
30.3 4.3
30/09/17
1.8 2.8
30/06/17
139.6
100.4
30.1 4.8
1.8 2.5
31/03/17
137.5
99.0
29.2 5.1
1.7 2.5
31/12/16
135.3
98.1
27.5 5.4 1.6
2.7
30/09/16
133.9
96.4
27.6 5.5 1.7
2.7
EUR CEE-LCY CHF Other USD
31/03/17
72.0%
21.2% 3.7% 1.3% 1.8%
31/12/16
72.5%
20.4% 1.9%
1.2% 2.0%
30/09/16
72.0%
20.6% 4.1%
1.2% 2.0%
30/09/17
72.5%
21.3% 3.0%
1.3%
30/06/17
4.0%
71.9%
21.6% 3.4%
1.3% 1.8%
4.7 7.9
3.6 3.8 9.0
30/06/17
139.6
58.3
22.3
10.5
8.2 6.5 5.8 4.4 7.5 3.6
3.7 8.7
31/03/17
137.5
57.2
22.3
10.2
8.0 6.4 5.9 4.7 7.1 3.6
3.6 8.5
31/12/16
135.3
56.4
21.8
10.1
7.9 6.2 6.0
3.8 7.0
3.7 3.6 8.6
30/09/16
133.9
30/09/17
21.5
9.7
7.9 6.3 6.0
3.5 7.2 3.7
55.9
8.6
142.3
59.2
22.9
10.6
8.3 6.6 5.8
3.6
Households
Real estate
Manufacturing
Trade
Construction
Public admin
Financial inst.
Services
Tourism
Transport & comms
Other

Page
• Leading retail and corporate bank in 7 geographically connected countries
• Favourable mix of mature & emerging markets with low penetration rates
• Potential for cross selling and organic growth in CEE
Additional information: footprint – Customer banking in Austria and the eastern part of the EU
Erste Group footprint Highlights
43
Direct presence
Indirect presence
Customers: 0.9m
Hungary
Employees: 3,005
Branches: 115
Customers: 3.0m
Romania
Employees: 7,114
Branches: 515
Customers: 0.4m
Serbia
Employees: 1,035
Branches: 83
Customers : 1.2m
Croatia
Employees : 3,181
Branches: 151
Customers: 4.7m
Czech Republic
Employees: 10,185
Branches: 522
Customers: 2.2m
Slovakia
Employees: 4,236
Branches: 274
Customers: 3.6m
Austria
Employees: 16,234
Branches: 917
AT
CZ
SK
HU
RO HR
RS
Employees: FTEs as of end of reporting period

Page
Additional information: strategy – A real customer need is the reason for all business
Retail banking
Corporate banking
Capital markets
Public sector
Interbank business
Customer banking in Central and Eastern Europe
Eastern part of EU Focus on CEE, limited exposure to other Europe
Focus on local currency mortgage and consumer loans funded by local deposits FX loans only in EUR for clients with EUR income (or equivalent) and where funded by local FX deposits (HR & RS) Savings products, asset management and pension products
Focus on customer business, incl. customer-based trading activities In addition to core markets, presences in Poland, Germany and London with institutional client focus and selected product mix Building debt and equity capital markets in CEE
Financing sovereigns and municipalities with focus on infrastructure development in core markets Any sovereign holdings are only held for market-making, liquidity or balance sheet management reasons
Large, local corporate and SME banking Advisory services, with focus on providing access to capital markets and corporate finance Real estate business that goes beyond financing
Focus on banks that operate in the core markets Any bank exposure is only held for liquidity or balance sheet management reasons or to support client business
44

Page
Additional information: Ratings – Composition of Erste Group Bank AG’s issuer ratings
45
Status as of 30 October 2017
A- Stable / F1
VR - Viability Rating (Individual Rating )
a-
SRF - Support Rating Floor
NF (No Floor)
IDR - Issuer Default Rating Long-Term Outlook / Short-Term
Asset Risk baa3Capital baa1Profitability baa3Funding Structure a3Liquid Resources baa1
Business Diversif ication 0Opacity, Complexity 0Corporate Behaviour 0
BCA Baseline Credit Assessment baa2
Affiliate Support 0
Adjusted BCA baa2
LGF Loss Given Failure + 2Government Support 0
Qualitative Factors
Financial Profile
+
+
=Issuer Rating / Senior Unsecured
Long-Term Outlook / Short-Term
A3 Positive / P-2
=+=
AnchorBusiness Position Strong +1Capital & Earnings Adequate 0Risk Position Adequate 0Funding Above AverageLiquidity Strong
Support
ALAC SupportGRE SupportGroup SupportSovereign Support
Additional Factors
SACP - Stand-Alone Credit Profile
a
00
+
bbb+
+1
0
▲
▲
=Issuer Credit Rating
Long-Term Outlook / Short-Term
A Positive / A-1
00
0
+

Page
Additional information: shareholder structure – Total number of shares: 429,800,000
By investor By region
46
1 Economic interest Erste Foundation 2 Economic interest Savings Banks 3 Other parties to the shareholder agreement of Erste Foundation, Savings Banks and CaixaBank * Unidentified institutional and retail investors
Unidentified *
11.5%
Institutional
48.3%
Retail 5.0%
Employees 0.7%
Caixa 9.9%
Other Syndicated 3
3.8%
Savings Banks 2
4.7%
Erste Foundation 1
11.1%
BlackRock Inc 5.0%
Rest of world
3.5%
Continental Europe 25.5%
UK & Ireland
14.3%
North America
17.6%
Austria
27.6%
Unidentified *
11.5%
Status as of 30 October 2017

Page
Investor relations details
• Erste Group Bank AG, Am Belvedere 1, 1100 Vienna E-mail: [email protected] Internet: http://www.erstegroup.com/investorrelations
http://twitter.com/ErsteGroupIR http://www.slideshare.net/Erste_Group Erste Group IR App for iPad, iPhone and Android http://www.erstegroup.com/de/Investoren/IR_App
Reuters: ERST.VI Bloomberg: EBS AV Datastream: O:ERS ISIN: AT0000652011
• Contacts Thomas Sommerauer Tel: +43 (0)5 0100 17326 e-mail: [email protected] Peter Makray Tel: +43 (0)5 0100 16878 e-mail: [email protected] Simone Pilz Tel: +43 (0)5 0100 13036 e-mail: [email protected] Gerald Krames Tel: +43 (0)5 0100 12751 e-mail: [email protected]
47