Embed Size (px)
Citation preview
RESOLUTE FOREST
PRODUCTS
Q3 2017 RESULTSRICHARD GARNEAU, PRESIDENT & CEO
JO-ANN LONGWORTH, SVP & CFO
November 2, 2017
Statements in this presentation that are not reported financial results or other historical information of Resolute Forest Products Inc. are "forward-looking statements" within the meaning of the Private Securities Litigation Reform Act of 1995. They include, for example, statements relating toour: efforts and initiatives to reduce costs and increase revenues and profitability; business and operating outlook; future financial results, includingEBITDA; future pension funding obligations; assessment of market conditions; growth strategies and prospects, and the growth potential of thecompany and the industry in which it operates; liquidity; future cash flows, including as a result of changes to our pension funding obligations; andstrategies for achieving our goals generally. Forward-looking statements may be identified by the use of forward-looking terminology such as thewords “should,” “would,” “could,” “will,” “may,” “expect,” “believe,” “anticipate,” “attempt,” “project” and other terms with similar meaning indicatingpossible future events or potential impact on our business or our shareholders.
The reader is cautioned not to place undue reliance on these forward-looking statements, which are not guarantees of future performance. Thesestatements are based on management's current assumptions, beliefs and expectations, all of which involve a number of business risks anduncertainties that could cause actual results to differ materially. The potential risks and uncertainties that could cause the company's actual futurefinancial condition, results of operations and performance to differ materially from those expressed or implied in this presentation include, but arenot limited to, the impact of: developments in non-print media, and the effectiveness of our responses to these developments; any additional closurecosts and long-lived asset or goodwill impairment or accelerated depreciation charges; currency fluctuations; global economic conditions; intensecompetition in the forest products industry; negative publicity, even if unjustified; the highly cyclical nature of the forest products industry; anyincrease in the level of required contributions to our pension plans, including as a result of any increase in the amount by which they areunderfunded; the terms of our outstanding indebtedness, which could restrict our current and future operations; our ability to maintain adequatecapital resources to provide for all of our substantial capital requirements; any inability to successfully implement our strategies to increase ourearnings power; the possible failure to successfully integrate acquired businesses with ours or to realize the expected benefits of acquisitions, suchas our acquisition of Atlas, or divestitures or other strategic transactions or projects we have pursued or may pursue, including our Calhoun tissueoperations; any failure to comply with environmental or other laws or regulations, even if inadvertent; unanticipated outcomes of legal proceedingsor disputes in which we are involved; future regulation of our Canadian exports to the United States, including softwood lumber andsupercalendered paper; our exports from one country to another country becoming or remaining subject to duties, cash deposit requirements,border taxes, quotas or other trade conditions or remedies, which could require us to set aside or pay a substantial amount of cash and impact thecompetitive position of the affected operations; any difficulties in obtaining wood fiber at favorable prices, or at all; changes in the cost of purchasedenergy and other raw materials; any disruption in operations or increased labor costs due to labor disputes; uncertainty or changes in political oreconomic conditions in Canada, the United States or other countries in which our products are manufactured or sold; physical and financial risksassociated with climate change; any additional environmental or health and safety liabilities; disruptions to our supply chain, operations or thedelivery of our products; losses that are not covered by insurance; the actions of holders of a significant percentage of our common stock; extremeweather conditions or natural or man-made disasters; cybersecurity risks; and the potential risks and uncertainties described under the heading"Risk Factors" in Part I, Item 1A of the company's annual report on Form 10-K and other filings with the U.S. Securities and Exchange Commission.
All forward-looking statements in this presentation are expressly qualified by the cautionary statements contained or referred to above and in thecompany's other filings with the U.S. Securities and Exchange Commission and the Canadian securities regulatory authorities. The companydisclaims any obligation to publicly update or revise any forward-looking information, whether as a result of new information, future events orotherwise, except as required by law.
All figures in US$ unless otherwise noted
CAUTIONARY STATEMENTS REGARDING FORWARD-LOOKING INFORMATION
2RFP Q3 2017 Results – November 2, 2017
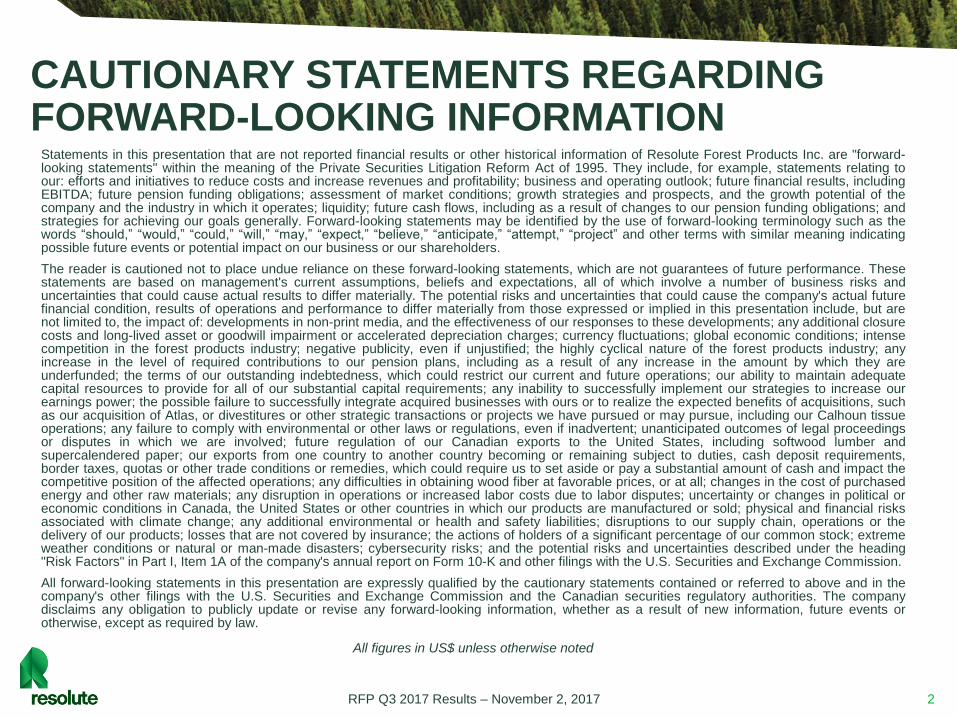
• Q3 GAAP net income of $24 million or $0.26 per share‒ Q3 net income of $31 million or $0.34 per share excluding special items
• Adjusted EBITDA of $118 million
• Further debt repayments – Despite $19 million in duty deposits
• Liquidity at $400 million‒ Despite cumulative duty deposits of $62 million
Q3 2017 FINANCIAL HIGHLIGHTS
3
Adjusted EBITDA and Liquidity are non-GAAP financial measures. Refer to Appendices A and B for a definition and reconciliation of non-GAAP financial measures.
RFP Q3 2017 Results – November 2, 2017
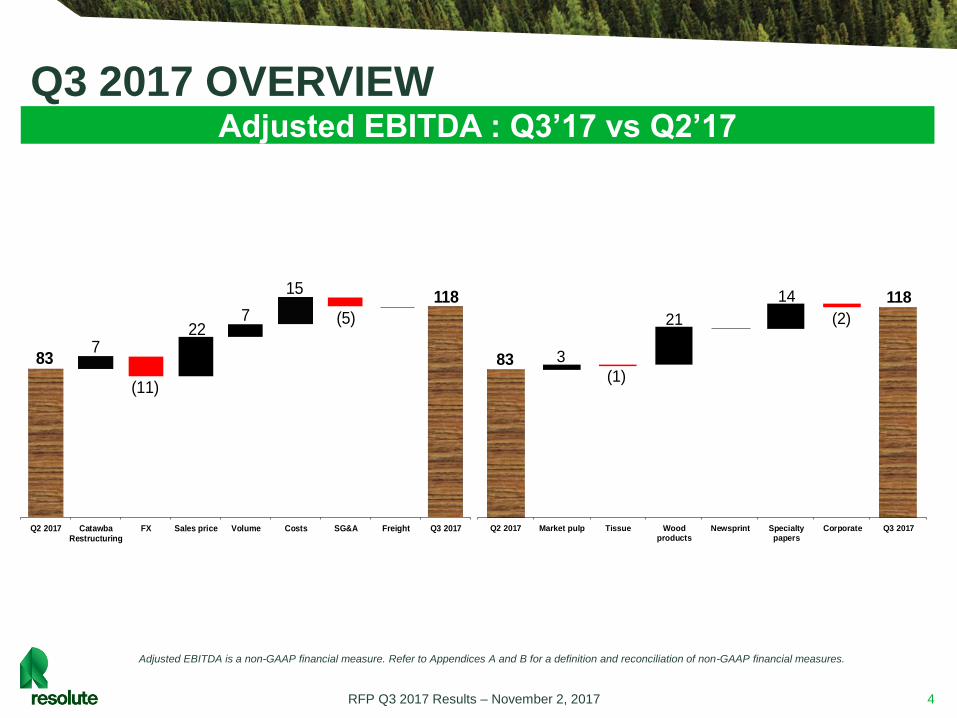
Q3 2017 OVERVIEW
4
Adjusted EBITDA : Q3’17 vs Q2’17
Adjusted EBITDA is a non-GAAP financial measure. Refer to Appendices A and B for a definition and reconciliation of non-GAAP financial measures.
RFP Q3 2017 Results – November 2, 2017
83
118
Q2 2017 CatawbaRestructuring
FX Sales price Volume Costs SG&A Freight Q3 2017
(5)
15
(11)
227
7 83
118
Q2 2017 Market pulp Tissue Woodproducts
Newsprint Specialtypapers
Corporate Q3 2017
21
14
(1)
3
(2)
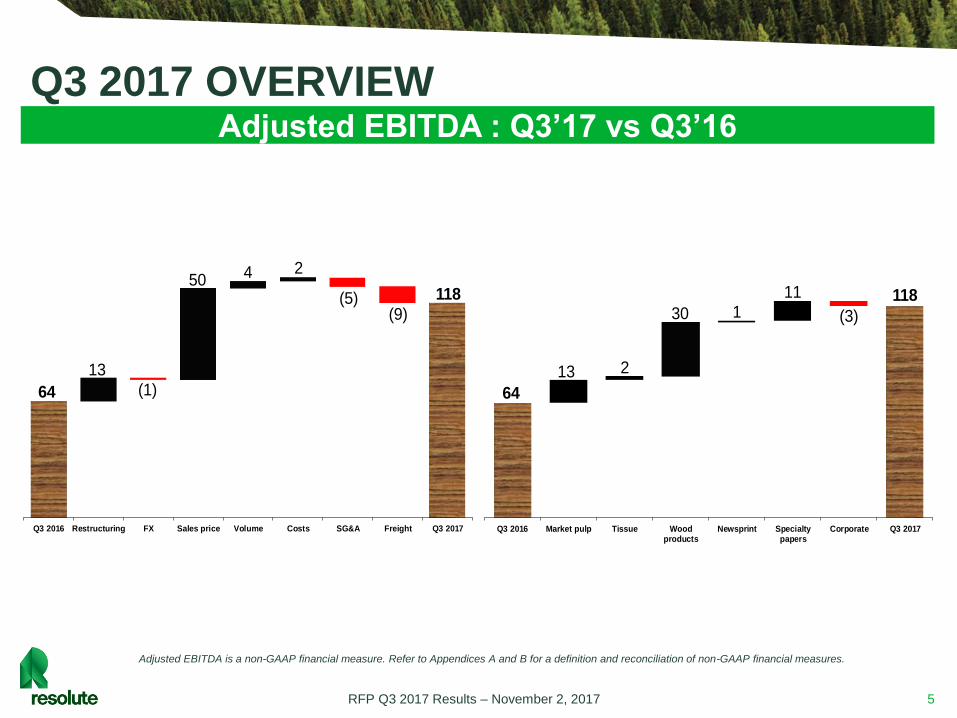
Q3 2017 OVERVIEW
5
Adjusted EBITDA : Q3’17 vs Q3’16
Adjusted EBITDA is a non-GAAP financial measure. Refer to Appendices A and B for a definition and reconciliation of non-GAAP financial measures.
RFP Q3 2017 Results – November 2, 2017
64
118
Q3 2016 Restructuring FX Sales price Volume Costs SG&A Freight Q3 2017
(5)50 4 2
(1)
(9)
13
64
118
Q3 2016 Market pulp Tissue Woodproducts
Newsprint Specialtypapers
Corporate Q3 2017
13
30 1 11
(3)
2
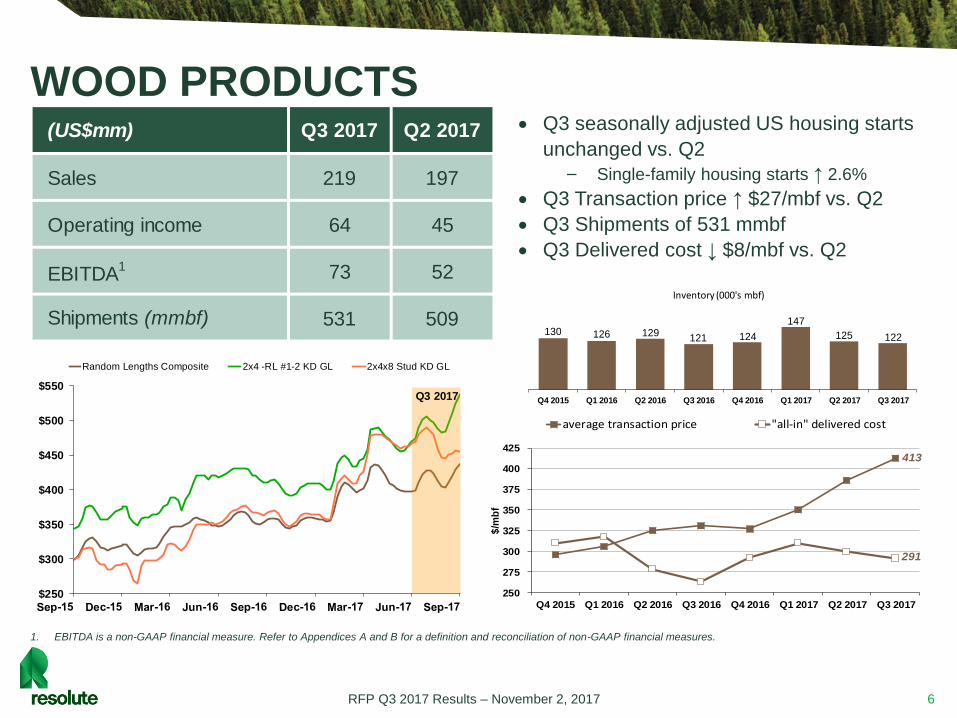
WOOD PRODUCTS
6
1. EBITDA is a non-GAAP financial measure. Refer to Appendices A and B for a definition and reconciliation of non-GAAP financial measures.
Q3 seasonally adjusted US housing starts
unchanged vs. Q2
‒ Single-family housing starts ↑ 2.6%
Q3 Transaction price ↑ $27/mbf vs. Q2
Q3 Shipments of 531 mmbf
Q3 Delivered cost ↓ $8/mbf vs. Q2
413
291
250
275
300
325
350
375
400
425
Q4 2015 Q1 2016 Q2 2016 Q3 2016 Q4 2016 Q1 2017 Q2 2017 Q3 2017
$/m
bf
average transaction price "all-in" delivered cost
130 126 129121 124
147
125 122
Q4 2015 Q1 2016 Q2 2016 Q3 2016 Q4 2016 Q1 2017 Q2 2017 Q3 2017
Inventory (000's mbf)
$250
$300
$350
$400
$450
$500
$550
Random Lengths Composite 2x4 -RL #1-2 KD GL 2x4x8 Stud KD GL
Q3 2017
(US$mm) Q3 2017 Q2 2017
Sales 219 197
Operating income 64 45
EBITDA1 73 52
Shipments (mmbf) 531 509
RFP Q3 2017 Results – November 2, 2017
MARKET PULP
7
1. EBITDA is a non-GAAP financial measure. Refer to Appendices A and B for a definition and reconciliation of non-GAAP financial measures.
2. The “all-in” delivered cost is the total cost of each ton shipped (cost of sales, depreciation and amortization, distribution costs and selling, general and administrative expenses).
9094
83
10091 92 94
100
Q4 2015 Q1 2016 Q2 2016 Q3 2016 Q4 2016 Q1 2017 Q2 2017 Q3 2017
Inventory (000's mt)
Global chemical pulp shipments ↑ 3.1% in
Q3 vs. 2016– North America ↑ 3.8%; China ↑ 4.0%;
Western Europe unchanged
– 2017 global shipments ↑ 4.5% for
softwood, ↑ 1.4% for hardwood
Q3 Transaction price ↑ $18/mt vs. Q2
Q3 Shipments ↑ 12k mt vs. Q2
Q3 Delivered cost ↑ $12/mt vs. Q2
(US$mm) Q3 2017 Q2 2017
Sales 227 213
Operating income 19 16
EBITDA1 27 24
Shipments (000’s mt) 348 336
650
595
525
550
575
600
625
650
675
Q4 2015 Q1 2016 Q2 2016 Q3 2016 Q4 2016 Q1 2017 Q2 2017 Q3 2017
$/m
t
average transaction price "all-in" delivered cost ²
RFP Q3 2017 Results – November 2, 2017
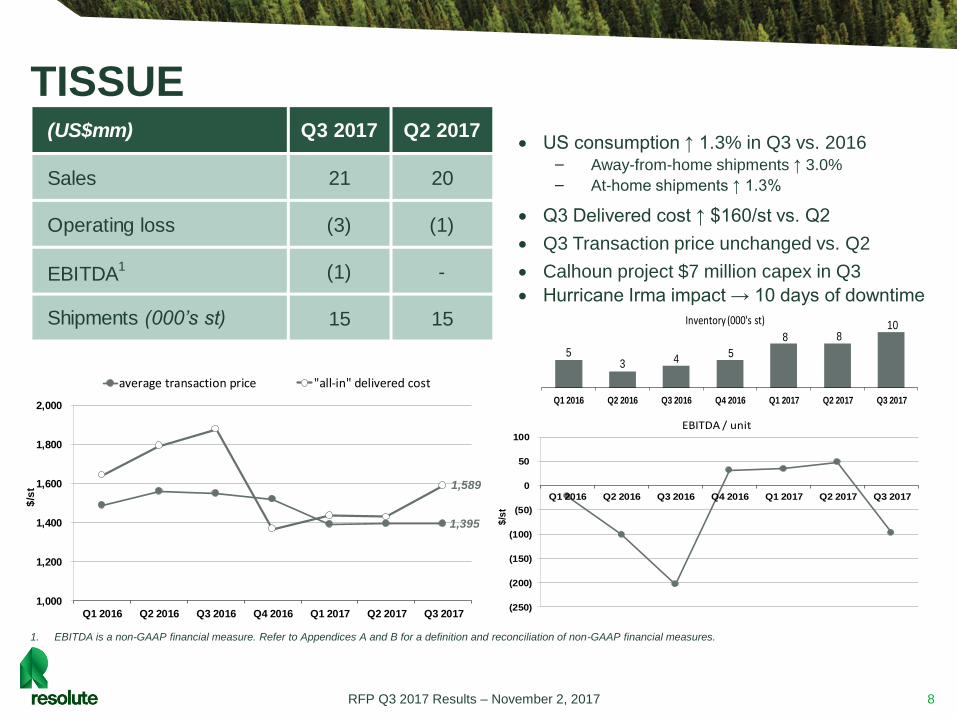
TISSUE
8
1. EBITDA is a non-GAAP financial measure. Refer to Appendices A and B for a definition and reconciliation of non-GAAP financial measures.
1,395
1,589
1,000
1,200
1,400
1,600
1,800
2,000
Q1 2016 Q2 2016 Q3 2016 Q4 2016 Q1 2017 Q2 2017 Q3 2017
$/s
t
average transaction price "all-in" delivered cost
(250)
(200)
(150)
(100)
(50)
0
50
100
Q1 2016 Q2 2016 Q3 2016 Q4 2016 Q1 2017 Q2 2017 Q3 2017$
/st
EBITDA / unit
US consumption ↑ 1.3% in Q3 vs. 2016‒ Away-from-home shipments ↑ 3.0%
‒ At-home shipments ↑ 1.3%
Q3 Delivered cost ↑ $160/st vs. Q2
Q3 Transaction price unchanged vs. Q2
Calhoun project $7 million capex in Q3
Hurricane Irma impact → 10 days of downtime
53 4
5
8 8 10
Q1 2016 Q2 2016 Q3 2016 Q4 2016 Q1 2017 Q2 2017 Q3 2017
Inventory (000's st)
(US$mm) Q3 2017 Q2 2017
Sales 21 20
Operating loss (3) (1)
EBITDA1 (1) -
Shipments (000’s st) 15 15
RFP Q3 2017 Results – November 2, 2017
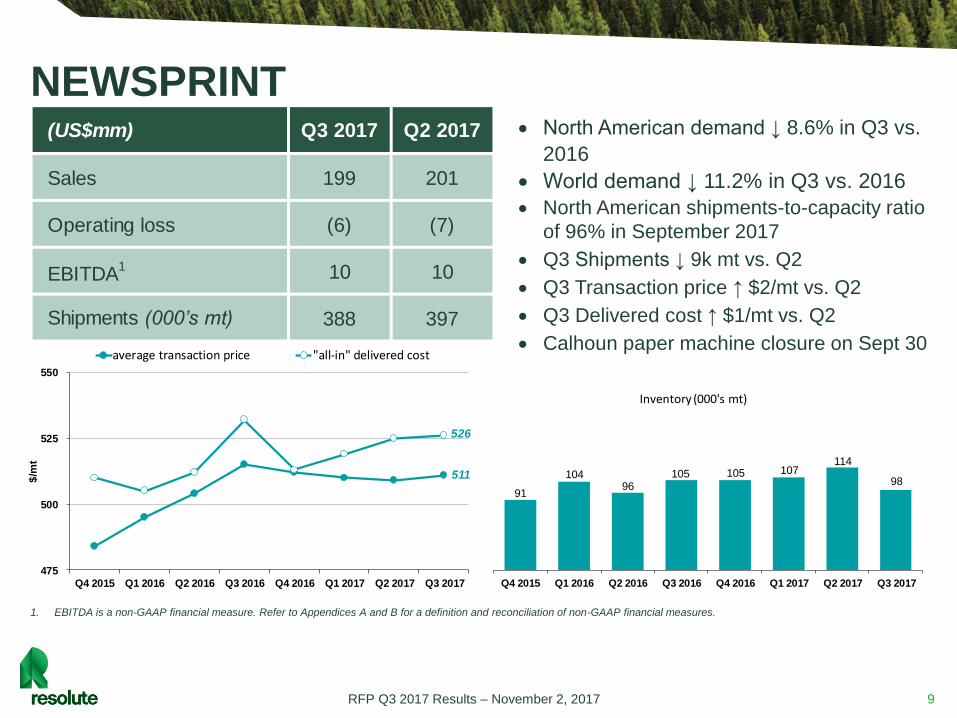
NEWSPRINT
9
1. EBITDA is a non-GAAP financial measure. Refer to Appendices A and B for a definition and reconciliation of non-GAAP financial measures.
91
10496
105 105 107114
98
Q4 2015 Q1 2016 Q2 2016 Q3 2016 Q4 2016 Q1 2017 Q2 2017 Q3 2017
Inventory (000's mt)
511
526
475
500
525
550
Q4 2015 Q1 2016 Q2 2016 Q3 2016 Q4 2016 Q1 2017 Q2 2017 Q3 2017
$/m
t
average transaction price "all-in" delivered cost
North American demand ↓ 8.6% in Q3 vs.
2016
World demand ↓ 11.2% in Q3 vs. 2016
North American shipments-to-capacity ratio
of 96% in September 2017
Q3 Shipments ↓ 9k mt vs. Q2
Q3 Transaction price ↑ $2/mt vs. Q2
Q3 Delivered cost ↑ $1/mt vs. Q2
Calhoun paper machine closure on Sept 30
(US$mm) Q3 2017 Q2 2017
Sales 199 201
Operating loss (6) (7)
EBITDA1 10 10
Shipments (000’s mt) 388 397
RFP Q3 2017 Results – November 2, 2017
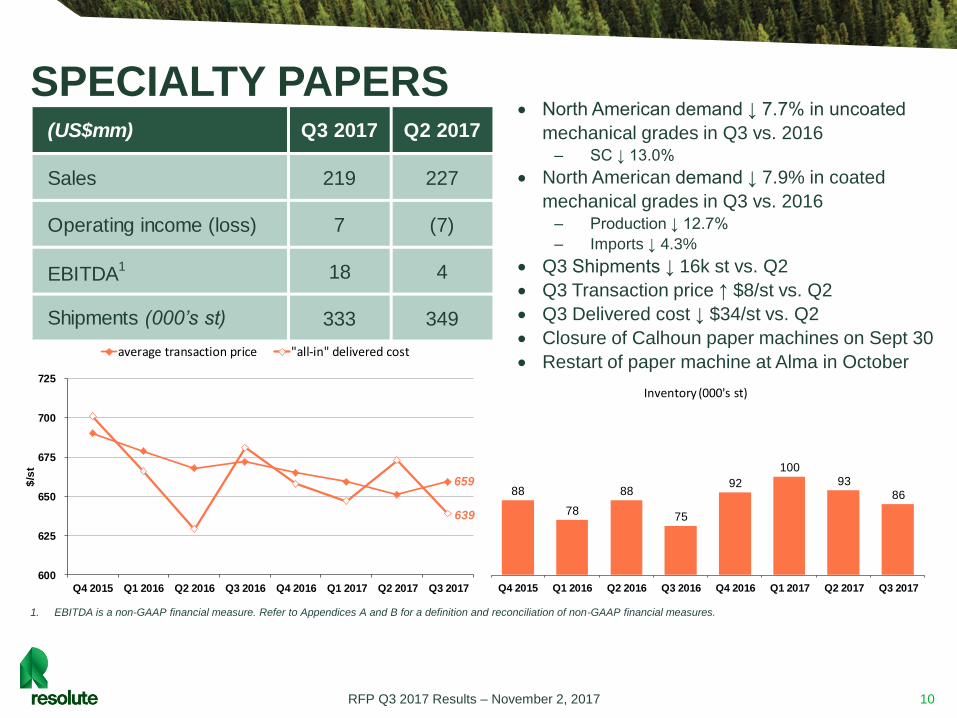
SPECIALTY PAPERS
10
1. EBITDA is a non-GAAP financial measure. Refer to Appendices A and B for a definition and reconciliation of non-GAAP financial measures.
88
78
88
75
92
10093
86
Q4 2015 Q1 2016 Q2 2016 Q3 2016 Q4 2016 Q1 2017 Q2 2017 Q3 2017
Inventory (000's st)
659
639
600
625
650
675
700
725
Q4 2015 Q1 2016 Q2 2016 Q3 2016 Q4 2016 Q1 2017 Q2 2017 Q3 2017
$/s
t
average transaction price "all-in" delivered cost
North American demand ↓ 7.7% in uncoated
mechanical grades in Q3 vs. 2016– SC ↓ 13.0%
North American demand ↓ 7.9% in coated
mechanical grades in Q3 vs. 2016 – Production ↓ 12.7%
– Imports ↓ 4.3%
Q3 Shipments ↓ 16k st vs. Q2
Q3 Transaction price ↑ $8/st vs. Q2
Q3 Delivered cost ↓ $34/st vs. Q2
Closure of Calhoun paper machines on Sept 30
Restart of paper machine at Alma in October
(US$mm) Q3 2017 Q2 2017
Sales 219 227
Operating income (loss) 7 (7)
EBITDA1 18 4
Shipments (000’s st) 333 349
RFP Q3 2017 Results – November 2, 2017
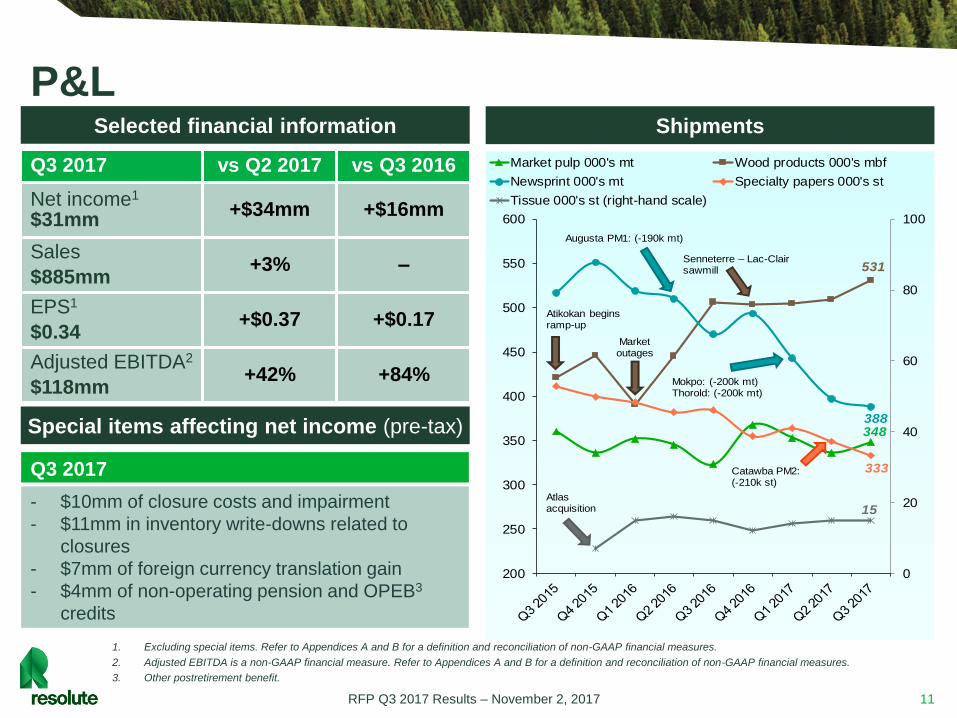
P&L
11
Selected financial information
Q3 2017 vs Q2 2017 vs Q3 2016
Net income1
$31mm+$34mm +$16mm
Sales
$885mm+3% –
EPS1
$0.34+$0.37 +$0.17
Adjusted EBITDA2
$118mm+42% +84%
Special items affecting net income (pre-tax)
Q3 2017
- $10mm of closure costs and impairment
- $11mm in inventory write-downs related to
closures
- $7mm of foreign currency translation gain
- $4mm of non-operating pension and OPEB3
credits
1. Excluding special items. Refer to Appendices A and B for a definition and reconciliation of non-GAAP financial measures.
2. Adjusted EBITDA is a non-GAAP financial measure. Refer to Appendices A and B for a definition and reconciliation of non-GAAP financial measures.
3. Other postretirement benefit.
Shipments
RFP Q3 2017 Results – November 2, 2017
348
531
388
333
15
0
20
40
60
80
100
200
250
300
350
400
450
500
550
600
Market pulp 000's mt Wood products 000's mbf
Newsprint 000's mt Specialty papers 000's st
Tissue 000's st (right-hand scale)
Atikokan beginsramp-up
Atlas acquisition
Augusta PM1: (-190k mt)
Market outages
Senneterre – Lac-Clair sawmill
Mokpo: (-200k mt)Thorold: (-200k mt)
Catawba PM2: (-210k st)
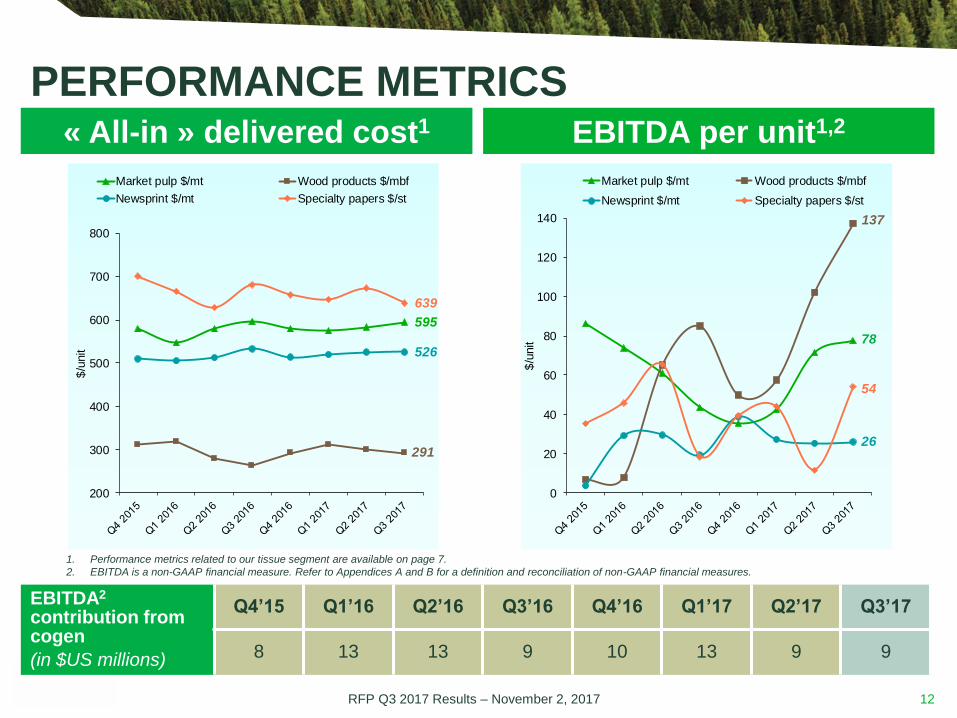
PERFORMANCE METRICS
12
« All-in » delivered cost1 EBITDA per unit1,2
595
291
526
639
200
300
400
500
600
700
800
$/u
nit
Market pulp $/mt Wood products $/mbf
Newsprint $/mt Specialty papers $/st
78
137
26
54
0
20
40
60
80
100
120
140
$/u
nit
Market pulp $/mt Wood products $/mbf
Newsprint $/mt Specialty papers $/st
EBITDA2
contribution from cogen
(in $US millions)
Q4’15 Q1’16 Q2’16 Q3’16 Q4’16 Q1’17 Q2’17 Q3’17
8 13 13 9 10 13 9 9
1. Performance metrics related to our tissue segment are available on page 7.
2. EBITDA is a non-GAAP financial measure. Refer to Appendices A and B for a definition and reconciliation of non-GAAP financial measures.
RFP Q3 2017 Results – November 2, 2017
LIQUIDITY AND CASH FLOW
13
(US$mm) Q3 2017vs
Q2 2017vs
Q3 2016
Cash 38 -6 -17
Working capital 608 +28 +30
Total debt 832 -8 +105
Interest 13 +1 +3
Available liquidity(US$mm)
2017 2016 2015
Q3 Q2 Q1 Q4 Q3 Q2 Q1 Q4
Total debt 832 840 881 762 727 611 611 591
Cash on hand 38 44 39 35 55 40 37 58
Available under revolving credit facilities 362 370 341 433 465 412 406 444
• Q3 capex of $20mm ↓ $27mm
from Q2
• Q3 net cash provided by
operations of $39mm
• Repayments of $7mm under
revolving credit facilities in Q3
• Liquidity of $400mm
• Cumulative duty deposits of
$62mm
• Repayments of $30mm since the
end of Q3
RFP Q3 2017 Results – November 2, 2017
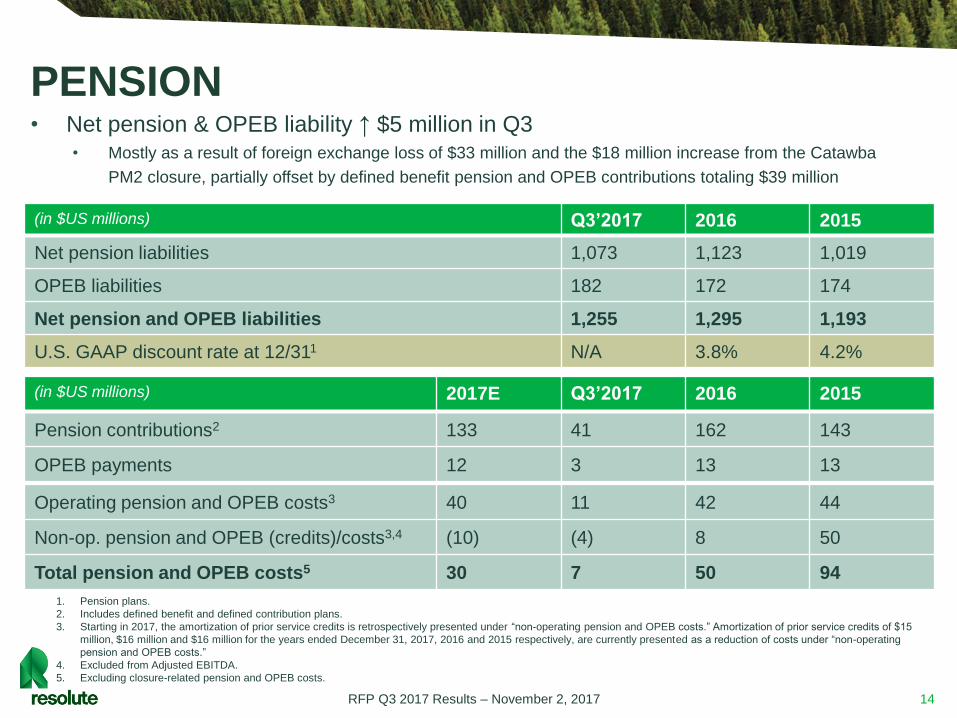
PENSION
14
(in $US millions) Q3’2017 2016 2015
Net pension liabilities 1,073 1,123 1,019
OPEB liabilities 182 172 174
Net pension and OPEB liabilities 1,255 1,295 1,193
U.S. GAAP discount rate at 12/311 N/A 3.8% 4.2%
• Net pension & OPEB liability ↑ $5 million in Q3
• Mostly as a result of foreign exchange loss of $33 million and the $18 million increase from the Catawba
PM2 closure, partially offset by defined benefit pension and OPEB contributions totaling $39 million
(in $US millions) 2017E Q3’2017 2016 2015
Pension contributions2 133 41 162 143
OPEB payments 12 3 13 13
Operating pension and OPEB costs3 40 11 42 44
Non-op. pension and OPEB (credits)/costs3,4 (10) (4) 8 50
Total pension and OPEB costs5 30 7 50 94
1. Pension plans.
2. Includes defined benefit and defined contribution plans.
3. Starting in 2017, the amortization of prior service credits is retrospectively presented under “non-operating pension and OPEB costs.” Amortization of prior service credits of $15
million, $16 million and $16 million for the years ended December 31, 2017, 2016 and 2015 respectively, are currently presented as a reduction of costs under “non-operating
pension and OPEB costs.”
4. Excluded from Adjusted EBITDA.
5. Excluding closure-related pension and OPEB costs.
RFP Q3 2017 Results – November 2, 2017
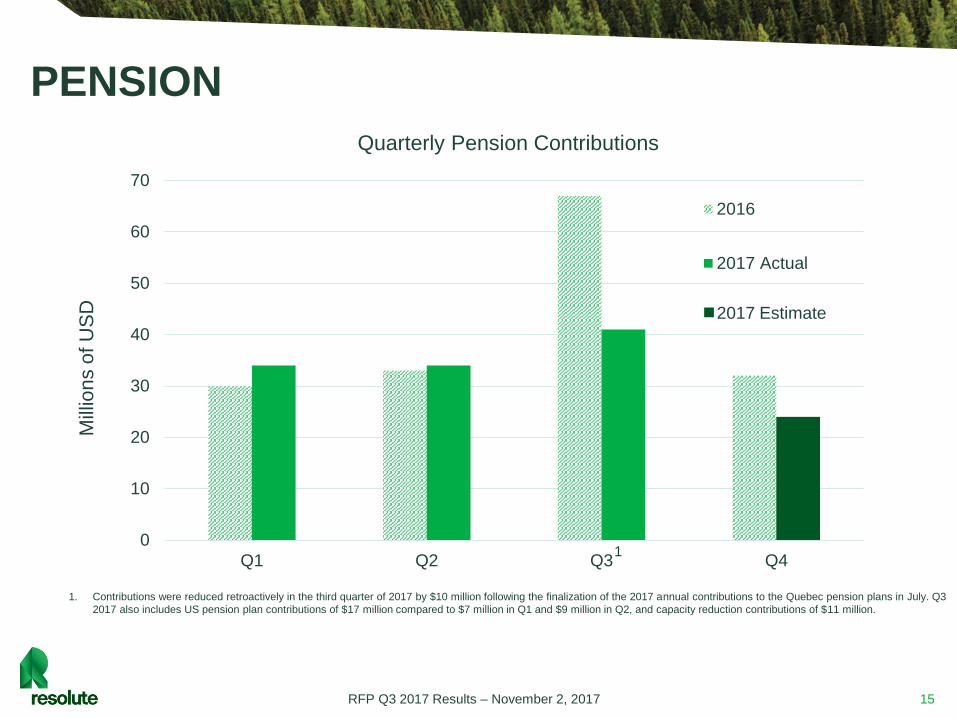
15
PENSION
1. Contributions were reduced retroactively in the third quarter of 2017 by $10 million following the finalization of the 2017 annual contributions to the Quebec pension plans in July. Q3
2017 also includes US pension plan contributions of $17 million compared to $7 million in Q1 and $9 million in Q2, and capacity reduction contributions of $11 million.
0
10
20
30
40
50
60
70
Q1 Q2 Q3 Q4
Mill
ion
s o
f U
SD
2016
2017 Actual
2017 Estimate
Quarterly Pension Contributions
1
RFP Q3 2017 Results – November 2, 2017
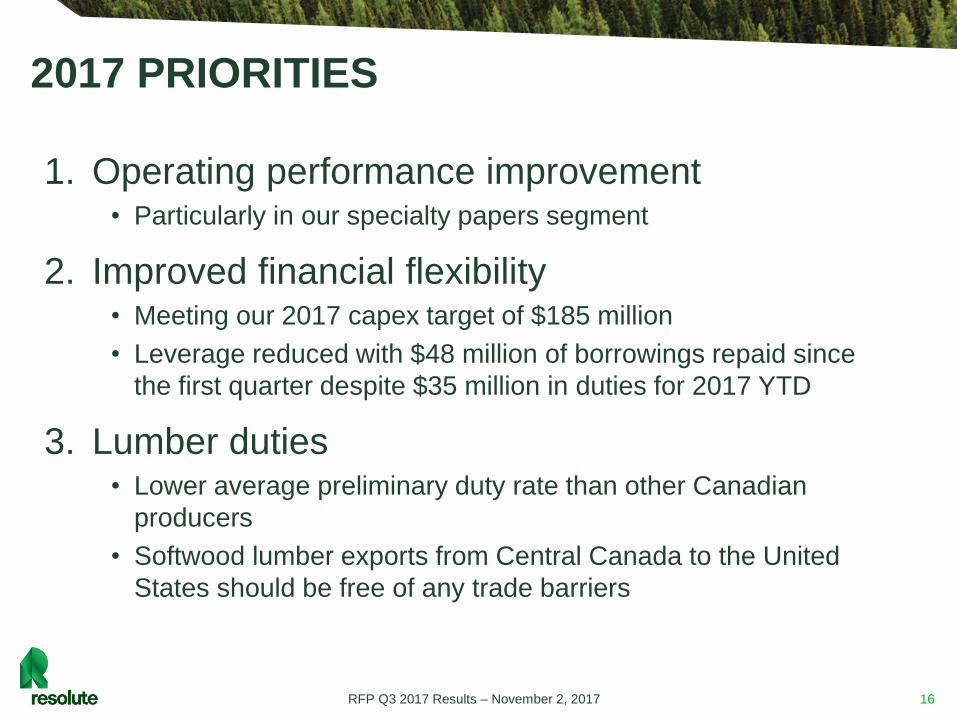
1. Operating performance improvement• Particularly in our specialty papers segment
2. Improved financial flexibility• Meeting our 2017 capex target of $185 million
• Leverage reduced with $48 million of borrowings repaid since
the first quarter despite $35 million in duties for 2017 YTD
3. Lumber duties• Lower average preliminary duty rate than other Canadian
producers
• Softwood lumber exports from Central Canada to the United
States should be free of any trade barriers
2017 PRIORITIES
16RFP Q3 2017 Results – November 2, 2017
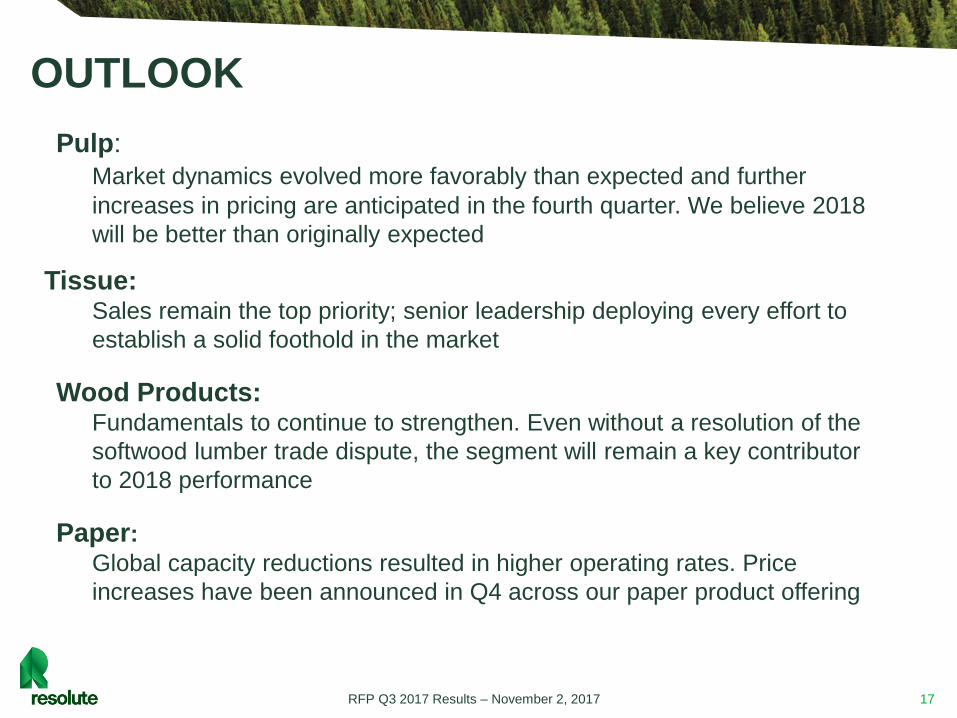
Pulp:
Market dynamics evolved more favorably than expected and further
increases in pricing are anticipated in the fourth quarter. We believe 2018
will be better than originally expected
Tissue: Sales remain the top priority; senior leadership deploying every effort to
establish a solid foothold in the market
Wood Products: Fundamentals to continue to strengthen. Even without a resolution of the
softwood lumber trade dispute, the segment will remain a key contributor
to 2018 performance
Paper:
Global capacity reductions resulted in higher operating rates. Price
increases have been announced in Q4 across our paper product offering
OUTLOOK
17RFP Q3 2017 Results – November 2, 2017

APPENDIX A

19
Three months ended September 30, 2017
(unaudited, in millions, except per share amounts) EPS
GAAP, as reported 48$ 24$ 0.26$
Adjustments for special items:
Foreign exchange gain - (7) (0.08)
Closure costs, impairment and other related charges 10 10 0.11
Inventory write-downs related to closures 11 11 0.12
Start-up costs 3 3 0.03
Net gain on disposition of assets (2) (2) (0.02)
Non-operating pension and OPEB credits (4) (4) (0.04)
Other expense, net - 1 0.01
Income tax effect of special items - (5) (0.05)
Adjusted for special items 66$ 31$ 0.34$
Three months ended September 30, 2016
(unaudited, in millions, except per share amounts) EPS
GAAP, as reported 10$ 14$ 0.15$
Adjustments for special items:
Start-up costs 1 1 0.01
Non-operating pension and OPEB costs 2 2 0.03
Other income, net - (1) (0.01)
Income tax effect of special items - (1) (0.01)
Adjusted for special items 13$ 15$ 0.17$
RESOLUTE FOREST PRODUCTS INC.
RECONCILIATION OF OPERATING INCOME AND NET INCOME ADJUSTED FOR SPECIAL ITEMS
Net income
(loss)
Operating
income (loss)
Operating
income (loss)
Net income
(loss)
A reconciliation of our operating income, net income and net income per share reported before special items is presented in the
tables below. See Note 1 to the Reconciliations of Non-GAAP Measures regarding our use of non-GAAP measures contained in our
November 2, 2017, press release available on our website.
RFP Q3 2017 Results – November 2, 2017
20RFP Q3 2017 Results – November 2, 2017
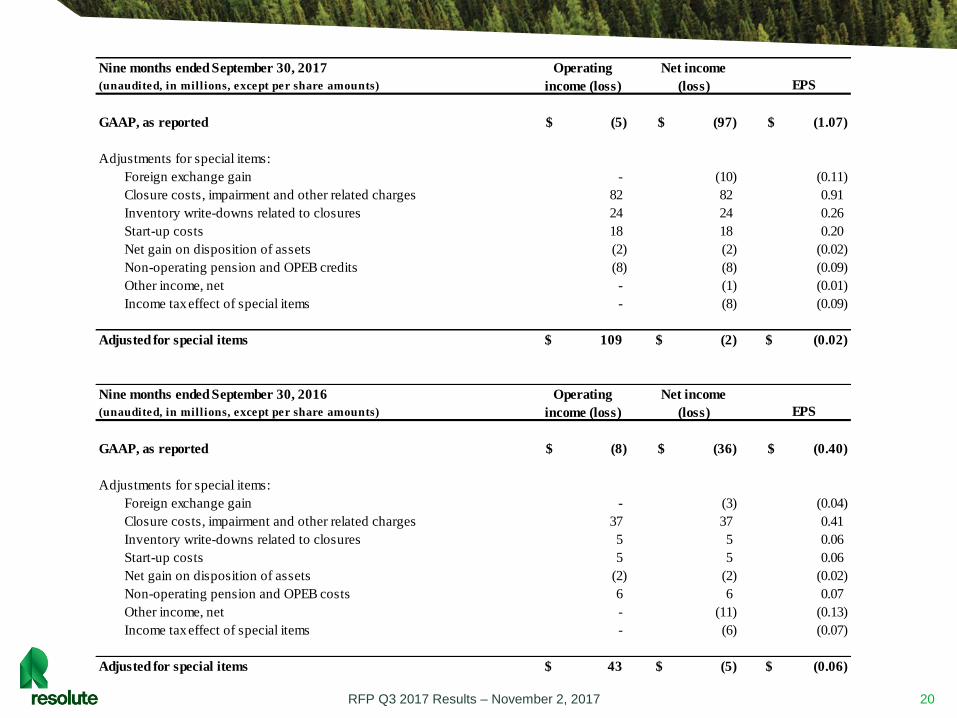
Nine months ended September 30, 2017
(unaudited, in millions, except per share amounts) EPS
GAAP, as reported (5)$ (97)$ (1.07)$
Adjustments for special items:
Foreign exchange gain - (10) (0.11)
Closure costs, impairment and other related charges 82 82 0.91
Inventory write-downs related to closures 24 24 0.26
Start-up costs 18 18 0.20
Net gain on disposition of assets (2) (2) (0.02)
Non-operating pension and OPEB credits (8) (8) (0.09)
Other income, net - (1) (0.01)
Income tax effect of special items - (8) (0.09)
Adjusted for special items 109$ (2)$ (0.02)$
Nine months ended September 30, 2016
(unaudited, in millions, except per share amounts) EPS
GAAP, as reported (8)$ (36)$ (0.40)$
Adjustments for special items:
Foreign exchange gain - (3) (0.04)
Closure costs, impairment and other related charges 37 37 0.41
Inventory write-downs related to closures 5 5 0.06
Start-up costs 5 5 0.06
Net gain on disposition of assets (2) (2) (0.02)
Non-operating pension and OPEB costs 6 6 0.07
Other income, net - (11) (0.13)
Income tax effect of special items - (6) (0.07)
Adjusted for special items 43$ (5)$ (0.06)$
Operating
income (loss)
Net income
(loss)
Operating
income (loss)
Net income
(loss)

21
Three months ended September 30, 2017
(unaudited, in millions) Market pulp Tissue Wood products Newsprint
Specialty
papers
Corporate and
other Total
Net income (loss) including noncontrolling interests 19$ (3)$ 64$ (6)$ 7$ (55)$ 26$
Interest expense 13 13
Income tax provision 15 15
Depreciation and amortization 8 2 9 16 11 6 52
EBITDA 27$ (1)$ 73$ 10$ 18$ (21)$ 106$
Foreign exchange gain (7) (7)
Closure costs, impairment and other related charges 10 10
Inventory write-downs related to closures 11 11
Start-up costs 3 3
Net gain on disposition of assets (2) (2)
Non-operating pension and OPEB credits (4) (4)
Other expense, net 1 1
Adjusted EBITDA 27$ (1)$ 73$ 10$ 18$ (9)$ 118$
Three months ended September 30, 2016
(unaudited, in millions) Market pulp Tissue Wood products Newsprint
Specialty
papers
Corporate and
other Total
Net income (loss) including noncontrolling interests 4$ (5)$ 36$ (8)$ (4)$ (8)$ 15$
Interest expense 10 10
Income tax benefit (14) (14)
Depreciation and amortization 10 2 7 17 11 4 51
EBITDA 14$ (3)$ 43$ 9$ 7$ (8)$ 62$
Start-up costs 1 1
Non-operating pension and OPEB costs 2 2
Other income, net (1) (1)
Adjusted EBITDA 14$ (3)$ 43$ 9$ 7$ (6)$ 64$
RESOLUTE FOREST PRODUCTS INC.
RECONCILIATION OF EBITDA AND ADJUSTED EBITDA
A reconciliation of our net income including noncontrolling interests to EBITDA and Adjusted EBITDA is presented in the tables below. See Note 1 to the Reconciliations of Non-GAAP
Measures regarding our use of the non-GAAP measures EBITDA and Adjusted EBITDA contained in our November 2, 2017, press release available on our website.
RFP Q3 2017 Results – November 2, 2017

22RFP Q3 2017 Results – November 2, 2017
Nine months ended September 30, 2017
(unaudited, in millions) Market pulp Tissue Wood products Newsprint
Specialty
papers
Corporate and
other Total
Net income (loss) including noncontrolling interests 42$ (4)$ 129$ (17)$ 4$ (247)$ (93)$
Interest expense 36 36
Income tax provision 63 63
Depreciation and amortization 24 4 25 49 34 17 153
EBITDA 66$ -$ 154$ 32$ 38$ (131)$ 159$
Foreign exchange gain (10) (10)
Closure costs, impairment and other related charges 82 82
Inventory write-downs related to closures 24 24
Start-up costs 18 18
Net gain on disposition of assets (2) (2)
Non-operating pension and OPEB credits (8) (8)
Other income, net (1) (1)
Adjusted EBITDA 66$ -$ 154$ 32$ 38$ (28)$ 262$
Nine months ended September 30, 2016
(unaudited, in millions) Market pulp Tissue Wood products Newsprint
Specialty
papers
Corporate and
other Total
Net income (loss) including noncontrolling interests 33$ (11)$ 52$ (17)$ 16$ (105)$ (32)$
Interest expense 29 29
Income tax provision 9 9
Depreciation and amortization 28 6 23 56 34 10 157
EBITDA 61$ (5)$ 75$ 39$ 50$ (57)$ 163$
Foreign exchange gain (3) (3)
Closure costs, impairment and other related charges 37 37
Inventory write-downs related to closures 5 5
Start-up costs 5 5
Net gain on disposition of assets (2) (2)
Non-operating pension and OPEB costs 6 6
Other income, net (11) (11)
Adjusted EBITDA 61$ (5)$ 75$ 39$ 50$ (20)$ 200$

APPENDIX B
24
Resolute Forest Products Inc.
Financial and Operating Statistics (Page 1 of 5)
Variance
(in millions, except per share amounts and otherw ise indicated) First Second Third Fourth Total First Second Third Fourth Total checks
Income Statement Data
Sales 877$ 891$ 888$ 889$ 3,545$ 872$ 858$ 885$ 2,615$
Operating income (loss) - (18) 10 (18) (26) (6) (47) 48 (5)
Interest expense (10) (9) (10) (9) (38) (11) (12) (13) (36)
Other income (expense), net 13 - 1 (7) 7 - 5 6 11
Net income (loss) including noncontrolling interests (7) (40) 15 (44) (76) (46) (73) 26 (93)
Net income (loss) attributable to noncontrolling interests 1 2 1 1 5 1 1 2 4
Net income (loss) attributable to Resolute Forest Products Inc. (8) (42) 14 (45) (81) (47) (74) 24 (97)
Diluted net income (loss) per share attributable to Resolute Forest Products Inc. common shareholders (0.09)$ (0.47)$ 0.15$ (0.50)$ (0.90)$ (0.52)$ (0.82)$ 0.26$ (1.07)$
Dividends declared per common share -$ -$ -$ -$ -$ -$ -$ -$ -$
Average diluted shares outstanding (in thousands) 89,610 89,818 90,392 90,068 89,882 90,195 90,344 91,639 90,390
Ending shares outstanding (in thousands) 89,493 89,505 89,507 89,751 89,751 89,751 89,751 89,798 89,798
Financial Position
Cash and cash equivalents 37$ 40$ 55$ 35$ 35$ 39$ 44$ 38$ 38$
Working capital (2) 620 573 578 580 580 630 580 608 608
Fixed assets, net 1,811 1,801 1,839 1,842 1,842 1,866 1,779 1,737 1,737
Total assets 4,289 4,245 4,312 4,277 4,277 4,335 4,171 4,232 4,232
Current portion of long-term debt 1 1 1 1 1 1 1 - -
Long-term debt, net of current portion 610 610 726 761 761 880 839 832 832
Net debt (3) 574 571 672 727 727 842 796 794 794
Liquidity (4) 443 452 520 468 468 380 414 414 414
Total Resolute Forest Products Inc. shareholders' equity 1,932 1,899 1,919 1,693 1,693 1,655 1,590 1,607 1,607
Noncontrolling interests 14 16 17 18 18 19 20 22 22
Total equity 1,946 1,915 1,936 1,711 1,711 1,674 1,610 1,629 1,629
Cash Flow Information
Cash flows provided by (used in) operations 6$ 63$ (18)$ 30$ 81$ (39)$ 99$ 39$ 99$
Cash invested in fixed assets (47) (52) (78) (72) (249) (69) (47) (20) (136)
Dispositions of assets 5 - - - 5 - - 3 3
Decrease (increase) in countervailing duty cash deposits on supercalendered paper (6) (6) (5) (6) (23) (5) (7) (5) (17)
Decrease (increase) in countervailing duty cash deposits on softwood lumber - - - - - - (4) (14) (18)
Cash flows provided by (used in) investing activities (48) (59) (82) (84) (273) (75) (54) (39) (168)
Issuance of long-term debt - - 46 - 46 - - - -
Net borrowings under revolving credit facilities 20 - 70 35 125 118 (41) (7) 70
Cash flows provided by (used in) financing activities 20 (1) 115 35 169 118 (41) (8) 69
2016 (1) 2017 (1)
RFP Q3 2017 Results – November 2, 2017
25
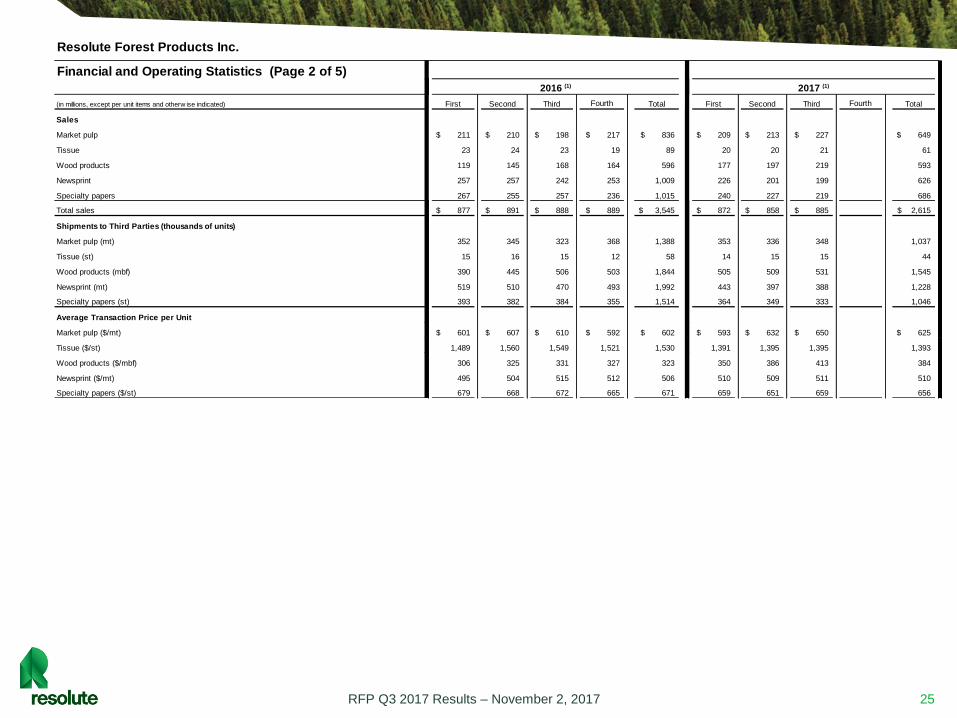
Resolute Forest Products Inc.
Financial and Operating Statistics (Page 2 of 5)
(in millions, except per unit items and otherw ise indicated) First Second Third Fourth Total First Second Third Fourth Total
Sales
Market pulp 211$ 210$ 198$ 217$ 836$ 209$ 213$ 227$ 649$
Tissue 23 24 23 19 89 20 20 21 61
Wood products 119 145 168 164 596 177 197 219 593
Newsprint 257 257 242 253 1,009 226 201 199 626
Specialty papers 267 255 257 236 1,015 240 227 219 686
Total sales 877$ 891$ 888$ 889$ 3,545$ 872$ 858$ 885$ 2,615$
Shipments to Third Parties (thousands of units)
Market pulp (mt) 352 345 323 368 1,388 353 336 348 1,037
Tissue (st) 15 16 15 12 58 14 15 15 44
Wood products (mbf) 390 445 506 503 1,844 505 509 531 1,545
Newsprint (mt) 519 510 470 493 1,992 443 397 388 1,228
Specialty papers (st) 393 382 384 355 1,514 364 349 333 1,046
Average Transaction Price per Unit
Market pulp ($/mt) 601$ 607$ 610$ 592$ 602$ 593$ 632$ 650$ 625$
Tissue ($/st) 1,489 1,560 1,549 1,521 1,530 1,391 1,395 1,395 1,393
Wood products ($/mbf) 306 325 331 327 323 350 386 413 384
Newsprint ($/mt) 495 504 515 512 506 510 509 511 510
Specialty papers ($/st) 679 668 672 665 671 659 651 659 656
2017 (1)2016 (1)
RFP Q3 2017 Results – November 2, 2017
26
Resolute Forest Products Inc.
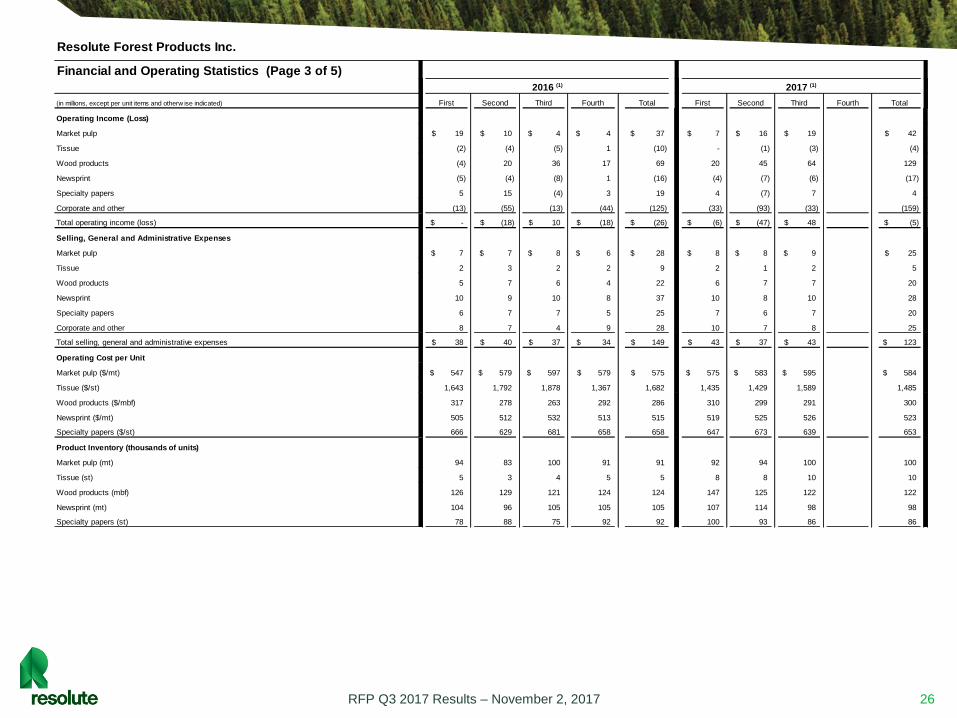
Financial and Operating Statistics (Page 3 of 5)
(in millions, except per unit items and otherw ise indicated) First Second Third Fourth Total First Second Third Fourth Total
Operating Income (Loss)
Market pulp 19$ 10$ 4$ 4$ 37$ 7$ 16$ 19$ 42$
Tissue (2) (4) (5) 1 (10) - (1) (3) (4)
Wood products (4) 20 36 17 69 20 45 64 129
Newsprint (5) (4) (8) 1 (16) (4) (7) (6) (17)
Specialty papers 5 15 (4) 3 19 4 (7) 7 4
Corporate and other (13) (55) (13) (44) (125) (33) (93) (33) (159)
Total operating income (loss) -$ (18)$ 10$ (18)$ (26)$ (6)$ (47)$ 48$ (5)$
Selling, General and Administrative Expenses
Market pulp 7$ 7$ 8$ 6$ 28$ 8$ 8$ 9$ 25$
Tissue 2 3 2 2 9 2 1 2 5
Wood products 5 7 6 4 22 6 7 7 20
Newsprint 10 9 10 8 37 10 8 10 28
Specialty papers 6 7 7 5 25 7 6 7 20
Corporate and other 8 7 4 9 28 10 7 8 25
Total selling, general and administrative expenses 38$ 40$ 37$ 34$ 149$ 43$ 37$ 43$ 123$
Operating Cost per Unit
Market pulp ($/mt) 547$ 579$ 597$ 579$ 575$ 575$ 583$ 595$ 584$
Tissue ($/st) 1,643 1,792 1,878 1,367 1,682 1,435 1,429 1,589 1,485
Wood products ($/mbf) 317 278 263 292 286 310 299 291 300
Newsprint ($/mt) 505 512 532 513 515 519 525 526 523
Specialty papers ($/st) 666 629 681 658 658 647 673 639 653
Product Inventory (thousands of units)
Market pulp (mt) 94 83 100 91 91 92 94 100 100
Tissue (st) 5 3 4 5 5 8 8 10 10
Wood products (mbf) 126 129 121 124 124 147 125 122 122
Newsprint (mt) 104 96 105 105 105 107 114 98 98
Specialty papers (st) 78 88 75 92 92 100 93 86 86
2016 (1) 2017 (1)
RFP Q3 2017 Results – November 2, 2017
27
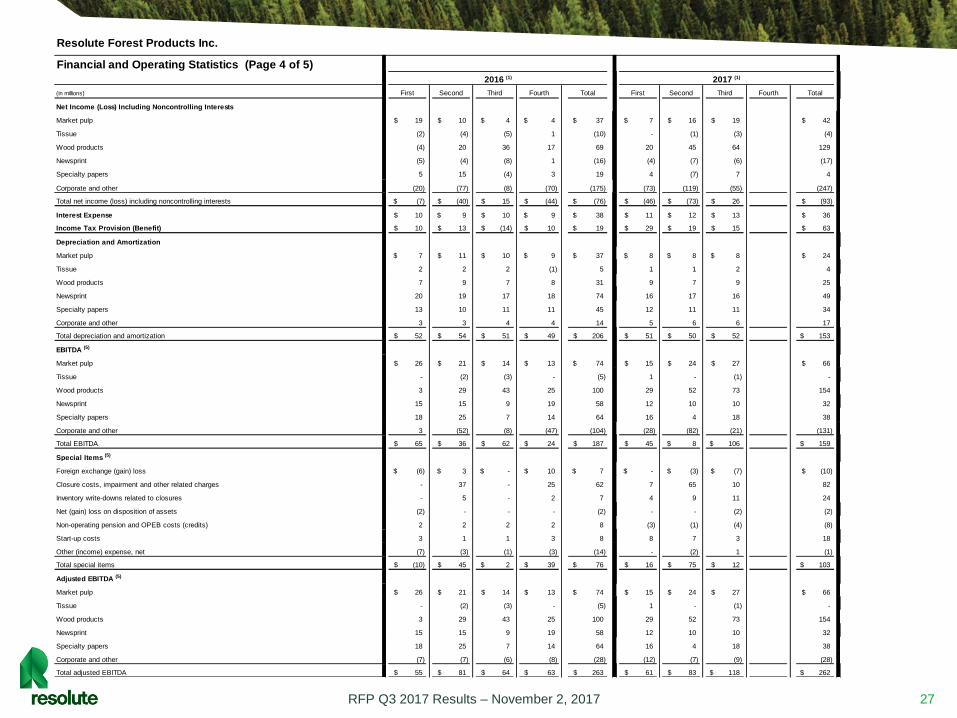
Resolute Forest Products Inc.
Financial and Operating Statistics (Page 4 of 5)
(in millions) First Second Third Fourth Total First Second Third Fourth Total
Net Income (Loss) Including Noncontrolling Interests
Market pulp 19$ 10$ 4$ 4$ 37$ 7$ 16$ 19$ 42$
Tissue (2) (4) (5) 1 (10) - (1) (3) (4)
Wood products (4) 20 36 17 69 20 45 64 129
Newsprint (5) (4) (8) 1 (16) (4) (7) (6) (17)
Specialty papers 5 15 (4) 3 19 4 (7) 7 4
Corporate and other (20) (77) (8) (70) (175) (73) (119) (55) (247)
Total net income (loss) including noncontrolling interests (7)$ (40)$ 15$ (44)$ (76)$ (46)$ (73)$ 26$ (93)$
Interest Expense 10$ 9$ 10$ 9$ 38$ 11$ 12$ 13$ 36$
Income Tax Provision (Benefit) 10$ 13$ (14)$ 10$ 19$ 29$ 19$ 15$ 63$
Depreciation and Amortization
Market pulp 7$ 11$ 10$ 9$ 37$ 8$ 8$ 8$ 24$
Tissue 2 2 2 (1) 5 1 1 2 4
Wood products 7 9 7 8 31 9 7 9 25
Newsprint 20 19 17 18 74 16 17 16 49
Specialty papers 13 10 11 11 45 12 11 11 34
Corporate and other 3 3 4 4 14 5 6 6 17
Total depreciation and amortization 52$ 54$ 51$ 49$ 206$ 51$ 50$ 52$ 153$
EBITDA (5)
Market pulp 26$ 21$ 14$ 13$ 74$ 15$ 24$ 27$ 66$
Tissue - (2) (3) - (5) 1 - (1) -
Wood products 3 29 43 25 100 29 52 73 154
Newsprint 15 15 9 19 58 12 10 10 32
Specialty papers 18 25 7 14 64 16 4 18 38
Corporate and other 3 (52) (8) (47) (104) (28) (82) (21) (131)
Total EBITDA 65$ 36$ 62$ 24$ 187$ 45$ 8$ 106$ 159$
Special Items (5)
Foreign exchange (gain) loss (6)$ 3$ -$ 10$ 7$ -$ (3)$ (7)$ (10)$
Closure costs, impairment and other related charges - 37 - 25 62 7 65 10 82
Inventory write-downs related to closures - 5 - 2 7 4 9 11 24
Net (gain) loss on disposition of assets (2) - - - (2) - - (2) (2)
Non-operating pension and OPEB costs (credits) 2 2 2 2 8 (3) (1) (4) (8)
Start-up costs 3 1 1 3 8 8 7 3 18
Other (income) expense, net (7) (3) (1) (3) (14) - (2) 1 (1)
Total special items (10)$ 45$ 2$ 39$ 76$ 16$ 75$ 12$ 103$
Adjusted EBITDA (5)
Market pulp 26$ 21$ 14$ 13$ 74$ 15$ 24$ 27$ 66$
Tissue - (2) (3) - (5) 1 - (1) -
Wood products 3 29 43 25 100 29 52 73 154
Newsprint 15 15 9 19 58 12 10 10 32
Specialty papers 18 25 7 14 64 16 4 18 38
Corporate and other (7) (7) (6) (8) (28) (12) (7) (9) (28)
Total adjusted EBITDA 55$ 81$ 64$ 63$ 263$ 61$ 83$ 118$ 262$
2017 (1)2016 (1)
RFP Q3 2017 Results – November 2, 2017
28
Resolute Forest Products Inc.
Financial and Operating Statistics (Page 5 of 5)
Notes
5 EBITDA by reportable segment is calculated as net income (loss) including noncontrolling interests from the consolidated statements of operations, allocated to each of our reportable segments (market pulp, tissue, wood products, newsprint and
specialty papers) in accordance with FASB ASC 290, “Segment Reporting,” adjusted for depreciation and amortization. EBITDA for corporate and other is calculated as net income (loss) including noncontrolling interests from the consolidated
statements of operations, after the allocation to reportable segments, adjusted for interest expense, income taxes, and depreciation and amortization.
Adjusted EBITDA means EBITDA, excluding special items, such as foreign exchange gains and losses, closure costs, impairment and other related charges, inventory write-downs related to closures, start-up costs, gains and losses on disposition of
assets, non-operating pension and OPEB costs and credits and other charges or credits. Special items are allocated to corporate and other.
1 In the first quarter of 2017, we changed our presentation of segment operating income to reallocate the amortization of prior service credits component of pension and other postretirement benefit (or “OPEB”) costs from the reportable segments to
corporate and other. Current service costs will continue to be allocated to the reportable segments. We now also treat the amortization of prior service credits component of pension and OPEB costs as a special item to be adjusted for purposes of
establishing our non-GAAP performance measures, listed below, together with our non-operating pension and OPEB costs and credits. This approach is consistent with the indicators management uses internally to evaluate performance. Prior period
amounts have been reclassified to conform to the 2017 presentation.
2 We define working capital as current assets less current liabilities excluding cash and cash equivalents and debt.
3 We define net debt as total debt less cash and cash equivalents.
4 We define liquidity as cash and cash equivalents and availability under our credit facilities.
We believe that using these non-GAAP measures is useful because they are consistent with the indicators management uses internally to measure the Company’s performance, and it allows the reader to more easily compare our ongoing operations
and financial performance from period to period. EBITDA and adjusted EBITDA are internal measures, and therefore may not be comparable to those of other companies. These non-GAAP measures should not be viewed as substitutes to financial
measures determined under GAAP in our consolidated statements of operations in our filings with the SEC.
RFP Q3 2017 Results – November 2, 2017

RESOLUTE FOREST
PRODUCTS
Q3 2017 RESULTSRICHARD GARNEAU, PRESIDENT & CEO
JO-ANN LONGWORTH, SVP & CFO
November 2, 2017