Embed Size (px)
Citation preview
Q2FY21 Result Update Presentation
Saturday, 7th November 2020
Safe Harbor
2
This presentation and the accompanying slides (the “Presentation”), which have been prepared by Shaily Engineering Plastics Limited
(the “Company”), have been prepared solely for information purposes and do not constitute any offer, recommendation or invitation to
purchase or subscribe for any securities, and shall not form the basis or be relied on in connection with any contract or binding commitment
whatsoever. No offering of securities of the Company will be made except by means of a statutory offering document containing detailed
information about the Company.
This Presentation has been prepared by the Company based on information and data which the Company considers reliable, but the
Company makes no representation or warranty, express or implied, whatsoever, and no reliance shall be placed on, the truth, accuracy,
completeness, fairness and reasonableness of the contents of this Presentation. This Presentation may not be all inclusive and may not
contain all of the information that you may consider material. Any liability in respect of the contents of, or any omission from, this Presentation
is expressly excluded.
Certain matters discussed in this Presentation may contain statements regarding the Company’s market opportunity and business prospects
that are individually and collectively forward-looking statements. Such forward-looking statements are not guarantees of future performance
and are subject to known and unknown risks, uncertainties and assumptions that are difficult to predict. These risks and uncertainties
include, but are not limited to, the performance of the Indian economy and of the economies of various international markets, the
performance of the industry in India and world-wide, competition, the company’s ability to successfully implement its strategy, the Company’s
future levels of growth and expansion, technological implementation, changes and advancements, changes in revenue, income or cash
flows, the Company’s market preferences and its exposure to market risks, as well as other risks. The Company’s actual results, levels of
activity, performance or achievements could differ materially and adversely from results expressed in or implied by this Presentation. The
Company assumes no obligation to update any forward-looking information contained in this Presentation. Any forward-looking statements
and projections made by third parties included in this Presentation are not adopted by the Company and the Company is not responsible for
such third party statements and projections.
Our Performance
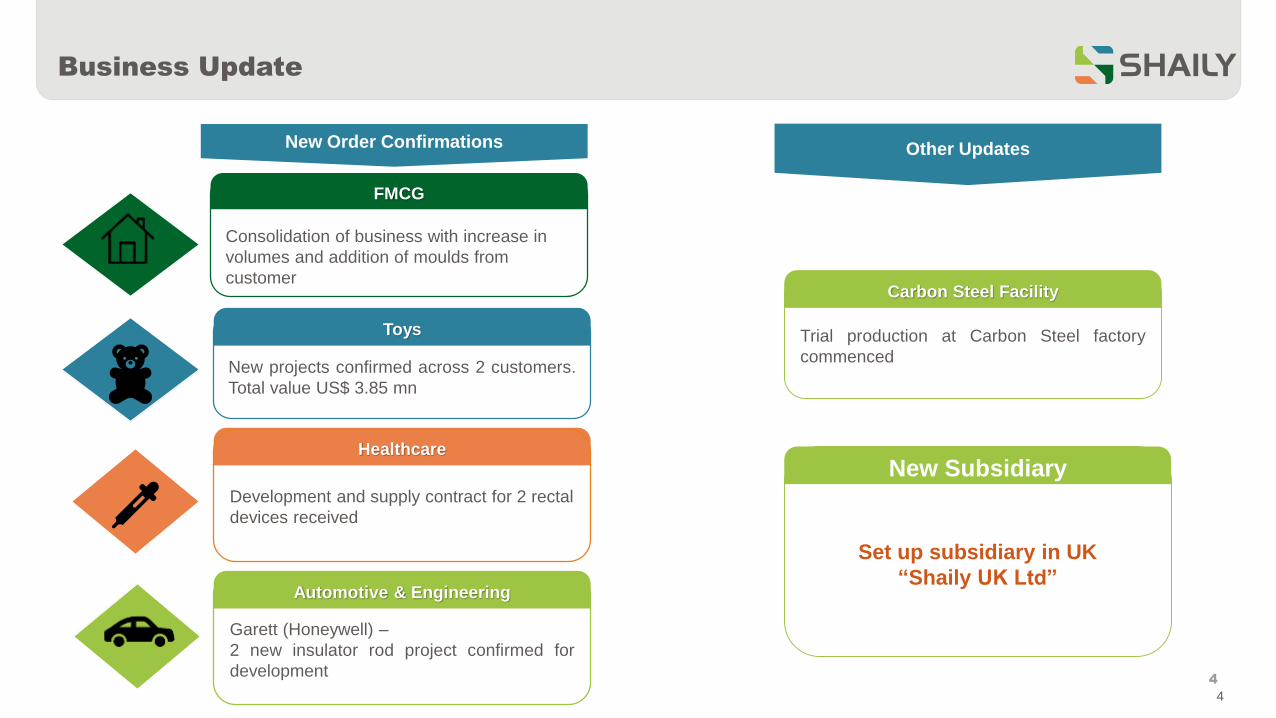
Business Update
4
Trial production at Carbon Steel factory
commenced
Healthcare
Development and supply contract for 2 rectal
devices received
New projects confirmed across 2 customers.
Total value US$ 3.85 mn
Consolidation of business with increase in
volumes and addition of moulds from
customer
FMCG
Toys
Carbon Steel Facility
Set up subsidiary in UK
“Shaily UK Ltd”
New Subsidiary
New Order Confirmations Other Updates
Automotive & Engineering
Garett (Honeywell) –
2 new insulator rod project confirmed for
development
4
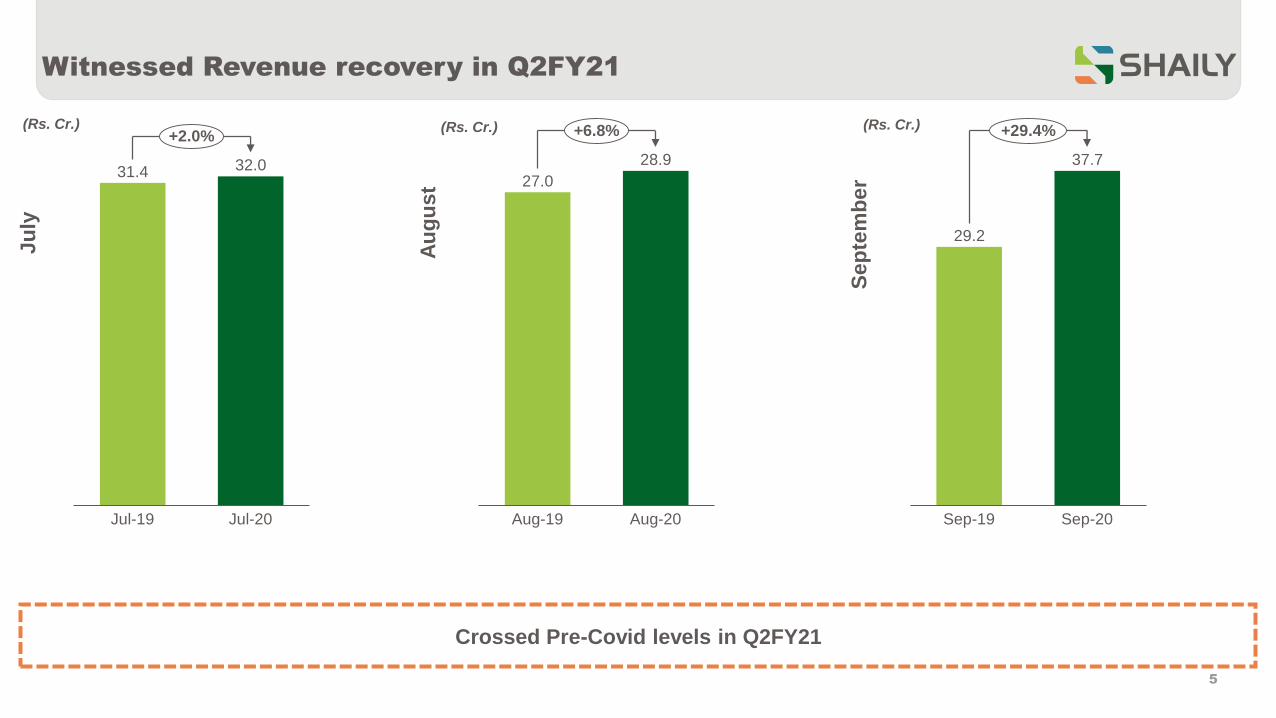
Witnessed Revenue recovery in Q2FY21
5
31.4 32.0
Jul-19 Jul-20
+2.0%
Apri
lJu
ly
Au
gu
st
Sep
tem
ber27.0
28.9
Aug-19 Aug-20
+6.8%
29.2
37.7
Sep-19 Sep-20
+29.4%(Rs. Cr.) (Rs. Cr.) (Rs. Cr.)
Crossed Pre-Covid levels in Q2FY21
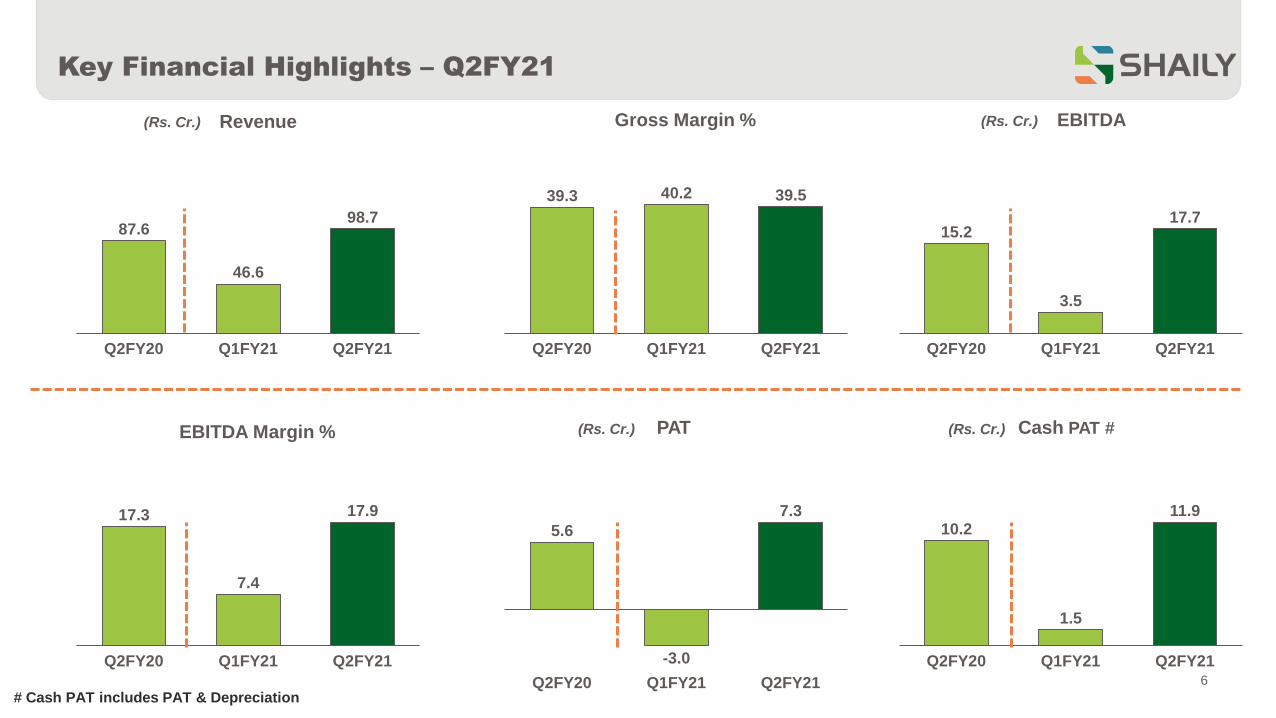
Revenue Gross Margin % EBITDA
EBITDA Margin %
(Rs. Cr.)
PAT Cash PAT #
# Cash PAT includes PAT & Depreciation
39.3 40.2 39.5
Q2FY20 Q1FY21 Q2FY21
15.2
3.5
17.7
Q2FY20 Q1FY21 Q2FY21
17.3
7.4
17.9
Q2FY20 Q1FY21 Q2FY21
5.6
-3.0
7.3
Q2FY21Q2FY20 Q1FY21
10.2
1.5
11.9
Q2FY20 Q2FY21Q1FY216
87.6
46.6
98.7
Q2FY20 Q1FY21 Q2FY21
Key Financial Highlights – Q2FY21
(Rs. Cr.)
(Rs. Cr.) (Rs. Cr.)
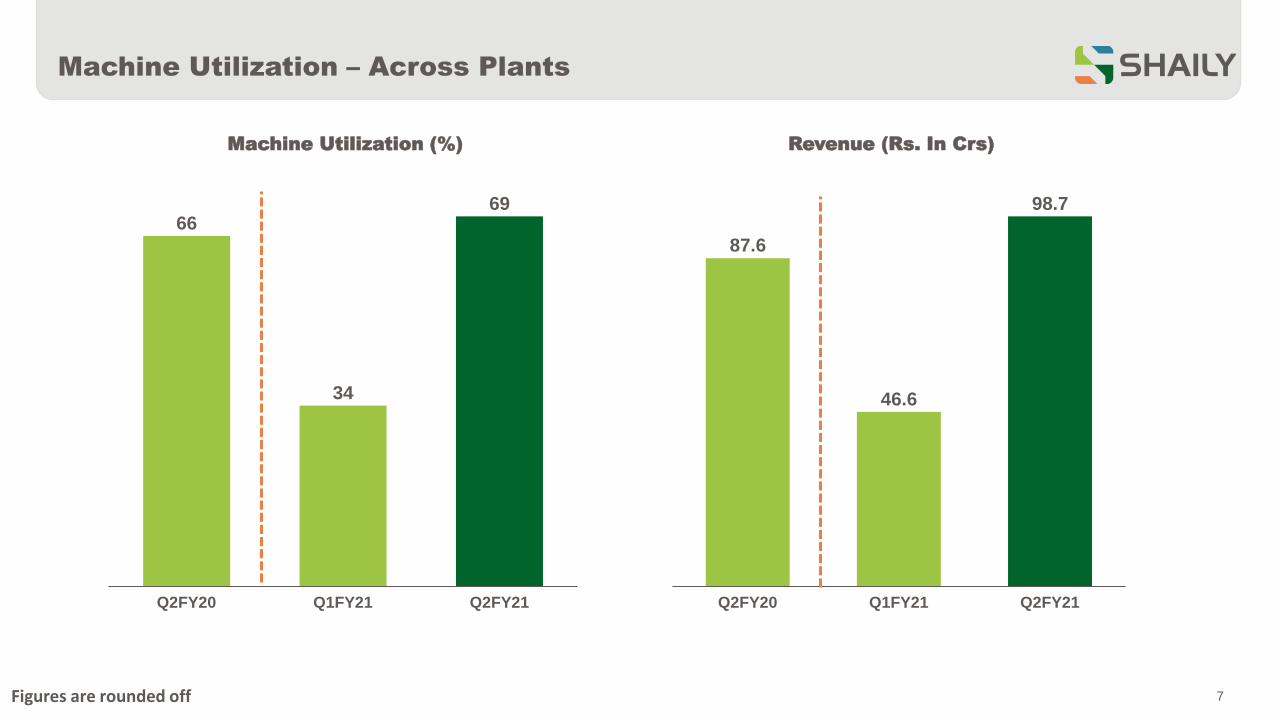
Revenue (Rs. In Crs)Machine Utilization (%)
66
34
69
Q1FY21Q2FY20 Q2FY21
87.6
46.6
98.7
Q2FY20 Q1FY21 Q2FY21
7Figures are rounded off
Machine Utilization – Across Plants
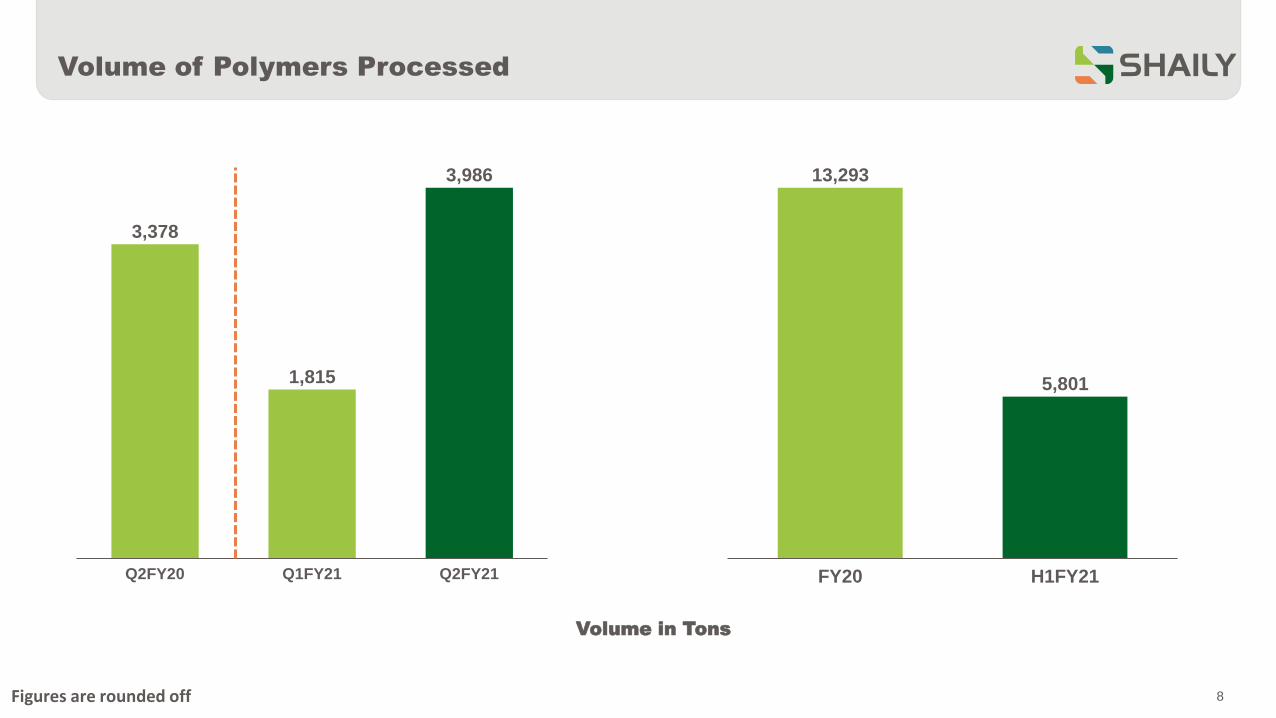
8Figures are rounded off
Volume of Polymers Processed
3,378
1,815
3,986
Q2FY20 Q1FY21 Q2FY21
13,293
5,801
H1FY21FY20
Volume in Tons
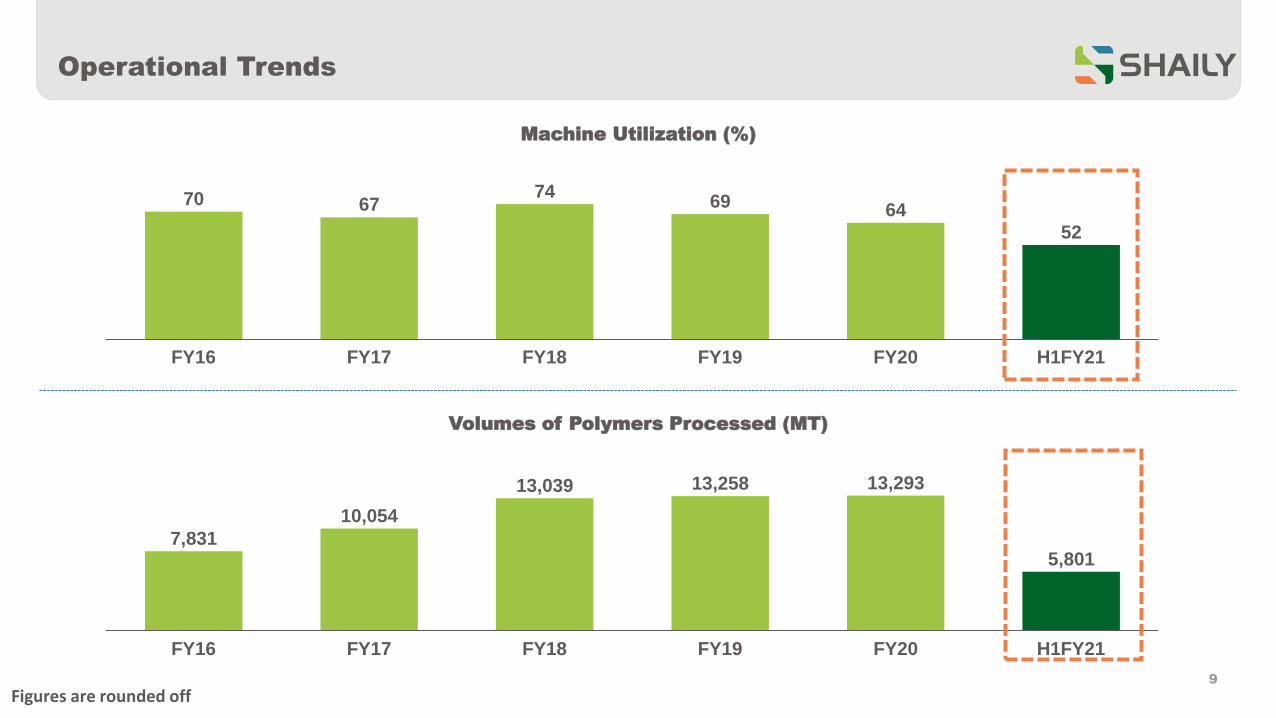
Operational Trends
9
70 6774
69 64
52
H1FY21FY16 FY17 FY20FY18 FY19
Figures are rounded off
Machine Utilization (%)
Volumes of Polymers Processed (MT)
7,831
10,054
13,039 13,258 13,293
5,801
H1FY21FY17FY16 FY18 FY19 FY20
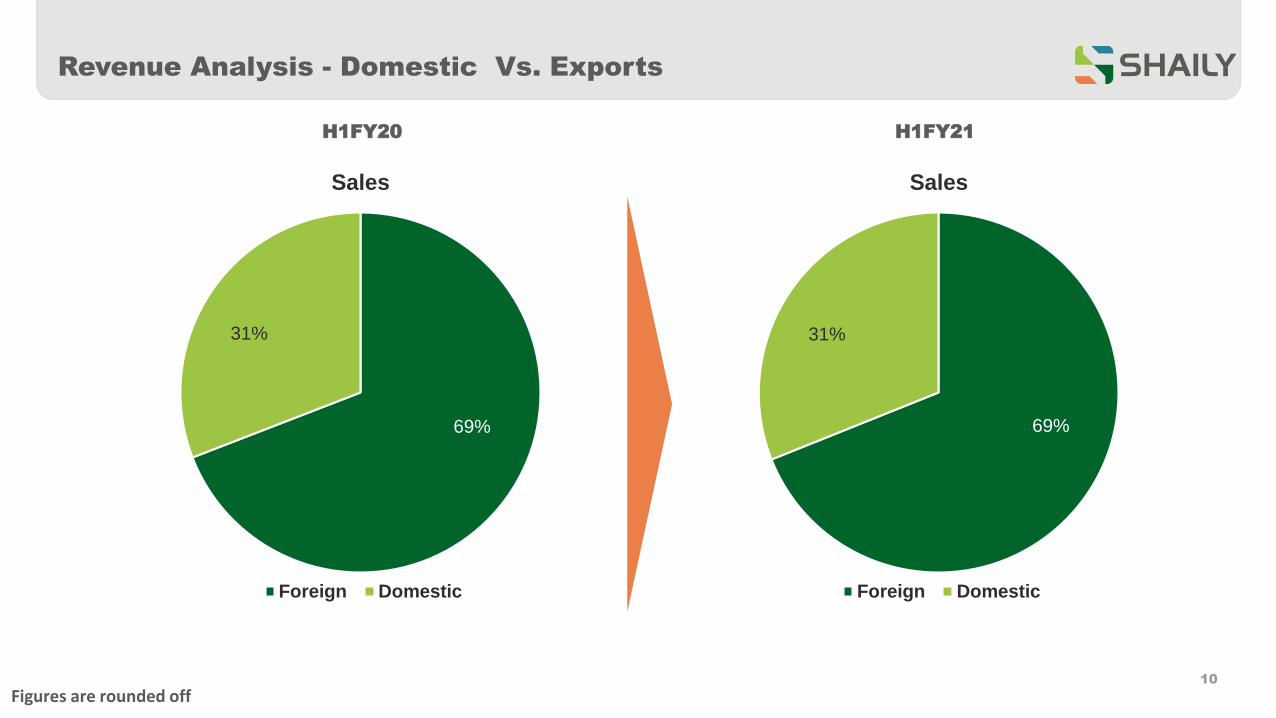
Revenue Analysis - Domestic Vs. Exports
10
H1FY20 H1FY21
69%
31%
Sales
Foreign Domestic
Figures are rounded off
69%
31%
Sales
Foreign Domestic
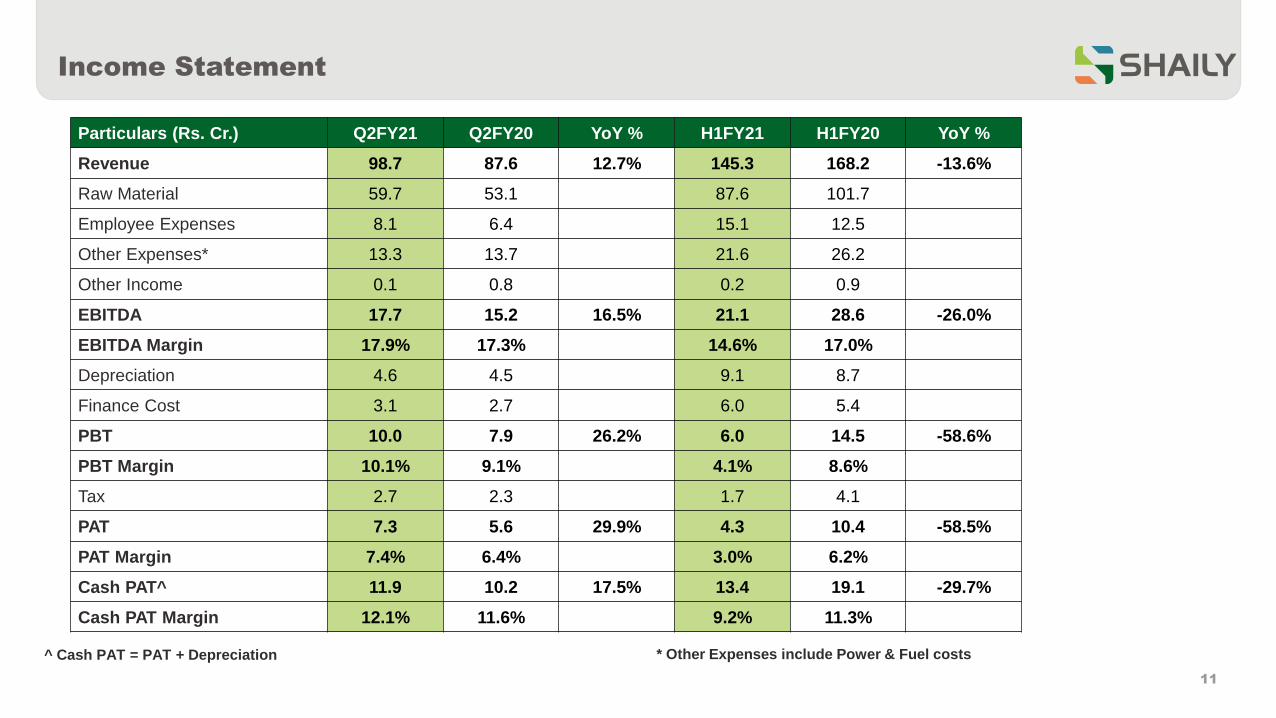
Income Statement
11
* Other Expenses include Power & Fuel costs^ Cash PAT = PAT + Depreciation
Particulars (Rs. Cr.) Q2FY21 Q2FY20 YoY % H1FY21 H1FY20 YoY %
Revenue 98.7 87.6 12.7% 145.3 168.2 -13.6%
Raw Material 59.7 53.1 87.6 101.7
Employee Expenses 8.1 6.4 15.1 12.5
Other Expenses* 13.3 13.7 21.6 26.2
Other Income 0.1 0.8 0.2 0.9
EBITDA 17.7 15.2 16.5% 21.1 28.6 -26.0%
EBITDA Margin 17.9% 17.3% 14.6% 17.0%
Depreciation 4.6 4.5 9.1 8.7
Finance Cost 3.1 2.7 6.0 5.4
PBT 10.0 7.9 26.2% 6.0 14.5 -58.6%
PBT Margin 10.1% 9.1% 4.1% 8.6%
Tax 2.7 2.3 1.7 4.1
PAT 7.3 5.6 29.9% 4.3 10.4 -58.5%
PAT Margin 7.4% 6.4% 3.0% 6.2%
Cash PAT^ 11.9 10.2 17.5% 13.4 19.1 -29.7%
Cash PAT Margin 12.1% 11.6% 9.2% 11.3%
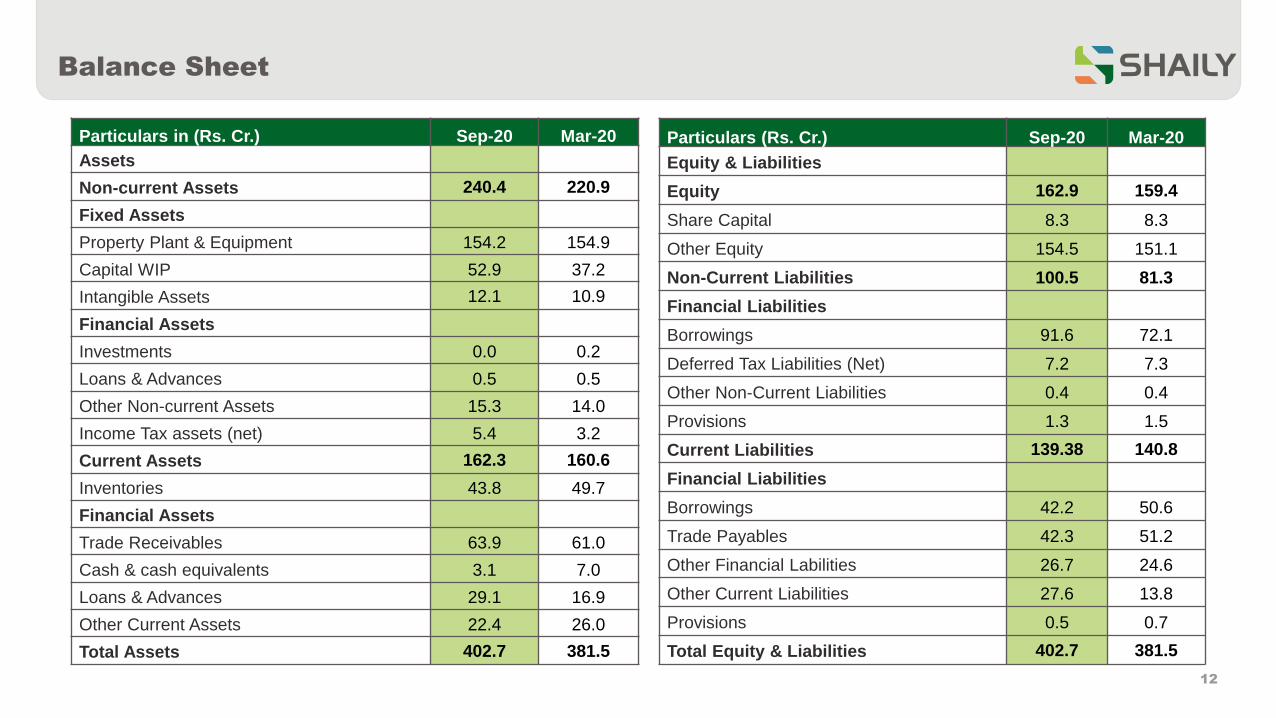
Balance Sheet
12
Particulars in (Rs. Cr.) Sep-20 Mar-20
Assets
Non-current Assets 240.4 220.9
Fixed Assets
Property Plant & Equipment 154.2 154.9
Capital WIP 52.9 37.2
Intangible Assets 12.1 10.9
Financial Assets
Investments 0.0 0.2
Loans & Advances 0.5 0.5
Other Non-current Assets 15.3 14.0
Income Tax assets (net) 5.4 3.2
Current Assets 162.3 160.6
Inventories 43.8 49.7
Financial Assets
Trade Receivables 63.9 61.0
Cash & cash equivalents 3.1 7.0
Loans & Advances 29.1 16.9
Other Current Assets 22.4 26.0
Total Assets 402.7 381.5
Particulars (Rs. Cr.) Sep-20 Mar-20
Equity & Liabilities
Equity 162.9 159.4
Share Capital 8.3 8.3
Other Equity 154.5 151.1
Non-Current Liabilities 100.5 81.3
Financial Liabilities
Borrowings 91.6 72.1
Deferred Tax Liabilities (Net) 7.2 7.3
Other Non-Current Liabilities 0.4 0.4
Provisions 1.3 1.5
Current Liabilities 139.38 140.8
Financial Liabilities
Borrowings 42.2 50.6
Trade Payables 42.3 51.2
Other Financial Labilities 26.7 24.6
Other Current Liabilities 27.6 13.8
Provisions 0.5 0.7
Total Equity & Liabilities 402.7 381.5
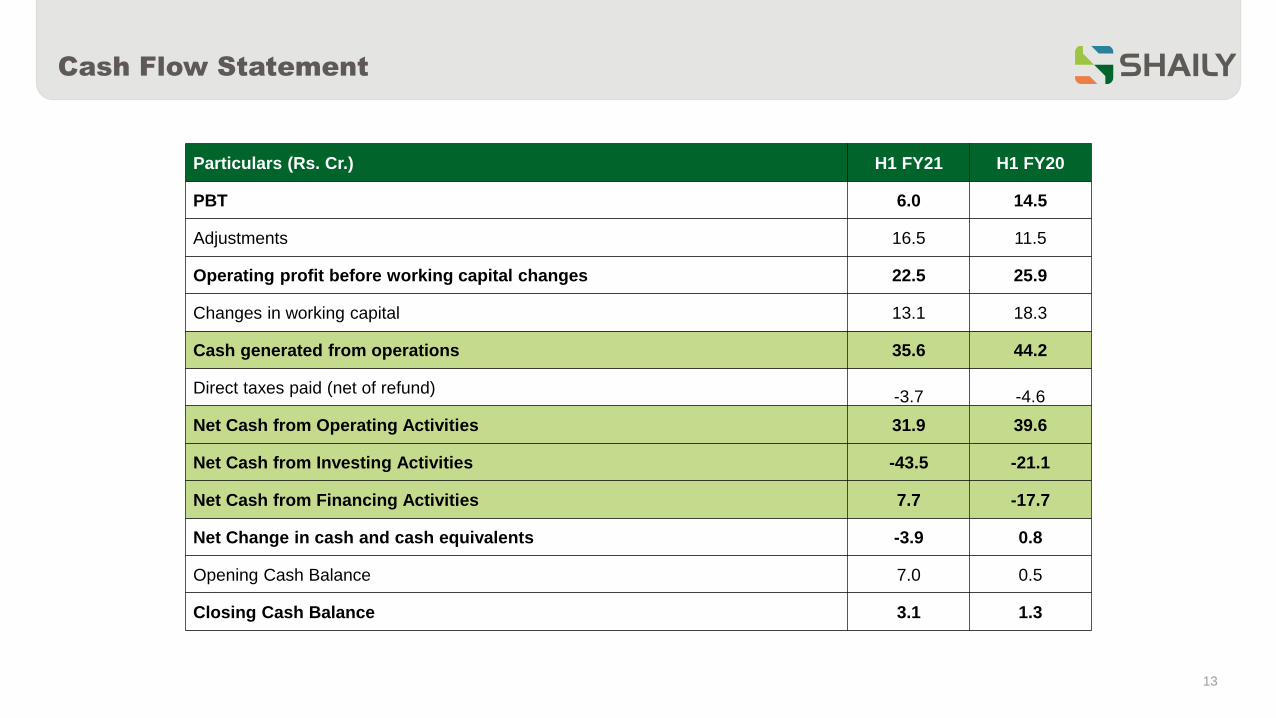
Cash Flow Statement
13
Particulars (Rs. Cr.) H1 FY21 H1 FY20
PBT 6.0 14.5
Adjustments 16.5 11.5
Operating profit before working capital changes 22.5 25.9
Changes in working capital 13.1 18.3
Cash generated from operations 35.6 44.2
Direct taxes paid (net of refund)-3.7 -4.6
Net Cash from Operating Activities 31.9 39.6
Net Cash from Investing Activities -43.5 -21.1
Net Cash from Financing Activities 7.7 -17.7
Net Change in cash and cash equivalents -3.9 0.8
Opening Cash Balance 7.0 0.5
Closing Cash Balance 3.1 1.3
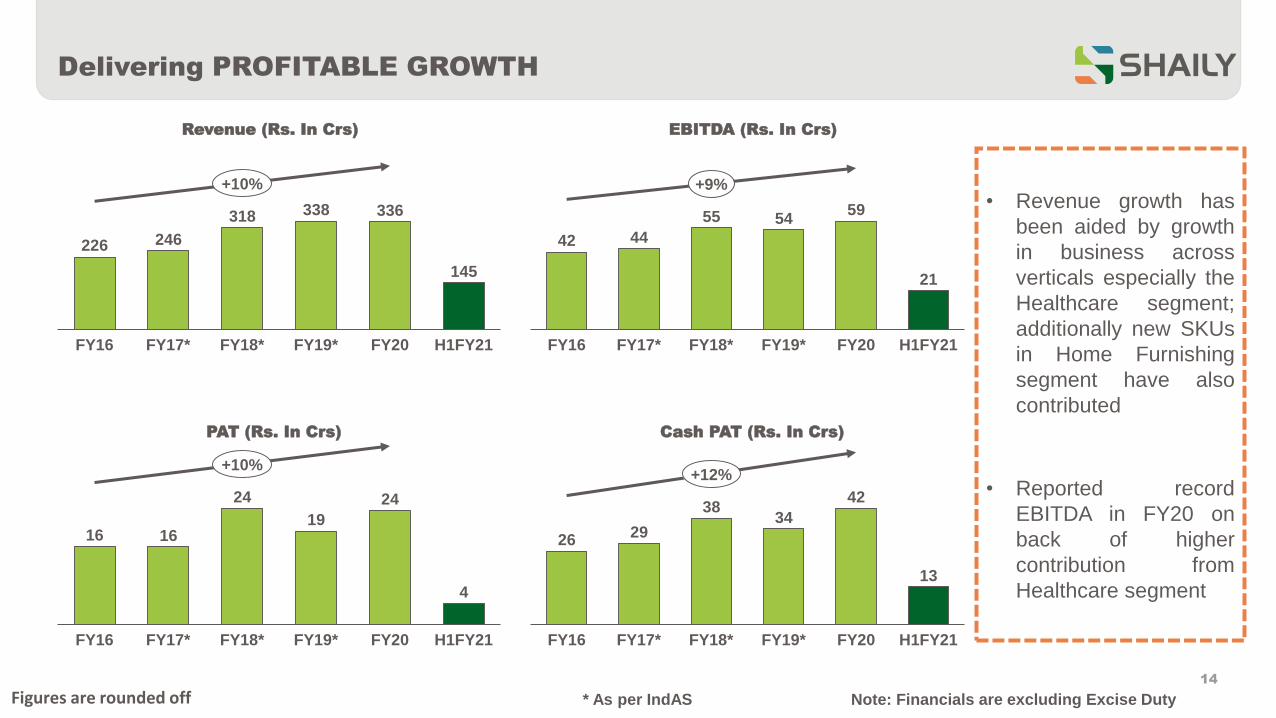
Delivering PROFITABLE GROWTH
14
Note: Financials are excluding Excise Duty* As per IndAS
226 246
318 338 336
145
FY20FY16 FY19*FY17* FY18* H1FY21
+10%
Revenue (Rs. In Crs) EBITDA (Rs. In Crs)
PAT (Rs. In Crs) Cash PAT (Rs. In Crs)
42 44
55 5459
21
FY18*FY16 FY17* FY20FY19* H1FY21
+9%
16 16
24
19
24
4
H1FY21FY18*FY17* FY19*FY16 FY20
+10%
2629
3834
42
13
FY16 FY17* H1FY21FY18* FY19* FY20
+12%
Figures are rounded off
• Revenue growth has
been aided by growth
in business across
verticals especially the
Healthcare segment;
additionally new SKUs
in Home Furnishing
segment have also
contributed
• Reported record
EBITDA in FY20 on
back of higher
contribution from
Healthcare segment
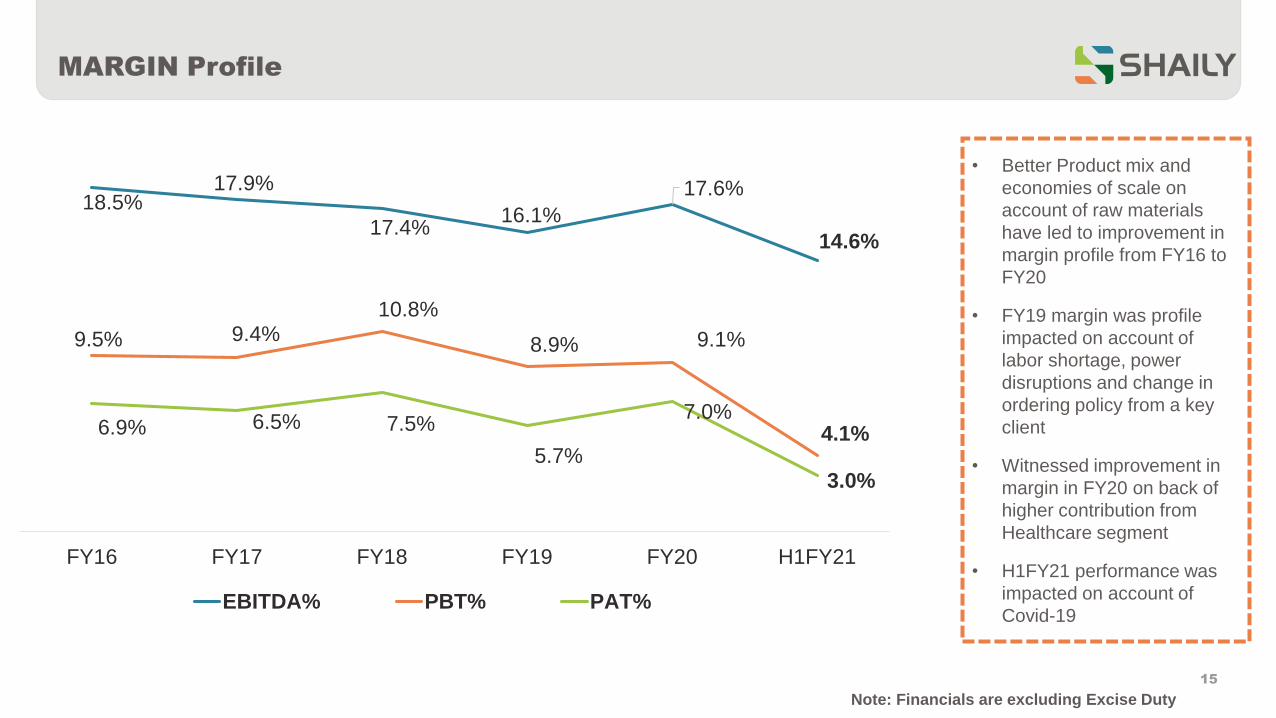
MARGIN Profile
15
18.5%17.9%
17.4%16.1%
17.6%
14.6%
9.5% 9.4%10.8%
8.9% 9.1%
4.1%6.9% 6.5% 7.5%
5.7%
7.0%
3.0%
FY16 FY17 FY18 FY19 FY20 H1FY21
EBITDA% PBT% PAT%
• Better Product mix and
economies of scale on
account of raw materials
have led to improvement in
margin profile from FY16 to
FY20
• FY19 margin was profile
impacted on account of
labor shortage, power
disruptions and change in
ordering policy from a key
client
• Witnessed improvement in
margin in FY20 on back of
higher contribution from
Healthcare segment
• H1FY21 performance was
impacted on account of
Covid-19
Note: Financials are excluding Excise Duty
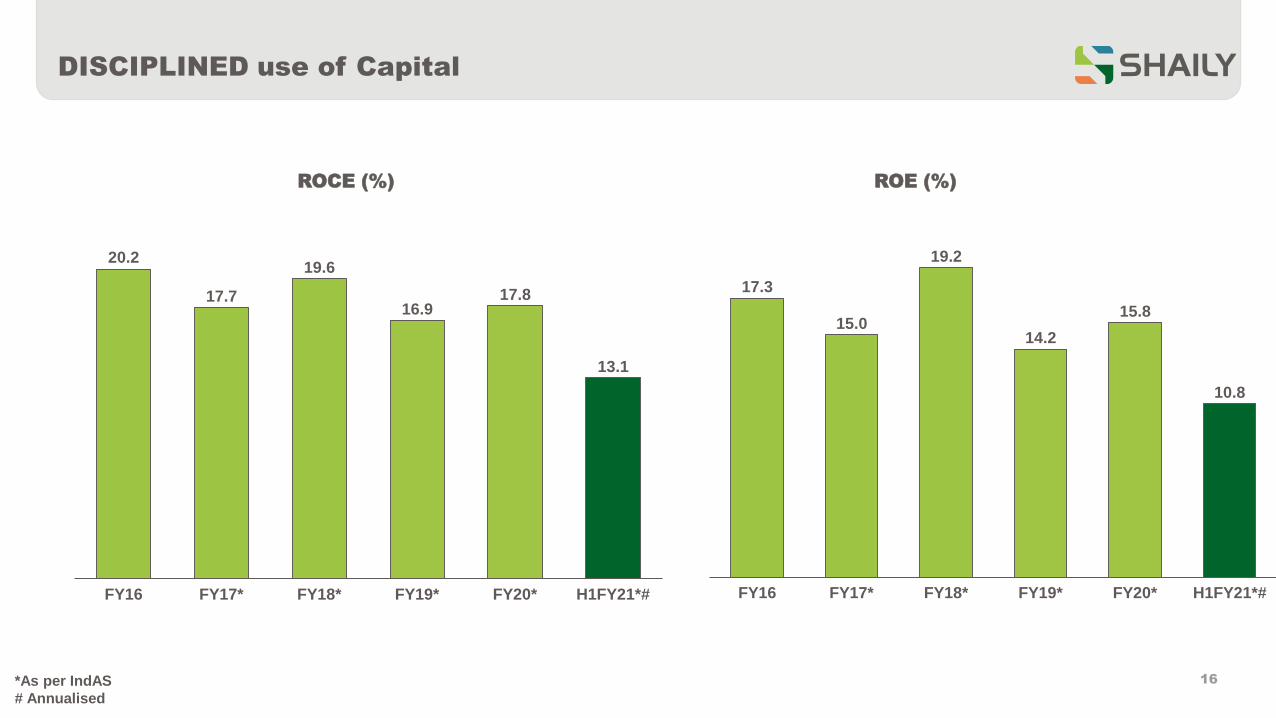
DISCIPLINED use of Capital
16
ROCE (%) ROE (%)
*As per IndAS
# Annualised
17.3
15.0
19.2
14.2
15.8
10.8
FY16 FY18*FY17* FY19* FY20* H1FY21*#
20.2
17.7
19.6
16.917.8
13.1
FY19* H1FY21*#FY16 FY20*FY17* FY18*
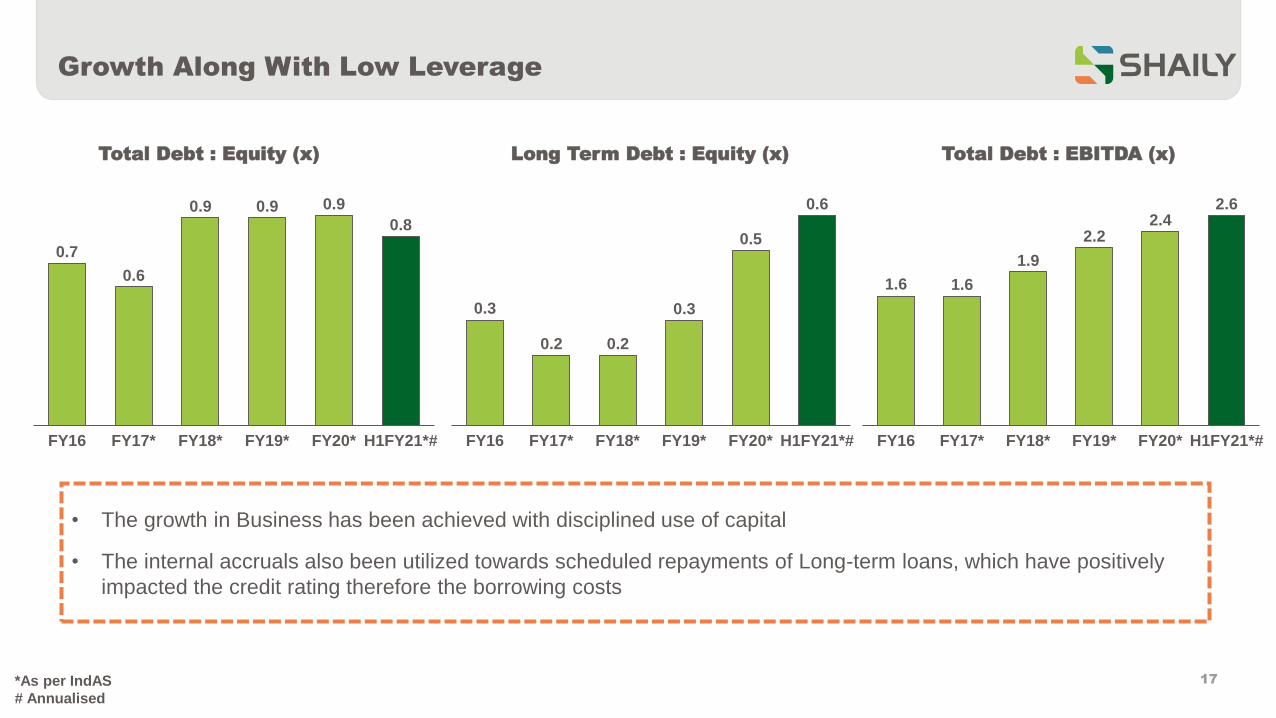
Growth Along With Low Leverage
17
0.3
0.2 0.2
0.3
0.5
0.6
FY16 H1FY21*#FY17* FY18* FY19* FY20*
0.7
0.6
0.9 0.9 0.9
0.8
FY20*FY18*FY16 H1FY21*#FY17* FY19*
1.6 1.6
1.9
2.22.4
2.6
H1FY21*#FY19*FY17* FY20*FY18*FY16
Total Debt : Equity (x) Long Term Debt : Equity (x) Total Debt : EBITDA (x)
• The growth in Business has been achieved with disciplined use of capital
• The internal accruals also been utilized towards scheduled repayments of Long-term loans, which have positively
impacted the credit rating therefore the borrowing costs
*As per IndAS
# Annualised
Strong Focus on Improving Our Key Metrics
18
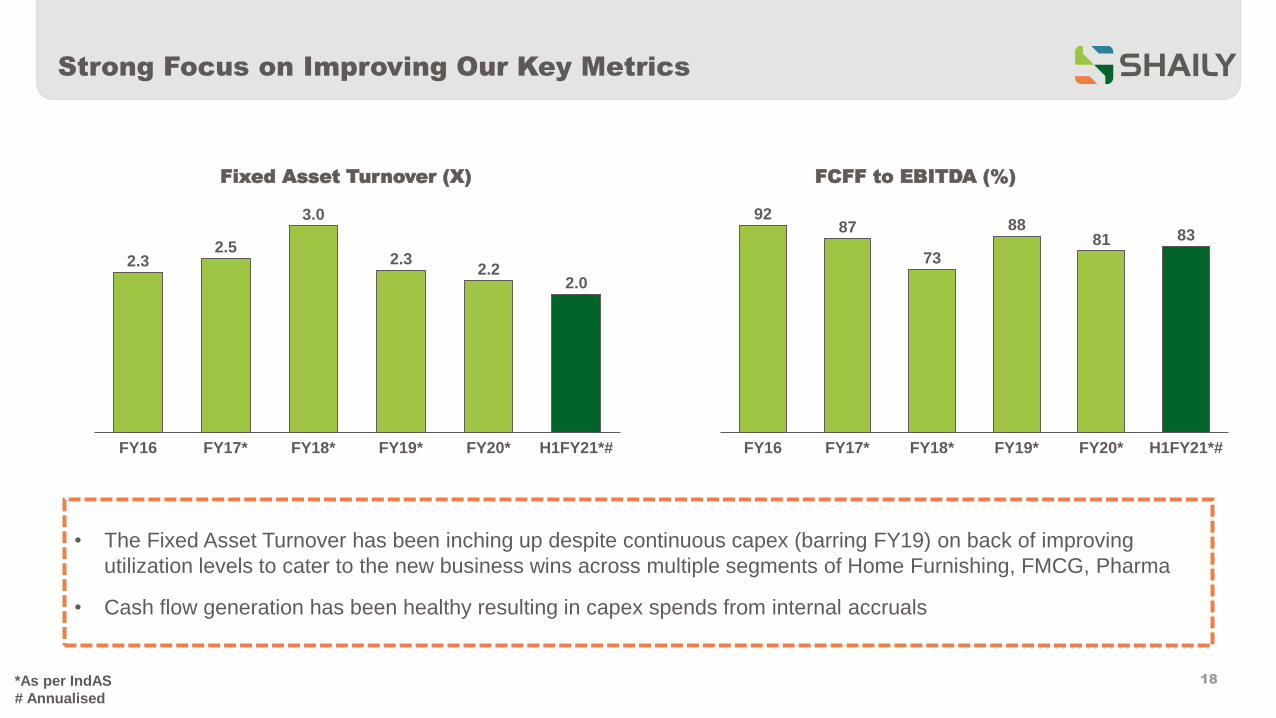
Fixed Asset Turnover (X) FCFF to EBITDA (%)
9287
73
8881 83
FY16 FY17* FY18* FY20*FY19* H1FY21*#
2.32.5
3.0
2.32.2
2.0
FY16 FY17* H1FY21*#FY20*FY18* FY19*
• The Fixed Asset Turnover has been inching up despite continuous capex (barring FY19) on back of improving
utilization levels to cater to the new business wins across multiple segments of Home Furnishing, FMCG, Pharma
• Cash flow generation has been healthy resulting in capex spends from internal accruals
*As per IndAS
# Annualised
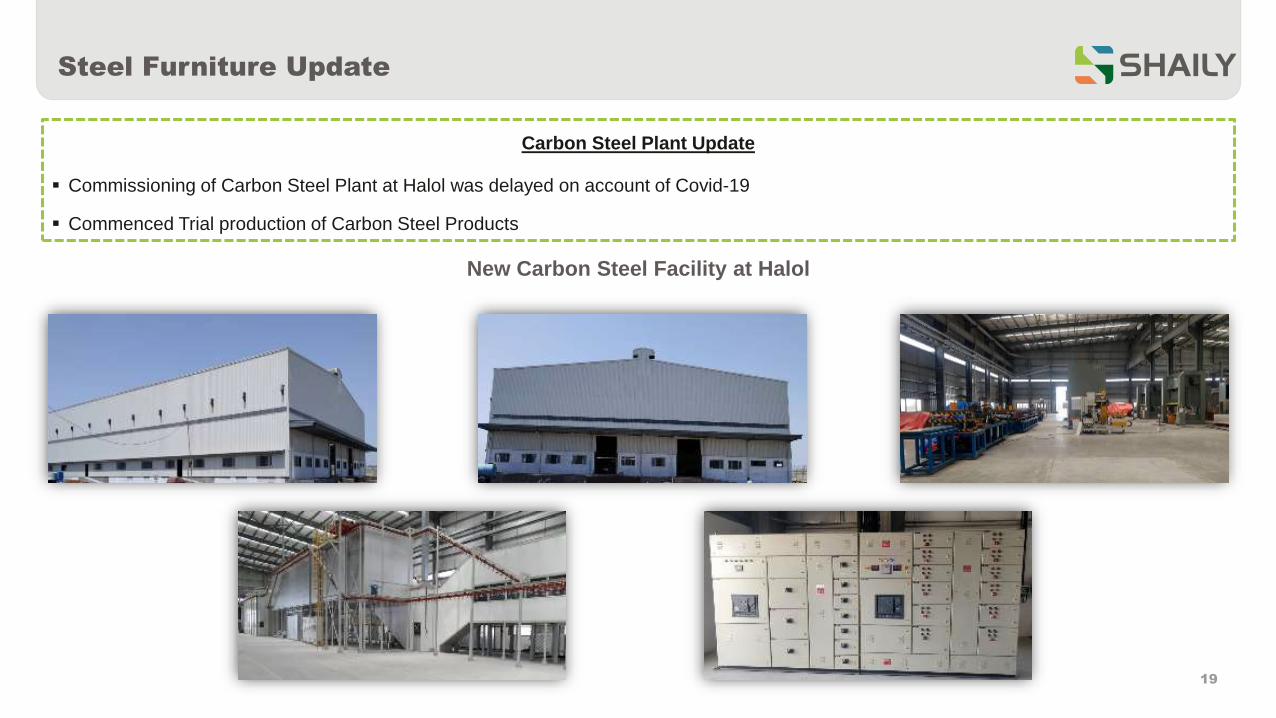
Carbon Steel Plant Update
▪ Commissioning of Carbon Steel Plant at Halol was delayed on account of Covid-19
▪ Commenced Trial production of Carbon Steel Products
Steel Furniture Update
19
New Carbon Steel Facility at Halol
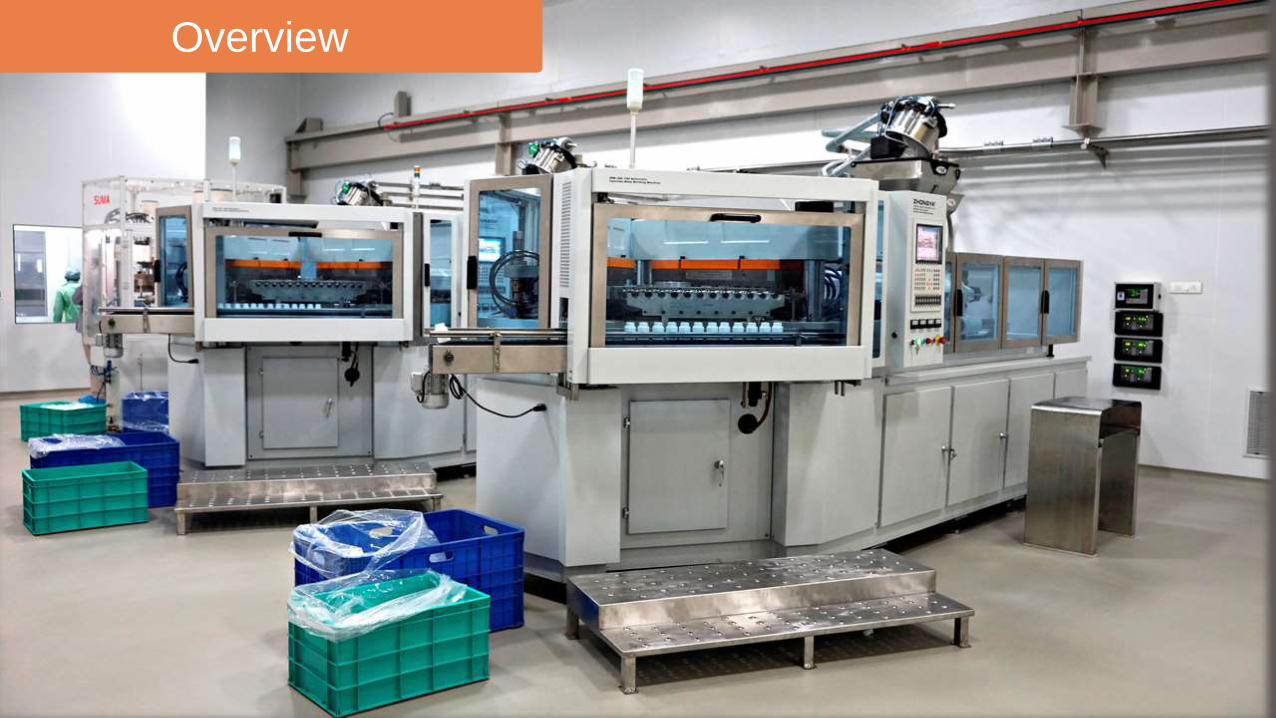
Overview
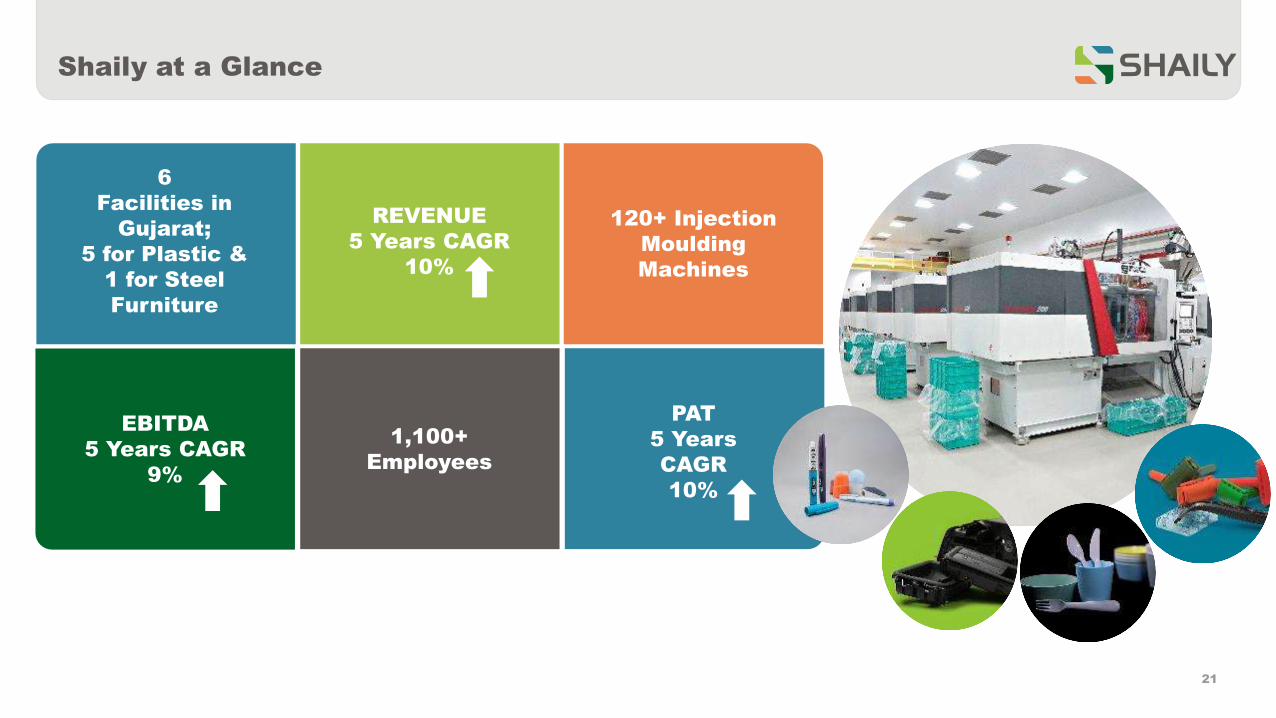
6
Facilities in
Gujarat;
5 for Plastic &
1 for Steel
Furniture
REVENUE
5 Years CAGR
10%
120+ Injection
Moulding
Machines
Shaily at a Glance
EBITDA
5 Years CAGR
9%
1,100+
Employees
PAT
5 Years
CAGR
10%
21
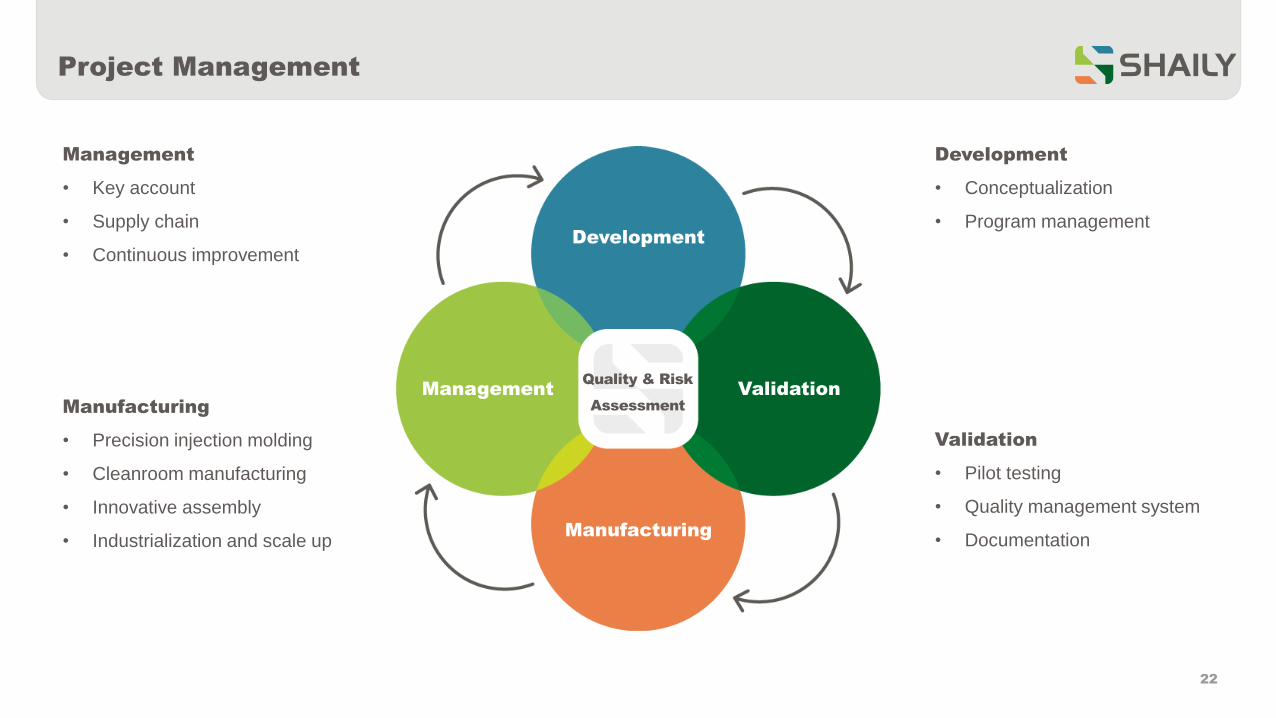
Project Management
Management
• Key account
• Supply chain
• Continuous improvement
Manufacturing
• Precision injection molding
• Cleanroom manufacturing
• Innovative assembly
• Industrialization and scale up
Validation
• Pilot testing
• Quality management system
• Documentation
Development
• Conceptualization
• Program managementDevelopment
Validation
Manufacturing
ManagementQuality & Risk
Assessment
22
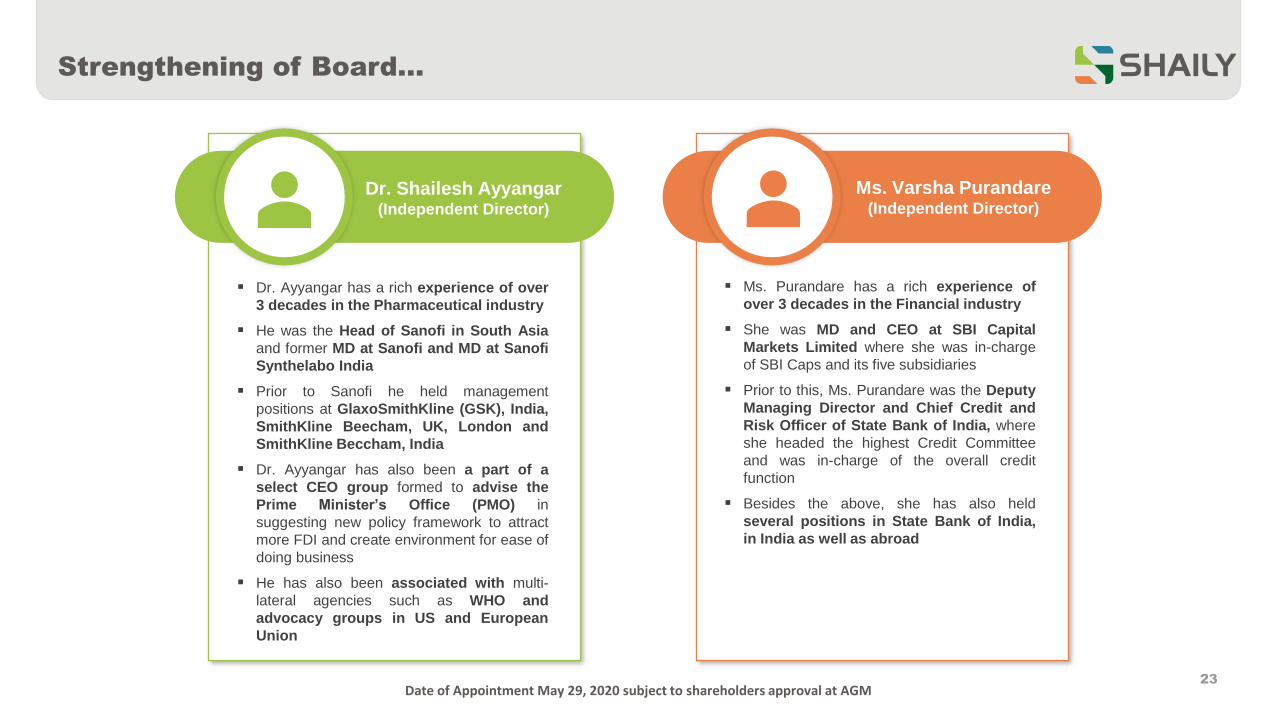
Strengthening of Board…
23
Dr. Shailesh Ayyangar(Independent Director)
▪ Dr. Ayyangar has a rich experience of over
3 decades in the Pharmaceutical industry
▪ He was the Head of Sanofi in South Asia
and former MD at Sanofi and MD at Sanofi
Synthelabo India
▪ Prior to Sanofi he held management
positions at GlaxoSmithKline (GSK), India,
SmithKline Beecham, UK, London and
SmithKline Beccham, India
▪ Dr. Ayyangar has also been a part of a
select CEO group formed to advise the
Prime Minister’s Office (PMO) in
suggesting new policy framework to attract
more FDI and create environment for ease of
doing business
▪ He has also been associated with multi-
lateral agencies such as WHO and
advocacy groups in US and European
Union
▪ Ms. Purandare has a rich experience of
over 3 decades in the Financial industry
▪ She was MD and CEO at SBI Capital
Markets Limited where she was in-charge
of SBI Caps and its five subsidiaries
▪ Prior to this, Ms. Purandare was the Deputy
Managing Director and Chief Credit and
Risk Officer of State Bank of India, where
she headed the highest Credit Committee
and was in-charge of the overall credit
function
▪ Besides the above, she has also held
several positions in State Bank of India,
in India as well as abroad
Ms. Varsha Purandare(Independent Director)
Date of Appointment May 29, 2020 subject to shareholders approval at AGM
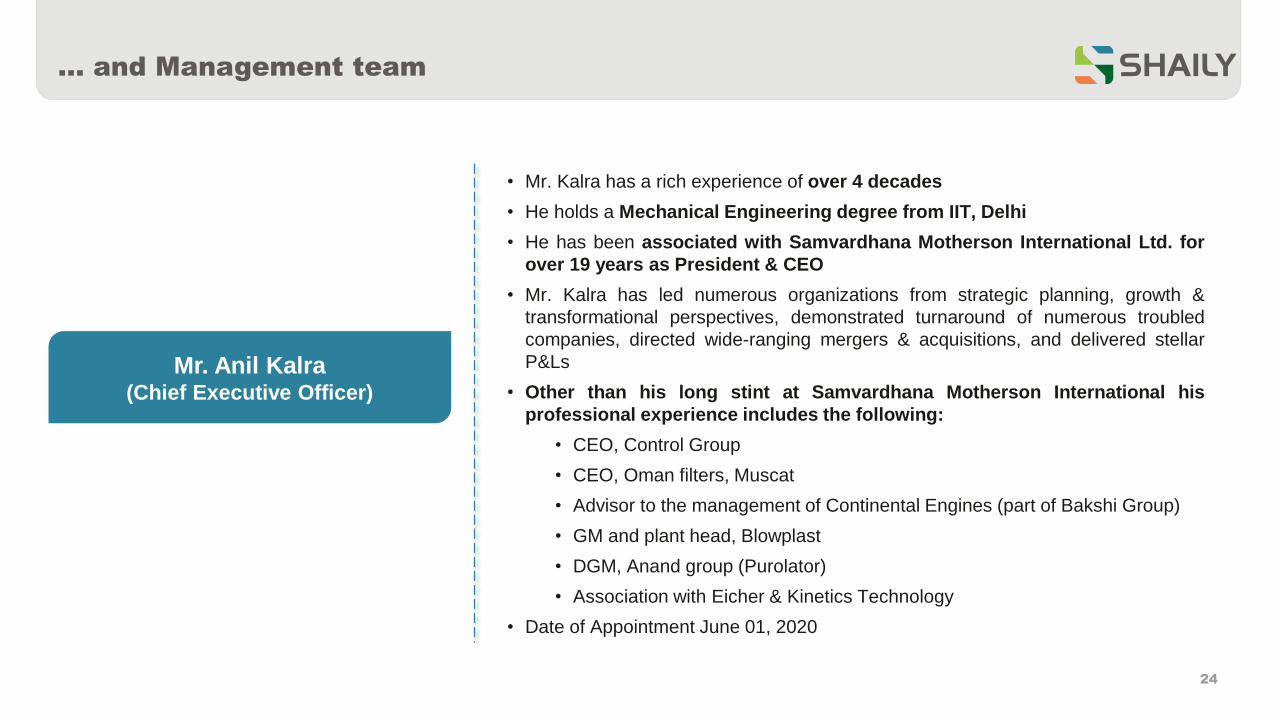
… and Management team
24
• Mr. Kalra has a rich experience of over 4 decades
• He holds a Mechanical Engineering degree from IIT, Delhi
• He has been associated with Samvardhana Motherson International Ltd. for
over 19 years as President & CEO
• Mr. Kalra has led numerous organizations from strategic planning, growth &
transformational perspectives, demonstrated turnaround of numerous troubled
companies, directed wide-ranging mergers & acquisitions, and delivered stellar
P&Ls
• Other than his long stint at Samvardhana Motherson International his
professional experience includes the following:
• CEO, Control Group
• CEO, Oman filters, Muscat
• Advisor to the management of Continental Engines (part of Bakshi Group)
• GM and plant head, Blowplast
• DGM, Anand group (Purolator)
• Association with Eicher & Kinetics Technology
• Date of Appointment June 01, 2020
Mr. Anil Kalra(Chief Executive Officer)
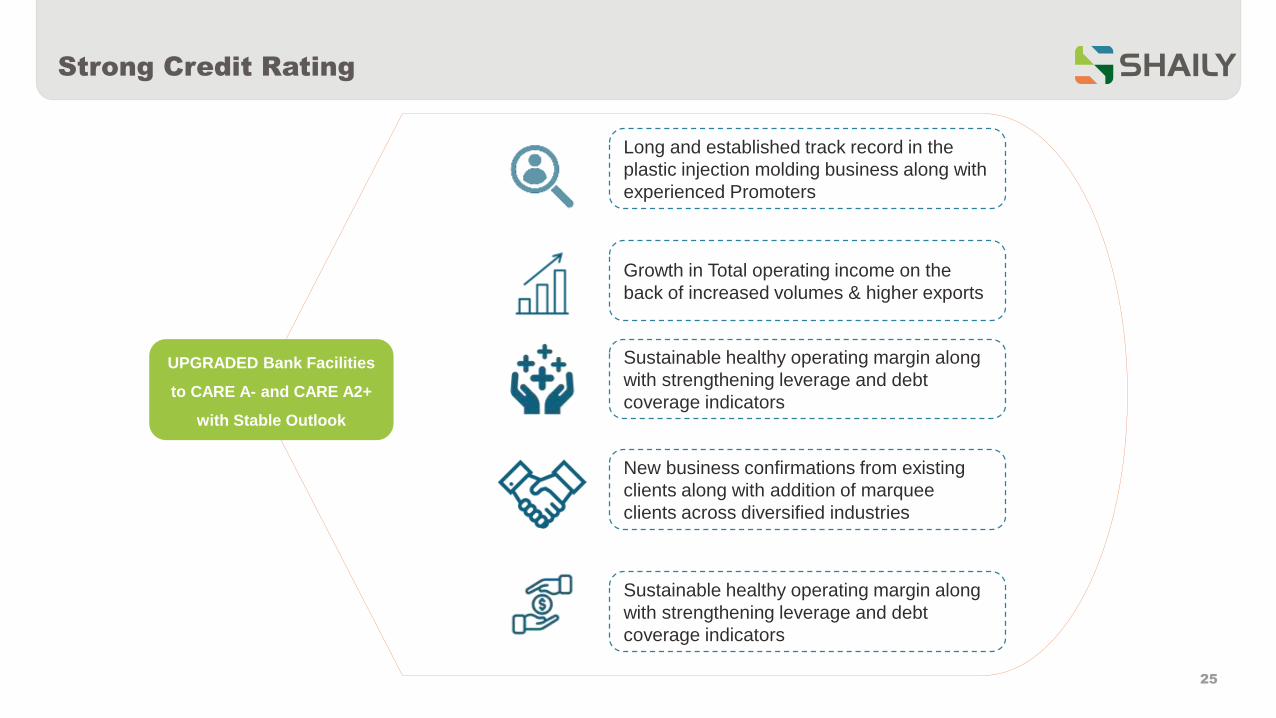
Strong Credit Rating
25
Sustainable healthy operating margin along
with strengthening leverage and debt
coverage indicators
Growth in Total operating income on the
back of increased volumes & higher exports
Long and established track record in the
plastic injection molding business along with
experienced Promoters
New business confirmations from existing
clients along with addition of marquee
clients across diversified industries
Sustainable healthy operating margin along
with strengthening leverage and debt
coverage indicators
UPGRADED Bank Facilities
to CARE A- and CARE A2+
with Stable Outlook
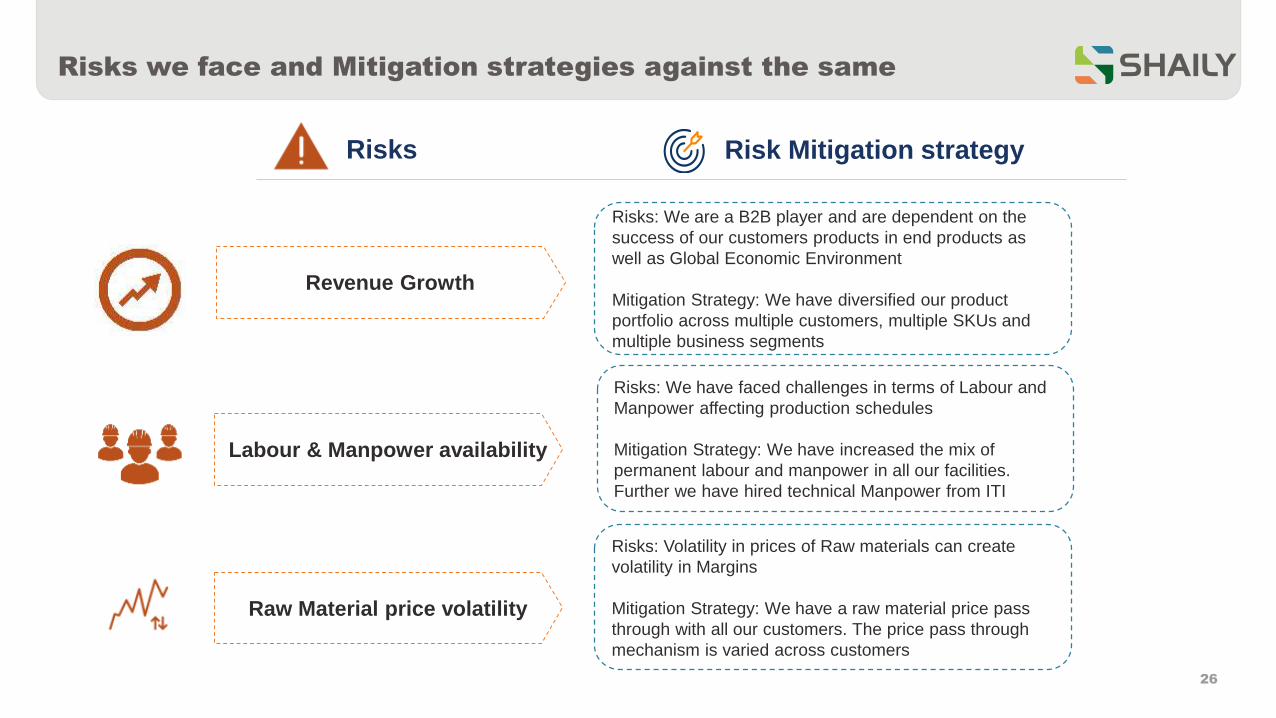
Risks we face and Mitigation strategies against the same
26
Risk Mitigation strategyRisks
Risks: We are a B2B player and are dependent on the
success of our customers products in end products as
well as Global Economic Environment
Mitigation Strategy: We have diversified our product
portfolio across multiple customers, multiple SKUs and
multiple business segments
Revenue Growth
Risks: Volatility in prices of Raw materials can create
volatility in Margins
Mitigation Strategy: We have a raw material price pass
through with all our customers. The price pass through
mechanism is varied across customers
Raw Material price volatility
Risks: We have faced challenges in terms of Labour and
Manpower affecting production schedules
Mitigation Strategy: We have increased the mix of
permanent labour and manpower in all our facilities.
Further we have hired technical Manpower from ITI
Labour & Manpower availability
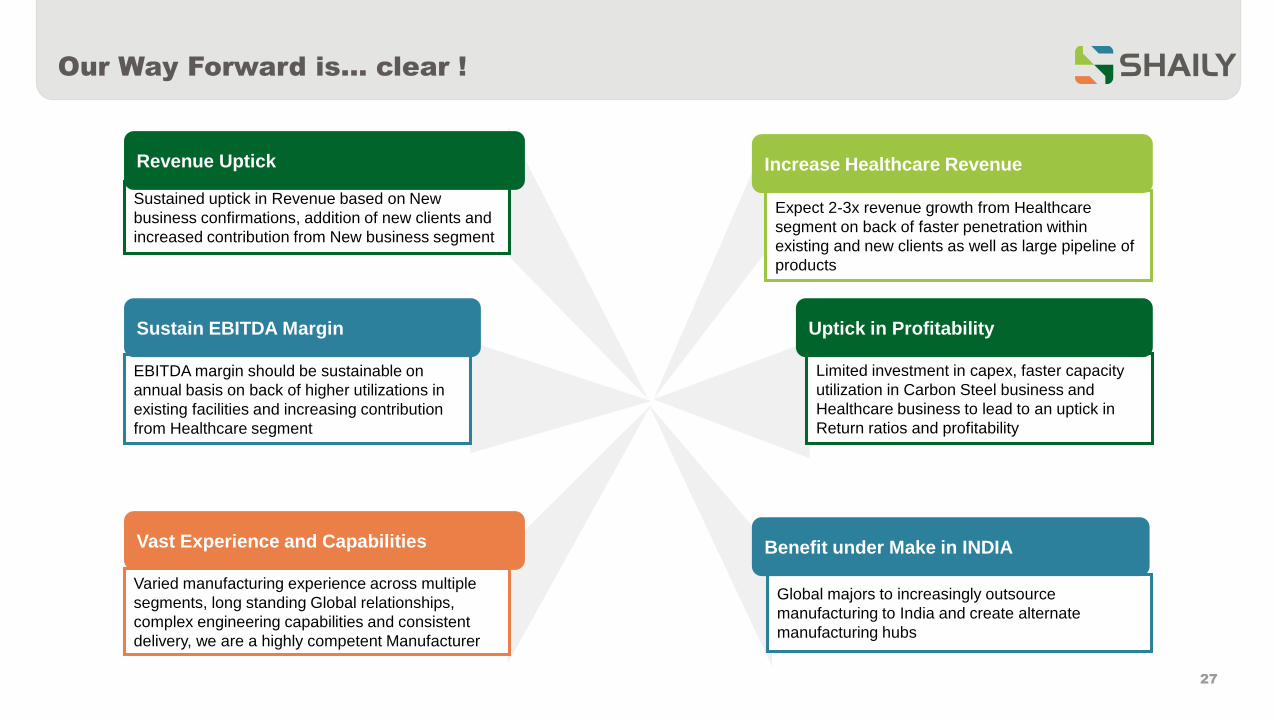
Our Way Forward is… clear !
27
Expect 2-3x revenue growth from Healthcare
segment on back of faster penetration within
existing and new clients as well as large pipeline of
products
Increase Healthcare Revenue
Limited investment in capex, faster capacity
utilization in Carbon Steel business and
Healthcare business to lead to an uptick in
Return ratios and profitability
Uptick in Profitability
Global majors to increasingly outsource
manufacturing to India and create alternate
manufacturing hubs
Benefit under Make in INDIA
Varied manufacturing experience across multiple
segments, long standing Global relationships,
complex engineering capabilities and consistent
delivery, we are a highly competent Manufacturer
Vast Experience and Capabilities
EBITDA margin should be sustainable on
annual basis on back of higher utilizations in
existing facilities and increasing contribution
from Healthcare segment
Sustain EBITDA Margin
Sustained uptick in Revenue based on New
business confirmations, addition of new clients and
increased contribution from New business segment
Revenue Uptick
Contact
28
Company : Investor Relations Advisors :
Shaily Engineering Plastics Ltd.
CIN – L51900GJ1980PLC065554
Mr. Sanjay Shah, Chief Strategy Officer
www.shaily.com
Strategic Growth Advisors Pvt. Ltd.
CIN - U74140MH2010PTC204285
Mr. Shogun Jain/Ms. Akashi Modi
[email protected] / [email protected]
+91 77383 77756 / +91 96198 96128
www.sgapl.net
Company Investor Relations Advisors


![Result Update - Q4 & FY 16 [Company Update]](https://img.pdfslide.us/doc/110x75/577c7c7b1a28abe0549ac3b8/result-update-q4-fy-16-company-update.jpg)

![Result Update Presentation [Company Update]](https://img.pdfslide.us/doc/110x75/577ca5841a28abea748b9163/result-update-presentation-company-update.jpg)
![Result Press Release [Company Update]](https://img.pdfslide.us/doc/110x75/577ca5811a28abea748b9063/result-press-release-company-update.jpg)

![Result Update Presentation Q1 FY 16 [Company Update]](https://img.pdfslide.us/doc/110x75/577cb2961a28aba7118c175a/result-update-presentation-q1-fy-16-company-update.jpg)


![Q2 Result Presentation [Company Update]](https://img.pdfslide.us/doc/110x75/577ca7871a28abea748c70f6/q2-result-presentation-company-update.jpg)