Embed Size (px)
Citation preview
Q2FY21 Investor Presentation

Disclaimer
Disclaimer:
The information in this document, including facts and figures, is being provided by Equitas Small Finance Bank Limited (the “Bank”) for informational purposes only andcould be subject to change without notice. The information has also not been independently verified. No representation or warranty, express implied, is made as to theaccuracy, completeness or fairness of the presentation and the information contained herein and no reliance should be placed on such information. The Bank or anyother parties whose name appears herein shall not be liable for any statements made herein or any event or circumstances arising therefrom.
This presentation or any part of it or the fact of its, form the basis of, or be relied on in connection with, any contract or commitment therefore. This document has notbeen and will not be reviewed or approved by any statutory or regulatory authority in India or any other jurisdiction or by any stock exchanges in India or elsewhereThis document and the contents hereof are restricted for only the intended recipient(s). This document and the contents hereof should not be (forwarded or deliveredor transmitted in any manner whatsoever, to any other person, other than the intended recipients(s) or reproduced in any manner whatsoever. Any forwarding,distribution or reproducing of this document in whole or in part is unauthorized.
Forward Looking Statements:
Certain statements in this document with words or phrases such as “ will”,“ etc. and similar expressions or variation of these expressions or those concerning our futureprospects are forward looking statements. Actual results may differ materially from those suggested by the forward looking statements, due to a number of risks oruncertainties associated with the expectations. These risks and uncertainties include, but not limited to, our ability to successfully implement our strategies, change ingovernment policies etc. The Bank may, from time to time, make additional written and oral forward looking statements, including statements contained in the Bank’sfilings with the stock exchanges and our reports to shareholders.
The Bank does not undertake to update any forward looking statements that may be made from time to time by or on behalf of the Bank.
2

Contents
3
02Financial Performance
Page : 10
03Advances
Page : 14
04Liabilities & Branch Banking
Page : 21
05Financials
Page : 32
01Key Highlights
Page : 04

Key Highlights
4

Snapshot
5
Yield on Gross Advances:19.26% [18.60%]
Deposits Per Branch (branch banking outlets): Rs. 34 Cr [Rs. 27 Cr]
Operational
17 States and UTs
856 Banking Outlets
322 ATMs
269 Business Correspondents
40+ Lac total customers15,879 employees
Asset Offerings Liability Profile Financials
Gross Advances: Rs. 16,731 Cr [Rs. 13,268 Cr]SBL- 42%, VF - 25%, MF- 22%MSE – 6%, NBFC – 4%
Disbursements: Rs. 1,902 Cr [Rs. 2,408 Cr]SBL – 37%, VF - 27%, MF – 21%, MSE – 4%, NBFC – 9%
Asset Quality*: GNPA: 2.76% [2.86%]NNPA: 1.40% [1.62%]PCR: 58.84% [43.83%]
Total Deposits: Rs. 12,901 Cr [Rs. 10,025 Cr]
Third Party Products:Insurance Premium Collected Rs. 18.74 Crs [Rs. 14.91 Cr]Mutual Fund AUM – Rs. 127.16 Cr [Rs. 117.37 Cr]
Daily Average Cost of Funds: 7.36%SA – 6.43%, TD – 7.90%
PAT: Q2FY21 Rs. 103 Cr [Rs. 49 Cr]1HFY21 Rs 161 Cr [Rs.107 Cr]
Shareholders funds CRAR – 20.93% Tier I – 20.16%Tier II – 0.77%
RoA: 1.88% [1.17%]RoE: 14.44% [8.47%]
NIM:Q2FY21 – 9.02% [8.83%]
*2.76% is the proforma NPA assuming NPA recognition as per IRAC norms
Actual GNPA & NNPA with standstill benefit due to Supreme Court Order is 2.39% and 1.00% respectively
GNPA & NNPA including IBPC
Figures in [] represent
Q2FY20 data
SBL – Small Business Loans,
VF – Vehicle Finance MF – Micro Finance
MSE – Micro & Small Enterprise

Highlights – Q2FY21
6
Advances:
• Advances as of Q2FY21 was at Rs. 16,731 Cr, Advances growth of 26% YoY
• The Bank disbursed Rs. 1,902 Cr in Q2FY21, Disbursements at 80% of Q2FY20
• 77.37% of advances is secured loans
• New Product - Gold Loan & Used Car Advances cross Rs. 50 Cr each
• Collection efficiency for the month of October climbs upto 94.3%
• 89% of the Gross Advances is in 0 dpd bucket
Liabilities:
• Deposits excluding CD at Rs. 12,588 Cr, growth of 31% YoY and 10% QoQ
• Retail TD at Rs. 4,983 Cr, growth of 98% YoY and 14% QoQ
• Savings Account deposits at Rs. 2,845, growth of 53% YoY and 41% QoQ
• CASA stood at Rs. 3,246 Cr, CASA is 25% of Total Deposits
• 92% of bulk deposit are non-callable
• Digi Banking gains traction - Over 80,000+ Savings Account acquired and 36,000+ FASTags issued through Digital Marketing programme
• 15,000+ Accounts opened from Non Equitas branch location
Highlights – Q2FY21
7
Profit & Loss:
• Net Interest Income for Q2FY21 at Rs. 461 Cr as against Rs. 351 Cr in Q2FY20, growth of 31% YoY. NIM at 9.02%
• Core Income (Net Income other than PSL Fees, Treasury & Others) at 98%
• PBT before provisions and write off for Q2FY21 at Rs. 220 Cr as against Rs. 131 Cr in Q2FY20, growth of 67%
• Additional Covid provision of Rs. 26 Cr in Q2FY21. The bank now carries Rs. 170.63 Cr of COVID-19 related provisions (other than Standard and NPA Provisions), which constitutes 1.02% of total Gross Advances
• PAT for Q2FY21 at Rs. 103 cr as against Rs. 49 Cr in Q2FY20, growth of 108%
Asset Quality:
• GNPA at 2.39% in Q2FY21 as compared to 2.68% in Q1FY21 and 2.86% in Q2FY20
• NNPA at 1.00% in Q2FY21 as compared to 1.48% in Q1FY21 and 1.63% in Q2FY20
The Honorable Supreme Court of India (Hon’ble SC), in a public interest litigation (Gajendra Sharma Vs. Union of India & Anr), vide an interim order dated September 03, 2020 (“Interim Order”), has directed that accounts which were not declared NPA till August 31, 2020 shall not be declared as NPA till further orders. Basis the said interim order, the Bank has not classified any account (whether granted moratorium or not) which was not NPA as of August 31, 2020 as per the RBI IRAC norms, as NPA after August 31, 2020. Further, in light of the Interim Order, even accounts that would have otherwise been classified as NPA post August 31, 2020 have not been and will not be, classified as NPA till such time that the Hon’ble SC rules finally on the matter.
However, if the Bank had classified borrower accounts as NPA after August 31, 2020, the Bank’s proforma Gross NPA ratio and proforma Net NPA ratio would have been 2.76% and 1.40% respectively. Pending disposal of the case, the Bank, as a matter of prudence has, in respect of these accounts made a contingent provision (including on interest accrued) of Rs. 15.43 crore, which is included in Provisions (other than tax) and Contingencies

Highlights – Q2FY21
8
Capital:
• As of September 30, 2020 Total CRAR at 20.93% and Tier-I CRAR of 20.16%; Well above minimum regulatory requirements of 15% and 7.5%. Tier II Capital at 0.77%
• Complying with the Small Finance Bank licensing requirement, the Bank got listed
Treasury & Liquidity:
• Availed refinance of Rs. 1,100 Crore during Q2FY21 (Rs. 685 Crore in Q1FY21). Bank has adequate advances to avail fresh refinance whenever required which provides strong cushion to ALM position of the Bank
• Bank has also undertaken Inter-Bank Participation Certificates (IBPCs) with a mix of PSL/Non-PSL advances which further enhances the liquidity of the Bank
• Adequate surplus liquidity in the form of High Quality Liquid Assets (HQLA) being maintained to fund advances growth.
• Liquidity Coverage Ratio (LCR) for the quarter at 126% much above the minimum regulatory requirement of LCR at 80%
• Daily Average cost of funds for Q2FY21 at 7.36%
Key Ratios:
• Cost to Income improves to 58.15% in Q2FY21 as compared to 68.35% in Q2FY20 and 67.27% in Q1FY21
• RoA and RoE for Q2FY21 at 1.88% and 14.44% respectively

Highlights – Q2FY21
9
Customer Service Management:
• Launched NPS (Net Promoter Score) to improve customer experience across touch points in Q2FY21
• Launched Branch scorecards for branch banking outlets to improve customer service indicators
• Implemented AI led Bots to manage responses from marketing campaigns related enquires
Awards:
CMO Asia:
• Best Innovative CEO – Mr. P N Vasudevan (MD & CEO)
• Best Product Proposition – Savings Account
• Best innovative Insurance Solution – COVID Indemnity Policy
• Best Campaign – One India One Bank
Economic Times:
• Best Brand Award 2020

Financial Performance
10

8.25%
8.01%
7.77%
7.56%7.36%
Q2FY20 Q3FY20 Q4FY20 Q1FY21 Q2FY21
Cost of Funds Net Interest Margin (NIM) Cost to Assets RoA
Credit Cost GNPA & NNPA* Provision Coverage Ratio RoE
Key Ratios
11
8.83%
9.17%
9.54%
8.63%
9.02%
Q2FY20 Q3FY20 Q4FY20 Q1FY21 Q2FY21
6.69%6.96%
6.54%
5.81% 5.58%
Q2FY20 Q3FY20 Q4FY20 Q1FY21 Q2FY21
1.17%
2.11%
0.91%1.15%
1.88%
Q2FY20 Q3FY20 Q4FY20 Q1FY21 Q2FY21
1.45%1.21%
3.79%
1.94%2.21%
Q2FY20 Q3FY20 Q4FY20 Q1FY21 Q2FY21
2.86% 2.86% 2.72% 2.68% 2.76%
1.62% 1.64% 1.50% 1.39% 1.40%
Q2FY20 Q3FY20 Q4FY20 Q1FY21 Q2FY21
GNPA NNPA
43.83% 43.44% 45.22% 48.79%
58.84%
Q2FY20 Q3FY20 Q4FY20 Q1FY21 Q2FY21
8.47%
14.86%
6.31%8.32%
14.44%
Q2FY20 Q3FY20 Q4FY20 Q1FY21 Q2FY21
*Actual GNPA and NNPA due to Hon Supreme Court Order (Standstill) is at 2.39% and 1.00% respectively

12
Net income evolution (in Rs. Cr)
Other Income Break-up (Rs. Cr)
Non-interest income * evolution
* Non Interest Income = Other income + PSLC fee income | Net Income is NII + Other Income + PSLC
1.49%
1.85%
1.52%
0.57% 1.11%
15.42%
18.26%
14.79%
6.83%
12.13%
0.0 0%
2.0 0%
4.0 0%
6.0 0%
8.0 0%
10. 00%
12. 00%
14. 00%
16. 00%
18. 00%
20. 00%
0.5 0%
0.7 0%
0.9 0%
1.1 0%
1.3 0%
1.5 0%
1.7 0%
1.9 0%
2.1 0%
Q2FY20 Q3FY20 Q4FY20 Q1FY21 Q2FY21
Non Interest Income as a % of assets Non Interest Income as a % of Net Income
Income Evolution
36%
1%
62%
Liabitlities Segment Fee Income Treasury Gain/ Loss [Net]
Asset Segment Fee Income
351 384 424 404 461
64 86 74 30 64
Q2FY20 Q3FY20 Q4FY20 Q1FY21 Q2FY21
NII Other Income
22%
78%
Banking Fees & Other Charges
Distribution Fee Income

13
Opex evolution
Rs Cr Q2FY20 Q3FY20 Q4FY20 Q1FY21 Q2FY21
Employee expenses 170 184 187 194 188
Other expenses 89 101 100 78 99
Depreciation 25 26 22 19 19
Total Operating expenses 283 311 309 292 305
No. of employees 15,589 15,836 16,104 15,843 15,879
Cost to income (%) Opex / Net Income [ Total Income- Finance Cost]| Cost to assets (%) – Opex/ Total Assets
Opex Evolution
6.69%
6.96%6.54%
5.81%
5.58%
68.35%
66.24%
62.14%
67.27%
58.15%
52. 00%
54. 00%
56. 00%
58. 00%
60. 00%
62. 00%
64. 00%
66. 00%
68. 00%
70. 00%
4.0 0%
4.5 0%
5.0 0%
5.5 0%
6.0 0%
6.5 0%
7.0 0%
7.5 0%
Q2FY20 Q3FY20 Q4FY20 Q1FY21 Q2FY21
Cost to Assets % Cost to Income %

Advances
14

15
Advances Evolution & Diversified Book
Rs Cr Q2FY21 Q2FY20 YoY Growth %
Micro Finance 3,641 3,193 14%
Small Business Loans(Incl. HF)
7,052 5,405 30%
Vehicle Finance 4,137 3,235 28%
MSE Finance^ 936 435 NA
NBFC^ 734 693 NA
Others † 231 307 -25%
Gross Advances 16,731 13,268 26%
3,641 , 22%
7,052 ,42%
4,137 ,25%
936 , 6%
734 , 4%
231 , 1%
Micro Finance Small Business Loans Vehicle Finance
MSE Finance NBFC Others
^ Rs. 145.07 Cr reclassified from Corporate to MSE Finance from Q2FY21 onwards
† Others includes loan-against-gold, unsecured business loans, overdrafts against fixed deposits and staff loans| Housing Finance (HF) | Micro Small Enterprises (MSE)

16
Advances Evolution & Diversified Book
Rs Cr Q2FY20 Q3FY20 Q4FY20 Q1FY21 Q2FY21
Micro Finance 3,193 3,504 3,616 3,618 3,641
Small Business Loans (Incl. HF) 5,405 5,931 6,279 6,484 7,052
Small Business Loans 4,340 4,739 4,995 5,152 5,580
Housing Finance 451 528 604 629 715
Agri Loans 614 664 680 703 757
Vehicle Finance 3,235 3,591 3,760 3,777 4,137
Used CV 2,362 2,550 2,625 2,628 2,835
New CV 873 1,041 1,135 1,149 1,302
MSE Finance^ 435 563 669 712 936
NBFC^ 693 760 818 772 734
Others† 307 258 224 210 231
Gross Advances 13,268 14,615 15,367 15,573 16,731
^ Rs. 145.07 Cr reclassified from Corporate to MSE Finance from Q2FY21 onwards
† Others includes loan-against-gold, unsecured business loans, overdrafts against fixed deposits and staff loans| Housing Finance (HF) | Micro Small Enterprises (MSE)

17
Product Segment Details
Product SegmentNumber ofLive Loans
ATS @ Disbursement (Lacs)
ATS @ Portfolio (Lacs)
GNPA(%)
PCR(%)
Micro Finance 22,27,072 0.20 0.16 1.16% 70.59%
Small Business Loans (Incl. HF) 2,24,795 5.32 3.14 2.48% 38.59%
Vehicle Finance 1,22,063 3.98 3.39 2.96% 50.51%
MSE Finance^ 1,594 29.46 49.60 0.85% 27.76%
NBFC^ 47 2,642.86 1,870.90 0.84% 20.43%
^ Rs. 145.07 Cr reclassified from Corporate to MSE Finance from Q2FY21 onwards
ATS stands for Average Ticket Size
36% 24% 23%
MFI AFC HFC
NBFC Exposure Mix MSE Finance
33% 40% 27%
Manufacturing Trading
Services
35%
32%
33%
Less than Rs.5 lakhs
Rs. 5 to Rs. 10 lakhs
Above Rs. 10 lakhs
34%
39%
27%
Less than Rs.5 lakhs
Rs. 5 to Rs. 10 lakhs
Above Rs. 10 lakhs
Small Business Loans Ticket Size Split
Vehicle FinanceTicket Size Split

18
Disbursements Product Wise
Rs Cr Q2FY20 Q3FY20 Q4FY20 Q1FY21 Q2FY21
Micro Finance 702 1,022 814 132 390
Small Business Loans (Incl. HF) 701 943 682 266 707
Small Business Loans 563 743 532 204 523
Housing Finance 58 107 92 30 115
Agri Loans 80 92 58 32 70
Vehicle Finance 638 815 592 104 508
Used CV 472 566 419 70 309
New CV 166 249 173 34 199
MSE Finance 159 151 135 36 85
NBFC^ 192 139 171 19 166
Others 15 10 10 7 45
Total Disbursements 2,408 3,080 2,405 564 1,902
2,408
3,080
2,405
564
1,902
Q2FY20 Q3FY20 Q4FY20 Q1FY21 Q2FY21
Disbursement (Rs. Cr)
^ Rs. 5.59 Cr reclassified from Corporate to MSE Finance from Q2FY21 onwards

19
377.22 417.96 417.32 416.67 399.65 230.87 255.40 247.61 232.37
198.92
2.86% 2.86%2.72% 2.68%
2.39%
1.62% 1.64%1.50%
1.39%
1.00%1.0 0%
1.2 0%
1.4 0%
1.6 0%
1.8 0%
2.0 0%
2.2 0%
2.4 0%
2.6 0%
2.8 0%
3.0 0%
50.0 0
100 .00
150 .00
200 .00
250 .00
300 .00
350 .00
400 .00
450 .00
Q2FY20 Q3FY20 Q4FY20 Q1FY21 Q2FY21
GNPA (Rs. Cr) NNPA (Rs. Cr) GNPA % NNPA %
Gross NPA Movement (Rs Cr) Q2FY20 Q3FY20 Q4FY20 Q1FY21 Q2FY21
Opening GNPA Balance 334.30 377.22 417.96 417.32 416.67
Add: Additions during the period 108.57 127.24 94.13 15.39 22.92
Less:
i. Upgradations 18.08 29.14 39.73 3.19 10.62
ii. Recoveries (excluding recoveries made from upgraded accounts) 28.77 35.34 33.26 4.69 15.82
iii. Technical or Prudential write-offs 5.47 3.64 4.79 5.21 5.54
Write-offs other than those under (iii) above 13.33 18.38 16.99 2.95 7.96
Closing GNPA Balance 377.22 417.96 417.32 416.67 399.65
Asset Quality Trend
If the Bank had classified borrower accounts as NPA after August 31, 2020, GNPA & NNPA would be 2.76% and 1.40% respectively

20
Collection Efficiency
Particulars Collection Efficiency
October 2020Billing Efficiency
October 2020
Micro Finance 92.43% 91.02%
Small Business Loans 102.80% 88.17%
Vehicle Finance 87.92% 77.86%
MSE Finance 92.91% 83.83%
Corporate 103.23% 96.24%
Total 94.31% 87.12%
Particulars 0 DPD Bucket Collection Efficiency
October 20200 DPD Bucket Collection Efficiency
Feb 2020 (Pre Covid)
Small Business Loans 98.77% 99.40%
Vehicle Finance 89.42% 95.73%
Robust collections seen across all products in 0 DPD bucket in September and October 2020
1. Collection efficiency represents total collections during the month as a percentage of October months total EMIs due2. Billing efficiency represents only the EMIs of October alone collected as a percentage of October months total EMIs due

Liabilities & Branch Banking
21

22
Customer Deposits Evolution
as on 31 September 2020CA
[Current Account]
SA [Savings Account]
CASA[Low cost deposits]
TD[Term Deposits]
CASA+TD[Customer Deposits]
Balance (Cr) 401 2,845 3,246 9,342 12,588
as a % of total borrowings (Rs. 19,675 Cr) 2% 14% 16% 47% 64%
as a % of total deposits (Rs. 12,901 Cr) 3% 22% 25% 72% 98%
Avg. balance (Branch Banking Customers) 76,410 44,051 - 7,57,312 -
Update for Q2Y21
Customer Deposits evolution (Rs. Cr)
384 394 350 330 401
1,865 1,802 1,859 2,024 2,845
7,391 7,473 8,092
9,117 9,342
Q2FY20 Q3FY20 Q4FY20 Q1FY21 Q2FY21
CA SA TD† Cost of Customer Deposits = Interest paid on Customer Deposits as a % of Average Customer Deposits | Customer Deposits = CASA + Term Deposits
Cost of Deposits = Interest paid on Total Deposits as a % of Average Total Deposits | Total Deposits = Customer Deposits + Certificate of Deposits [CDs]
Daily Average Cost of Deposits (%)
7.79%
7.66%7.58%
7.49%
7.39%
7.79%
7.64%
7.53%7.47%
7.38%
Q2FY20 Q3FY20 Q4FY20 Q1FY21 Q2FY21
Cost of Customer Deposits Cost of Deposits

23
Customer Deposit Profile
930 1,188 1,786
1,392 1,526
1,703
Q4FY20 Q1FY21 Q2FY21
Mass Affluent Customer* (Deposit in Rs. Cr)
Elite Wings
34% 37%
47% 48%
53%
66% 63%
53% 52%
47%
Q2FY20 Q3FY20 Q4FY20 Q1FY21 Q2FY21
Term Deposits (TD) %
Retail TD Bulk TD
53.33%
9.68%
36.98%
Term Deposits Value Slabs
< 2Cr 2Cr to < 10Cr 10Cr +
9.41%
25.47%
26.10%
14.21%
24.81%
Savings Account Value Slabs
< 1L 1L to < 10L 10L to < 1Cr 1Cr to < 10Cr 10Cr +
46%
29%
8%
7%
5%
4%
1%
INDIVIDUALS +PARTNERSHIP FIRMS +PROPRIETORSHIP…
BANKS
PVT.CORPORATES
GOVT./LOCAL BODIES
TRUSTS
OTHERS
PENSION/PROVIDENTFUNDS/ INSURANCE
Deposits by Category
*CASA and TD balances of Premium (Wings & Elite) CASA account holders | Retail TD as defined by RBI

Update on Channels & Acquisition
Corporate Salary Channel NRI Channel
• Dedicated channels to develop Corporate Salary relationships
• On boarded 170+ Corporates
• 80% of accounts opened digitally
• Launched Digital account opening
• Dedicated channel to tap in specific markets
• 4X YoY growth in Acquisition
NRI Account Acquisition
142 218
170
624
Q2FY20 Q4FY20 Q1FY21 Q2FY21
Corporate Salary AccountAcquisition
198 191 185
3,740
Q2FY20 Q4FY20 Q1FY21 Q2FY21
CASA Account Acquisition
35,235 51,076
82,793
1,19,790
Q2FY20 Q4FY20 Q1FY21 Q2FY21
3,095 3,380 3,949
9,898
Q2FY20 Q4FY20 Q1FY21 Q2FY21
High Variant Account Acquisition
24

25
Digi Banking
Products:
• Launched digital 3 in 1 account, in partnership with Aditya Birla Securities Limited
• Live with Bharat Bill Payment System
Partnerships:
• Focusing on partnerships with Fintechs to improve our service offerings. Partnered with Open Financial Technologies Private Ltd and Groww
Enhancements:
• Mobile Banking enhancements• OTP auto read• Debit Card upgrade/downgrade option• SIM binding for enhanced security
• Provide QR Code with all Current Accounts which shall enable easy adaption of digital transaction by customers
Acquisition:
• Paperless account opening - Acquired & On boarded over 81,000+ Savings Account Customers through Digital Channels
• 15,000+ Accounts opened from Non Equitas branch location
• Launched digital account opening for Non Resident accounts
• Launched digital sales of Insurance products
38.81%
19.07%
16.13%
9.38%
7.31%
Top 5 Non Equitas Branch Locations
Bihar West Bengal Odisha Assam Jharkhand

26
One India One Bank – Integrated Marketing Campaign
• Association with Chennai Super Kings
• Exclusive CSK Co Branded Debit Card
• Super Account for the Super Fan in You
• Cricket Quiz with Ace Quiz Whiz Sumanth C Raman
• Pre and Post Match Analysis with Hari Shankar
• NRI Campaign with Kaleej Times - Dubai
• A Comical Web Series – Durai Shakes to reach the households andfamilies
• A Musical tribute to the indomitable spirit of India and millions ofIndians who are putting their effort in bring back the nation to itsnormalcy.
EquiOne - Live Cricket Quiz with Sumanth C Raman Exclusive Co Branded Debit Card
NRI Campaign with Kaleej Times
4th Year Anniversary Campaign A Comical Web Series – Durai Shakes

27
2,590 3,512
29,606
16,520
Q1FY21 Q2FY21
# Of Policies Issued
GI
LI
6.849.82
6.88
8.92
Q1FY21 Q2FY21
Premium Collected (Rs. Cr)
LI
GI
13.72
18.74
44%
30%
Traditional75.0%
Term12.0%
ULIP13.0%
Life InsurancePolicies Sold in Q2FY21
Grp H &PA72.0%
Covid11.0%
Motor12.0%
Health 3.0% PA& Others
2.0%
General InsurancePolicies Sold in Q2FY21
Overview of TPP Business
121.51 127.16
Q1FY21 Q2FY21
MF AUM (Rs. Cr)

28
Total 8.69 lac Cards Issued
Debit Card & Spends Snapshot
2,828
7,443 7,847
10,725
18,247
May June July Aug Sept
Month on Month FastTag Issuance
35,214
45,501
55,226 59,598
66,145 74,635
April May June July Aug Sept
Unique Card Transactions - ATM
24,391 80,049 85,103 91,426 1,02,687 1,06,477
3,79,665
Others RupayPlatinum
VisaSignature
VisaPlatinum
Visa Classic Visa VirtualDebit
RupayClassic
Cards Issued
26 27 25
11 15
22 23 25 28
1.50 1.50 1.50
0.70 0.80
1.20 1.30 1.30
1.50
0.20
0.40
0.60
0.80
1.00
1.20
1.40
1.60
0
5
10
15
20
25
30
Jan-20 Feb-20 Mar-20 Apr-20 May-20 Jun-20 Jul-20 Aug-20 Sep-20
Debit Card Transaction Trend
Spends (Rs. Cr) Transaction Count (in Lakhs)

29
As on 30 September 2020In Rs Cr June 2020 September 2020
TD 9,117 9,342
Refinance 4,963 5,570
CASA 2,354 3,246
CD 316 312
Sub Debt 220 220
Term Borrowing 110 260
IBPC 1,000 600
Repo Borrowing 233 124
Total Borrowings 18,313 19,675
47%
28%
16%
3% 2%1% 1% 1%
TD
Refinance
CASA
IBPC
Certificate of Deposit
Term Borrowing
Sub-ordinated Debt
RBI Borrowing
Funding Profile
6.21% 6.21% 6.02% 6.03% 5.86%6.43%
8.60% 8.56% 8.39% 8.23% 8.06% 7.90%
8.23% 8.25% 8.01% 7.77% 7.56% 7.36%
Q1FY20 Q2FY20 Q3FY20 Q4FY20 Q1FY21 Q2FY21
Daily Average Cost of Funds
Deposit cost - SA Deposit cost- TD Cost of Funds

30
Borrowings & Liquidity:
• Our Bank’s Certificate of Deposit (CD) programme for ₹2,000 Crore has highest rating from at CRISIL A1+
• Availed refinance of ₹1,100 Crore during Q2FY21 (₹685 Crore in Q1FY21). Our Bank has adequate advances to avail freshrefinance whenever required which provides strong cushion to ALM position of the Bank
• Our Bank has also undertaken Inter-Bank Participation Certificates (IBPCs) with a mix of PSL/Non-PSL advances which furtherenhances the liquidity of the Bank
• Adequate surplus liquidity in the form of High Quality Liquid Assets (HQLA) being maintained to fund advances growth. LiquidityCoverage Ratio (LCR) for the quarter at 126% much above the minimum regulatory requirement of LCR at 80%
Category (Rs. Cr) SLR (Book Value) Non SLR (Book Value)
Held Till Maturity 2,617 124
Available for Sale 1,524 -
Held for Trading 35 -
Total 4,176 124
Investments
Treasury
Total Investment Portfolio comprises SLR of Rs. 4,176 Crore (Book Value) and Non SLR of Rs. 124 Crore (Book Value) as given below:

31
Pan India Presence
State Wise Advances
54%13%
11%
4%
4%
4%
2%
2%
2%
2%
1%
1%
0.37%
0.33%
0.11%
Tamil Nadu
Maharashtra
Karnataka
Rajasthan
Madhya…
Gujarat
Haryana
Telangana
Delhi
Punjab
Andhra…
Chattisgarh
Chandigarh
Pondicherry
Uttar…
State Wise Deposits
28%19%
9%
7%
7%
7%
6%
4%
4%
3%
2%
2%
2%
1%
0.31%
Tamil Nadu
Maharash…
Karnataka
Punjab
Delhi
Haryana
Rajasthan
Chandigarh
Gujarat
Madhya…
Uttar…
Andhra…
Chattisgarh
Telangana
Pondichery
Banking Outlets

Financials
32
33
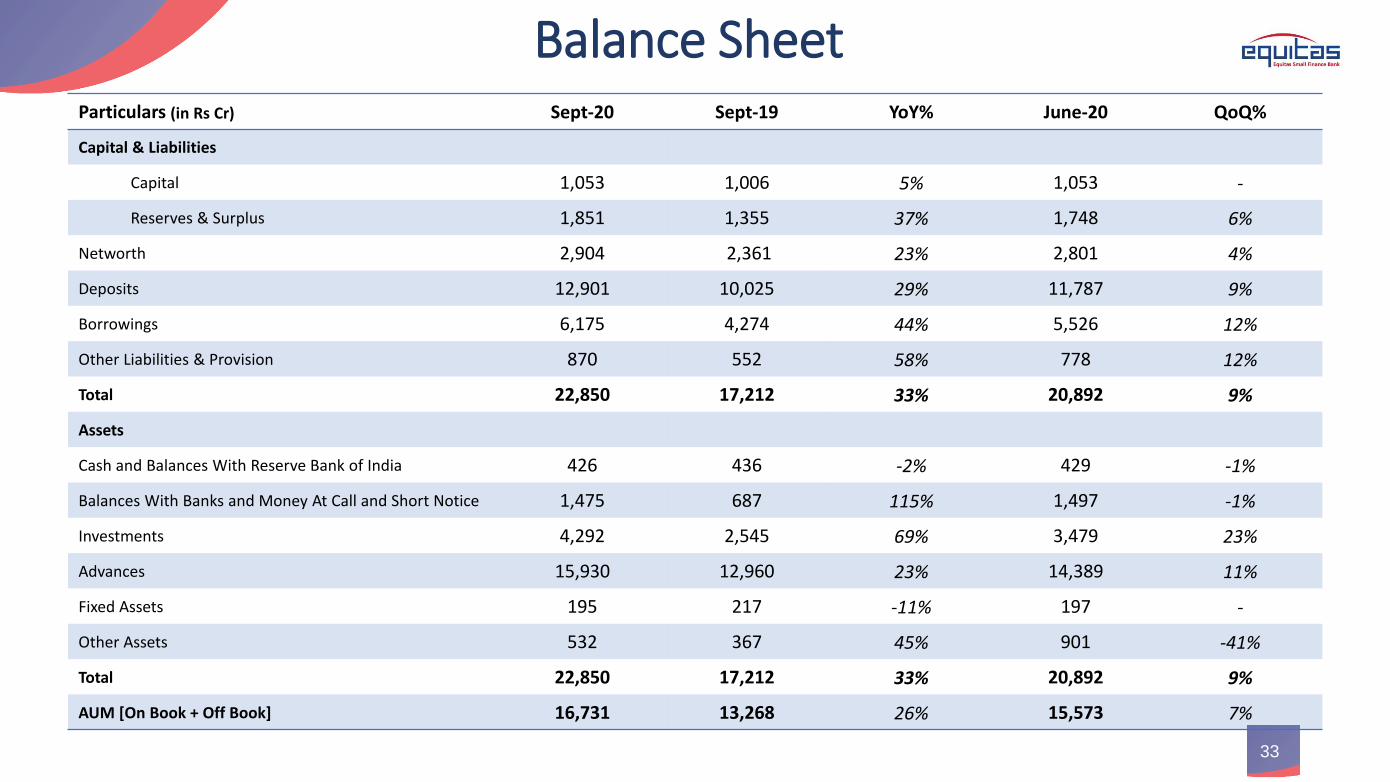
Particulars (in Rs Cr) Sept-20 Sept-19 YoY% June-20 QoQ%
Capital & Liabilities
Capital 1,053 1,006 5% 1,053 -
Reserves & Surplus 1,851 1,355 37% 1,748 6%
Networth 2,904 2,361 23% 2,801 4%
Deposits 12,901 10,025 29% 11,787 9%
Borrowings 6,175 4,274 44% 5,526 12%
Other Liabilities & Provision 870 552 58% 778 12%
Total 22,850 17,212 33% 20,892 9%
Assets
Cash and Balances With Reserve Bank of India 426 436 -2% 429 -1%
Balances With Banks and Money At Call and Short Notice 1,475 687 115% 1,497 -1%
Investments 4,292 2,545 69% 3,479 23%
Advances 15,930 12,960 23% 14,389 11%
Fixed Assets 195 217 -11% 197 -
Other Assets 532 367 45% 901 -41%
Total 22,850 17,212 33% 20,892 9%
AUM [On Book + Off Book] 16,731 13,268 26% 15,573 7%
Balance Sheet

34
Particulars (in Rs Cr) Q2FY21 Q2FY20 YoY% Q1FY21 QoQ%
Interest Income from Loans 730 581 26% 662 10%
Income on Investments 57 41 39% 44 30%
Interest on balances with Reserve Bank of India and other inter bank funds
11 18 -39% 16 -31%
Total Interest Income 798 640 25% 721 11%
Finance Cost
Interest on deposits 227 182 25% 209 9%
Interest on RBI / inter-bank borrowings 6 6 - 4 50%
Other interest 104 101 3% 104 -
Total Finance Cost 336 289 16% 317 6%
Net Interest Income 461 351 31% 404 14%
Other Income
Processing and Other Fees 37 43 -14% 11 236%
Interest on Securitization / Assignment 3 3 - - -
Gain on Sale of G-Secs 1 1 - 4 -75%
ATM Acquirer Fee Income & TPP Income 13 7 86% 10 30%
Others 10 10 - 5 150%
Total Other Income 64 64 - 30 113%
Profit & Loss Statement

35
Profit & Loss Statement
Particulars (in Rs Cr) Q2FY21 Q2FY20 YoY% Q1FY21 QoQ%
Net Income 525 415 27% 434 21%
Employee Cost 188 170 11% 195 -4%
Opex 117 114 3% 97 21%
Total Operating Expenditure 305 284 7% 292 4%
PBT before provision & Write-off 220 131 68% 142 55%
Credit Cost 84 45 87% 68 24%
PBT 136 86 58% 74 84%
Taxes 33 37 -11% 16 106%
PAT 103 49 108% 58 78%

Thank You
Investor Relations
Equitas Small Finance Bank Limited
4th Floor, Phase II, Spencer Plaza, No. 769, Mount Road, Anna
Salai, Chennai 600 002, Tamil Nadu
Twitter - @EquitasIR