Embed Size (px)
Citation preview
8/6/2019 Q1FY12 Results Tracker 17th August-Mansukh Investment and Trading
http://slidepdf.com/reader/full/q1fy12-results-tracker-17th-august-mansukh-investment-and-trading 1/5
Mansukh Securities and Finance LtdOffice: 306, Pratap Bhavan, 5, Bahadur Shah Zafar Marg, New Delhi-110002Phone: 011-30123450/1/3/5 Fax: 011-30117710 Email: [email protected]: www.moneysukh.com
SEBI Regn No. BSE: INB010985834 / NSE: INB23078143
PMS Regn No. INP000002387
Please refer to important disclosures at the end of this report For Private circulation Only For Our Clients Only
make more, for sur
Results Tracker Wednesday, 17 Aug 2011
Q1FY12
Admanum Fin Apollo Finvest HCL Infosystems SEL Vivid GlobAlumeco India Carnation Inds National Stand SHREMETAL
COMPANIES NAME
Results to be Declared on Wednesday, 17th Aug 2011
Results Announced on 16th Aug 2011 (Rs Mil lion)
Quarter ended Year to Date Year ended
201106 201006 % Var 201106 201006 % Var 201103 201003 % Var
Interest Earned 241974.4 184521.2 31.14 241974.4 184521.2 31.14 813943.6 709939.2 14.65
Other Income 35342.3 36899.6 -4.22 35342.3 36899.6 -4.22 158246 149681.5 5.72
Interest Expended 144979.1 111484 30.04 144979.1 111484 30.04 488679.6 473224.8 3.27
Operating Expenses 59913.2 59913.2 23.3 59913.2 48593.2 23.3 230154.3 203186.8 13.27
Operating Profit 0 0 0 0 0 0 0 0 0
Prov.& Contigencies 41569 15513.7 167.95 41569 15513.7 167.95 103813.4 43948.3 136.22
Tax 15019.9 16687.9 -10 15019.9 16687.9 -10 66897.1 47600.3 40.54
PAT 15835.5 29142 -45.66 15835.5 29142 -45.66 82645.2 91660.5 -9.84
Equity 6350 6348.8 0.02 6350 6348.8 0.02 6350 6348.8 0.02
OPM 29.93 33.24 -9.97 29.93 33.24 -9.97 31.13 25.81 20.62
SBI
A decent increase of about 31.14% in the sales to Rs. 241974.40 millions was observed for the quarter ended June 2011. The sales figu
stood at Rs. 184521.20 millions during the year-ago period.Net Profit of the company move down -45.66% to Rs. 15835.50 millions fro
Rs. 29142.00 millions in the same quarter last year.
Quarter ended Year to Date Year ended
201106 201006 % Var 201106 201006 % Var 201103 201003 % Var
Sales 7036.5 2147.3 227.69 7036.5 2147.3 227.69 18403.9 23666.2 -22.24
Other Income 157.8 122.9 28.4 157.8 122.9 28.4 936.2 232.6 302.49
PBIDT 6071.9 1830.7 231.67 6071.9 1830.7 231.67 14717 17238.9 -14.63
Interest 4570.8 1411.6 223.8 4570.8 1411.6 223.8 12566.1 12774 -1.63
PBDT 1501.1 419.1 258.17 1501.1 419.1 258.17 2150.9 4464.9 -51.83
Depreciation 46.6 27 72.59 46.6 27 72.59 143.3 181.6 -21.09
PBT 1454.5 392.1 270.95 1454.5 392.1 270.95 2007.6 4283.3 -53.13
TAX 67.3 -112 -160.09 67.3 -112 -160.09 -285.1 889.1 -132.07
Deferred Tax 0 -112 0 0 -112 0 -334 -5 6580
PAT 1387.2 504.1 175.18 1387.2 504.1 175.18 2292.7 3394.2 -32.45
Equity 2461.6 2461.6 0 2461.6 2461.6 0 2461.6 2461.6 0
PBIDTM(%) 86.29 85.26 1.21 86.29 85.26 1.21 79.97 72.84 9.78
Reliance Capital
The total revenue for the June 2011 quarter zoomed 227.69% to Rs. 7036.50 millions as compared to Rs. 2147.30 millions during the yea
ago period.The Total revenue for the quarter ended June 2011 of Rs. 1387.20 millions grew by 175.18% from Rs. 504.
millions.Operating Profit saw a handsome growth to 6071.90 millions from 1830.70 millions in the quarter ended June 2011.
8/6/2019 Q1FY12 Results Tracker 17th August-Mansukh Investment and Trading
http://slidepdf.com/reader/full/q1fy12-results-tracker-17th-august-mansukh-investment-and-trading 2/5
Mansukh Securities and Finance LtdOffice: 306, Pratap Bhavan, 5, Bahadur Shah Zafar Marg, New Delhi-110002Phone: 011-30123450/1/3/5 Fax: 011-30117710 Email: [email protected]: www.moneysukh.com
SEBI Regn No. BSE: INB010985834 / NSE: INB23078143
PMS Regn No. INP000002387
Please refer to important disclosures at the end of this report For Private circulation Only For Our Clients Only
make more, for sur
Results Tracker Q1FY12
Quarter ended Year to Date Year ended
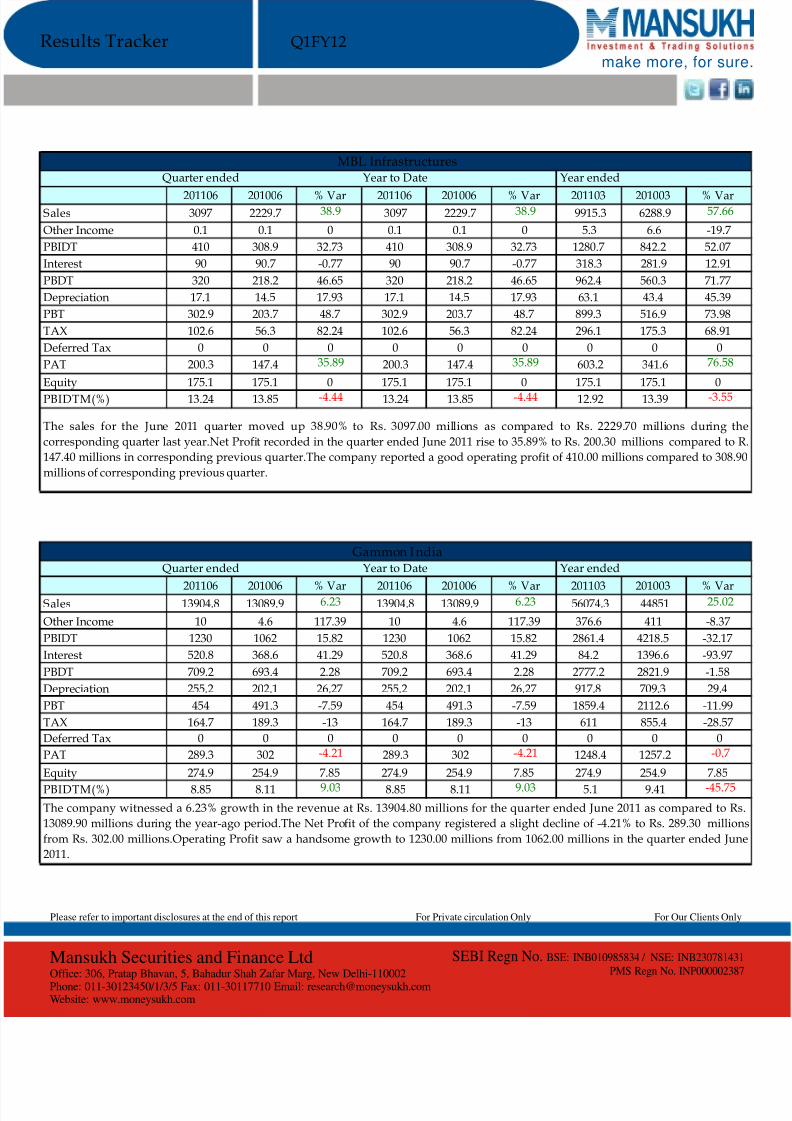
201106 201006 % Var 201106 201006 % Var 201103 201003 % VarSales 3097 2229.7 38.9 3097 2229.7 38.9 9915.3 6288.9 57.66
Other Income 0.1 0.1 0 0.1 0.1 0 5.3 6.6 -19.7
PBIDT 410 308.9 32.73 410 308.9 32.73 1280.7 842.2 52.07
Interest 90 90.7 -0.77 90 90.7 -0.77 318.3 281.9 12.91
PBDT 320 218.2 46.65 320 218.2 46.65 962.4 560.3 71.77
Depreciation 17.1 14.5 17.93 17.1 14.5 17.93 63.1 43.4 45.39
PBT 302.9 203.7 48.7 302.9 203.7 48.7 899.3 516.9 73.98
TAX 102.6 56.3 82.24 102.6 56.3 82.24 296.1 175.3 68.91
Deferred Tax 0 0 0 0 0 0 0 0 0
PAT 200.3 147.4 35.89 200.3 147.4 35.89 603.2 341.6 76.58
Equity 175.1 175.1 0 175.1 175.1 0 175.1 175.1 0
PBIDTM(%) 13.24 13.85 -4.44 13.24 13.85 -4.44 12.92 13.39 -3.55
Quarter ended Year to Date Year ended
201106 201006 % Var 201106 201006 % Var 201103 201003 % VarSales 13904.8 13089.9 6.23 13904.8 13089.9 6.23 56074.3 44851 25.02
Other Income 10 4.6 117.39 10 4.6 117.39 376.6 411 -8.37
PBIDT 1230 1062 15.82 1230 1062 15.82 2861.4 4218.5 -32.17
Interest 520.8 368.6 41.29 520.8 368.6 41.29 84.2 1396.6 -93.97
PBDT 709.2 693.4 2.28 709.2 693.4 2.28 2777.2 2821.9 -1.58
Depreciation 255.2 202.1 26.27 255.2 202.1 26.27 917.8 709.3 29.4
PBT 454 491.3 -7.59 454 491.3 -7.59 1859.4 2112.6 -11.99
TAX 164.7 189.3 -13 164.7 189.3 -13 611 855.4 -28.57
Deferred Tax 0 0 0 0 0 0 0 0 0
PAT 289.3 302 -4.21 289.3 302 -4.21 1248.4 1257.2 -0.7
Equity 274.9 254.9 7.85 274.9 254.9 7.85 274.9 254.9 7.85
PBIDTM(%) 8.85 8.11 9.03 8.85 8.11 9.03 5.1 9.41 -45.75
The sales for the June 2011 quarter moved up 38.90% to Rs. 3097.00 millions as compared to Rs. 2229.70 millions during th
corresponding quarter last year.Net Profit recorded in the quarter ended June 2011 rise to 35.89% to Rs. 200.30 millions compared to
147.40 millions in corresponding previous quarter.The company reported a good operating profit of 410.00 millions compared to 308.9
millions of corresponding previous quarter.
Gammon India
MBL Infrastructures
The company witnessed a 6.23% growth in the revenue at Rs. 13904.80 millions for the quarter ended June 2011 as compared to R
13089.90 millions during the year-ago period.The Net Profit of the company registered a slight decline of -4.21% to Rs. 289.30 millio
from Rs. 302.00 millions.Operating Profit saw a handsome growth to 1230.00 millions from 1062.00 millions in the quarter ended Jun
2011.
8/6/2019 Q1FY12 Results Tracker 17th August-Mansukh Investment and Trading
http://slidepdf.com/reader/full/q1fy12-results-tracker-17th-august-mansukh-investment-and-trading 3/5
Mansukh Securities and Finance LtdOffice: 306, Pratap Bhavan, 5, Bahadur Shah Zafar Marg, New Delhi-110002Phone: 011-30123450/1/3/5 Fax: 011-30117710 Email: [email protected]: www.moneysukh.com
SEBI Regn No. BSE: INB010985834 / NSE: INB23078143
PMS Regn No. INP000002387
Please refer to important disclosures at the end of this report For Private circulation Only For Our Clients Only
make more, for sur
Results Tracker Q1FY12
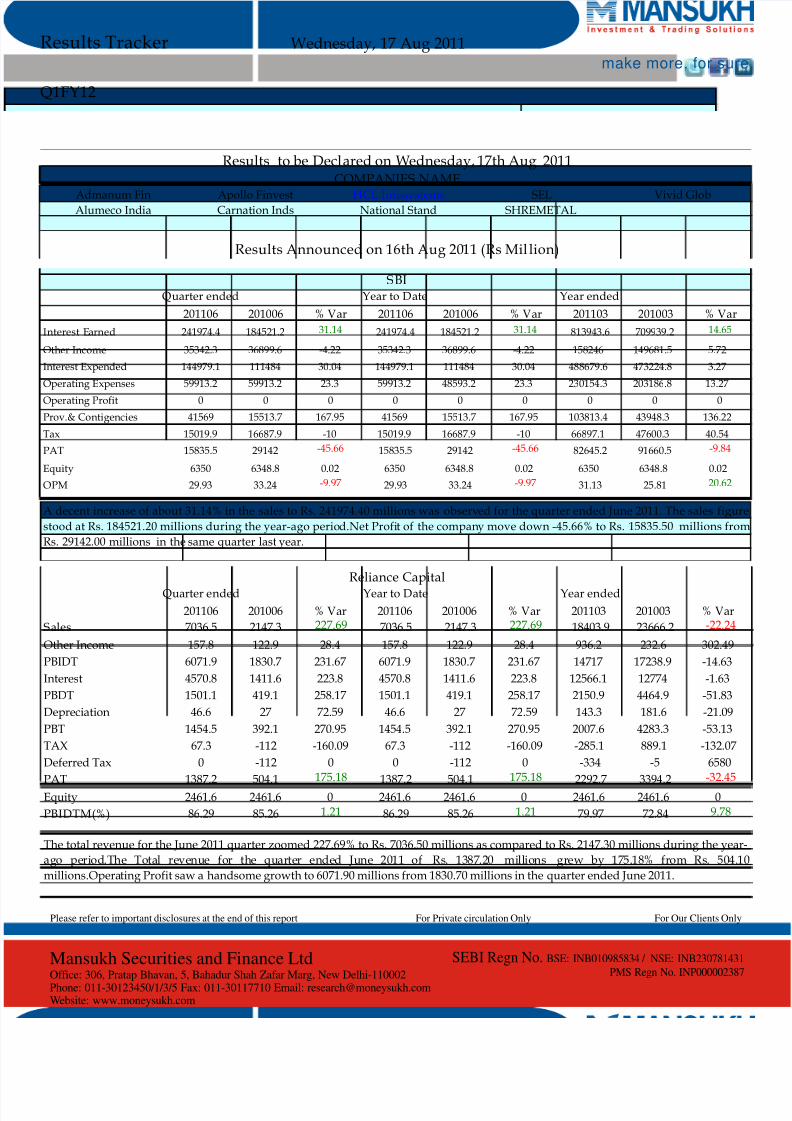
Quarter ended Year to Date Year ended
201106 201006 % Var 201106 201006 % Var 201103 201003 % Var
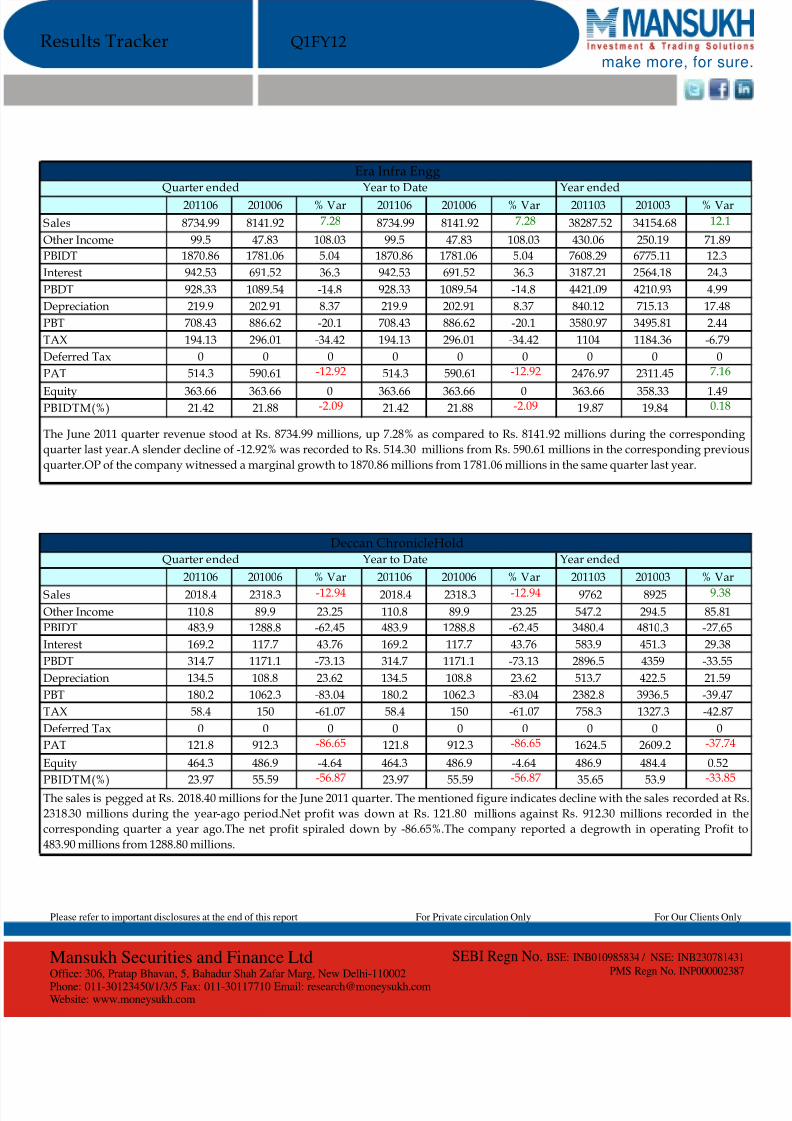
Sales 8734.99 8141.92 7.28 8734.99 8141.92 7.28 38287.52 34154.68 12.1
Other Income 99.5 47.83 108.03 99.5 47.83 108.03 430.06 250.19 71.89
PBIDT 1870.86 1781.06 5.04 1870.86 1781.06 5.04 7608.29 6775.11 12.3
Interest 942.53 691.52 36.3 942.53 691.52 36.3 3187.21 2564.18 24.3
PBDT 928.33 1089.54 -14.8 928.33 1089.54 -14.8 4421.09 4210.93 4.99
Depreciation 219.9 202.91 8.37 219.9 202.91 8.37 840.12 715.13 17.48
PBT 708.43 886.62 -20.1 708.43 886.62 -20.1 3580.97 3495.81 2.44
TAX 194.13 296.01 -34.42 194.13 296.01 -34.42 1104 1184.36 -6.79
Deferred Tax 0 0 0 0 0 0 0 0 0
PAT 514.3 590.61 -12.92 514.3 590.61 -12.92 2476.97 2311.45 7.16
Equity 363.66 363.66 0 363.66 363.66 0 363.66 358.33 1.49PBIDTM(%) 21.42 21.88 -2.09 21.42 21.88 -2.09 19.87 19.84 0.18
Quarter ended Year to Date Year ended
201106 201006 % Var 201106 201006 % Var 201103 201003 % Var
Sales 2018.4 2318.3 -12.94 2018.4 2318.3 -12.94 9762 8925 9.38
Other Income 110.8 89.9 23.25 110.8 89.9 23.25 547.2 294.5 85.81
PBIDT 483.9 1288.8 -62.45 483.9 1288.8 -62.45 3480.4 4810.3 -27.65
Interest 169.2 117.7 43.76 169.2 117.7 43.76 583.9 451.3 29.38
PBDT 314.7 1171.1 -73.13 314.7 1171.1 -73.13 2896.5 4359 -33.55
Depreciation 134.5 108.8 23.62 134.5 108.8 23.62 513.7 422.5 21.59
PBT 180.2 1062.3 -83.04 180.2 1062.3 -83.04 2382.8 3936.5 -39.47
TAX 58.4 150 -61.07 58.4 150 -61.07 758.3 1327.3 -42.87
Deferred Tax 0 0 0 0 0 0 0 0 0
PAT 121.8 912.3 -86.65 121.8 912.3 -86.65 1624.5 2609.2 -37.74
Equity 464.3 486.9 -4.64 464.3 486.9 -4.64 486.9 484.4 0.52
PBIDTM(%) 23.97 55.59-56.87
23.97 55.59-56.87
35.65 53.9-33.85
Era Infra Engg
The June 2011 quarter revenue stood at Rs. 8734.99 millions, up 7.28% as compared to Rs. 8141.92 millions during the correspondin
quarter last year.A slender decline of -12.92% was recorded to Rs. 514.30 millions from Rs. 590.61 millions in the corresponding previo
quarter.OP of the company witnessed a marginal growth to 1870.86 millions from 1781.06 millions in the same quarter last year.
Deccan ChronicleHold
The sales is pegged at Rs. 2018.40 millions for the June 2011 quarter. The mentioned figure indicates decline with the sales recorded at R
2318.30 millions during the year-ago period.Net profit was down at Rs. 121.80 millions against Rs. 912.30 millions recorded in th
corresponding quarter a year ago.The net profit spiraled down by -86.65%.The company reported a degrowth in operating Profit t
483.90 millions from 1288.80 millions.

8/6/2019 Q1FY12 Results Tracker 17th August-Mansukh Investment and Trading
http://slidepdf.com/reader/full/q1fy12-results-tracker-17th-august-mansukh-investment-and-trading 4/5
Mansukh Securities and Finance LtdOffice: 306, Pratap Bhavan, 5, Bahadur Shah Zafar Marg, New Delhi-110002Phone: 011-30123450/1/3/5 Fax: 011-30117710 Email: [email protected]: www.moneysukh.com
SEBI Regn No. BSE: INB010985834 / NSE: INB23078143
PMS Regn No. INP000002387
Please refer to important disclosures at the end of this report For Private circulation Only For Our Clients Only
make more, for sur
Results Tracker Q1FY12
Quarter ended Year to Date Year ended
201106 201006 % Var 201106 201006 % Var 201103 201003 % Var
Sales 4055.5 3577.56 13.36 4055.5 3577.56 13.36 16082.15 11446.33 40.5
Other Income 14.34 25.04 -42.73 14.34 25.04 -42.73 0 0 0
PBIDT 700.57 563.89 24.24 700.57 563.89 24.24 2567.05 1733.8 48.06
Interest 318.03 197.31 61.18 318.03 197.31 61.18 992.03 623.62 59.08
PBDT 382.54 366.58 4.35 382.54 366.58 4.35 1575.02 1110.18 41.87
Depreciation 79.24 75.01 5.64 79.24 75.01 5.64 264.88 205.55 28.86
PBT 303.3 291.57 4.02 303.3 291.57 4.02 1310.14 904.63 44.83
TAX 60.66 58.11 4.39 60.66 58.11 4.39 261.11 144.03 81.29
Deferred Tax 0 0 0 0 0 0 0 0 0
PAT 242.64 233.46 3.93 242.64 233.46 3.93 1049.03 760.6 37.92
Equity 202.75 144.68 40.14 202.75 144.68 40.14 192.75 144.68 33.23PBIDTM(%) 17.27 15.76 9.6 17.27 15.76 9.6 15.96 15.15 5.38
Quarter ended Year to Date Year ended
201106 201006 % Var 201106 201006 % Var 201103 201003 % Var
Sales 267.93 207.48 29.14 267.93 207.48 29.14 1095.3 814.96 34.4
Other Income 0 0 0 0 0 0 0 0 0
PBIDT 235.95 189.07 24.8 235.95 189.07 24.8 1122.88 811.15 38.43
Interest 125.79 92.09 36.59 125.79 92.09 36.59 416.38 331.31 25.68
PBDT 110.16 96.98 13.59 110.16 96.98 13.59 706.5 479.84 47.24
Depreciation 4.31 4.45 -3.15 4.31 4.45 -3.15 18.5 19.13 -3.29
PBT 105.85 92.53 14.4 105.85 92.53 14.4 688 460.72 49.33
TAX 25.6 22.5 13.78 25.6 22.5 13.78 243.9 119.95 103.33
Deferred Tax 0 0 0 0 0 0 3.02 -25.41 -111.89
PAT 80.25 70.03 14.59 80.25 70.03 14.59 444.1 340.77 30.32
Equity 807.17 807.17 0 807.17 807.17 0 807.17 807.17 0
PBIDTM(%) 88.06 91.13-3.36
88.06 91.13-3.36
102.52 99.533
Surya Pharma
The revenue zoomed 13.36% to Rs. 4055.50 millions for the quarter ended June 2011 as compared to Rs. 3577.56 millions during th
corresponding quarter last year.Net profit for the quarter ended June 2011 increases to Rs. 242.64 millions from Rs. 233.4
millions.Operating Profit saw a handsome growth to 700.57 millions from 563.89 millions in the quarter ended June 2011.
Tourism Finance Co
A decent increase of about 29.14% in the sales to Rs. 267.93 millions was observed for the quarter ended June 2011. The sales figure stoo
at Rs. 207.48 millions during the year-ago period.A humble growth in net profit of 14.59% reported in the quarter ended June 2011 to R
80.25 millions from Rs. 70.03 millions.Operating Profit saw a handsome growth to 235.95 millions from 189.07 millions in the quart
ended June 2011.

8/6/2019 Q1FY12 Results Tracker 17th August-Mansukh Investment and Trading
http://slidepdf.com/reader/full/q1fy12-results-tracker-17th-august-mansukh-investment-and-trading 5/5
SEBI Regn No. BSE: INB010985834 / NSE: INB23078143
PMS Regn No. INP000002387Mansukh Securities and Finance LtdOffice: 306, Pratap Bhavan, 5, Bahadur Shah Zafar Marg, New Delhi-110002Phone: 011-30123450/1/3/5 Fax: 011-30117710 Email: [email protected]: www.moneysukh.com
SEBI Regn No. BSE: INB010985834 / NSE: INB23078143
PMS Regn No. INP000002387
Please refer to important disclosures at the end of this report For Private circulation Only For Our Clients Only
make more, for sur
Data Source : ACE Equity
his report is for the personal information of the authorized recipient and does not construe to be any investment, legal or taxation advice to yoansukh Securities and Finance Ltd (hereinafter referred as MSFL) is not soliciting any action based on it. This report is not for public distribution an
as been furnished to you solely for your information and should not be reproduced or redistributed to any person in any form.he report is based upon information that we consider reliable, but we do not represent that it is accurate or complete. MSFL or any of its affiliates mployees shall not be in any way responsible for any loss or damage that may arise to any person from any inadvertent error in the informatioontained in this report. MSFL or any of its affiliates or employees do not provide, at any time, any express or implied warranty of any kind, regardin
any matter pertaining to this report, including without limitation the implied warranties of merchantability, fitness for a particular purpose, and nonfringement. The recipients of this report should rely on their own investigations.
SFL and/or its affiliates and/or employees may have interests/positions, financial or otherwise in the securities mentioned in this report. Thnformation is subject to change without any prior notice. MSFL reserves the right to make modifications and alterations to this statement as may equired from time to time. Nevertheless, MSFL is committed to providing independent and transparent recommendations to its clients, and would appy to provide information in response to specific client queries.
NAME DESIGNATION E-MAIL
Varun Gupta Head - Research [email protected]
Pashupati Nath Jha Research Analyst [email protected]
Vikram Singh Research Analyst [email protected]
Results Tracker Q1FY12