Embed Size (px)
Citation preview
8/6/2019 Monthly Magzine- Aug 2011-Mansukh Investment and Trading Solutions..
http://slidepdf.com/reader/full/monthly-magzine-aug-2011-mansukh-investment-and-trading-solutions 1/8
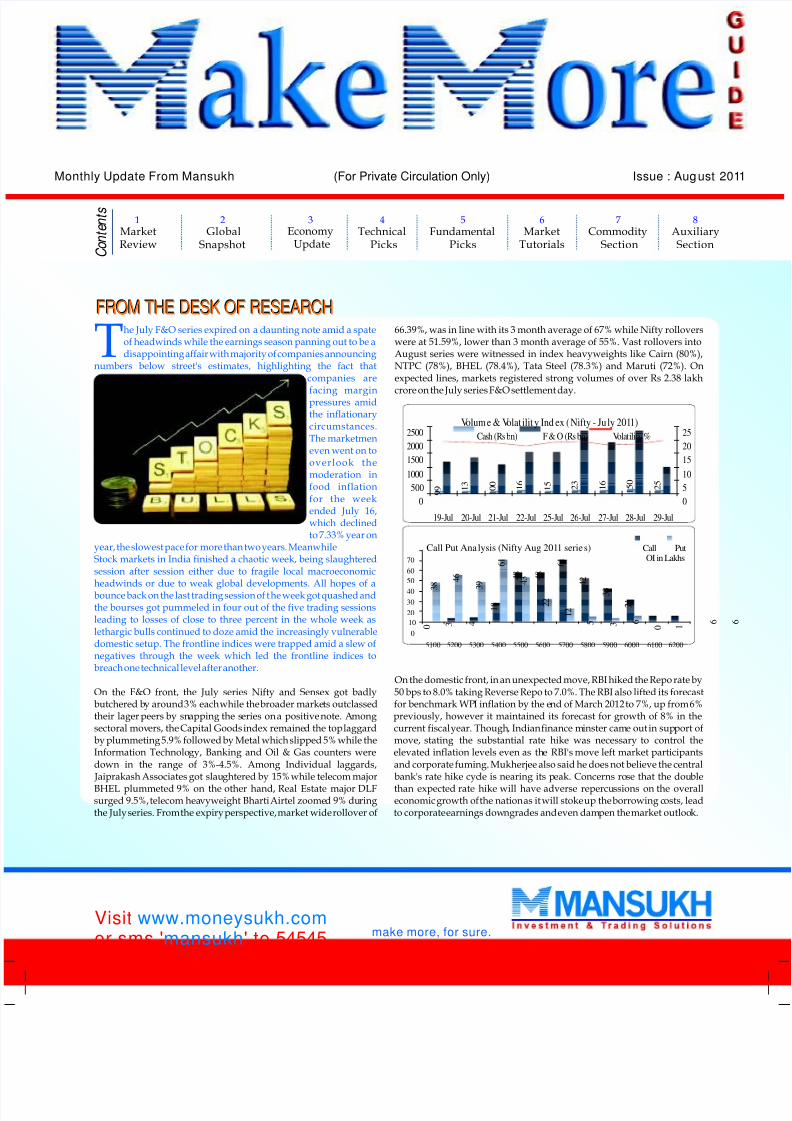
he July F&O series expired on a daunting note amid a spateof headwinds while the earnings season panning out to be adisappointing affair with majority of companies announcingT
numbers below street's estimates, highlighting the fact thatcompanies are
facing marginpressures amidthe inflationarycircumstances.The marketmeneven went on tooverlook themoderation infood inflationfor the weekended July 16,which declinedto 7.33% year on
year, the slowest pace for more than two years. MeanwhileStock markets in India finished a chaotic week, being slaughteredsession after session either due to fragile local macroeconomicheadwinds or due to weak global developments. All hopes of abounce back on the last trading session of the week got quashed andthe bourses got pummeled in four out of the five trading sessionsleading to losses of close to three percent in the whole week aslethargic bulls continued to doze amid the increasingly vulnerabledomestic setup. The frontline indices were trapped amid a slew ofnegatives through the week which led the frontline indices tobreach one technical level after another.
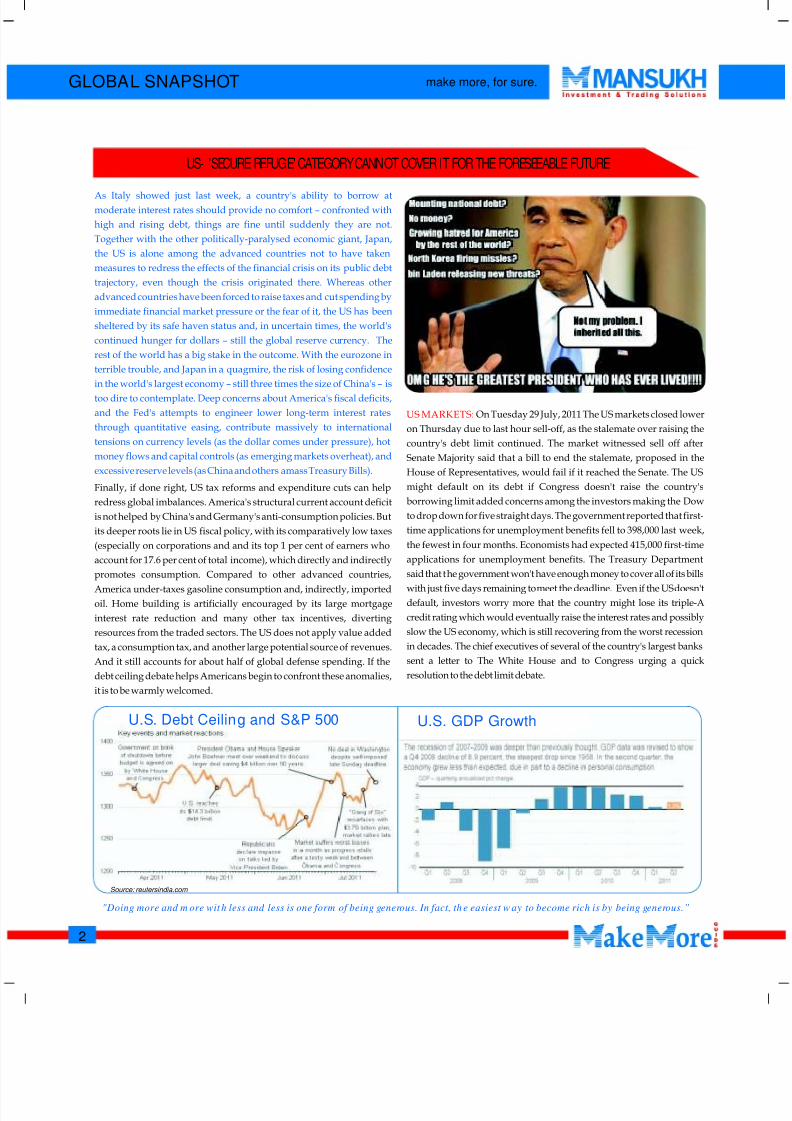
66.39%, was in line with its 3 month average of 67% while Nifty rolloverswere at 51.59%, lower than 3 month average of 55%. Vast rollovers intoAugust series were witnessed in index heavyweights like Cairn (80%),NTPC (78%), BHEL (78.4%), Tata Steel (78.3%) and Maruti (72%). Onexpected lines, markets registered strong volumes of over Rs 2.38 lakh
crore on the July series F&O settlement day.
On the domestic front, in an unexpected move, RBI hiked the Repo rate byOn the F&O front, the July series Nifty and Sensex got badly 50 bps to 8.0% taking Reverse Repo to 7.0%. The RBI also lifted its forecastbutchered by around 3% each while the broader markets outclassed for benchmark WPI inflation by the end of March 2012 to 7%, up from 6%their lager peers by snapping the series on a positive note. Among previously, however it maintained its forecast for growth of 8% in thesectoral movers, the Capital Goods index remained the top laggard current fiscal year. Though, Indian finance minster came out in support ofby plummeting 5.9% followed by Metal which slipped 5% while the move, stating the substantial rate hike was necessary to control theInformation Technology, Banking and Oil & Gas counters were elevated inflation levels even as the RBI's move left market participantsdown in the range of 3%-4.5%. Among Individual laggards, and corporate fuming. Mukherjee also said he does not believe the central Jaiprakash Associates got slaughtered by 15% while telecom major bank's rate hike cycle is nearing its peak. Concerns rose that the doubleBHEL plummeted 9% on the other hand, Real Estate major DLF than expected rate hike will have adverse repercussions on the overallsurged 9.5%, telecom heavyweight Bharti Airtel zoomed 9% during economic growth of the nation as it will stoke up the borrowing costs, leadthe July series. From the expiry perspective, market wide rollover of to corporate earnings downgrades and even dampen the market outlook.
FROM THE DESK OF RESEARCHFROM THE DESK OF RESEARCH
Monthly Update From Mansukh (For Private Circulation Only) Issue : Aug ust 2011
Visitor sms ' ' to 54545
www.moneysukh.commansukh make more, for sure.
C o n t e n t s
MarketReview
1Global
Snapshot
2Economy
Update
3Technical
Picks
4Fundamental
Picks
5Market
Tutorials
6Commodity
Section
7AuxiliarySection
8
Call Put Ana lysis (Nifty Aug 2011 serie s)
0 3 4
1 8
4 8
4 8
6 1
4 2
3 3
2 1
6
3
84
6
3 9
6 1
4 3
2 2
1 2
5 3 6 0 1
0
10
20
30
40
50
60
70
5100 5200 5300 5400 5500 5600 5700 5800 5900 6000 6100 6200
OI in LakhsCall Put
Volume & Volat ilit y Ind ex (Nifty - Ju ly 2011)
9 9
1 1 3
1 0 0
1 1 6
1 1 5
1 2 3
1 1 6
1 5 0
1 2 5
0500
1000150020002500
19-Jul 20-Jul 21-Jul 22-Jul 25-Jul 26-Jul 27-Jul 28-Jul 29-Jul
0510152025Cash (Rs bn) F & O (Rs bn) Volatility %
8/6/2019 Monthly Magzine- Aug 2011-Mansukh Investment and Trading Solutions..
http://slidepdf.com/reader/full/monthly-magzine-aug-2011-mansukh-investment-and-trading-solutions 2/8
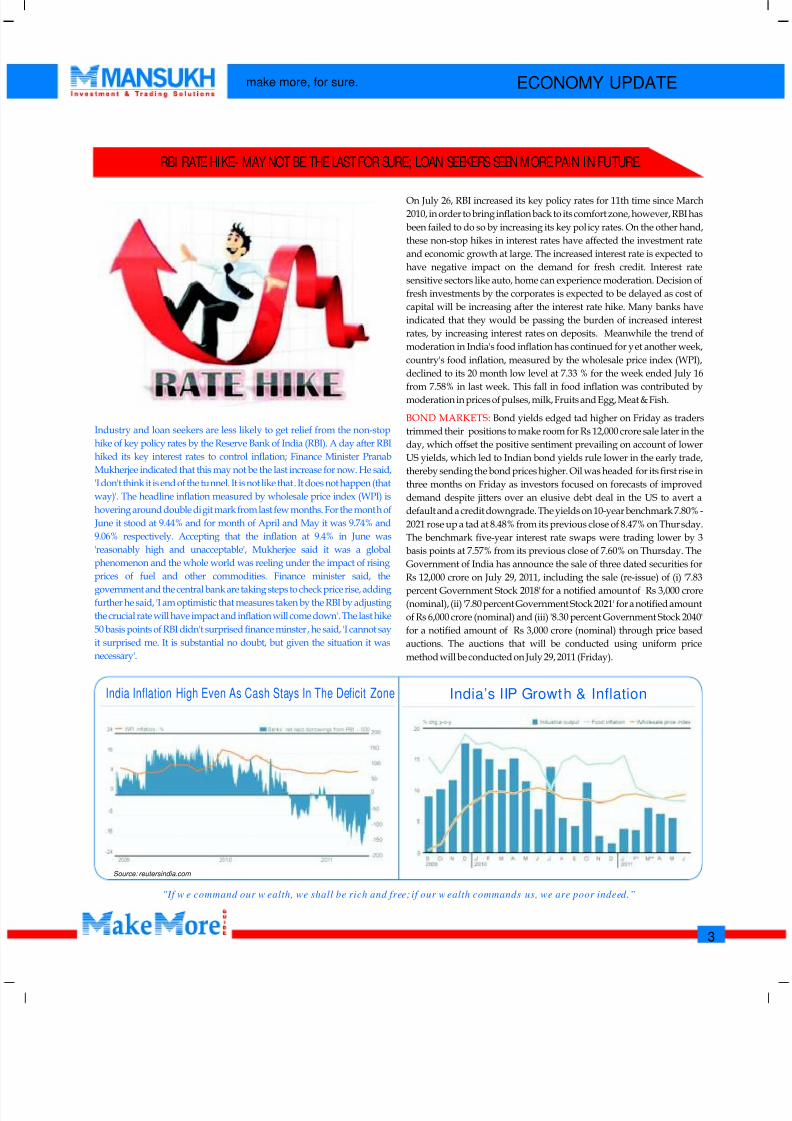
As Italy showed just last week, a country's ability to borrow atmoderate interest rates should provide no comfort – confronted withhigh and rising debt, things are fine until suddenly they are not.Together with the other politically-paralysed economic giant, Japan,the US is alone among the advanced countries not to have takenmeasures to redress the effects of the financial crisis on its public debttrajectory, even though the crisis originated there. Whereas otheradvanced countries have been forced to raise taxes and cut spending byimmediate financial market pressure or the fear of it, the US has beensheltered by its safe haven status and, in uncertain times, the world'scontinued hunger for dollars – still the global reserve currency. Therest of the world has a big stake in the outcome. With the eurozone interrible trouble, and Japan in a quagmire, the risk of losing confidencein the world's largest economy – still three times the size of China's – istoo dire to contemplate. Deep concerns about America's fiscal deficits,and the Fed's attempts to engineer lower long-term interest ratesthrough quantitative easing, contribute massively to internationaltensions on currency levels (as the dollar comes under pressure), hotmoney flows and capital controls (as emerging markets overheat), andexcessive reserve levels (as China and others amass Treasury Bills).
On Tuesday 29 July, 2011 The US markets closed loweron Thursday due to last hour sell-off, as the stalemate over raising thecountry's debt limit continued. The market witnessed sell off afterSenate Majority said that a bill to end the stalemate, proposed in theHouse of Representatives, would fail if it reached the Senate. The USmight default on its debt if Congress doesn't raise the country'sFinally, if done right, US tax reforms and expenditure cuts can helpborrowing limit added concerns among the investors making the Dowredress global imbalances. America's structural current account deficitto drop down for five straight days. The government reported that first-is not helped by China's and Germany's anti-consumption policies. Buttime applications for unemployment benefits fell to 398,000 last week,its deeper roots lie in US fiscal policy, with its comparatively low taxesthe fewest in four months. Economists had expected 415,000 first-time(especially on corporations and and its top 1 per cent of earners whoapplications for unemployment benefits. The Treasury Departmentaccount for 17.6 per cent of total income), which directly and indirectlysaid that the government won't have enough money to cover all of its billspromotes consumption. Compared to other advanced countries,
with just five days remaining to meet the deadline. Even if the US doesn'tAmerica under-taxes gasoline consumption and, indirectly, importeddefault, investors worry more that the country might lose its triple-Aoil. Home building is artificially encouraged by its large mortgagecredit rating which would eventually raise the interest rates and possiblyinterest rate reduction and many other tax incentives, divertingslow the US economy, which is still recovering from the worst recessionresources from the traded sectors. The US does not apply value addedin decades. The chief executives of several of the country's largest bankstax, a consumption tax, and another large potential source of revenues.sent a letter to The White House and to Congress urging a quickAnd it still accounts for about half of global defense spending. If theresolution to the debt limit debate.debt ceiling debate helps Americans begin to confront these anomalies,
it is to be warmly welcomed.
US MARKETS:
2
GLOBAL SNAPSHOT make more, for sure.
US- 'SECURE REFUGE' CATEGORY CANNOT COVER IT FOR THE FORESEEABLE FUTURE
"Doing more and m ore wit h less and less is one form of being generous. In fact, th e easiest w ay to become rich is by being generous.”
Source: reutersindia.com
U.S. GDP GrowthU.S. Debt Ceiling and S&P 500
8/6/2019 Monthly Magzine- Aug 2011-Mansukh Investment and Trading Solutions..
http://slidepdf.com/reader/full/monthly-magzine-aug-2011-mansukh-investment-and-trading-solutions 3/8
3
ECONOMY UPDATEmake more, for sure.
Industry and loan seekers are less likely to get relief from the non-stophike of key policy rates by the Reserve Bank of India (RBI). A day after RBIhiked its key interest rates to control inflation; Finance Minister PranabMukherjee indicated that this may not be the last increase for now. He said,'I don't think it is end of the tunnel. It is not like that. It does not happen (thatway)'. The headline inflation measured by wholesale price index (WPI) ishovering around double digit mark from last few months. For the month of June it stood at 9.44% and for month of April and May it was 9.74% and9.06% respectively. Accepting that the inflation at 9.4% in June was'reasonably high and unacceptable', Mukherjee said it was a globalphenomenon and the whole world was reeling under the impact of risingprices of fuel and other commodities. Finance minister said, the
government and the central bank are taking steps to check price rise, addingfurther he said, 'I am optimistic that measures taken by the RBI by adjustingthe crucial rate will have impact and inflation will come down'. The last hike50 basis points of RBI didn't surprised finance minster, he said, 'I cannot sayit surprised me. It is substantial no doubt, but given the situation it wasnecessary'.
On July 26, RBI increased its key policy rates for 11th time since March2010, in order to bring inflation back to its comfort zone, however, RBI hasbeen failed to do so by increasing its key policy rates. On the other hand,these non-stop hikes in interest rates have affected the investment rateand economic growth at large. The increased interest rate is expected tohave negative impact on the demand for fresh credit. Interest ratesensitive sectors like auto, home can experience moderation. Decision offresh investments by the corporates is expected to be delayed as cost ofcapital will be increasing after the interest rate hike. Many banks haveindicated that they would be passing the burden of increased interestrates, by increasing interest rates on deposits. Meanwhile the trend ofmoderation in India's food inflation has continued for yet another week,country's food inflation, measured by the wholesale price index (WPI),declined to its 20 month low level at 7.33 % for the week ended July 16from 7.58% in last week. This fall in food inflation was contributed bymoderation in prices of pulses, milk, Fruits and Egg, Meat & Fish.
Bond yields edged tad higher on Friday as traderstrimmed their positions to make room for Rs 12,000 crore sale later in theday, which offset the positive sentiment prevailing on account of lowerUS yields, which led to Indian bond yields rule lower in the early trade,thereby sending the bond prices higher. Oil was headed for its first rise inthree months on Friday as investors focused on forecasts of improveddemand despite jitters over an elusive debt deal in the US to avert adefault and a credit downgrade. The yields on 10-year benchmark 7.80% -2021 rose up a tad at 8.48% from its previous close of 8.47% on Thursday.The benchmark five-year interest rate swaps were trading lower by 3basis points at 7.57% from its previous close of 7.60% on Thursday. TheGovernment of India has announce the sale of three dated securities forRs 12,000 crore on July 29, 2011, including the sale (re-issue) of (i) '7.83percent Government Stock 2018' for a notified amount of Rs 3,000 crore(nominal), (ii) '7.80 percent Government Stock 2021' for a notified amountof Rs 6,000 crore (nominal) and (iii) '8.30 percent Government Stock 2040'for a notified amount of Rs 3,000 crore (nominal) through price basedauctions. The auctions that will be conducted using uniform pricemethod will be conducted on July 29, 2011 (Friday).
BOND MARKETS:
RBI RATE HIKE- MAY NOT BE THE LAST FOR SURE; LOAN SEEKERS SEEN MORE PAIN IN FUTURE.
"If w e command our w ealth, we shall be rich and free; if our w ealth commands us, we are poor indeed.”
Source: reutersindia.com
India’s IIP Growth & InflationIndia Inflation High Even As Cash Stays In The Deficit Zone
8/6/2019 Monthly Magzine- Aug 2011-Mansukh Investment and Trading Solutions..
http://slidepdf.com/reader/full/monthly-magzine-aug-2011-mansukh-investment-and-trading-solutions 4/8
TECHNICAL PICKS
4
make more, for sure.
DR. REDDY'S LABORATORIES LTD
QUANTITATIVE ANALYSIS
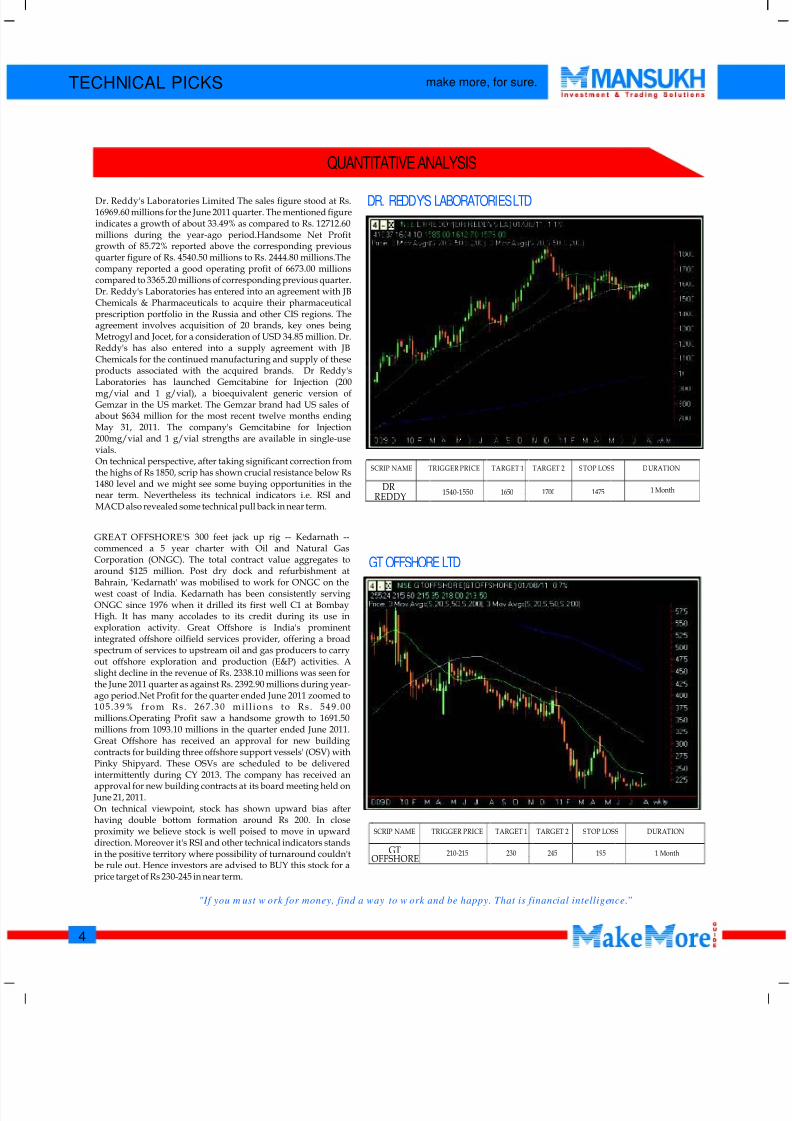
Dr. Reddy's Laboratories Limited The sales figure stood at Rs.16969.60 millions for the June 2011 quarter. The mentioned figureindicates a growth of about 33.49% as compared to Rs. 12712.60millions during the year-ago period.Handsome Net Profitgrowth of 85.72% reported above the corresponding previousquarter figure of Rs. 4540.50 millions to Rs. 2444.80 millions.Thecompany reported a good operating profit of 6673.00 millionscompared to 3365.20 millions of corresponding previous quarter.Dr. Reddy's Laboratories has entered into an agreement with JBChemicals & Pharmaceuticals to acquire their pharmaceuticalprescription portfolio in the Russia and other CIS regions. Theagreement involves acquisition of 20 brands, key ones beingMetrogyl and Jocet, for a consideration of USD 34.85 million. Dr.Reddy's has also entered into a supply agreement with JBChemicals for the continued manufacturing and supply of theseproducts associated with the acquired brands. Dr Reddy'sLaboratories has launched Gemcitabine for Injection (200mg/vial and 1 g/vial), a bioequivalent generic version ofGemzar in the US market. The Gemzar brand had US sales ofabout $634 million for the most recent twelve months endingMay 31, 2011. The company's Gemcitabine for Injection200mg/vial and 1 g/vial strengths are available in single-usevials.On technical perspective, after taking significant correction fromthe highs of Rs 1850, scrip has shown crucial resistance below Rs1480 level and we might see some buying opportunities in thenear term. Nevertheless its technical indicators i.e. RSI andMACD also revealed some technical pull back in near term.
SCRIP NAME
TRIGGER PRICE
TARGET 1
TARGET 2 S TOP LOSS DURATION
DRREDDY
1540-1550 1650 1700 1475 1 Month
GT OFFSHORE LTD
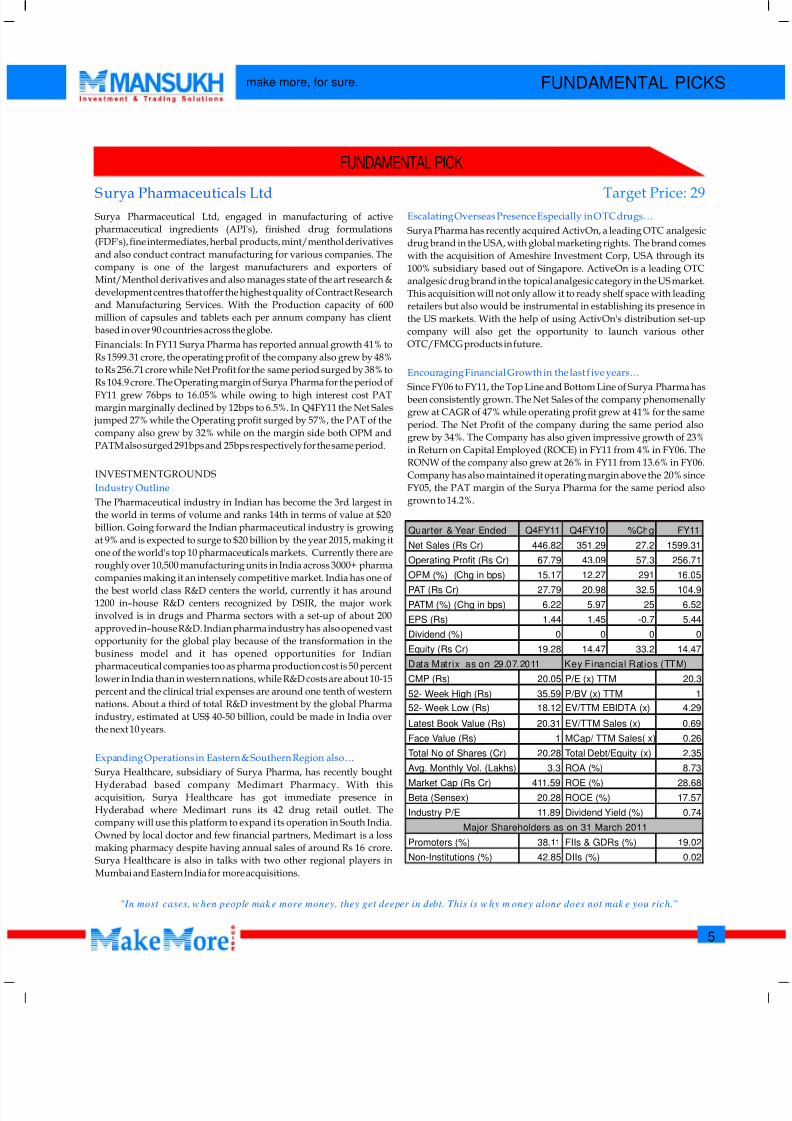
GREAT OFFSHORE'S 300 feet jack up rig -- Kedarnath --commenced a 5 year charter with Oil and Natural GasCorporation (ONGC). The total contract value aggregates toaround $125 million. Post dry dock and refurbishment atBahrain, 'Kedarnath' was mobilised to work for ONGC on thewest coast of India. Kedarnath has been consistently servingONGC since 1976 when it drilled its first well C1 at BombayHigh. It has many accolades to its credit during its use inexploration activity. Great Offshore is India's prominentintegrated offshore oilfield services provider, offering a broadspectrum of services to upstream oil and gas producers to carryout offshore exploration and production (E&P) activities. Aslight decline in the revenue of Rs. 2338.10 millions was seen forthe June 2011 quarter as against Rs. 2392.90 millions during year-ago period.Net Profit for the quarter ended June 2011 zoomed to105 .39% f rom Rs . 267 .30 mi l l ions to Rs . 549 .00millions.Operating Profit saw a handsome growth to 1691.50millions from 1093.10 millions in the quarter ended June 2011.Great Offshore has received an approval for new buildingcontracts for building three offshore support vessels' (OSV) withPinky Shipyard. These OSVs are scheduled to be deliveredintermittently during CY 2013. The company has received anapproval for new building contracts at its board meeting held on June 21, 2011.On technical viewpoint, stock has shown upward bias afterhaving double bottom formation around Rs 200. In closeproximity we believe stock is well poised to move in upwarddirection. Moreover it's RSI and other technical indicators standsin the positive territory where possibility of turnaround couldn'tbe rule out. Hence investors are advised to BUY this stock for aprice target of Rs 230-245 in near term.
SCRIP NAME
TRIGGER PRICE
TARGET 1
TARGET 2 STOP LOSS DURATION
GTOFFSHORE
210-215 230 245 195 1 Month
"If you m ust w ork for money, find a way to w ork and be happy. That is financial intelligence.”
8/6/2019 Monthly Magzine- Aug 2011-Mansukh Investment and Trading Solutions..
http://slidepdf.com/reader/full/monthly-magzine-aug-2011-mansukh-investment-and-trading-solutions 5/8
Surya Pharmaceutical Ltd, engaged in manufacturing of activepharmaceutical ingredients (API's), finished drug formulations Surya Pharma has recently acquired ActivOn, a leading OTC analgesic(FDF's), fine intermediates, herbal products, mint/menthol derivatives drug brand in the USA, with global marketing rights. The brand comesand also conduct contract manufacturing for various companies. The with the acquisition of Ameshire Investment Corp, USA through itscompany is one of the largest manufacturers and exporters of 100% subsidiary based out of Singapore. ActiveOn is a leading OTCMint/Menthol derivatives and also manages state of the art research & analgesic drug brand in the topical analgesic category in the US market.development centres that offer the highest quality of Contract Research This acquisition will not only allow it to ready shelf space with leadingand Manufacturing Services. With the Production capacity of 600 retailers but also would be instrumental in establishing its presence inmillion of capsules and tablets each per annum company has client the US markets. With the help of using ActivOn's distribution set-upbased in over 90 countries across the globe. company will also get the opportunity to launch various other
OTC/FMCG products in future.Financials: In FY11 Surya Pharma has reported annual growth 41% toRs 1599.31 crore, the operating profit of the company also grew by 48%to Rs 256.71 crore while Net Profit for the same period surged by 38% toRs 104.9 crore. The Operating margin of Surya Pharma for the period of Since FY06 to FY11, the Top Line and Bottom Line of Surya Pharma hasFY11 grew 76bps to 16.05% while owing to high interest cost PAT been consistently grown. The Net Sales of the company phenomenallymargin marginally declined by 12bps to 6.5%. In Q4FY11 the Net Sales grew at CAGR of 47% while operating profit grew at 41% for the same jumped 27% while the Operating profit surged by 57%, the PAT of the period. The Net Profit of the company during the same period alsocompany also grew by 32% while on the margin side both OPM and grew by 34%. The Company has also given impressive growth of 23%PATM also surged 291bps and 25bps respectively for the same period. in Return on Capital Employed (ROCE) in FY11 from 4% in FY06. The
RONW of the company also grew at 26% in FY11 from 13.6% in FY06.INVESTMENT GROUNDS Company has also maintained it operating margin above the 20% since
FY05, the PAT margin of the Surya Pharma for the same period alsogrown to 14.2%.The Pharmaceutical industry in Indian has become the 3rd largest in
the world in terms of volume and ranks 14th in terms of value at $20billion. Going forward the Indian pharmaceutical industry is growingat 9% and is expected to surge to $20 billion by the year 2015, making itone of the world's top 10 pharmaceuticals markets. Currently there areroughly over 10,500 manufacturing units in India across 3000+ pharmacompanies making it an intensely competitive market. India has one ofthe best world class R&D centers the world, currently it has around1200 in–house R&D centers recognized by DSIR, the major workinvolved is in drugs and Pharma sectors with a set-up of about 200approved in–house R&D. Indian pharma industry has also opened vastopportunity for the global play because of the transformation in thebusiness model and it has opened opportunities for Indianpharmaceutical companies too as pharma production cost is 50 percentlower in India than in western nations, while R&D costs are about 10-15percent and the clinical trial expenses are around one tenth of westernnations. About a third of total R&D investment by the global Pharmaindustry, estimated at US$ 40-50 billion, could be made in India overthe next 10 years.
Surya Healthcare, subsidiary of Surya Pharma, has recently bought
Hyderabad based company Medimart Pharmacy. With thisacquisition, Surya Healthcare has got immediate presence inHyderabad where Medimart runs its 42 drug retail outlet. Thecompany will use this platform to expand i ts operation in South India.Owned by local doctor and few financial partners, Medimart is a lossmaking pharmacy despite having annual sales of around Rs 16 crore.Surya Healthcare is also in talks with two other regional players inMumbai and Eastern India for more acquisitions.
Escalating Overseas Presence Especially in OTC drugs…
Encouraging Financial Growth in the last f ive years…
Industry Outline
Expanding Operations in Eastern & Southern Region also…
5
FUNDAMENTAL PICKS
Surya Pharmaceuticals Ltd Target Price: 29
make more, for sure.
FUNDAMENTAL PICK
"In most cases, w hen people mak e more money, they get deeper in debt. This is w hy m oney alone does not mak e you rich.”
Quarter & Year Ended Q4FY11 Q4FY10 %Chg FY11
Net Sales (Rs Cr) 446.82 351.29 27.2 1599.31Operating Profit (Rs Cr) 67.79 43.09 57.3 256.71OPM (%) (Chg in bps) 15.17 12.27 291 16.05
PAT (Rs Cr) 27.79 20.98 32.5 104.9PATM (%) (Chg in bps) 6.22 5.97 25 6.52EPS (Rs) 1.44 1.45 -0.7 5.44Dividend (%) 0 0 0 0Equity (Rs Cr) 19.28 14.47 33.2 14.47
CMP (Rs) 20.05 20.3
52- Week High (Rs) 35.59 152- Week Low (Rs) 18.12 4.29
Latest Book Value (Rs) 20.31 0.69Face Value (Rs) 1 0.26Total No of Shares (Cr) 20.28 2.35Avg. Monthly Vol. (Lakhs) 3.3 8.73
Market Cap (Rs Cr) 411.59 28.68Beta (Sensex) 20.28 17.57Industry P/E 11.89 0.74
Promoters (%) 38.11 19.02Non-Institutions (%) 42.85 0.02
Data Matrix as on 29.07.2011 Key Financial Ratios (TTM)
ROE (%)
ROA (%)
P/E (x) TTM
P/BV (x) TTMEV/TTM EBIDTA (x)
EV/TTM Sales (x)MCap/ TTM Sales( x)
DIIs (%)
Total Debt/Equity (x)
ROCE (%)Dividend Yield (%)
Major Shareholders as on 31 March 2011
FIIs & GDRs (%)
8/6/2019 Monthly Magzine- Aug 2011-Mansukh Investment and Trading Solutions..
http://slidepdf.com/reader/full/monthly-magzine-aug-2011-mansukh-investment-and-trading-solutions 6/8
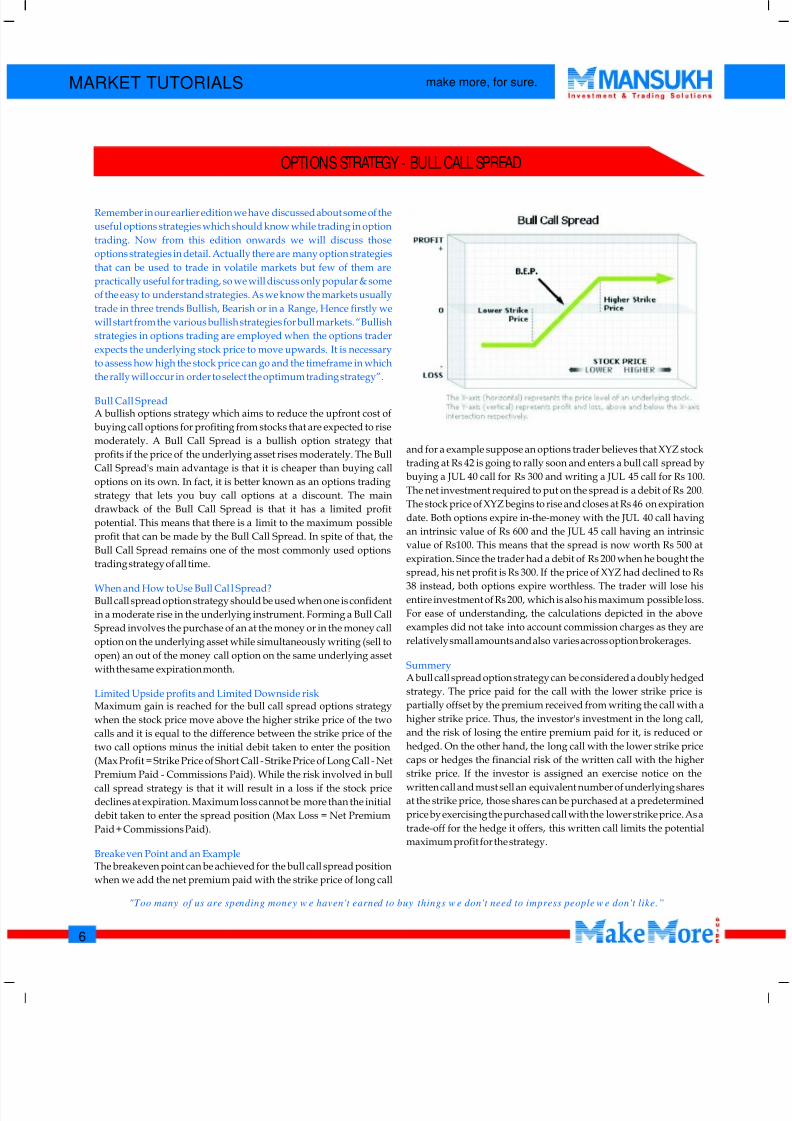
Remember in our earlier edition we have discussed about some of theuseful options strategies which should know while trading in optiontrading. Now from this edition onwards we will discuss thoseoptions strategies in detail. Actually there are many option strategiesthat can be used to trade in volatile markets but few of them arepractically useful for trading, so we will discuss only popular & someof the easy to understand strategies. As we know the markets usuallytrade in three trends Bullish, Bearish or in a Range, Hence firstly wewill start from the various bullish strategies for bull markets. “Bullishstrategies in options trading are employed when the options traderexpects the underlying stock price to move upwards. It is necessaryto assess how high the stock price can go and the timeframe in whichthe rally will occur in order to select the optimum trading strategy”.
Bull Call Spread
When and How to Use Bull Cal l Spread?
Summery
Limited Upside profits and Limited Downside risk
Breakeven Point and an Example
A bullish options strategy which aims to reduce the upfront cost ofbuying call options for profiting from stocks that are expected to risemoderately. A Bull Call Spread is a bullish option strategy that
and for a example suppose an options trader believes that XYZ stockprofits if the price of the underlying asset rises moderately. The Bulltrading at Rs 42 is going to rally soon and enters a bull call spread byCall Spread's main advantage is that it is cheaper than buying callbuying a JUL 40 call for Rs 300 and writing a JUL 45 call for Rs 100.options on its own. In fact, it is better known as an options tradingThe net investment required to put on the spread is a debit of Rs 200.strategy that lets you buy call options at a discount. The mainThe stock price of XYZ begins to rise and closes at Rs 46 on expirationdrawback of the Bull Call Spread is that it has a limited profitdate. Both options expire in-the-money with the JUL 40 call havingpotential. This means that there is a limit to the maximum possiblean intrinsic value of Rs 600 and the JUL 45 call having an intrinsicprofit that can be made by the Bull Call Spread. In spite of that, thevalue of Rs100. This means that the spread is now worth Rs 500 atBull Call Spread remains one of the most commonly used optionsexpiration. Since the trader had a debit of Rs 200 when he bought thetrading strategy of all time.spread, his net profit is Rs 300. If the price of XYZ had declined to Rs
38 instead, both options expire worthless. The trader will lose hisentire investment of Rs 200, which is also his maximum possible loss.Bull call spread option strategy should be used when one is confidentFor ease of understanding, the calculations depicted in the abovein a moderate rise in the underlying instrument. Forming a Bull Callexamples did not take into account commission charges as they areSpread involves the purchase of an at the money or in the money callrelatively small amounts and also varies across option brokerages.option on the underlying asset while simultaneously writing (sell to
open) an out of the money call option on the same underlying assetwith the same expiration month.
A bull call spread option strategy can be considered a doubly hedgedstrategy. The price paid for the call with the lower strike price ispartially offset by the premium received from writing the call with aMaximum gain is reached for the bull call spread options strategyhigher strike price. Thus, the investor's investment in the long call,when the stock price move above the higher strike price of the twoand the risk of losing the entire premium paid for it, is reduced orcalls and it is equal to the difference between the strike price of thehedged. On the other hand, the long call with the lower strike pricetwo call options minus the initial debit taken to enter the positioncaps or hedges the financial risk of the written call with the higher(Max Profit = Strike Price of Short Call - Strike Price of Long Call - Netstrike price. If the investor is assigned an exercise notice on thePremium Paid - Commissions Paid). While the risk involved in bullwritten call and must sell an equivalent number of underlying sharescall spread strategy is that it will result in a loss if the stock priceat the strike price, those shares can be purchased at a predetermineddeclines at expiration. Maximum loss cannot be more than the initialprice by exercising the purchased call with the lower strike price. As adebit taken to enter the spread position (Max Loss = Net Premiumtrade-off for the hedge it offers, this written call limits the potentialPaid + Commissions Paid).maximum profit for the strategy.
The breakeven point can be achieved for the bull call spread positionwhen we add the net premium paid with the strike price of long call
MARKET TUTORIALS
6
make more, for sure.
OPTIONS STRATEGY - BULL CALL SPREAD
"Too many of us are spending money w e haven't earned to buy things w e don't need to impress people w e don't like.”
8/6/2019 Monthly Magzine- Aug 2011-Mansukh Investment and Trading Solutions..
http://slidepdf.com/reader/full/monthly-magzine-aug-2011-mansukh-investment-and-trading-solutions 7/8
Both Europe and the US are in the midst of the heightening uncertain
climate. Unresolved European debt crisis and deadlock over the USdebt ceiling have combined to disable a sustained connect from marketfundamentals to price performance.
The strife over the US debt ceiling and concern about the health ofEuropean economies has sent the dollar reeling against mostcurrencies. This wave of risk aversion has however been favorable togold and the yellow metal recently scaled the $1,600 per ounce level.This is an apt juncture to review the outlook for gold and its counter-part, silver as well. Continued macro-economic concerns have driveninvestors towards gold, which is boosted by safe haven purchases. ETPholdings have hit an all-time high
Earlier also, we had analyzed the long-term outlook for gold whereinwe had somewhere mentioned that after moving between $250 and
consolidation can be followed by yet another attempt to move on to$450 for two decades from 1985, gold had broken out in 2005. Our long-new highs. The zone around $1,500 is likely to serve as a good medium-term view remains unaltered. We stay with the view that the third legterm support.of the structural up-move from April 2001 is currently in progress with
the targets of $1,860 and $2,580.Short-term trend in gold also appears up since the July 4 trough at
These are of course long-term targets and the metal can take a couple of$1,485.7. This uptrend is however halting over the last four sessions as
years or even more to get there. The 2008 peak at $1,030 remains thethe metal moved in a narrow range between $1,600 and $1,630.
critical long-term trend decider for this metal.Short-term targets for gold if it manages to hold above $1,600 are $1,680
Gold continues to rally higher with very shallow corrections, makingand $1,735. Short-term supports are at $1,585 and $1,575. Short-term
labeling of the move from October 2008 quite difficult. The minor C ofview will turn negative only if gold closes below $1,540.
this wave-group appears to be extending and there are multiple waysin which this move can be counted. But there are a cluster of wave
Prices are expected to stay at elevated levels with profit bookingtargets between $1,630 and $1,700 making it quite likely that theexerting some downward pressure. For any reason, if investor interest
uptrend can halt around this zone.were to wane, there will be steep correction in prices. Barring short-
If that happens, that will not spell the end of the rally but a correction term correction, the external environment is supportive for gold. Pricescan ensue for few months in the zone between $1,500 and $1,700. This may test fresh highs.
Long-term Vi ew
Short-term outlook
Conclusion
7
WILL GOLD CONTINUE TO GLITTER
"The gratification of w ealth is not found in m ere possession or in lavish expenditure, but in its w ise application.”

8/6/2019 Monthly Magzine- Aug 2011-Mansukh Investment and Trading Solutions..
http://slidepdf.com/reader/full/monthly-magzine-aug-2011-mansukh-investment-and-trading-solutions 8/8
AUXILIARY SECTION make more, for sure.
ALERT FOR CLIENTS SERVICE FOR MANSUKH SECURITIES
IntroductionMansukh Securities has brought Alert for Clients Service for its customers to remain informed and connected withthe stock market while on move.
Jaamoon Alc Features:1. Conditional Alerts - This feature allows users to set alerts based on price trends.2. Periodic Alerts - This feature allows users to set time-based alerts.3. Market Open and Market Close Alerts - This feature allows users to set alerts based on Market Open and
Market Close conditions.
Steps To Register And Use Alc Platforma. Click http://www.moneysukh.com.
b. Click
c. Click on New user click here and register yourself by entering your mobile number, first name and lastname.
d. SMS having your username and system generated password will be sent to your registered mobilenumber.
e. Using the login details you can now enter username and password and click Signin.f. Once you login into the application for the first time, you will be asked to change your password. It is
recommended to change the password although you may ignore the warning by clicking Ignore.
g. You can then click “Create alert” link to create your own alerts
h. You can also view the alerts you have created using “View alerts” link