Embed Size (px)
Citation preview

Q1 – 2018Interim reportJanuary – March 2018

Contents
Highlights and Group performance 1Outlook for 2018 1
Interim report 5Telenor’s operations 5
Group performance 10
Interim condensed financial information 12Notes to the interim consolidated financial statements 17
Definitions 23

1 TELENOR FIRST QUARTER 2018
Key figures Telenor Group
First quarter Year First quarter
(NOK in millions)2018 2017 2017 2018
IFRS15
Revenues 27 113 27 596 112 069 27 138
Organic revenue growth (%) (1.5) 0.3 0.5
Subscription and traffic revenues 21 157 21 177 86 314 21 027
Organic subscription and traffic revenue growth (%) 1.0 1.2 2.4
EBITDA before other income and other expenses 11 309 10 504 44 694 11 330
EBITDA before other income and other expenses/Revenues (%) 41.7 38.1 39.9 41.8
Net income attributable to equity holders of Telenor ASA 4 987 4 168 11 983 4 983
Capex excl. licences and spectrum/Revenues (%) 11.3 15.9 15.4 11.3
Capex/Revenues (%) 17.3 15.9 18.1 17.3
Free cash flow 2 575 2 166 24 867 2 575
Mobile subscriptions - Change in quarter/Total (mill.) 1.7 2.4 170 1.7
Discontinued operations: Telenor India, Hungary, Montenegro & Serbia and Bulgaria, Telenor Common Operation, Telenor Microfinance Bank and Telenor Banka. See note 3 for further information.
First quarter 2018 summary
• Total reported revenues fell by 2% to NOK 27.1 billion. On an organic basis, subscription and traffic revenues grew 1%.
• Organic EBITDA growth of 10%.
• Reported opex decreased by NOK 0.8 billion. Adjusted for currency effects, the reduction was NOK 0.7 billion or 7%.
• EBITDA before other items was NOK 11.3 billion, corresponding to an EBITDA margin of 41.7%, an increase of 4 percentage points from last year.
• Net income attributable to equity holders of Telenor ASA was NOK 5.0 billion, or NOK 3.35 earnings per share.
• Capex excluding spectrum and licences was NOK 3.1 billion, resulting in a capex to sales ratio of 11%.
• Free cash flow for the quarter was NOK 2.6 billion.
Shareholder remuneration
On 21 March Telenor communicated that the company had entered into an agreement for the divestment of its mobile businesses in Central and Eastern Europe. As a result of this, the Board of Directors proposes a special dividend of NOK 4.40, to be declared by the Annual General Meeting (AGM) on 2 May 2018, contingent upon the successful closing of the transaction. The Board of Directors has the intention to decide such additional dividends as soon as practicable after completion.
Outlook
For 2018, we expect an organic subscription and traffic revenue growth of 1-2%, and an organic EBITDA growth of 2-3%. Capex excluding licences and spectrum has been adjusted for the discontinuation of the Central and Eastern European operations, and is now expected to be NOK 17-18 billion.
Entering 2018, I am pleased to see that we continue to grow and renew ourselves. We added close to 2 million customers in the first quarter; subscription and traffic revenues increased by 1% and EBITDA grew by 10%. Our digital transformation and focused efforts on efficiency improvements continue to deliver significant results. The performance in Scandinavia was robust, and we continue to see improving trends in developed Asia. After a soft start to the year in Bangladesh and Pakistan, growth picked up during the quarter and we expect revenue growth in those markets to improve going forward.
During the first quarter, we took two important steps in developing Telenor. We announced the disposal of our mobile operations in Central and Eastern Europe, which enables us to focus on developing our businesses in Scandinavia and Asia. We also strengthened digital positions by entering a strategic partnership to develop our financial services business in Pakistan. In Thailand, an important milestone was reached with the signing of the 2.3 GHz spectrum agreement.
In summary, another solid quarter and we continue our consistent execution of the strategy.
– Sigve Brekke, President and CEO

2 TELENOR FIRST QUARTER 2018
SUBSCRIPTION AND TRAFFIC REVENUES
OPERATING EXPENDITURES (OPEX)
EBITDA BEFORE OTHER INCOME AND OTHER EXPENSES (EBITDA)
Group performance in the first quarter 20181)
1) The comments are related to Telenor’s development in the first quarter of 2018 compared to the 2017 unless otherwise stated. Please refer to Definitions on page 23 for descriptions of alternative performance measures.
Reported subscription and traffic revenues remained flat from last year. However, on an organic basis they grew by 1%. The growth in Bangladesh continues to be the largest positive driver this quarter, but also supported by growth in Digi and Scandinavia. Both total reported and organic revenues decreased by 2%, or NOK 0.5 billion and NOK 0.4 billion respectively.
EBITDA was NOK 11.3 billion, an improvement of 10% on an organic basis. The increase was driven by continued opex reductions and growth in mobile subscription and traffic revenues. The EBITDA margin increased by 4 percentage points, closing the quarter at 42%.
Reported opex decreased by NOK 0.8 billion. Currency adjusted opex decreased by NOK 0.7 billion or 7% as the traction on efficiency initiatives continues to yield good results across the Group. The cost reductions were most notable in Thailand, Norway and Sweden.
-1
0
1
2
3
4
5
6
0
1
2
3
4
5
6
Revenues
Opex
EBITDA
Capex
Net income
Free cash flow
Mobile
Grafene under er manuelle og kan brukes
0
5
10
15
20
25
0
14
28
42
56
70
NO
K b
illio
n
Q12018
Q12017
Q22017
Q32017
Q42017
Q1 2018IFRS15
Q12018
Q12017
Q22017
Q32017
Q42017
Q1 2018IFRS15
Q12018
Q12017
Q22017
Q32017
Q42017
Q1 2018IFRS15
Q12018
Q12017
Q22017
Q32017
Q42017
Q1 2018IFRS15
Q12018
Q12017
Q22017
Q32017
Q42017
Q12018
Q12017
Q22017
Q32017
Q42017
Q12018
Q12017
Q22017
Q32017
Q42017
21.2 22.0 21.5 21.7 21.2 21.0
0
2
4
6
8
10
12
0
5
10
15
20
25
30
NO
K b
illio
n
9.610.4 10.2
9.410.5
9.6
1.0%
0
2
4
6
8
10
12
150,00
156,25
162,50
168,75
175,00
0
5
10
15
20
25
NO
K b
illio
n
11.310.5
11.6 11.810.8 11.3
4.74.4
5.44.7
5.8
4.2
-0.2
5.8
2.2
5.0 5.0
3.32.62.2
9.99.4
10.0%
0,000000
2,833333
5,666667
8,500000
11,333333
14,166667
17,000000
NO
K b
illio
nN
OK
bill
ion
NO
K b
illio
n
170.1
162.3164.3
166.1168.3
50% 50% 50% 52% 52%
20
40
60
Q42015
Q12016
Q22016
Q32016
Q42016
203208 211 211
214
0
2
4
6
8
10
Free cash flow
Q12018
Q12017
Q22017
Q32017
Q42017
3.32.62.2
9.99.4
NO
K b
illio
n
0
2
4
6
8
10
Mobile subscriptions of which active data users (%)
Mobile
Q12018
Q12017
Q22017
Q32017
Q42017
150,00
156,25
162,50
168,75
175,00
170.1
162.3164.3
166.1168.3
50% 50%52% 52% 52% 52%
Mobile subscriptions of which active data users (%)
Capex Capex/Sales
0
1
2
3
4
5
6
Capex
Q12018
Q12017
Q22017
Q32017
Q42017
4.74.4
5.44.7
5.8
NO
K b
illio
n
Capex Capex/Sales
Organic growth
Organic growth
0
20
40
60
80
17%16% 19% 17% 20% 17%16% 19% 17%20%

3 TELENOR FIRST QUARTER 2018
NET INCOME
FREE CASH FLOW
CAPITAL EXPENDITURES (CAPEX)
Capex was NOK 4.7 billion, of which network expansion in Norway and Thailand were still the largest drivers. Capex for the quarter includes the acquisition in Bangladesh of 2x5 MHz spectrum in the 1800 MHz frequency band auction and also conversion of existing spectrum to 4G for a total consideration of NOK 1.6 billion.
Free cash flow in the first quarter was NOK 2.6 billion. This is an increase of NOK 0.4 billion from last year. Improved EBITDA, lower net interest payments and VEON dividends were partly offset by higher tax payments. Lower total capex paid, despite spectrum payments of NOK 1.2 billion in Bangladesh, partly offset the negative impact of NOK 0.8 billion from increased working capital this quarter.
Reported net income to equity holders of Telenor ASA in the first quarter was NOK 5.0 billion, which is an increase of NOK 0.8 billion.This was primarily a result of improved EBITDA and positive net financial items, partly offset by higher depreciation and taxes.
-1
0
1
2
3
4
5
6
0
1
2
3
4
5
6
Revenues
Opex
EBITDA
Capex
Net income
Free cash flow
Mobile
Grafene under er manuelle og kan brukes
0
5
10
15
20
25
0
14
28
42
56
70
NO
K b
illio
nQ1
2018Q1
2017Q2
2017Q3
2017Q4
2017Q1 2018IFRS15
Q12018
Q12017
Q22017
Q32017
Q42017
Q1 2018IFRS15
Q12018
Q12017
Q22017
Q32017
Q42017
Q1 2018IFRS15
Q12018
Q12017
Q22017
Q32017
Q42017
Q1 2018IFRS15
Q12018
Q12017
Q22017
Q32017
Q42017
Q12018
Q12017
Q22017
Q32017
Q42017
Q12018
Q12017
Q22017
Q32017
Q42017
21.2 22.0 21.5 21.7 21.2 21.0
0
2
4
6
8
10
12
0
5
10
15
20
25
30
NO
K b
illio
n
9.610.4 10.2
9.410.5
9.6
1.0%
0
2
4
6
8
10
12
150,00
156,25
162,50
168,75
175,00
0
5
10
15
20
25
NO
K b
illio
n
11.310.5
11.6 11.810.8 11.3
4.74.4
5.44.7
5.8
4.2
-0.2
5.8
2.2
5.0 5.0
3.32.62.2
9.99.4
10.0%
0,000000
2,833333
5,666667
8,500000
11,333333
14,166667
17,000000
NO
K b
illio
nN
OK
bill
ion
NO
K b
illio
n
170.1
162.3164.3
166.1168.3
50% 50% 50% 52% 52%
20
40
60
Q42015
Q12016
Q22016
Q32016
Q42016
203208 211 211
214
0
2
4
6
8
10
Free cash flow
Q12018
Q12017
Q22017
Q32017
Q42017
3.32.62.2
9.99.4
NO
K b
illio
n
0
2
4
6
8
10
Mobile subscriptions of which active data users (%)
Mobile
Q12018
Q12017
Q22017
Q32017
Q42017
150,00
156,25
162,50
168,75
175,00
170.1
162.3164.3
166.1168.3
50% 50%52% 52% 52% 52%
Mobile subscriptions of which active data users (%)
Capex Capex/Sales
0
1
2
3
4
5
6
Capex
Q12018
Q12017
Q22017
Q32017
Q42017
4.74.4
5.44.7
5.8
NO
K b
illio
n
Capex Capex/Sales
Organic growth
Organic growth
0
20
40
60
80
17%16% 19% 17% 20% 17%16% 19% 17%20%
-1
0
1
2
3
4
5
6
0
1
2
3
4
5
6
Revenues
Opex
EBITDA
Capex
Net income
Free cash flow
Mobile
Grafene under er manuelle og kan brukes
0
5
10
15
20
25
0
14
28
42
56
70
NO
K b
illio
n
Q12018
Q12017
Q22017
Q32017
Q42017
Q1 2018IFRS15
Q12018
Q12017
Q22017
Q32017
Q42017
Q1 2018IFRS15
Q12018
Q12017
Q22017
Q32017
Q42017
Q1 2018IFRS15
Q12018
Q12017
Q22017
Q32017
Q42017
Q1 2018IFRS15
Q12018
Q12017
Q22017
Q32017
Q42017
Q12018
Q12017
Q22017
Q32017
Q42017
Q12018
Q12017
Q22017
Q32017
Q42017
21.2 22.0 21.5 21.7 21.2 21.0
0
2
4
6
8
10
12
0
5
10
15
20
25
30
NO
K b
illio
n
9.610.4 10.2
9.410.5
9.6
1.0%
0
2
4
6
8
10
12
150,00
156,25
162,50
168,75
175,00
0
5
10
15
20
25
NO
K b
illio
n
11.310.5
11.6 11.810.8 11.3
4.74.4
5.44.7
5.8
4.2
-0.2
5.8
2.2
5.0 5.0
3.32.62.2
9.99.4
10.0%
0,000000
2,833333
5,666667
8,500000
11,333333
14,166667
17,000000
NO
K b
illio
nN
OK
bill
ion
NO
K b
illio
n
170.1
162.3164.3
166.1168.3
50% 50% 50% 52% 52%
20
40
60
Q42015
Q12016
Q22016
Q32016
Q42016
203208 211 211
214
0
2
4
6
8
10
Free cash flow
Q12018
Q12017
Q22017
Q32017
Q42017
3.32.62.2
9.99.4
NO
K b
illio
n
0
2
4
6
8
10
Mobile subscriptions of which active data users (%)
Mobile
Q12018
Q12017
Q22017
Q32017
Q42017
150,00
156,25
162,50
168,75
175,00
170.1
162.3164.3
166.1168.3
50% 50%52% 52% 52% 52%
Mobile subscriptions of which active data users (%)
Capex Capex/Sales
0
1
2
3
4
5
6
Capex
Q12018
Q12017
Q22017
Q32017
Q42017
4.74.4
5.44.7
5.8
NO
K b
illio
n
Capex Capex/Sales
Organic growth
Organic growth
0
20
40
60
80
17%16% 19% 17% 20% 17%16% 19% 17%20%

4 TELENOR FIRST QUARTER 2018
The number of mobile subscriptions increased by close to 2 million during the quarter, raising the total subscription base to 170 million. The main contributors to the subscription growth were Bangladesh and Pakistan, adding 2.1 million and 1.0 million respectively. This increase was partly offset by a subscription loss of 0.8 million in Thailand and 0.5 million in Myanmar. The share of active data users in our subscription base remained stable at 52% from previous quarter.
MOBILE SUBSCRIPTIONS
-1
0
1
2
3
4
5
6
0
1
2
3
4
5
6
Revenues
Opex
EBITDA
Capex
Net income
Free cash flow
Mobile
Grafene under er manuelle og kan brukes
0
5
10
15
20
25
0
14
28
42
56
70
NO
K b
illio
n
Q12018
Q12017
Q22017
Q32017
Q42017
Q1 2018IFRS15
Q12018
Q12017
Q22017
Q32017
Q42017
Q1 2018IFRS15
Q12018
Q12017
Q22017
Q32017
Q42017
Q1 2018IFRS15
Q12018
Q12017
Q22017
Q32017
Q42017
Q1 2018IFRS15
Q12018
Q12017
Q22017
Q32017
Q42017
Q12018
Q12017
Q22017
Q32017
Q42017
Q12018
Q12017
Q22017
Q32017
Q42017
21.2 22.0 21.5 21.7 21.2 21.0
0
2
4
6
8
10
12
0
5
10
15
20
25
30
NO
K b
illio
n
9.610.4 10.2
9.410.5
9.6
1.0%
0
2
4
6
8
10
12
150,00
156,25
162,50
168,75
175,00
0
5
10
15
20
25
NO
K b
illio
n
11.310.5
11.6 11.810.8 11.3
4.74.4
5.44.7
5.8
4.2
-0.2
5.8
2.2
5.0 5.0
3.32.62.2
9.99.4
10.0%
0,000000
2,833333
5,666667
8,500000
11,333333
14,166667
17,000000
NO
K b
illio
nN
OK
bill
ion
NO
K b
illio
n
170.1
162.3164.3
166.1168.3
50% 50% 50% 52% 52%
20
40
60
Q42015
Q12016
Q22016
Q32016
Q42016
203208 211 211
214
0
2
4
6
8
10
Free cash flow
Q12018
Q12017
Q22017
Q32017
Q42017
3.32.62.2
9.99.4
NO
K b
illio
n
0
2
4
6
8
10
Mobile subscriptions of which active data users (%)
Mobile
Q12018
Q12017
Q22017
Q32017
Q42017
150,00
156,25
162,50
168,75
175,00
170.1
162.3164.3
166.1168.3
50% 50%52% 52% 52% 52%
Mobile subscriptions of which active data users (%)
Capex Capex/Sales
0
1
2
3
4
5
6
Capex
Q12018
Q12017
Q22017
Q32017
Q42017
4.74.4
5.44.7
5.8
NO
K b
illio
n
Capex Capex/Sales
Organic growth
Organic growth
0
20
40
60
80
17%16% 19% 17% 20% 17%16% 19% 17%20%

5 TELENOR FIRST QUARTER 2018
Norway
First quarter YearFirst
quarter
(NOK in millions)2018 2017
Restated*2017
Restated*2018
IFRS15
Revenues mobile operation
Subscription and traffic 2 696 2 655 11 029 2 675
Interconnect revenues 132 129 551 132
Other mobile revenues 219 275 1 177 219
Non-mobile revenues 596 454 2 314 591
Total revenues mobile operation 3 643 3 514 15 072 3 616
Revenues fixed operation
Telephony 330 409 1 498 330
Internet and TV 1 480 1 421 5 850 1 481
Data services 131 123 504 131
Other fixed revenues 406 408 1 603 406
Total retail revenues 2 347 2 361 9 455 2 348
Wholesale revenues 329 366 1 437 329
Total revenues fixed operation 2 677 2 727 10 892 2 678
Total revenues 6 319 6 241 25 965 6 293
Operating expenditures 2 216 2 354 9 206 2 189
EBITDA before other items 2 765 2 579 11 117 2 766
Operating profit 1 644 1 475 6 902 1 644
EBITDA before other items/Total revenues (%) 43.8 41.3 42.8 43.9
Capex 720 1 148 4 988 720
Investments in businesses - 7 215 -
Statistics (monthly in NOK):
Mobile ARPU 317 305 320 315
Fixed Telephony ARPU 239 254 246 239
Fixed Internet ARPU 375 360 369 345
TV ARPU 314 299 312 316
No. of subscriptions - Change in quarter/Total (in thousands):
Mobile (17) (40) 2 984 (17)
Fixed telephony (17) (21) 472 (17)
Fixed Internet (5) - 859 (5)
TV (2) 4 546 (2)
* Refer to note 7.
• Continued efforts on revenue renewal and efficiency improvements led to another strong quarter for our Norwegian operation.
• Mobile subscriptions decreased by 17,000 in the quarter from reduction in prepaid subscriptions and lower ARPU subscriptions in the consumer segment. The total number of mobile subscriptions decreased by 2% from same period last year.
• Mobile ARPU increased by 4%. Mobile subscription and traffic revenues increased by 2%, as the higher ARPU was partly offset by a lower sub-scriber base.
• Growth in fixed internet and TV revenues was more than offset by the declining trend for traditional telephony and wholesale products. Fibre connections increased by 8,000 in the quarter, taking the total number of high-speed subscribers to 634,000.
• Opex decreased by 6% mainly due to workforce reductions and lower sales and marketing costs.
• EBITDA increased by 7% or 4% adjusted for the launch of data rollover in the first quarter of 2017. The EBITDA margin improved by 2 percentage points to 44%.
• Capex continued to be driven by 4G network expansion and fibre roll-out.
Interim report Telenor’s operations The comments below are related to Telenor’s development in the first quarter of 2018 compared to the first quarter of 2017 in local currency, unless otherwise stated. The financial figures presented below are based on the accounting principles for the Group’s segment reporting. See note 7 for further information. Telenor’s operations in Hungary, Montenegro & Serbia and Bulgaria as well as Telenor Common Operation, Telenor Microfinance Bank and Telenor Banka are classified as a discontinued operations, see note 3 for further information. Financial figures for several segments have been restated. See note 7 for further information. All comments on EBITDA are made on development in EBITDA before other income and other expenses. Please refer to page 10 for ‘Specification of other income and other expenses’. Additional information is available at: www.telenor.com/ir

6 TELENOR FIRST QUARTER 2018
Sweden
First quarter YearFirst
quarter
(NOK in millions)2018 2017 2017 2018
IFRS15
Revenues mobile operation
Subscription and traffic 1 527 1 482 6 123 1 527
Interconnect revenues 133 187 596 133
Other mobile revenues 90 86 379 90
Non-mobile revenues 542 496 2 219 542
Total revenues mobile operation 2 293 2 251 9 317 2 292
Revenues fixed operation
Telephony 58 75 285 58
Internet and TV 659 619 2 660 662
Data services 40 40 201 40
Other fixed revenues 90 20 303 90
Total retail revenues 847 754 3 448 850
Wholesale revenues 54 51 172 54
Total revenues fixed operation 901 805 3 620 904
Total revenues 3 193 3 056 12 938 3 196
Operating expenditures 1 008 1 067 4 211 1 023
EBITDA before other items 1 070 920 4 136 1 058
Operating profit 749 562 2 730 738
EBITDA before other items/Total revenues (%) 33.5 30.1 32.0 33.1
Capex 301 307 1 690 301
Investments in businesses - - 113 -
Statistics (monthly in NOK):
Mobile ARPU 206 211 210 206
Fixed Telephony ARPU 53 69 67 53
Fixed Internet ARPU 217 210 213 218
TV ARPU 145 131 139 147
No. of subscriptions - Change in quarter/Total (in thousands):
Mobile (9) 24 2 689 (9)
Fixed telephony (22) (7) 185 (22)
Fixed Internet (2) 11 679 (2)
TV 5 (5) 470 5
Exchange rate (SEK) 0.9668 0.9456 0.9680 0.9668
• In Sweden, we continued to see revenue growth combined with solid execution on cost efficiency initiatives, yielding strong financial results.
• The number of mobile subscription decreased by 9,000 in the quarter, mainly from the business segment. The subscription base is now 1% higher than first quarter last year. 8,000 fibre connections were added, taking the total number of high speed fixed internet subscriptions to 587,000, an increase of 8% from last year.
• Mobile subscription and traffic revenues increased by 1%, as the larger customer base more than offset the negative impact from roaming. Adjusted for the mobile termination rate settlement last year of NOK 55 million, ARPU decreased by 1%.
• Fixed revenues increased by 9% from growth in internet and TV revenues more than offsetting decline within legacy products, and the inclusion of the acquired system integrator Network Services Nordic AB.
• Opex decreased by 10% organically, mainly due to fewer employees, reduction in number of retail sales points and lower commissions. Consequently, EBITDA increased by 14% and the EBITDA margin increased by 3 percentage points to 33%.
• Capex was mainly related to IT digitalisation and mobile network investments.
Denmark
First quarter YearFirst
quarter
(NOK in millions)2018 2017 2017 2018
IFRS15
Revenues mobile operation
Subscription and traffic 753 695 2 903 740
Interconnect revenues 61 60 256 61
Other mobile revenues 43 43 199 43
Non-mobile revenues 246 313 1 251 238
Total revenues mobile operation 1 103 1 111 4 610 1 083
Revenues fixed operation
Telephony 34 37 144 34
Internet and TV 91 95 367 91
Data services 6 6 26 6
Total revenues fixed operation 131 138 537 131
Total revenues 1 234 1 249 5 147 1 213
Operating expenditures 503 512 2 136 518
EBITDA before other items 248 222 849 230
Operating profit 22 127 1 665 4
EBITDA before other items/Total revenues (%) 20.1 17.8 16.5 18.9
Capex 93 108 651 93
Mobile ARPU - monthly (NOK) 150 138 144 147
No. of subscriptions - Change in quarter/Total (in thousands):
Mobile (28) 9 1 827 (28)
Fixed telephony (5) (2) 64 (5)
Fixed Internet (1) (1) 138 (1)
Exchange rate (DKK) 1.2936 1.2090 1.2539 1.2936
• The Danish market remains very competitive and our operation continues to execute on its transformation programme, reducing complexity and costs.
• The mobile subscription base was 1.8 million, slightly down from the end of last year following churn of low revenue generating subscriptions.
• Mobile subscription and traffic revenues increased by 1% as a result of improved performance in the consumer segment. Total revenues decreased due to lower sale of handsets and fixed products.
• EBITDA improved by 5%, leading to a margin expansion of 2 percentage points to 20% aided by a more efficient operation, lower sales and marketing costs as well as 10% fewer employees than last year.
• Capex was primarily related to 4G network, business support system and IT.

7 TELENOR FIRST QUARTER 2018
dtac - Thailand
First quarter YearFirst
quarter
(NOK in millions)2018 2017 2017 2018
IFRS15
Revenues
Subscription and traffic 3 933 3 840 15 620 3 908
Interconnect revenues 148 218 841 148
Other mobile revenues 55 62 184 55
Non-mobile revenues 644 630 2 444 672
Total revenues 4 781 4 751 19 089 4 783
Operating expenditures 1 708 1 835 6 969 1 717
EBITDA before other items 2 073 1 656 7 413 2 067
Operating profit 398 193 1 086 392
EBITDA before other items/Total revenues (%) 43.4 34.9 38.8 43.2
Capex 615 1 076 4 027 615
No. of subscriptions - Change in quarter/Total (in thousands): (841) (170) 22 652 (841)
ARPU - monthly (NOK) 61 55 58 60
Exchange rate (THB) 0.2483 0.2404 0.2435 0.2483
• In Thailand, we see continued growth in postpaid revenues from an increasing number of subscriptions and higher ARPU. However, subscription and traffic revenues decreased by 1% as a result of the sustaining pressure within prepaid.
• Total revenues declined by 3%, mainly as a result of reduced sale of handsets and lower interconnect revenues.
• The total number of subscriptions decreased by 0.8 million, as growth in postpaid subscriptions was unable to offset the decline in the prepaid segment.
• Opex decreased by 10%, mainly due to reduced regulatory cost and savings in personnel and market spend.
• EBITDA increased by 21%. The EBITDA margin improved by 8 percentage points, closing at 43% for the quarter. The margin expansion was mainly a result of improved device margin and reduced opex.
• Capex was prioritised towards densifying the 3G and 4G networks.
Digi - Malaysia
First quarter YearFirst
quarter
(NOK in millions)2018 2017 2017 2018
IFRS15
Revenues
Subscription and traffic 2 819 2 624 10 685 2 774
Interconnect revenues 116 146 581 116
Other mobile revenues 35 36 132 35
Non-mobile revenues 221 183 789 337
Total revenues 3 191 2 989 12 188 3 263
Operating expenditures 967 928 3 720 972
EBITDA before other items 1 474 1 353 5 556 1 542
Operating profit 1 013 1 019 4 035 1 081
EBITDA before other items/Total revenues (%) 46.2 45.3 45.6 47.2
Capex 362 368 2 570 362
No. of subscriptions - Change in quarter/Total (in thousands): 10 (524) 11 747 10
ARPU - monthly (NOK) 83 77 79 82
Exchange rate (MYR) 1.9966 1.8988 1.9222 1.9966
• In Malaysia, revenues increased by 2% driven by strong data growth, more than offsetting the continuous decline of voice revenues.
• Subscription and traffic revenues increased by 2% driven by prepaid internet revenue uptake and postpaid revenue growth, ending a nine consecutive quarter negative trend.
• At the end of the quarter, the total subscriptions remained flat as increase of 0.4 million postpaid subscribers offset the 0.4 million decline of prepaid subscribers.
• EBITDA increased by 4% due to strong postpaid and data development, combined with cost reductions.
• Capex for the quarter was prioritised towards improving the 4G network both in terms of capacity and quality.
Grameenphone - Bangladesh
First quarter YearFirst
quarter
(NOK in millions)2018 2017 2017 2018
IFRS15
Revenues
Subscription and traffic 2 704 2 896 11 748 2 704
Interconnect revenues 199 225 882 199
Other mobile revenues 1 6 14 1
Non-mobile revenues 47 150 512 47
Total revenues 2 952 3 277 13 156 2 952
Operating expenditures 1 090 1 076 4 310 1 097
EBITDA before other items 1 701 1 903 7 791 1 695
Operating profit 1 116 1 284 5 124 1 110
EBITDA before other items/Total revenues (%) 57.6 58.1 59.2 57.4
Capex 1 977 480 1 483 1 977
Investments in businesses - - 19 -
No. of subscriptions - Change in quarter/Total (in thousands): 2 128 1 914 65 329 2 128
ARPU - monthly (NOK) 15 18 17 15
Exchange rate (BDT) 0.0943 0.1068 0.1022 0.0943
• In February, 4G services were launched in all major cities and will be expanded during 2018 to strengthen Grameenphone’s superior network position.
• The number of subscriptions increased by 2.1 million during the quarter, taking the total base to 67.5 million. The subscription base was 13% higher than first quarter last year.
• The subscription and traffic revenues increased by 6% as the growth in subscriptions was partly offset by a 6% decline in ARPU due to competitive pressure on data. Total revenues increased by 2%, negatively impacted by the change in contract modality to net accounting treatment for handsets and value added services. Adjusted for this impact, total revenues increased by 5%.
• EBITDA grew by 1% as gross profit uplift was offset by increased opex from 4G related spending, larger network footprint and appeal deposit fee for SIM replacement tax. EBITDA margin remained stable at 58%.
• Capex was prioritised towards rolling out 4G services and building sufficient data capacity.
• In February Grameenphone acquired 2x5MHz 4G license in the 1800MHz frequency band and in addition they converted existing spectrum holdings to technology neutral spectrum for a total consideration of NOK 1.6 billion.

8 TELENOR FIRST QUARTER 2018
• In Myanmar, the competition remains intense as the operators are positioning themselves for the entry of a fourth player.
• The revenue trend from reduced voice usage and price reductions continued this quarter and resulted in revenue decline of 6% compared to last year.
• The subscription base decreased by 0.5 million during the quarter and the total base ended at 18.9 million, a slight increase of 1% from the same period last year.
• ARPU decreased by 9% as the decline in voice and interconnect, was slightly offset by data monetisation.
• EBITDA decreased by 6% as a result of the reduction in revenues, partly offset by reduced opex. The cost reduction was primarily within operation and maintenance, commission and a one-time effect related to tower lease.
• Capital expenditure continues to be driven by network expansion and 4G roll-out.
Broadcast
First quarter YearFirst
quarter
(NOK in millions)2018 2017 2017 201
IFRS15
Revenues
Canal Digital DTH 1 134 1 099 4 557 1 125
Satellite 209 227 892 209
Norkring 265 280 1 095 265
Other/Eliminations (119) (118) (472) (119)
Total revenues 1 489 1 488 6 071 1 480
Operating expenditures 423 455 1 771 434
EBITDA before other items
Canal Digital DTH 231 173 844 212
Satellite 135 152 585 135
Norkring 140 141 601 140
Other/Eliminations (2) (5) (33) (2)
Total EBITDA before other items 504 461 1 997 484
Operating profit
Canal Digital DTH 211 151 760 192
Satellite 59 60 613 59
Norkring 64 62 300 64
Other/Eliminations (2) - (32) (2)
Total operating profit 332 274 1 641 312
EBITDA before other items/Total revenues (%) 33.8 31.0 32.9 32.7
Capex 71 94 409 71
No. of subscriptions - Change in quarter/Total (in thousands):
DTH TV (15) (7) 838 (15)
• In the first quarter, Canal Digital launched a new set-up box, OnePlace, based on the Google Android TV platform.
• Total revenues in Broadcast were stable, as increased revenues in Canal Digital were offset by shut down of FM broadcasting in Norway and change to a financial lease for a satellite transponder.
• EBITDA increased by 9%, primarily a result of 7% opex reduction and lower hardware cost in Canal Digital. The opex reduction was driven by lower sales and customer service cost in Canal Digital, and reduced repair and maintenance cost in Norkring.
• Capital expenditure was primarily driven by roll-out of sites for mobile operators, expansion of the DAB network in Norway, and platform investments in Canal Digital.
Pakistan
First quarter YearFirst
quarter
(NOK in millions)2018 2017 2017 2018
IFRS15
Revenues
Subscription and traffic 1 465 1 640 6 644 1 469
Interconnect revenues 248 295 1 174 248
Other mobile revenues 5 6 20 5
Non-mobile revenues 53 87 342 53
Total revenues 1 772 2 029 8 181 1 775
Operating expenditures 651 739 2 788 651
EBITDA before other items 844 989 4 204 860
Operating profit 357 615 2 678 374
EBITDA before other items/Total revenues (%) 47.6 48.7 51.4 48.5
Capex 247 402 1 438 247
No. of subscriptions - Change in quarter/Total (in thousands): 1 023 623 41 625 1 023
ARPU - monthly (NOK) 14 16 16 14
Exchange rate (PKR) 0.0705 0.0806 0.0785 0.0705
• In Pakistan, the revenues experienced a slowdown at the beginning of the year, however more promising trends were observed from March. In addition, the removal of data tax exemption in one of the regions last year contributed negatively to the reported growth numbers.
• The number of subscriptions increased by 1.0 million during the quarter, taking the total base to 43 million, 6% higher than first quarter last year.
• Subscription and traffic revenues increased by 2% as the subscriptions growth was offset by a 4% decline in ARPU. Data revenues continue to support growth and adjusted for the negative impact from data tax exemption, the subscription and traffic revenue growth was 6%. Total revenues were flat following a decline in international interconnect traffic and lower handset sales.
• As a result of continued execution of efficiency initiatives, opex just slightly increased by 1%. Adjusted for reversal of accruals last year, opex decreased by 3%. The EBITDA margin was 48%.
• Capex was prioritised towards expanding the 4G network footprint with a 4G population coverage increase to 41%.
Myanmar
First quarter YearFirst
quarter
(NOK in millions)2018 2017 2017 2018
IFRS15
Revenues
Subscription and traffic 1 312 1 451 5 585 1 312
Interconnect revenues 222 260 941 222
Other mobile revenues 6 21 39 6
Non-mobile revenues 13 18 78 13
Total revenues 1 554 1 749 6 643 1 554
Operating expenditures 654 726 2 763 654
EBITDA before other items 667 746 2 869 667
Operating profit 337 502 1 796 337
EBITDA before other items/Total revenues (%) 42.9 42.7 43.2 42.9
Capex 206 270 2 545 206
No. of subscriptions - Change in quarter/Total (in thousands): (538) 543 19 474 (538)
ARPU - monthly (NOK) 27 31 29 27
Exchange rate (MMK) 0.0058 0.0062 0.0060 0.0058

9 TELENOR FIRST QUARTER 2018
Other units
First quarter YearFirst
quarter
(NOK in millions)2018 2017
Restated*2017
Restated*2018
IFRS15
Revenues
Global Wholesale 718 811 2 995 718
Corporate Functions 897 802 3 178 897
Digital Businesses incl. Financial services 324 256 1 221 324
Other / eliminations 58 95 366 58
Total revenues 1 997 1 963 7 760 1 997
Operating expenditures 1 289 1 345 5 299 1 289
EBITDA before other items
Global Wholesale 46 24 135 46
Corporate Functions (67) (137) (547) (67)
Digital Businesses incl. Financial services (26) (131) (403) (26)
Other / eliminations (1) 4 16 (1)
Total EBITDA before other items (47) (240) (799) (47)
Operating profit (loss)
Global Wholesale 25 10 56 25
Corporate Functions (157) (215) (421) (157)
Digital Businesses incl. Financial services (68) (165) (2 600) (68)
Other / eliminations (14) 56 25 (14)
Total operating profit (loss) (214) (314) (2 940) (214)
Capex 94 132 531 94
Investments in businesses 32 78 1 905 32
* Refer to note 7.
• In Global Wholesale, revenues decreased by NOK 93 million primarily driven by price continuous decreases, slightly offset by revenues from messaging and connectivity. EBITDA increased by NOK 22 million.
• In Corporate Functions, EBITDA improved due to lower cost from a more focused agenda.
• In Digital Businesses, revenues increased by 27% or NOK 68 million in the quarter. This was primarily due to inclusion of the Asian Online Classifieds operations from 1 July last year, strong growth in financial services in Myanmar and higher traffic revenues in our IoT business Telenor Connexion. EBITDA improved by NOK 105 million mainly due to cost reductions in Tapad and workforce reductions in Digital Businesses staff functions.

10 TELENOR FIRST QUARTER 2018
Group performance 2018
The comments below are related to Telenor’s development in 2018 compared to 2017. From first quarter 2018, Telenor’s operations in Hungary, Montenegro & Serbia and Bulgaria as well as Telenor Common Operation, Telenor Microfinance Bank and Telenor Banka are classified as discontinued operations. Consequently, historical consolidated income statement has been re-presented accordingly. Please refer to note 3 for further information.
Specification of other income and other expenses
First quarter Year
(NOK in millions) 2018 2017 2017
EBITDA before other income and other expenses 11 330 10 504 44 694
EBITDA before other income and other expenses (%) 41.8 38.1 39.9
Other income - - 140
Gains on disposals of fixed assets and operations 36 76 1 166
Losses on disposals of fixed assets and operations (31) (38) (231)
Workforce reductions, onerous (loss) contracts and one-time pension costs (181) (171) (941)
EBITDA 11 155 10 371 44 828
EBITDA margin (%) 41.1 37.6 40.0
In the first quarter of 2018 ‘Other income and other expenses’ consisted mainly of:• Workforce reductions of NOK 181 million (Telenor Norway NOK 91 million, Group Functions NOK 38 million).• Gain on disposals is related to partial divestment of Video Communication AS from a subsidiary to be an associated company.
In the first quarter of 2017 ‘Other income and other expenses’ consisted mainly of:• Gain on disposals related to divestment of ABC Startsiden.• Workforce reductions in Telenor Norway.
Operating profit• Reported operating profit increased from last year from improved EBITDA, partly offset by higher depreciations.
Financial items
First quarter Year
(NOK in millions) 2018 2017 2017
Financial income 452 131 1 564
Financial expenses (469) (765) (2 991)
Net currency gains (losses) 1 226 (64) 1 030
Net change in fair value of financial instruments 779 (193) 425
Net gains (losses and impairment) of financial assets and liabilities - 2 (181)
Net financial income (expenses) 1 988 (889) (152)
Gross interest expenses (369) (655) (2 600)
Net interest expenses (298) (588) (2 198)
• Financial income in the first quarter of 2018 includes dividend from VEON of NOK 345 million.• Net currency gains in the first quarter of 2018 are mainly due to revaluation of liabilities in foreign currency. The Norwegian Krone has appreciated against
all currencies the Group holds significant liabilities in. • Net change in fair value of financial instruments in the first quarter 2018 includes a NOK 825 million gain on the financial derivative features of the bond
exchangeable into VEON ADSs, compared to a loss of NOK 111 million in the same quarter last year.
Taxes• The underlying tax rate remains stable around 29%. For the first quarter of 2018 the effective tax rate is 30%.• The effective tax rate is higher than the underlying tax rate mainly due to recognition of tax provision of NOK 194 million in Q1. The provision made is based
on a decision received from the Norwegian Tax Authorities claiming that an impairment loss on receivable made in Cinclus in 2011 is not tax deductible. • The effective tax rate for the year 2018 is estimated to be around 30%.
Cash flow• Net cash inflow from operating activities during the first quarter of 2018 was NOK 8.6 billion, a decrease of NOK 0.3 billion compared to 2017. Higher
EBITDA in Norway, dtac, Sweden and Digi as well as dividends from VEON were more than offset by changes in working capital and other as well as higher taxes paid.
• Net cash outflow to investing activities during the first quarter of 2018 was NOK 5.5 billion, a decrease of NOK 0.4 billion compared to 2017. This is mainly due to lower cash outflows related to purchases of PPE, intangible assets and licence investments.
• Net cash outflow to financing activities during the first quarter of 2018 was NOK 3.0 billion. This is explained by net payments of borrowings of NOK 1.6 billion, share buyback of NOK 0.9 billion and payments to minority interest of NOK 0.4.
• Cash and cash equivalents decreased by NOK 0.2 billion during 2018 to NOK 22.1 billion as of 31 March 2018.
11 TELENOR FIRST QUARTER 2018
Financial position• During the first quarter of 2018, total assets decreased by NOK 5.3 billion to NOK 196.4 billion. This was mainly due to strengthening of Norwegian Krone
against all relevant currencies and reduction in the fair value of VEON shares. This was partly offset by increase in assets due to IFRS 15 implementation (see note 2 for further information).
• Net debt decreased by NOK 4.7 billion to NOK 42.2 billion. Interest-bearing liabilities excluding licence obligations decreased by NOK 7.1 billion partially offset by the decrease in cash and cash equivalents by NOK 1.6 billion, fixed income investments by NOK 0.5 billion and fair value hedge instrument receivables by NOK 0.3 billion.
• Total equity increased by NOK 3.5 billion to NOK 65.9 billion. This was mainly due to positive net income from operations of NOK 5.7 billion and IFRS 15 implementation effect of NOK 3.5 billion (see note 2 for further information), partially offset by decline in the fair value of VEON shares of NOK 2.8 billion, negative currency translation effects of NOK 1.7 billion and share buyback of NOK 0.9 billion.
Transactions with related partiesFor detailed information on related party transactions refer to Note 32 in Telenor’s Annual Report 2017.
Risk and uncertaintiesThe existing risks and uncertainties described below are expected to remain for the next three months. A significant share of Telenor’s revenues and profits is derived from operations outside Norway. Currency fluctuations may influence the reported figures in Norwegian Kroner significantly. Political risk, including regulatory conditions, may also influence the results. Telenor ASA seeks to allocate debt on the basis of equity market values in local currencies, predominantly EUR, USD and SEK. Foreign currency debt in Telenor ASA that exceeds the booked equity of investments in the same currency will not be part of an effective net investment hedge relationship. Currency fluctuations related to this part of the debt will be recorded in the income statement. For additional explanations regarding risks and uncertainties, please refer to the Report of the Board of Directors for 2017, section Risk Factors and Risk Management, and Telenor’s Annual Report 2017 Note 13 Income taxes, Note 28 Financial Risk Management and Note 33 Legal Disputes and Contingencies. Readers are also referred to the disclaimer at the end of this section.
DisclaimerThis report contains statements regarding the future in connection with Telenor’s growth initiatives, profit figures, outlook, strategies and objectives. In particular, the section ‘Outlook’ contains forward-looking statements regarding the Group’s expectations. All statements regarding the future are subject to inherent risks and uncertainties, and many factors can lead to actual profits and developments deviating substantially from what has been expressed or implied in such statements.
Fornebu, 23 April 2018The Board of Directors of Telenor ASA
12 TELENOR FIRST QUARTER 2018
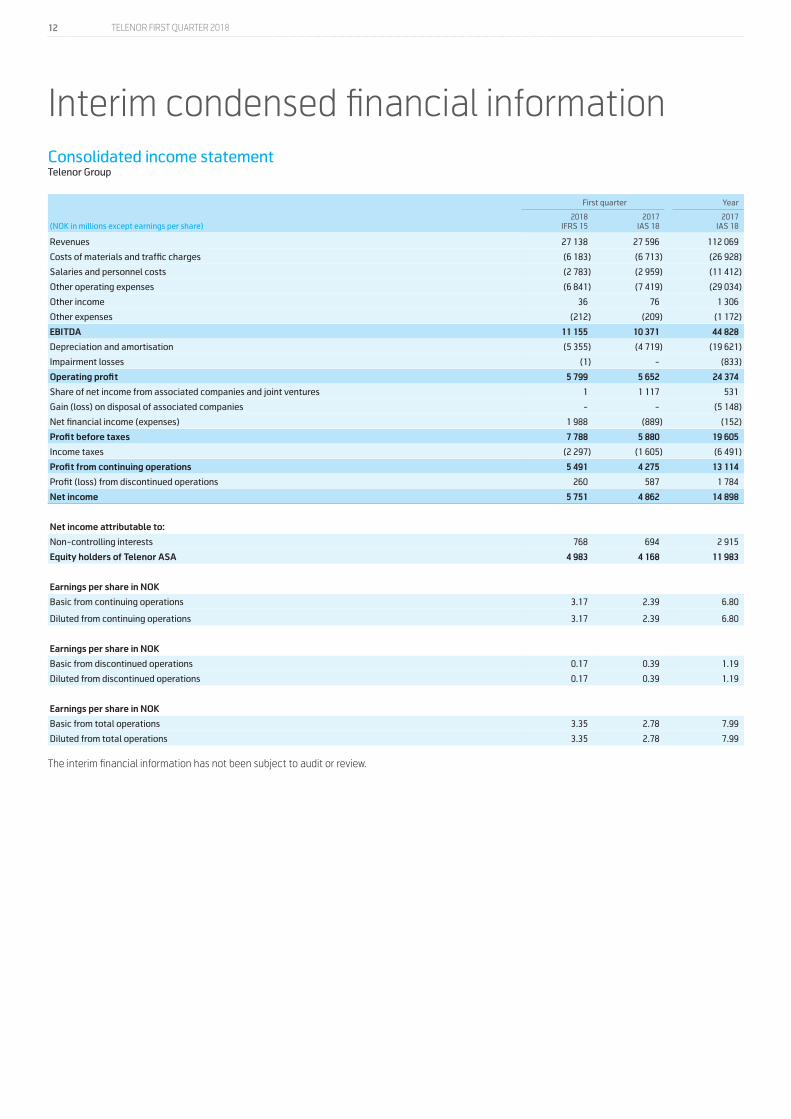
Interim condensed financial informationConsolidated income statementTelenor Group
First quarter Year
(NOK in millions except earnings per share)2018
IFRS 152017
IAS 182017
IAS 18
Revenues 27 138 27 596 112 069
Costs of materials and traffic charges (6 183) (6 713) (26 928)
Salaries and personnel costs (2 783) (2 959) (11 412)
Other operating expenses (6 841) (7 419) (29 034)
Other income 36 76 1 306
Other expenses (212) (209) (1 172)
EBITDA 11 155 10 371 44 828
Depreciation and amortisation (5 355) (4 719) (19 621)
Impairment losses (1) - (833)
Operating profit 5 799 5 652 24 374
Share of net income from associated companies and joint ventures 1 1 117 531
Gain (loss) on disposal of associated companies - - (5 148)
Net financial income (expenses) 1 988 (889) (152)
Profit before taxes 7 788 5 880 19 605
Income taxes (2 297) (1 605) (6 491)
Profit from continuing operations 5 491 4 275 13 114
Profit (loss) from discontinued operations 260 587 1 784
Net income 5 751 4 862 14 898
Net income attributable to:
Non-controlling interests 768 694 2 915
Equity holders of Telenor ASA 4 983 4 168 11 983
Earnings per share in NOK
Basic from continuing operations 3.17 2.39 6.80
Diluted from continuing operations 3.17 2.39 6.80
Earnings per share in NOK
Basic from discontinued operations 0.17 0.39 1.19
Diluted from discontinued operations 0.17 0.39 1.19
Earnings per share in NOK
Basic from total operations 3.35 2.78 7.99
Diluted from total operations 3.35 2.78 7.99
The interim financial information has not been subject to audit or review.

13 TELENOR FIRST QUARTER 2018
Consolidated statement of comprehensive income Telenor Group
First quarter Year
(NOK in millions) 2018 2017 2017
Net income 5 751 4 862 14 898
Translation differences on net investment in foreign operations (2 635) 296 2 296
Income taxes - (4) -
Amount reclassified from other comprehensive income to income statement on partial disposal - - (7 744)
Income taxes reclassified - - -
Net gain (loss) on hedge of net investment 1 199 (199) (1 426)
Income taxes (276) 48 342
Amount reclassified from other comprehensive income to income statement on partial disposal - - 4 094
Income taxes reclassified - - (1 119)
Share of other comprehensive income (loss) of associated companies and joint ventures (1) (331) (342)
Amount reclassified from other comprehensive income to income statement on disposal - - 12 282
Items that may be reclassified subsequently to income statement (1 713) (191) 8 383
Net gain (loss) on equity investments (2 785) 1 (633)
Remeasurement of defined benefit pension plans 249 (50) (63)
Income taxes (48) 14 -
Items that will not be reclassified to income statement (2 583) (35) (696)
Other comprehensive income (loss), net of taxes (4 296) (226) 7 687
Total comprehensive income 1 455 4 636 22 585
Total comprehensive income attributable to:
Non-controlling interests 657 756 2 897
Equity holders of Telenor ASA 797 3 880 19 688
The interim financial information has not been subject to audit or review.

14 TELENOR FIRST QUARTER 2018
Consolidated statement of financial position Telenor Group
(NOK in millions)31 March
201831 December
201731 March
2017
Deferred tax assets 1 677 1 917 1 825
Goodwill 13 833 26 446 24 786
Intangible assets 25 292 30 601 31 682
Property, plant and equipment 68 272 75 557 73 216
Associated companies and joint ventures 521 480 14 100
Other non-current assets 13 242 13 297 5 069
Total non-current assets 122 839 148 298 150 678
Prepaid taxes 1 126 1 076 868
Inventories 1 464 1 773 1 710
Trade and other receivables 19 619 24 749 24 156
Other current financial assets 674 1 622 2 416
Assets classified as held for sale 29 767 1 701 3 553
Cash and cash equivalents 20 959 22 546 26 135
Total current assets 73 608 53 468 58 837
Total assets 196 447 201 765 209 515
Equity attributable to equity holders of Telenor ASA 60 433 57 496 54 813
Non-controlling interests 5 428 4 839 4 933
Total equity 65 861 62 335 59 746
Non-current interest-bearing liabilities 47 433 51 587 53 041
Non-current non-interest-bearing liabilities 668 1 105 3 176
Deferred tax liabilities 3 973 3 359 2 926
Pension obligations 2 121 2 565 2 438
Provisions and obligations 3 652 4 132 3 462
Total non-current liabilities 57 846 62 747 65 042
Current interest-bearing liabilities 20 102 22 710 32 452
Trade and other payables 34 119 40 295 39 635
Current tax payables 5 209 4 438 3 699
Current non-interest-bearing liabilities 2 075 3 253 3 397
Provisions and obligations 1 513 1 777 1 668
Liabilities classified as held for sale 9 723 4 210 3 876
Total current liabilities 72 741 76 683 84 727
Total equity and liabilities 196 447 201 765 209 515
The interim financial information has not been subject to audit or review.

15 TELENOR FIRST QUARTER 2018
Consolidated statement of cash flows Telenor Group
First quarter Year
(NOK in millions) 20182017
Restated2017
Restated
Profit before taxes from total operations1) 8 119 6 532 21 751
Income taxes paid (1 563) (1 125) (6 100)
Net (gains) losses from disposals, impairments and change in fair value of financial assets and liabilities (775) 156 (1 212)
Depreciation, amortisation and impairment losses 5 842 5 117 22 166
Loss (profit) from associated companies and joint ventures (1) (1 117) 4 617
Dividends received from associated companies 8 - 24
Currency (gains) losses not related to operating activities (1 131) 2 (1 072)
Changes in working capital and other (1 891) (706) 550
Net cash flow from operating activities 8 607 8 857 40 723
Purchases of property, plant and equipment (PPE) and intangible assets (5 557) (5 921) (20 726)
Purchases of subsidiaries, associated companies and joint ventures, net of cash acquired - (5) (2 000)
Proceeds from disposal of PPE, intangible assets, associated companies and businesses, net of cash disposed - 92 7 511
Proceeds from sale and purchases of other investments 48 (82) 3 140
Net cash flow from investing activities (5 509) (5 916) (12 075)
Proceeds from and repayments of borrowings (1 579) 901 (12 574)
Payments on licence obligations - (149) (973)
Net payments on supply chain financing (166) (284) (221)
Share buyback by Telenor ASA (947) - (1 435)
Dividends paid to and purchases of shares from non-controlling interests (358) (343) (2 586)
Dividends paid to equity holders of Telenor ASA - (250) (11 944)
Net cash flow from financing activities (3 049) (124) (29 733)
Effects of exchange rate changes on cash and cash equivalents (288) 213 454
Net change in cash and cash equivalents (239) 3 031 (632)
Cash and cash equivalents at the beginning of the period 22 318 22 951 22 951
Cash and cash equivalents at the end of the period 2) 22 079 25 982 22 319
Of which cash and cash equivalents in assets held for sale at the end of the period 1 351 37 362
Cash and cash equivalents in continuing operations at the end of the period 20 728 25 945 21 957
1) Profit before taxes from total operations consists of: Profit before taxes from continuing operations 7 788 5 880 19 605 Profit before taxes from discontinued operations 331 652 2 147 Profit before taxes from total operations 8 119 6 532 21 751
2) As of 31 March 2018, restricted cash was NOK 426 million, while as of 31 March 2017, restricted cash was NOK 596 million.
Cash flow from discontinued operations
First quarter Year
(NOK in millions) 2018 2017 2017
Net cash flow from operating activities 102 383 3 589
Net cash flow from investing activities (258) (571) (1 290)
Net cash flow from financing activities 484 (134) (197)
The cash flows ascribed to discontinued operations are only cash flows from external transactions. Hence, the cash flows presented for discontinued operations do not reflect these operations as if they were standalone entities.
The interim financial information has not been subject to audit or review.

16 TELENOR FIRST QUARTER 2018
Consolidated statement of changes in equity Telenor Group
Attributable to equity holders of the parent
(NOK in millions) Total paid
in capital Other
reserves Retained earnings
Cumulative translation differences Total
Non-con-trolling
interests Total
equity
Equity as of 1 January 2017 9 078 (16 343) 58 000 144 50 879 4 517 55 396
Net income for the period - - 11 983 - 11 983 2 915 14 898
Other comprehensive income for the period - 11 247 - (3 542) 7 705 (18) 7 687
Total comprehensive income for the period - 11 247 11 983 (3 542) 19 688 2 897 22 585
Transactions with non-controlling interests - - - - - 67 67
Equity adjustments in associated companies and joint ventures - (539) 586 - 47 - 47
Dividends - - (11 694) - (11 694) (2 642) (14 335)
Share buyback (52) (1 424) - - (1 476) - (1 476)
Share - based payment, exercise of share options and distribution of shares - 52 - - 52 - 52
Equity as of 31 December 2017 - as previously reported 9 025 (7 006) 58 875 (3 398) 57 496 4 839 62 336
Changes in accounting principles - Note 1 - 164 3 147 - 3 312 291 3 603
Equity as of 1 January 2018 9 025 (6 842) 62 023 (3 398) 60 808 5 131 65 939
Net income for the period - - 4 983 - 4 983 768 5 751
Other comprehensive income for the period - (2 603) - (1 582) (4 185) (111) (4 296)
Total comprehensive income for the period - (2 603) 4 983 (1 582) 797 657 1 455
Transactions with non-controlling interests - - - - - 4 4
Dividends - - - - - (364) (364)
Share buyback (30) (875) - - (906) - (906)
Share - based payment, exercise of share options and distribution of shares - (267) - - (267) - (267)
Equity as of 31 March 2018 8 995 (10 588) 67 005 (4 980) 60 433 5 428 65 861
(NOK in millions) Total paid
in capital Other
reserves Retained earnings
Cumulative translation differences Total
Non-con-trolling
interests Total
equity
Equity as of 1 January 2017 9 078 (16 343) 58 000 144 50 879 4 517 55 396
Net income for the period - - 4 168 - 4 168 694 4 862
Other comprehensive income for the period - (366) - 77 (288) 62 (226)
Total comprehensive income for the period - (366) 4 168 77 3 880 756 4 636
Transactions with non-controlling interests - - - - - 20 20
Equity adjustments in associated companies and joint ventures - 47 - - 47 - 47
Dividends - - - - - (360) (360)
Share - based payment, exercise of share options and distribution of shares - 8 - - 8 - 8
Equity as of 31 March 2017 9 078 (16 654) 62 169 221 54 813 4 933 59 746
The interim financial information has not been subject to audit or review.

17 TELENOR FIRST QUARTER 2018
Note 1 – General accounting principlesTelenor (the Group) consists of Telenor ASA (the Company) and its subsidiaries. Telenor ASA is a limited liability company, incorporated in Norway. The condensed consolidated interim financial statements consist of the Group and the Group’s interests in associated companies and joint arrangements. As a result of rounding differences, numbers or percentages may not add up to the total.
These interim condensed consolidated financial statements for the three months ending 31 March 2018, have been prepared in accordance with IAS 34 Interim Financial Reporting. The interim condensed consolidated financial statements do not include all the information and disclosures required in the Annual Financial Statements and should be read in conjunction with the Group’s Annual Financial Statements 2017. The accounting policies adopted in the preparation of the interim consolidated financial statements are consistent with those followed in the preparation of the Group’s Annual Financial Statements for the year ended 31 December 2017, with the exceptions stated below.
• IFRS 15 Revenue from Contracts with Customers (effective from 1 January 2018). IFRS 15 establishes a new five-step model that will apply to revenue arising from contracts with customers. The main implications from the implementation IFRS 15 for the Group are the following:
- Allocation based on stand-alone selling prices: IFRS 15 requires allocation of the total consideration in a contract between elements in multiple elements arrangements based on the stand-alone selling prices for the goods and services included. The Group’s past accounting policy was to cap the revenue of delivered items to the amount that is not contingent on delivery of additional items or other specified performance criteria. This change has a material impact on the revenue recognition where a significant discount is provided to the customer on day one. In such circumstances the new revenue recognition standard impacted the average revenue per subscription per month (ARPU) negatively and increased handset revenues. As a consequence and in isolation, recognised gross margins on handset sales will improved.
- Multiple element arrangements sold through external channels: In some markets where handsets and subscriptions are sold through external channels, the Group is the principal in the subscription sale only, while the handset is regarded as sold by the dealer on instalment plans collected by the Group. For arrangements where the dealer is compensated through commission, and where there are no clear links between the payment to the dealer and the collection of consideration from the customer, the current accounting policy of the Group is to recognise a commission expense and increased subscription revenue. Under IFRS 15 the commission will be offset against revenue to the extent it is possible to establish a link between the commission to the dealer, which is passed on to the customer, and the consideration from the customer subsequently collected by the Group. Consequently, the ARPU will be negatively impacted in these arrangements.
- Incremental cost for obtaining a contract: Incremental costs for obtaining a contract, such as sales commissions, were under the previous accounting policy expensed as incurred. IFRS 15 requires capitalisation of such cost if the amortisation period is more than 12 months. The amortisation period is the expected contract period, including renewals. Amortisation of the capitalised cost of obtaining a customer is recognised as part of EBITDA. As a practical expedient, the Group is in most cases amortising contract costs on a portfolio level for contracts (or performance obligations) with similar characteristics since the expectation is that the effects on the consolidated financial statements would not differ materially from amortising contract by contract.
- Transition methods: The Group has chosen to apply the modified approach for transition to IFRS 15, which implies: - Comparative figures for 2017 are not restated.- Disclosures reconciling each financial statement line item in
2018 with the current IFRS standards and interpretations, and explanations are provided for significant changes.
- The cumulative effect of initially applying IFRS 15 was recognised as an adjustment to opening balance 1 January 2018, reflecting the contract asset and liability for open contracts as trade and other receivables and trade and other payables, and the capitalisation of cost of obtaining and fulfilling a contract as other non-current assets. Comparative numbers have not be restated and financial statements based on accounting policies for 2017 have been disclosed in note 2, together with the effect on opening balance 1 January 2018:
• Presentation in statement of cash flow. The Group has introduced supply chain financing for some vendors and in some circumstances the payment terms in the contract with the vendor are linked to the supply chain financing arrangement. In such circumstances, the payable for the services or goods delivered are reclassified from trade payables to current non-interest-bearing liabilities and the cash outflow to the financial institution has been presented as financing activities in the Statement of Cash Flows. As of 1 January 2018, the Group has changed the accounting policy for presenting such arrangements in the statement of cash flow. When the payable is reclassified from trade payable to current non-interest-bearing liability, the Group show a cash outflow from operating activities if it is related to operating activities and cash outflow from investing activities if it is related to investing activities. At the same time a cash inflow is recognised in financing activities, reflecting the required payment to the financial institution providing the supply chain financing arrangement. When the Group make the payment to the finance institution, it will be reflected as a repayment of debt in financing activities in the statement of cash flow. The comparative numbers are restated as followed:
Notes to the interim consolidated financial statements

18 TELENOR FIRST QUARTER 2018
Reported Restated Reported Restated Reported Restated Reported Restated Reported Restated
(NOK in millions)
First quarter
2017
First quarter
2017
Second quarter
2017
Second quarter
2017
Third quarter
2017
Third quarter
2017
Fourth quarter
2017
Fourth quarter
2017Year
2017Year 2017
Cash flow from operating activities
Changes in working capital and other (400) (706) 122 (186) 1 223 864 929 578 1 873 550
Cash flow from investing activities
Purchases of property, plant and equipment (PPE) and intangible assets (5 377) (5 921) (4 583) (5 177) (3 883) (4 446) (4 518) (5 182) (18 361) (20 726)
Cash flow from financing activities
Net payments on supply chain financing (1 133) (284) (877) 25 (899) 23 (1 000) 15 (3 909) (221)
share-based payment transaction, is from 1 January 2018 accounted for as equity-settled share-based payment transactions. The liability of NOK 164 million as of 31 December 2017 has been reclassified to equity 1 January 2018.
For information about the standards and interpretations effective from 1 January 2018, please refer to Note 1 in the Group’s Annual Report 2017. Except for the changes described in note 1 and 2, none of the standards and interpretations effective from 1 January 2018 have a significant impact on the Group’s consolidated interim financial statements.
• IFRS 9 Financial Instruments (effective from 1 January 2018). IFRS 9 replaces the old incurred loss model with an expected loss model. This new model had a minor increase in provision for bad debt, as a provision for bad debt will be recognised before any event has happened as required under an incurred loss model. The Group has elected to use the simplified approach as described in IFRS 9.
• Amendments to IFRS 2 Share-based payments (effective from 1 January 2018). The amendment changes the accounting for share-based payment arrangements where the Group is obligated to withhold an amount for an employee’s tax obligation associated with a share-based payment and transfer that amount, normally in cash, to the tax authority on the employee’s behalf. This part of the share-based payment arrangements, which previously has been recognised as a cash settled
Note 2 – Disaggregation of revenueIn the following table revenue is disaggregated by major revenue streams divided into the reportable segments as shown in note 7.
(NOK in millions) Norway Sweden Denmarkdtac
ThailandDigi
MalaysiaGrameenphone
Bangladesh Pakistan Myanmar BroadcastOther units Eliminations Group
Total revenue 6 294 3 197 1 213 4 783 3 263 2 952 1 775 1 554 1 480 1 979 (1 355) 27 138
Type of good/ services
Mobile operation 3 616 2 292 1 083 4 783 3 263 2 952 1 775 1 554 - - (189) 21 129
Services 3 171 1 827 861 4 198 2 976 2 952 1 761 1 554 - - (189) 19 111
Goods 445 465 222 585 287 - 14 - - - (0) 2 018
Fixed operation 2 678 905 131 - - - - - - 702 (261) 4 155
Services 2 515 884 131 - - - - - - 702 (261) 3 972
Goods 162 21 - - - - - - - - - 183
Satelitte and TV distribution - - - - - - - - 1 480 - (58) 1 423
Services - - - - - - - - 1 442 - (58) 1 384
Goods - - - - - - - - 39 - - 39
Other - - - - - - - - - 1 276 (847) 429
Services - - - - - - - - - 1 276 (847) 429
Goods - - - - - - - - - - - -
Sum type of good/ services 6 294 3 197 1 213 4 783 3 263 2 952 1 775 1 554 1 480 1 979 (1 355) 27 138
Type of mobile subscription
Contract 2 757 1 622 801 2 264 1 112 110 52 8 - - (27) 8 699
Prepaid 49 38 - 1 792 1 779 2 794 1 664 1 527 - - (76) 9 566
Other* 365 167 60 142 86 48 45 20 - - (86) 845
Sum mobile subscription 3 171 1 827 861 4 198 2 976 2 952 1 761 1 554 - - (189) 19 111
Timing of revenue recognition
Over time 5 686 2 711 991 4 198 2 976 2 952 1 761 1 554 1 442 1 979 (1 355) 24 898
At a point in time 607 486 222 585 287 - 14 - 39 - - 2 240
Total revenues 6 294 3 197 1 213 4 783 3 263 2 952 1 775 1 554 1 480 1 979 (1 355) 27 138
* Other inclues revenue from Interconnect, roaming, telemetrics and wholesale.

19 TELENOR FIRST QUARTER 2018
Impacts related to IFRS 15 Revenue from Contracts with CustomersThe Group used the modified retrospective approach when implementing IFRS 15 Revenue from contracts with customers from 1 January 2018. The tables below show the impact from IFRS 15 on the opening balance and for the first quarter 2018.
Consolidated Income Statement
(NOK in millions)
Reported first quarter 2018
(IFRS 15)ImpactIFRS 15
Adjusted first quarter 2018
(IAS 18)
Reported first quarter 2017
(IAS 18)
Revenues 27 138 (25) 27 113 27 596
Cost of materials and traffic charges (6 183) (31) (6 214) (6 713)
Salaries and personnel costs (2 783) (8) (2 791) (2 959)
Other operating expenses (6 841) 43 (6 799) (7 419)
Other income 36 36 76
Other expenses (212) (212) (209)
EBITDA 11 155 (22) 11 133 10 371
Depreciation and amortisation (5 355) (5 355) (4 719)
Impairment losses (1) (1) -
Operating profit 5 799 (22) 5 777 5 652
Share of net income from associated companies and joint ventures 1 1 1 117
Gain (loss) on disposal of associated companies - - -
Net financial income (expenses) 1 988 1 988 (889)
Profit before taxes 7 788 (22) 7 766 5 880
Income taxes (2 297) (1) (2 298) (1 605)
Profit from Continuing operations 5 491 (23) 5 468 4 275
Profit (loss) from discontinued operations 260 27 287 587
Net income 5 751 4 5 755 4 862
Consolidated statement of financial position
(NOK in millions)
Opening balance31 December 2017
(IAS 18)Impact IFRS 15
1 January 2018(IFRS 15)
31 March 2018Reported 31 March
2018(IFRS 15)
Impact IFRS 15
Adjusted 31 March 2018
(IAS 18)
Deferred tax assets 1 917 (201) 1 716 1 677 46 1 723
Goodwill 26 446 26 446 13 833 13 833
Intangible assets 30 601 30 601 25 292 25 292
Property, plant and equipment 75 557 75 557 68 272 68 272
Associated companies and joint ventures 480 480 521 521
Other non-current assets 13 297 3 475 16 772 13 242 (3 069) 10 173
Total non-current assets 148 298 3 273 151 571 122 839 (3 023) 119 816
Prepaid taxes 1 076 1 076 1 126 1 126
Inventories 1 773 1 773 1 464 1 464
Trade and other receivables 24 749 1 026 25 775 19 619 (558) 19 061
Other current financial assets 1 622 1 622 674 674
Assets classified as held for sale 1 701 1 701 29 767 (757) 29 010
Cash and cash equivalents 22 546 22 546 20 959 20 959
Total current assets 53 468 1 026 54 494 73 608 (1 315) 72 293
Total assets 201 765 4 300 206 065 196 447 (4 338) 192 109
Equity attributable to equity holders of Telenor ASA 57 496 3 161 60 657 60 433 (3 068) 57 365
Non-controlling interests 4 839 291 5 130 5 428 (310) 5 118
Total equity 62 335 3 453 65 788 65 861 (3 378) 62 482
Non-current interest-bearing liabilities 51 587 51 587 47 433 47 433
Non-current non-interest-bearing liabilities 1 105 1 105 668 668
Deferred tax liabilities 3 359 820 4 179 3 973 (804) 3 169
Pension obligations 2 565 2 565 2 121 2 121
Provisions and obligations 4 132 4 132 3 652 3 652
Total non-current liabilities 62 747 820 63 568 57 846 (804) 57 042
Current interest-bearing liabilities 22 710 22 710 20 102 20 102
Trade and other payables 40 295 28 40 323 34 119 (61) 34 058
Current tax payables 4 438 4 438 5 209 (21) 5 189
Current non-interest-bearing liabilities 3 253 3 253 2 075 2 075
Provisions and obligations 1 777 1 777 1 513 1 513
Liabilities classified as held for sale 4 210 4 210 9 723 (74) 9 649
Total current liabilities 76 683 28 76 710 72 741 (156) 72 585
Total equity and liabilities 201 765 4 300 206 065 196 447 (4 338) 192 109

20 TELENOR FIRST QUARTER 2018
Note 3 – Discontinued operations and assets held for sale As of 31 March 2018, the Group has classified the disposal groups Telenor India, Financial Services, consisting of Telenor Banka in Serbia and Telenor Microfinance Bank in Pakistan, and Central Eastern Europe as discontinued operations and held for sale. Details from each disposal group are described below.
The results of all three disposals group for the first quarter of 2017 and 2018, and the year 2017 are as follows:
First quarter Year
(NOK in millions) 2018 2017 2017
Revenue 3 848 4 176 17 059
EBITDA 841 994 4 002
EBIT 390 596 2 290
Profit before tax 331 652 2 147
Income taxes (71) (65) (363)
Profit after tax 260 587 1 784
The major classes of assets and liabilities of the three disposal groups classified as held for sale as of 31 March:(NOK in millions) 31 March 2018
Assets
Property, Plant and Equipment 4 380
Goodwill 11 863
Intangible assets 4 582
Other non-current assets 1 286
Inventory 359
Trade and other receivables 5 940
Cash and cash equivalents 1 358
Total assets classified as held for sale 29 767
Liabilities
Non-current liabilities 2 565
Current liabilities 7 158
Total liabilities held for sale 9 723
Central Eastern EuropeOn 20 March 2018 Telenor entered into an agreement to sell its assets in Central and Eastern Europe (CEE) to PPF Group for EUR 2.8 billion (around NOK 27 billion) on an enterprise value basis.
The transaction includes Telenor’s wholly-owned mobile operations in Hungary, Bulgaria, Montenegro and Serbia and the technology service provider Telenor Common Operation. The CEE operations contributed approximately 9% of Telenor Group’s revenues and 8% of EBITDA in 2017, and have more than 9 million customers and around 3,500 employees.
The transaction requires necessary regulatory approval. The transaction is expected to be completed within Q3 2018. With effect from first quarter 2018, the CEE operations are classified as asset held for sale and discontinued operations in Telenor Group’s financial reporting. The comparative numbers for the income statement are represented. Based on exchange rates as of 31 March 2018, the transaction is estimated to result in an accounting gain after tax of around NOK 3 billion. The results of the CEE operations for the first quarter of 2017 and 2018, and the year 2017 are as follows:
First quarter Year
(NOK in millions) 2018 2017 2017
Revenue 2 903 2 579 11 473
EBITDA 1 061 902 4 122
EBIT 622 521 2 522
Profit before tax 628 524 2 482
Income taxes ( 85) ( 62) ( 339)
Profit after tax 543 462 2 143
The major classes of assets and liabilities of the CEE operations classified as held for sale as of 31 March are as follows:(NOK in millions) 31 March 2018
Assets
Property, Plant and Equipment 4 265
Goodwill 11 832
Intangible assets 4 335
Other non-current assets 225
Inventory 358
Trade and other receivables 3 475
Cash and cash equivalents 461
Total assets classified as held for sale 24 952
Liabilities
Non-current liabilities 615
Current liabilities 2 704
Total liabilities held for sale 3 319
Financial Services On 13 March 2018 the Group reached a strategic partnership agreement with Ant Financial Services Group (“Ant Financial”) in Pakistan, where Ant Financial will invest over a two years period USD 184.5 million for a 45% stake in Telenor Microfinance Bank (“TMB”), a subsidiary of Telenor Group. The investment will be partly capital injection and partly consideration for sale of shares.
The first part of the transaction is expected to close within 12 months and result in a joint venture between Ant Financial and Telenor. With effect from first quarter 2018, Telenor Microfinance Bank is classified as held for sale in the Group’s statement of financial position. Telenor Microfinance Bank together with Telenor Banka, which was classified as held for sale from third quarter 2017, are classified as discontinued operations in our income statement and comparative numbers will be represented. Telenor Microfinance Bank and Telenor Banka are the main contributors to the operational segment Financial Services, disclosed as part of other units in the Group’s segment reporting. The results of the Financial Services classified as discontinued operations for the first quarter of 2017 and 2018, and the year 2017 are as follows:
First quarter Year
(NOK in millions) 2018 2017 2017
Revenue 305 288 1 240
EBITDA 13 16 ( 33)
EBIT 2 6 ( 131)
Profit before tax 2 8 ( 128)
Income taxes ( 2) ( 3) ( 24)
Profit after tax ( 0) 5 ( 152)
The major classes of assets and liabilities of Financial Services classified as held for sale as of 31 March are as follows:(NOK in millions) 31 March 2018
Assets
Property, Plant and Equipment 114
Goodwill 31
Intangible assets 4
Other non-current assets 745
Inventory -
Trade and other receivables 2 091
Cash and cash equivalents 890
Total assets classified as held for sale 3 875
Liabilities
Non-current liabilities 9
Current liabilities 3 509
Total liabilities held for sale 3 518

21 TELENOR FIRST QUARTER 2018
Telenor IndiaOn 23 February 2017, the Group entered into a definitive agreement with Bharti Airtel Limited (Airtel), whereby Airtel will take full ownership of Telenor India. According to the agreement, Airtel and Telenor India will merge and Airtel will take over Telenor India as soon as all necessary approvals are received. As part of the agreement, Airtel will take over outstanding spectrum payments and other operational contracts, including tower lease.
The transaction is subject to requisite regulatory approvals, including approvals from the Department of Telecommunications in India (DoT) and the Competition Commission of India. The exposure to claims related to the period Telenor owned the business, will remain with Telenor.
The transaction is expected to close within the second quarter 2018. Telenor India is presented as discontinued operation in the consolidated income statement and classified as held for sale in the consolidated statement of financial position.
The results of Telenor India for the first quarter of 2017 and 2018, the year 2017 are presented below:
First quarter Year
(NOK in millions) 2018 2017 2017
Revenue 640 1 308 4 346
EBITDA ( 233) 76 ( 86)
EBIT ( 233) 68 ( 100)
Profit before tax ( 282) 120 ( 207)
Income taxes - - -
Profit after tax ( 282) 120 ( 207)
The major classes of assets and liabilities of Telenor India classified as held for sale as of 31 March 2018:(NOK in millions) 31 March 2018
Assets
Property, Plant and Equipment -
Goodwill -
Intangible assets 243
Other non-current assets 316
Inventory 1
Trade and other receivables 375
Cash and cash equivalents 7
Total assets classified as held for sale 941
Liabilities
Non-current liabilities 1 941
Current liabilities 945
Total liabilities held for sale 2 887
Note 4 – Interest-bearing liabilitiesConcurrently with the equity offering of the VEON ADSs on 15 September 2016, Telenor East Holding II AS, an indirectly wholly owned subsidiary of Telenor ASA (“Telenor”), placed USD 1,000 million aggregate principal amount of senior, unsecured bonds (the “Bonds”) exchangeable into VEON ADSs.
The Bonds have an expected maturity life of 3 years and a fixed coupon of 0.25% per annum, payable semi-annually. The exchangeable bond is in the statement of financial position split into an interest-bearing liability recognised at amortised cost and a financial derivative recognised at fair value. As of the placement date the carrying amount of the interest-bearing liability was NOK 7.9 billion (USD 956 million).
Each USD 200,000 bond is exchangeable for 47,186 VEON ADSs (adjusted for VEON dividend and subject to further adjustments), which represents an exchange price of approximately USD 4.24. The initial exchange price represented a 40% premium to the reference equity offering price of USD 3.50 per ADS. Underlying the exchangeable bonds are approximately 236 million VEON ADSs (subject to certain adjustments), corresponding to approximately 13.4% of VEON’s total share capital. Upon the maturity of the Bonds, the Issuer may redeem each USD 200,000 bond that has not been previously exchanged by paying cash, by transferring up to 70,779 ADSs
(150% of 47,186 ADS underlying each bond) or by paying and transferring a mix of cash and ADSs, in each case with a market value of USD 200,000. Additionally, Telenor may redeem the bonds at their USD 200,000 principal amount, together with accrued interest, for cash at any time on or after 12 October 2018 provided that the market value of the 47,186 VEON ADSs underlying each Bond is at least USD 260,000, effectively encouraging bondholders to exercise their exchange right and accelerating Telenor’s divestment of its VEON ADSs.
The Bonds are listed on the Open Market (Freiverkehr) segment of Frankfurt stock exchange.
Fair value of interest-bearing liabilities recognised at amortised cost:
31 March 2017
NOK in millions Carrying amount Fair value
Interest-bearing liabilities (67 534) (69 953)
of which fair value level 1 (52 019)
of which fair value level 2 (17 934)
31 December 2017
Carrying amount Fair value
Interest-bearing liabilities (74 296) (77 327)
of which fair value level 1 (58 556)
of which fair value level 2 (18 771)
31 March 2017
Carrying amount Fair value
Interest-bearing liabilities (85 493) (89 023)
of which fair value level 1 (61 505)
of which fair value level 2 (27 518)
Note 5 –Fair value of financial instrumentsFinancial derivatives are recognised at fair value based on observable market data (level 2). See note 29 in the Annual Report 2017 for valuation methodologies. The financial derivatives are classified in the consolidated statement of financial position as disclosed in the table:
NOK in millions31 March
201831 December
201731 March
2017
Other non-current assets 2 642 2 430 2 229
Other current financial assets 270 707 1 075
Non-current non-interest-bearing liabilities (539) (953) (2 891)
Non-current interest-bearing liabilities - - (20)
Current non-interest-bearing liabilities (740) (1 793) (2 124)
Total 1 633 391 (1 731)
Note 6 –Events after the reporting periodDigi – Malaysia On 13 April 2018, the Board of Directors of Digi declared the first interim dividend for 2018 of MYR 0.049 per share, which corresponds to approximately NOK 0.8 billion total dividend and approximately NOK 0.4 billion for Telenor ownership share.
dtac - ThailandOn 23 April 2018, Telenor and the state enterprise TOT signed the partnership agreement to launch 4G services on TOT’s 2300 MHz spectrum. TOT holds 60 MHz of TDD spectrum in the 2300 MHz frequency band. dtac will build a network based on this spectrum and have the right to utilize up to 60% of the capacity in this network, for a fixed annual fee of THB 4.5 billion (approx. NOK 1.1 billion). The collaborative framework last through 2025.

22 TELENOR FIRST QUARTER 2018
Note 7 – Segment information and reconciliation of ebitda before other income and other expensesTelenor Capture AS, previously reported as part of Other units, is now reported as part of Telenor Norway. Telenor Capture AS delivers apps like MyTelenor and MyContacts. The segment information for 2017 has been restated to reflect this.
The segment information is reported in accordance with the reporting to Group Executive Management (chief operating decisionmakers) and is consistent with financial information used for assessing performance and allocating resources. For the period 2017 and 2018 the accounting principles as applied in the financial statements for 2017 are used, meaning the effect of IFRS 15 in 2018 is excluded in the segment reporting.
The operationsFirst quarter
Total revenues of which internalEBITDA before other income and
other expenses1) Investments2)
(NOK in millions)2018 2017
RestatedGrowth 2018 2017
Restated2018 Margin 2017
RestatedMargin 2018 2017
Restated
Norway 6 319 6 241 1.3% 84 89 2 765 43.8% 2 579 41.3% 720 1 155
Sweden 3 193 3 056 4.5% 10 11 1 070 33.5% 920 30.1% 301 307
Denmark 1 234 1 249 (1.2%) 23 20 248 20.1% 222 17.8% 93 108
dtac - Thailand 4 781 4 751 0.6% 20 29 2 073 43.4% 1 656 34.9% 615 1 076
Digi - Malaysia 3 191 2 989 6.8% 2 5 1 474 46.2% 1 353 45.3% 362 368
Grameenphone - Bangladesh 2 952 3 277 (9.9%) - - 1 701 57.6% 1 903 58.1% 1 977 480
Pakistan 1 772 2 029 (12.7%) 36 29 844 47.6% 989 48.7% 247 402
Myanmar 1 554 1 749 (11.2%) 56 68 667 42.9% 746 42.7% 206 270
Broadcast 1 489 1 488 0.1% 58 51 504 33.8% 461 31.0% 71 94
Other units 1 997 1 963 1.7% 1 080 894 (47) nm (240) nm 126 210
Eliminations (1 369) (1 196) (14.4%) (1 369) (1 196) 10 nm (85) nm - -
Group (IAS18) 27 113 27 596 (1.8%) - - 11 309 41.7% 10 504 38.1% 4 719 4 470
IFRS15 adjustments 25 - - - - 22 nm - nm - -
Group (IFRS15) 27 138 27 596 (1.7%) - - 11 330 41.8% 10 504 38.1% 4 719 4 470
1) The segment profit is EBITDA before other income and other expenses. 2) Investments consist of capex and investments in businesses.
Reconciliation
First quarter Year
(NOK in millions) 2018 2017 2017
EBITDA 11 155 10 371 44 828
Other income 36 76 1 306
Other expenses (212) (209) (1 172)
EBITDA before other income and other expenses 11 330 10 504 44 694

23 TELENOR FIRST QUARTER 2018
DefinitionsTelenor Group’s financial information is prepared in accordance with international financial reporting standards (IFRS). In addition it is management’s intent to provide alternative performance measures that are regularly reviewed by management to enhance the understanding of Telenor’s performance, but not instead of, the financial statements prepared in accordance with IFRS. The alternative performance measures presented may be determined or calculated differently by other companies.
The principles for measurement of the alternative performance measures are in accordance with the principles used both for segment reporting in Note 7 and internal reporting to Group Executive Management (chief operating decisionmakers) and are consistent with financial information used for assessing performance and allocating resources.
Organic revenue growthOrganic revenue is defined as revenue adjusted for the effects of acquisition and disposal of operations and currency effects. We believe that the measure provides useful and necessary information to investors and other related parties for the following reasons:• it provides additional information on underlying growth of the business without the effect of certain factors unrelated to its operating performance;• it is used for internal performance analysis; and• it facilitates comparability of underlying growth with other companies (although the term “organic” is not a defined term under IFRS and may not,
therefore, be comparable with similarly titled measures reported by other companies).
Reconciliation
(NOK in millions)Change first quarter
2018Change
YoYChange first quarter
2017Change
YoY
Reported revenue growth (483) (1.8%) (879) (3.1%)
Impact using exchange rates for 2018 243 970
M&A (170) (12)
Organic revenue growth (410) (1.5%) 79 0.3%
Organic subscription and traffic revenue growthSubscription and traffic revenues consist of revenues from mobile subscription and traffic, fixed telephony, fixed Internet/TV, fixed data services and Canal Digital DTH.
Organic subscription and traffic revenues are defined as subscription and traffic revenues adjusted for the effects of acquisition and disposal of operations and currency effects. We believe that the measure provides useful and necessary information to investors and other related parties for the following reasons:• it refers to the core revenue streams of the business making up more than 75% of total revenues and almost the entire gross profit for the Group;• it provides additional information on underlying growth of the business within these core revenue streams, without the effect of certain factors unrelated to
its operating performance;• it is used for internal performance analysis; and• it facilitates comparability of underlying growth with other companies (although neither “subscription and traffic revenues” nor the term “organic” are
defined terms under IFRS and may not, therefore, be comparable with similarly titled measures reported by other companies).
Reconciliation
(NOK in millions)Change first quarter
2018Change
YoYChange first quarter
2017Change
YoY
Reported subscription and traffic revenue growth (20) (0.1%) (544) (2.5%)
Impact using exchange rates for 2018 231 799
M&A - -
Organic subscription and traffic revenue growth 211 1.0% 255 1.2%
Subscription and traffic revenues
First quarter Year
(NOK in millions) 2018 2017 2017
Mobile subscription and traffic 17 218 17 270 70 290
Fixed telephony 422 525 1 942
Fixed Internet/TV 2 229 2 133 8 873
Fixed data services 165 160 697
Canal Digital DTH 1 123 1 090 4 513
Subscription and traffic revenues 21 157 21 177 86 314
Other revenues 5 956 6 419 25 755
Total revenues 27 113 27 596 112 069
Operating expenditures (opex)Operating expenditures (opex) is a key financial parameter for Telenor and is derived directly from the income statement, consisting of salaries and personnel cost and other operating expenses. Telenor’s continuously effort to improve efficiencies makes opex a key financial parameter to follow. It is also used for internal performance analysis.
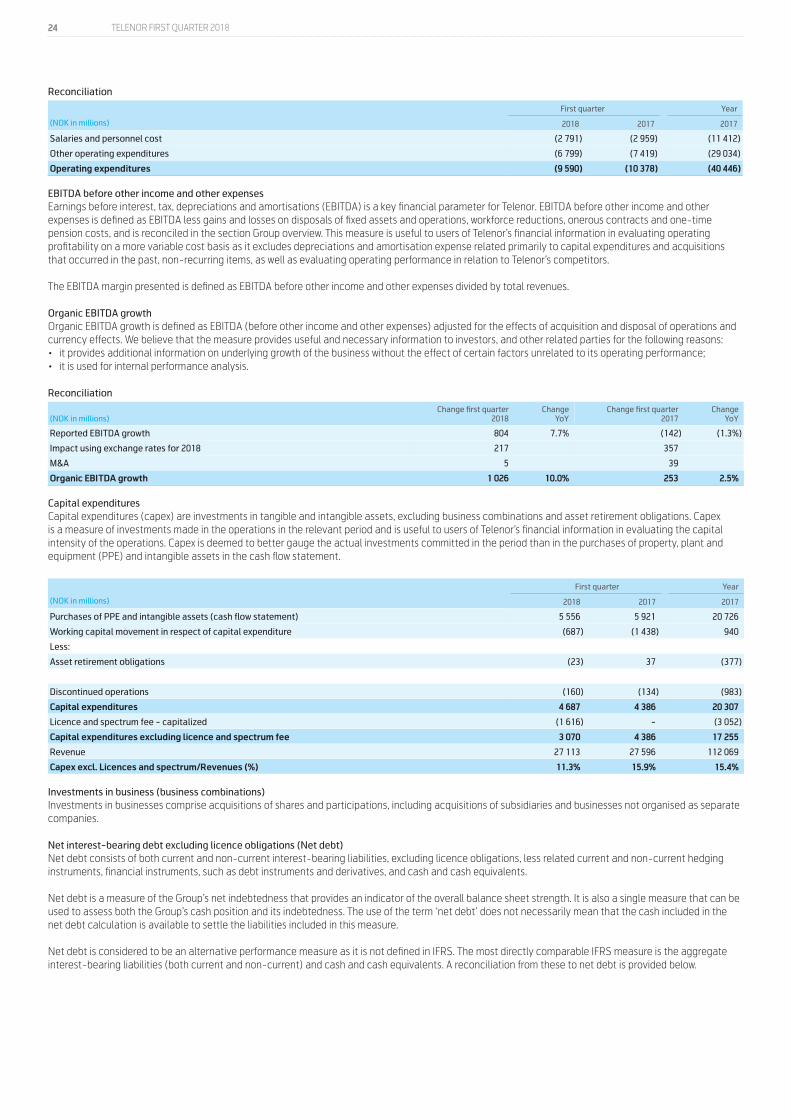
24 TELENOR FIRST QUARTER 2018
Reconciliation
First quarter Year
(NOK in millions) 2018 2017 2017
Salaries and personnel cost (2 791) (2 959) (11 412)
Other operating expenditures (6 799) (7 419) (29 034)
Operating expenditures (9 590) (10 378) (40 446)
EBITDA before other income and other expensesEarnings before interest, tax, depreciations and amortisations (EBITDA) is a key financial parameter for Telenor. EBITDA before other income and other expenses is defined as EBITDA less gains and losses on disposals of fixed assets and operations, workforce reductions, onerous contracts and one-time pension costs, and is reconciled in the section Group overview. This measure is useful to users of Telenor’s financial information in evaluating operating profitability on a more variable cost basis as it excludes depreciations and amortisation expense related primarily to capital expenditures and acquisitions that occurred in the past, non-recurring items, as well as evaluating operating performance in relation to Telenor’s competitors.
The EBITDA margin presented is defined as EBITDA before other income and other expenses divided by total revenues.
Organic EBITDA growthOrganic EBITDA growth is defined as EBITDA (before other income and other expenses) adjusted for the effects of acquisition and disposal of operations and currency effects. We believe that the measure provides useful and necessary information to investors, and other related parties for the following reasons:• it provides additional information on underlying growth of the business without the effect of certain factors unrelated to its operating performance;• it is used for internal performance analysis.
Reconciliation
(NOK in millions)Change first quarter
2018Change
YoYChange first quarter
2017Change
YoY
Reported EBITDA growth 804 7.7% (142) (1.3%)
Impact using exchange rates for 2018 217 357
M&A 5 39
Organic EBITDA growth 1 026 10.0% 253 2.5%
Capital expendituresCapital expenditures (capex) are investments in tangible and intangible assets, excluding business combinations and asset retirement obligations. Capex is a measure of investments made in the operations in the relevant period and is useful to users of Telenor’s financial information in evaluating the capital intensity of the operations. Capex is deemed to better gauge the actual investments committed in the period than in the purchases of property, plant and equipment (PPE) and intangible assets in the cash flow statement.
First quarter Year
(NOK in millions) 2018 2017 2017
Purchases of PPE and intangible assets (cash flow statement) 5 556 5 921 20 726
Working capital movement in respect of capital expenditure (687) (1 438) 940
Less:
Asset retirement obligations (23) 37 (377)
Discontinued operations (160) (134) (983)
Capital expenditures 4 687 4 386 20 307
Licence and spectrum fee - capitalized (1 616) - (3 052)
Capital expenditures excluding licence and spectrum fee 3 070 4 386 17 255
Revenue 27 113 27 596 112 069
Capex excl. Licences and spectrum/Revenues (%) 11.3% 15.9% 15.4%
Investments in business (business combinations) Investments in businesses comprise acquisitions of shares and participations, including acquisitions of subsidiaries and businesses not organised as separate companies.
Net interest-bearing debt excluding licence obligations (Net debt)Net debt consists of both current and non-current interest-bearing liabilities, excluding licence obligations, less related current and non-current hedging instruments, financial instruments, such as debt instruments and derivatives, and cash and cash equivalents.
Net debt is a measure of the Group’s net indebtedness that provides an indicator of the overall balance sheet strength. It is also a single measure that can be used to assess both the Group’s cash position and its indebtedness. The use of the term ‘net debt’ does not necessarily mean that the cash included in the net debt calculation is available to settle the liabilities included in this measure.
Net debt is considered to be an alternative performance measure as it is not defined in IFRS. The most directly comparable IFRS measure is the aggregate interest-bearing liabilities (both current and non-current) and cash and cash equivalents. A reconciliation from these to net debt is provided below.
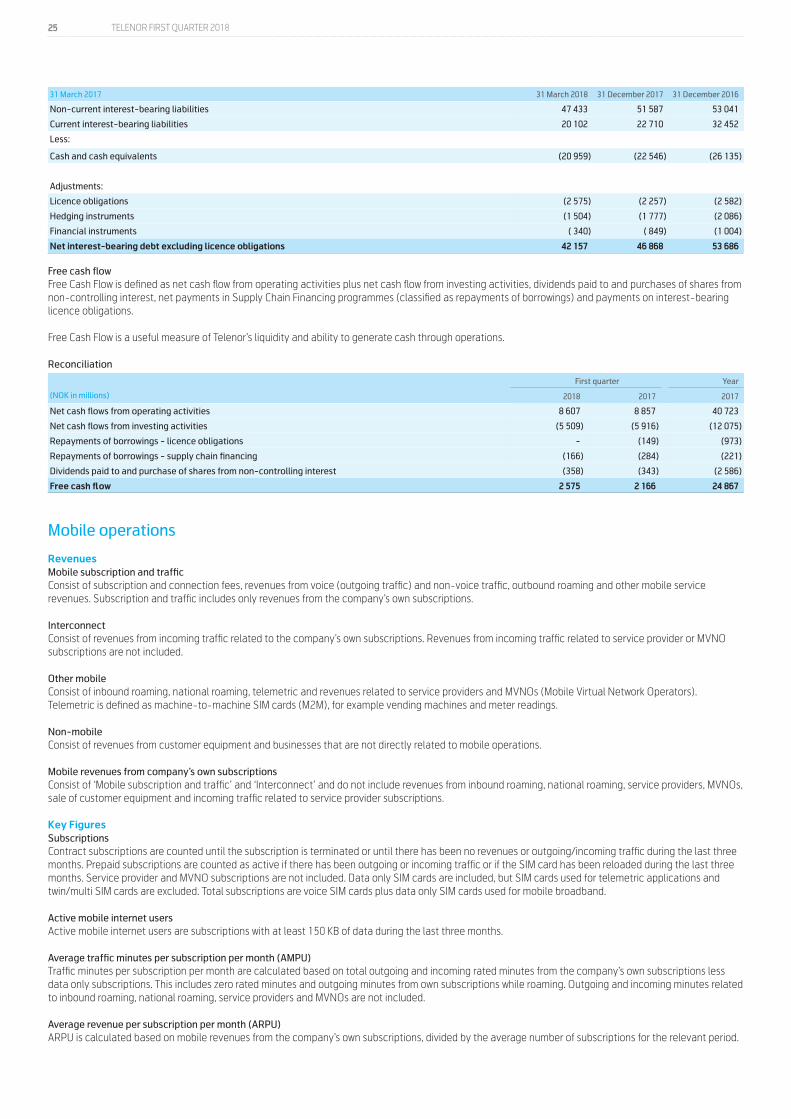
25 TELENOR FIRST QUARTER 2018
31 March 2017 31 March 2018 31 December 2017 31 December 2016
Non-current interest-bearing liabilities 47 433 51 587 53 041
Current interest-bearing liabilities 20 102 22 710 32 452
Less:
Cash and cash equivalents (20 959) (22 546) (26 135)
Adjustments:
Licence obligations (2 575) (2 257) (2 582)
Hedging instruments (1 504) (1 777) (2 086)
Financial instruments ( 340) ( 849) (1 004)
Net interest-bearing debt excluding licence obligations 42 157 46 868 53 686
Free cash flowFree Cash Flow is defined as net cash flow from operating activities plus net cash flow from investing activities, dividends paid to and purchases of shares from non-controlling interest, net payments in Supply Chain Financing programmes (classified as repayments of borrowings) and payments on interest-bearing licence obligations.
Free Cash Flow is a useful measure of Telenor’s liquidity and ability to generate cash through operations.
Reconciliation
First quarter Year
(NOK in millions) 2018 2017 2017
Net cash flows from operating activities 8 607 8 857 40 723
Net cash flows from investing activities (5 509) (5 916) (12 075)
Repayments of borrowings - licence obligations - (149) (973)
Repayments of borrowings - supply chain financing (166) (284) (221)
Dividends paid to and purchase of shares from non-controlling interest (358) (343) (2 586)
Free cash flow 2 575 2 166 24 867
Mobile operations
RevenuesMobile subscription and trafficConsist of subscription and connection fees, revenues from voice (outgoing traffic) and non-voice traffic, outbound roaming and other mobile service revenues. Subscription and traffic includes only revenues from the company’s own subscriptions.
InterconnectConsist of revenues from incoming traffic related to the company’s own subscriptions. Revenues from incoming traffic related to service provider or MVNO subscriptions are not included.
Other mobileConsist of inbound roaming, national roaming, telemetric and revenues related to service providers and MVNOs (Mobile Virtual Network Operators). Telemetric is defined as machine-to-machine SIM cards (M2M), for example vending machines and meter readings.
Non-mobileConsist of revenues from customer equipment and businesses that are not directly related to mobile operations.
Mobile revenues from company’s own subscriptionsConsist of ‘Mobile subscription and traffic’ and ‘Interconnect’ and do not include revenues from inbound roaming, national roaming, service providers, MVNOs, sale of customer equipment and incoming traffic related to service provider subscriptions.
Key FiguresSubscriptionsContract subscriptions are counted until the subscription is terminated or until there has been no revenues or outgoing/incoming traffic during the last three months. Prepaid subscriptions are counted as active if there has been outgoing or incoming traffic or if the SIM card has been reloaded during the last three months. Service provider and MVNO subscriptions are not included. Data only SIM cards are included, but SIM cards used for telemetric applications and twin/multi SIM cards are excluded. Total subscriptions are voice SIM cards plus data only SIM cards used for mobile broadband.
Active mobile internet usersActive mobile internet users are subscriptions with at least 150 KB of data during the last three months.
Average traffic minutes per subscription per month (AMPU)Traffic minutes per subscription per month are calculated based on total outgoing and incoming rated minutes from the company’s own subscriptions less data only subscriptions. This includes zero rated minutes and outgoing minutes from own subscriptions while roaming. Outgoing and incoming minutes related to inbound roaming, national roaming, service providers and MVNOs are not included.
Average revenue per subscription per month (ARPU)ARPU is calculated based on mobile revenues from the company’s own subscriptions, divided by the average number of subscriptions for the relevant period.

26 TELENOR FIRST QUARTER 2018
Fixed operations
RevenuesTelephonyConsist of subscription and connection fees, traffic (fixed to fixed, fixed to mobile, to other countries, value added services, other traffic) for PSTN/ISDN and Voice over Internet Protocol (VoIP).
Internet and TVConsist of subscription, traffic charges and connection fees for xDSL, cable and fibre, in addition to revenues from TV services. High speed fixed internet include fibre, cable and VDSL.
Data servicesConsist of Nordic Connect/IP-VPN and security.
OtherConsist of leased lines, managed services and other retail products.
WholesaleConsist of sale to service providers of telephony (PSTN/ISDN), Bitstream, LLUB, national and international interconnect, transit traffic, leased lines and other wholesale products.
Key FiguresSubscriptionsTelephony consists of PSTN, ISDN and VoIP subscriptions. Internet consists of broadband access over xDSL, fibre and cable. TV consists of TV services over fibre and cable. Subscriptions are counted until the subscription is terminated.
Average revenue per subscription per month (ARPU)ARPU is calculated based on revenues from the company’s own subscriptions, divided by the average number of subscriptions for the relevant period. Internet ARPU is calculated based on Internet revenues as defined above except TV service revenues. TV ARPU is calculated based on revenues from TV services.
Broadcast
RevenuesCanal Digital DTHConsist of revenues from Nordic DTH subscribers and households in SMATV networks.
SatelliteConsist of revenues from satellite services from the satellite position 1-degree west.
NorkringConsist of revenues from terrestrial radio and TV transmission in Norway and Belgium

First quarter 2018Published by Telenor ASAN-1360 Fornebu, NorwayPhone: +47 67 89 00 00
Investor Relations:E-mail: [email protected]
www.telenor.com
2181
092
• B
olt C
omm
unic
atio
n AS
• b
oltc
omm
unic
atio
n.no


![Wireless & Mobile - In the home and elsewhere Josef Noll [josef.noll@telenor.com] Fellow – Wireless Mobility Telenor R&D, B7d NO-1331 Fornebu](https://img.pdfslide.us/doc/110x75/5519db04550346d07b8b4660/wireless-mobile-in-the-home-and-elsewhere-josef-noll-josefnolltelenorcom-fellow-wireless-mobility-telenor-rd-b7d-no-1331-fornebu.jpg)