Embed Size (px)
Citation preview

PT M CASH INTEGRASI TBK
Digital Distribution Company
October 2017
Public Expose

2
Disclaimer
The information contained in this document is strictly confidential and has been prepared by PT M Cash Integrasi Tbk (“MCI” or the ”Company”) in connection with its proposed
offering and sale of its shares (the "Offering"). This document may not be taken away, reproduced or redistributed, in whole or in part, to any other person without the prior
written consent of the Company.
Any reference to particular proposed terms of the Offering is intended as a summary and not a complete description. Terms or characteristics may change before closing and
the Offering may not proceed. This document is not intended to provide and should not be relied upon for tax, legal or accounting advice, investment recommendations or a
credit or other evaluation of an investment in the Company. Prospective investors should consult their tax, legal, accounting or other advisers. Prospective investors should rely
only on the final offering memorandum which will contain material information relating to the Company not in this document. An investment in the Company will involve particular
risks — prospective investors should read and understand the explanations of relevant risks in the offering memorandum before making any decisions.
No representation or warranty, express or implied, is made as to, and no reliance should be placed on, the fairness, accuracy, completeness or correctness of the information,
or opinions contained herein. None of the Company, the selling shareholder, the International Selling Agents or their respective advisors or representatives shall have any
responsibility or liability whatsoever (for negligence or otherwise) for any loss howsoever arising from any use of this presentation or its contents or otherwise arising in
connection with this presentation.
The third party information and statistical data in this presentation have been obtained from sources the Company believes to be reliable but there can be no assurance as to
the accuracy or completeness of the included information. This presentation may not contain all material information concerning the Company and the information set forth in
these materials is subject to change without notice. None of the Company, the selling shareholder or the International Selling Agents is under any obligation to update or keep
current the information contained herein. The contents of these materials have not been verified by the International Selling Agents. Accordingly, none of the International
Selling Agents, or their respective directors, officers or affiliates makes any representation or warranty, express or implied, as to the accuracy or completeness of the information
in this presentation, and nothing in this presentation is, or should be relied upon as, a promise or representation by any of them.
Certain statements in this document may constitute "forward-looking statements", including statements regarding the Company's expectations and projections for future
operating performance and business prospects. Such forward-looking statements are based on numerous assumptions regarding the Company's present and future business
strategies and the environment in which the Company will operate in the future. Such forward-looking statements speak only as of the date on which they are made.
Accordingly, the Company, the selling shareholder and the International Selling Agents expressly disclaim any obligation to update or revise any forward-looking statement
contained herein to reflect any change in the Company's expectations with regard to new information, future events or other circumstances. The Company does not make any
representation, warranty or prediction that the results anticipated by such forward-looking statements will be achieved, and such forward-looking statements represent, in each
case, only one of many possible scenarios and should not be viewed as the most likely or standard scenario. Accordingly, prospective purchasers should not place undue
reliance on any forward-looking statements.
This document is for information and convenient reference and does not constitute or form part of, and should not be construed as, any offer for sale or subscription of or
solicitation or invitation of any offer to buy or subscribe for any securities of the Company. Any offer of securities will be made in or accompanied by a copy of the final offering
memorandum to be issued in respect of the Offering. Any purchase of securities should be made solely on the basis of the information contained in the final offering
memorandum. This presentation and the information contained herein are being furnished to you solely for your information and may not be reproduced or redistributed to any
other person, in whole or in part. In particular, neither the information contained in this presentation nor any copy hereof may be, directly or indirectly, taken or transmitted into or
distributed in any other jurisdiction which prohibits the same except in compliance with applicable securities laws. Any failure to comply with this restriction may constitute a
violation of the applicable securities laws. No money, securities or other consideration is being solicited, and, if sent in response to this presentation or the information contained
herein, will not be accepted.
By reviewing these presentation materials, you acknowledge that you will be solely responsible for your own assessment of the market and the market position of the Company
and that you will conduct your own analysis and be solely responsible for forming your own view of the potential future performance of the business of the Company.

I Industry Outlook

Indonesia to be The Largest Digital Economy
in Southeast Asia
262 mio people, 5th largest nation by population
133 million internet users
The first mobile nation, 371 mio mobile subscriptions
To be Top 10 economy by 2030
Indonesian consumers are the 4th most optimistic in the world
4Source: Wearesocial.com, Unlocking Indonesia’s Digital Opportunity (McKinsey, 2016; Understanding the Indonesian Consumer (McKinsey, 2015); Nielsen
Global Survey of Consumer Confidence and Spending Intentions (2016)

Digital in Indonesia – January 2017
TOTAL
POPULATION
INTERNET
USERS
ACTIVE SOCIAL
MEDIA USERS
MOBILE
SUBSCRIPTIONS
ACTIVE MOBILE
SOCIAL USERS
262.0MILLION
URBANISATION: 55%
132.7MILLION
PENETRATION: 51%
106.0MILLION
PENETRATION: 40%
371.4MILLION
vs. POPULATION: 142%
92.0MILLION
PENETRATION: 35%
Figure represents
Total national
population including
children
Figure includes access
of fixed and mobile
connections
Figure represents active
user account on the
most active social
platform the country,
not unique users
Figure represents
mobile subscriptions,
not unique users
Figure represents active
user accounts on the
most active social
platform, not unique
users
5Source: Wearesocial.com
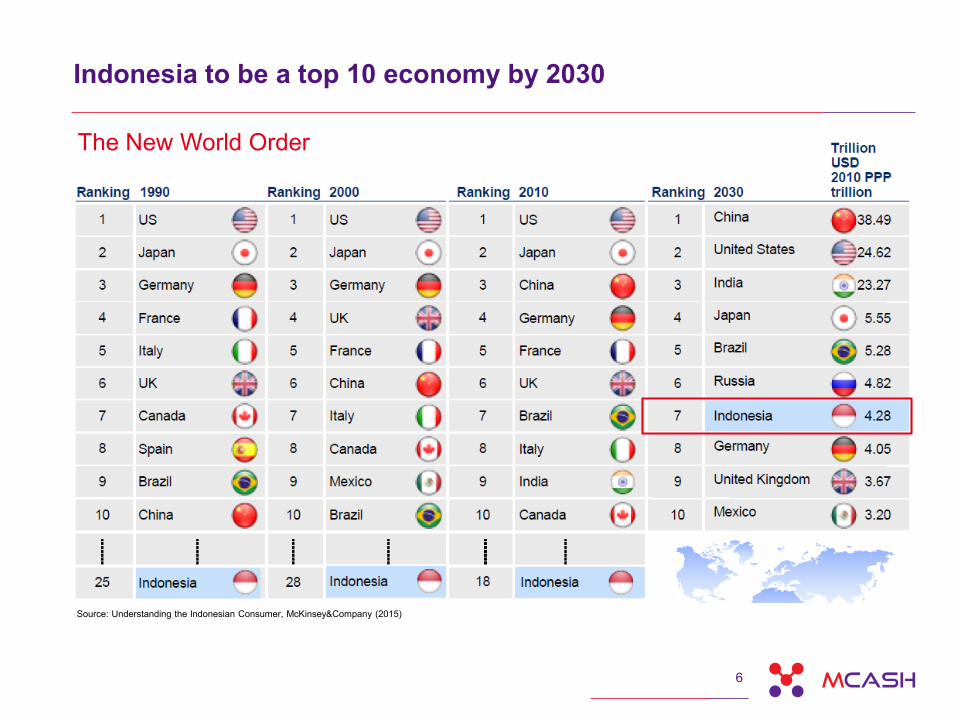
Indonesia to be a top 10 economy by 2030
Source: Understanding the Indonesian Consumer, McKinsey&Company (2015)
The New World Order
6

Indonesian consumers are one of the most optimistic
in the world
Rank 4th
7Source: Nielsen Global Survey of Consumer Confidence and Spending Intentions (2016)

Indonesia B2C e-commerce market grew by
50.2% CAGR11-16, the second highest after
China. It is projected to grow by another 50%
CAGR within the next 4 years (Source: e-Marketer).
Percentage of paying customers of mobile
game in Indonesia is 50% higher than those in
other surveyed countries, and tend to buy twice
higher than the normal consumers. According
to Badan Ekonomi Kreatif Indonesia, Indonesia
game market is estimated to reach USD700
mio in 2016 (Source: Unity Technologies, Detik)
Indonesia digital music revenue is estimated
to worth USD 4mio in 2017, while its user
penetration will jump, from 7.2% in 2017 to
23.8% by 2021 (Source: Statista.com)
IndonesiaDigital Market
Indonesia is one of the most growing market for digital products
8
Combined sales of data products of Indonesia
top 3 telco operators (TLKM, ISAT and EXCL)
posted +30.0% CAGR2Y to Rp59.8tr in 2016
and +27.6% YoY to Rp 38.9tr in 1H17 (Source: Companies, IDX, processed)
Telco Data
Game mobile
E-commerce
Digital music

However, there are some challenges remain…
9Source: Harvard Business Review (2017, MasterCard, Bank Indonesia, Vela Asia Online Shopper Survey)
Plotting the Digital Evolution Index, 2017How countries scored across four drivers* on the digital evolution index (out of
100)
Note: *) Stand Out countries are highly digitally advanced and exhibit high momentum. Stall Out
countries enjoy a high state of digital advancement while exhibiting slowing momentum. Break
Out countries are low-scoring in their current states of digitalization but are evolving rapidly.
Watch Out countries face significant challenges with their low state of digitalization and low
momentum; in some cases, these countries are moving backward in their pace of digitalization.
Undistributed Infrastructure.Internet access mostly concentrated in
the capital and provincial capitals.
High Preference for Offline
Transaction38.4% afraid of online fraud
32.7% prefer offline shopping
experience
Major Unbanked PopulationOnly 20% has bank account and 11%
owns credit/ debit card
Indonesia is still Cash SocietyAlmost 70% of consumer transaction
is paid by cash
Indonesia is classified as Break Out
Countries due to:
IndonesiaIndonesia

Digital Kiosk as a new business model
OFFLINE COMMERCEONLINE COMMERCE
76% of Indonesian People
buy things offline
only 24%* of Indonesian People
buy things online
*Note: Indonesia Digital Buyer Penetration Rate in 2016.
Source: Statista (2017)
Digital kiosk is a touch point where
user can do online transaction at offline
store
• Offering offline Physical Experience
(Physical Presence)
• Its modes of payment accommodates
bank and unbanked population
VS
10

I Company Profile

1212
To become a lifestyle platform, providing
physical and digital contents to help
people simplify their life.
Having an integrated business model,
combining state-of-the-art O2O platform and
IoT to enhance Company’s commercial
partner’s businesses and to support
Indonesian digital lifestyle.
Mission
Vision
M Cash as DIGITAL DISTRIBUTION Company
13
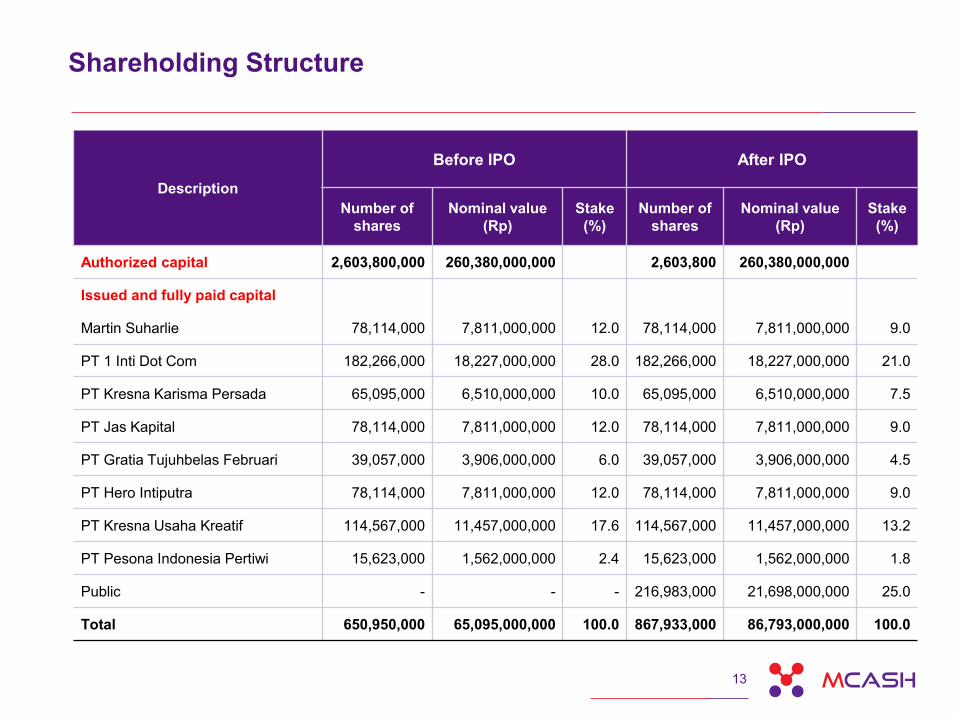
Organizational StructureShareholding Structure
Description
Before IPO After IPO
Number of
shares
Nominal value
(Rp)
Stake
(%)
Number of
shares
Nominal value
(Rp)
Stake
(%)
Authorized capital 2,603,800,000 260,380,000,000 2,603,800 260,380,000,000
Issued and fully paid capital
Martin Suharlie 78,114,000 7,811,000,000 12.0 78,114,000 7,811,000,000 9.0
PT 1 Inti Dot Com 182,266,000 18,227,000,000 28.0 182,266,000 18,227,000,000 21.0
PT Kresna Karisma Persada 65,095,000 6,510,000,000 10.0 65,095,000 6,510,000,000 7.5
PT Jas Kapital 78,114,000 7,811,000,000 12.0 78,114,000 7,811,000,000 9.0
PT Gratia Tujuhbelas Februari 39,057,000 3,906,000,000 6.0 39,057,000 3,906,000,000 4.5
PT Hero Intiputra 78,114,000 7,811,000,000 12.0 78,114,000 7,811,000,000 9.0
PT Kresna Usaha Kreatif 114,567,000 11,457,000,000 17.6 114,567,000 11,457,000,000 13.2
PT Pesona Indonesia Pertiwi 15,623,000 1,562,000,000 2.4 15,623,000 1,562,000,000 1.8
Public - - - 216,983,000 21,698,000,000 25.0
Total 650,950,000 65,095,000,000 100.0 867,933,000 86,793,000,000 100.0

Board of Commissioner and Director
Michael Steven
President Commissioner
Ipung Kurnia
Commissioner
Himawan Leenardo
Independent Commissioner
Martin Suharlie
President Director
Suryandy Jahja
Managing Director
Marwan Suharlie
Director
Mohammad Anis Yunianto
Independent Director
Rachel Siagian
Director & Corporate Secretary14
Commissioner
Director

Digital Kiosk
Distribution Channels
Apps/ChatbotsCashiers
.
Digital Wholesale
Networks
15

M Cash Mobile App
MCash Wallet
Easy top up via bank
transfer to M Cash
wallet to purchase our
products.
Points & Rewards
Point-based reward
system for every
transaction.
One Stop Solution
Providing basic
products such as
mobile reloads & biller
payments
16

Line & Telegram Bots
@M Cash
TELEGRAM
@MCashBot
LINE
MCash Wallet
Easy top up via bank
transfer to M Cash
wallet to purchase our
products.
Points & Rewards
Point-based reward
system for every
transaction.
One Stop Solution
Providing basic
products such as
mobile reloads & biller
payments
17

18
Kiosk Types
18
• Modern channels in small
spaces (convenience & mini
stores) and Traditional
channels
• Modern channels with large
space (hypermarkets,
supermarkets, shopping
centers & convenience stores)
• Special feature: card dispenser
(SIM card & e-money).
• Modern channels with large
space (hypermarkets,
supermarkets, shopping
centers & convenience
stores)
• Special features: card
dispenser (SIM card & e-
money) and bill acceptor
Version 3Version 2Version 1
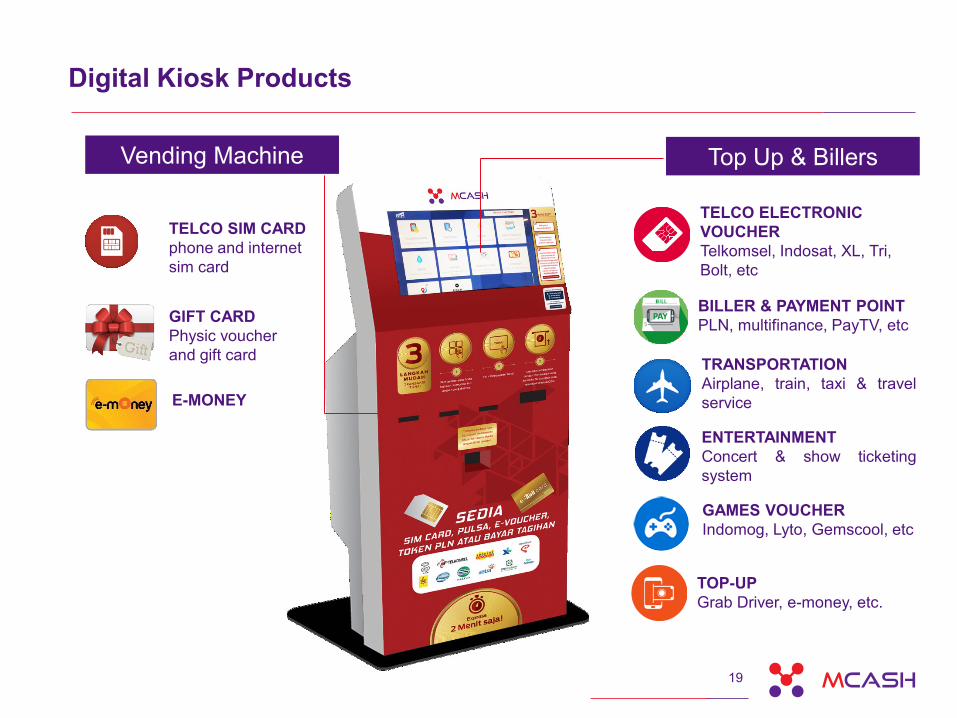
Digital Kiosk Products
TELCO ELECTRONIC
VOUCHER
Telkomsel, Indosat, XL, Tri,
Bolt, etc
ENTERTAINMENT
Concert & show ticketing
system
TRANSPORTATION
Airplane, train, taxi & travel
service
BILLER & PAYMENT POINT
PLN, multifinance, PayTV, etc
GAMES VOUCHER
Indomog, Lyto, Gemscool, etc
TELCO SIM CARD
phone and internet
sim card
GIFT CARD
Physic voucher
and gift card
Top Up & BillersVending Machine
19
E-MONEY
e
TOP-UP
Grab Driver, e-money, etc.
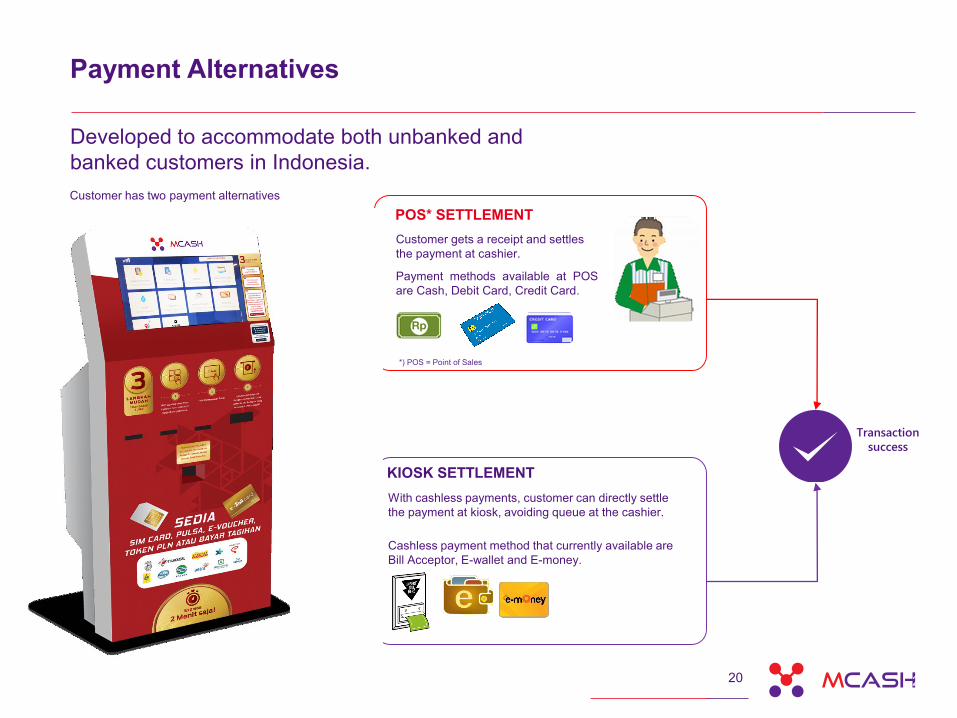
KIOSK SETTLEMENT
With cashless payments, customer can directly settle
the payment at kiosk, avoiding queue at the cashier.
Cashless payment method that currently available are
Bill Acceptor, E-wallet and E-money.
20
Payment Alternatives
Customer has two payment alternatives
Transaction
success
20
Developed to accommodate both unbanked and
banked customers in Indonesia.
POS* SETTLEMENT
Payment methods available at POS
are Cash, Debit Card, Credit Card.
Customer gets a receipt and settles
the payment at cashier.
*) POS = Point of Sales

Customer Experience at Kiosk
Consumer
I want to top up my
mobile credit and I am
in a hurry!
Let’s use digital kiosk.
Order Receipt
with transaction
code will come
out from kiosk
Cashier
NICE!
Wow! Such a deal!
I would like to purchase
these products too!
I should take this and
settle the payment in
cashier
After the payment is
settled, the customer
can print the receipt at
POS or kiosk then
obtain the purchased
digital product.
KIOSK
RECEIPT ITEMSN: 123-456-789Top up will
directly credited
to your phone
Thank You
Hi! Thank you for using
our digital Kiosk. May I
have your transaction
code to settle your
payment?
21

GRABTambahkan penghasilan
Anda dengan menjadi
mitra pengemudi Uber
Daftar sekarang di kios Mcash!
22
Online Driver Registration
Providing physical infrastructure for online business services
Top-up Balance for Online Driver
GRAB

Future Plans
23
2018 2019 2020 2021 2022
• E-Money distributor
• Biggest e-commerce aggregator
• Restaurant Online Order
• Know Your Customer
• App & sustainable IOT
Digital distributor
champion
Kiosk as Marketing and
Promotion Tools
Developed Artificial
Intelligence

I Investment Highlights

• A proven track record in conducting business transformation and development through modern and flexible business model approach
• A vast national network with a comprehensive range of products and services to capture
Indonesia's large and growing market potential
• High capabilities Platform that can respond quickly to market dynamics
• Digital kiosk machines as an effective means of promotion to provide attractive source of income
• Strong support from shareholders and affiliates in the areas of business development, technology innovation, and access to the funding market
• High business growth prospect, supported by strong financial position
Investment Highlights
25

26
A proven track record in conducting business transformation and development through modern and flexible business model approach
2014 2015 2016 4M16 4M17
New
Management
New Sales
Strategy
Changed
Organization
Structure
New Business
Roadmap
Tax Amnesty
Participation
Business
Repositioning
Digital
Distribution
New
Shareholders
Secured
contracts
covering
1,426 stores
Net Profit
Gross
Margin
0.8% 0.5%
1.4% 1.4%
2.0%
Rp 287 mioRp 71 mio
Rp 2.8 bio
Rp 816 mio
Rp 3.2 bio
NET PROFIT
289.5%YOY

2017 2020
2727
A vast national network with a comprehensive range of products
and services to capture Indonesia's large and growing market
potential
Modern Channel Traditional Channel
31,900 Outlets 4.6 mio Outlets
1,000Kiosks
10,000Kiosks
Modern Channel 80 %
Traditional Channel 20%
Modern Channel 20 %
Traditional Channel 80%
Mobile Top Up Vouchers & SIM Cards
Billers
Tickets & Vouchers
Travel & Tours

28
High capabilities platform that can respond quickly to market dynamics
28
IT Team30 People
• Maintain platform
performance
• Innovate new products
and / or new business
opportunities
Biller-partner-operator
connection :
• Develop connection point
• Develop SKU Products
• Setting and categorized
Biller-partner-operator
• Manage transaction path and
customer database
Kiosk machine :
• Develop programs
• Set dashboard
transaction reports
• Set connection and
partner’s transaction
Sub network operations:
• Maintain transaction
connection and
transaction server
• Provide solution to
transaction complaint
• Maintain transaction
path stability
WHOLESALE
TEAMPRODUCT AND
TECHNOLOGY
Quick Response
to Changes
Cost and Time
Efficient
CHANGE FEATURE:
done in 2 weeks vs 6 weeks outsourced
2929
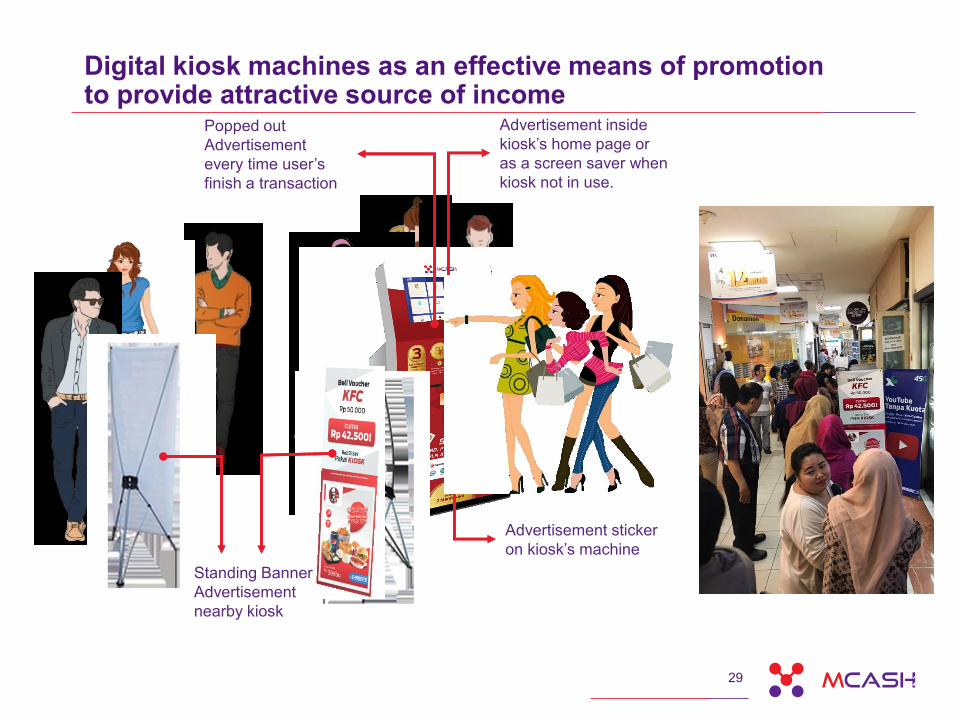
Digital kiosk machines as an effective means of promotion to provide attractive source of income
Advertisement inside
kiosk’s home page or
as a screen saver when
kiosk not in use.
Advertisement sticker
on kiosk’s machine
Popped out
Advertisement
every time user’s
finish a transaction
Standing Banner
Advertisement
nearby kiosk

Digital ecosystem enabler,
developer of Sevelin electronic
kiosk
30
Strong support from shareholders and affiliates in the areas of business development, technology innovation, and access to the funding market
30
Experienced in
telecommunication, trading and
turn around management
Martin
Suharlie
Founder of Indonesia modern
retail pioneer, 448 outlets** across
Indonesia
Providing access to funding
market and digital ecosystem
(9 million users*)
*) As of 30 June 2017
**) As of 31 December 2017

31
High business growth prospect, supported by strong financial position
31
30 People
Sales
Rp269.3bioN.Profit Rp3.2bio
Sales
Rp343.6bioN.Profit Rp71 mio
Sales
Rp386.4bioN.Profit Rp2.8bio
FY15
FY16
4M17
Total Assets: Rp106.6bio
(Net Cash: Rp45.0bio)
Equity 85.6%
Short-term
bank loans 9.5%
Other Liabilities 5.0%
Cash & Deposits
51.7%
Other Assets 46.1%
Fixed Assets 2.2%
APRIL 17
APRIL 17
Business
transformation
Expansive
Distribution
Channel
Online Platform
DevelopmentBusiness
SynergyAcquisition

I Growth Strategy

33
Growth Strategy
33
30 People
Evolution Proximity
Non Organic Partnership
Flexibility
2017: 1000 kiosks
2020: 10,000 KiosksFrom traditional to
digital Business
Forming an alliance with
big business groups• Telefast (April 2017)
• 24 Print (under review)
• Full Investment
• Revenue Sharing
• Franchise
• Rental

Partnership
34
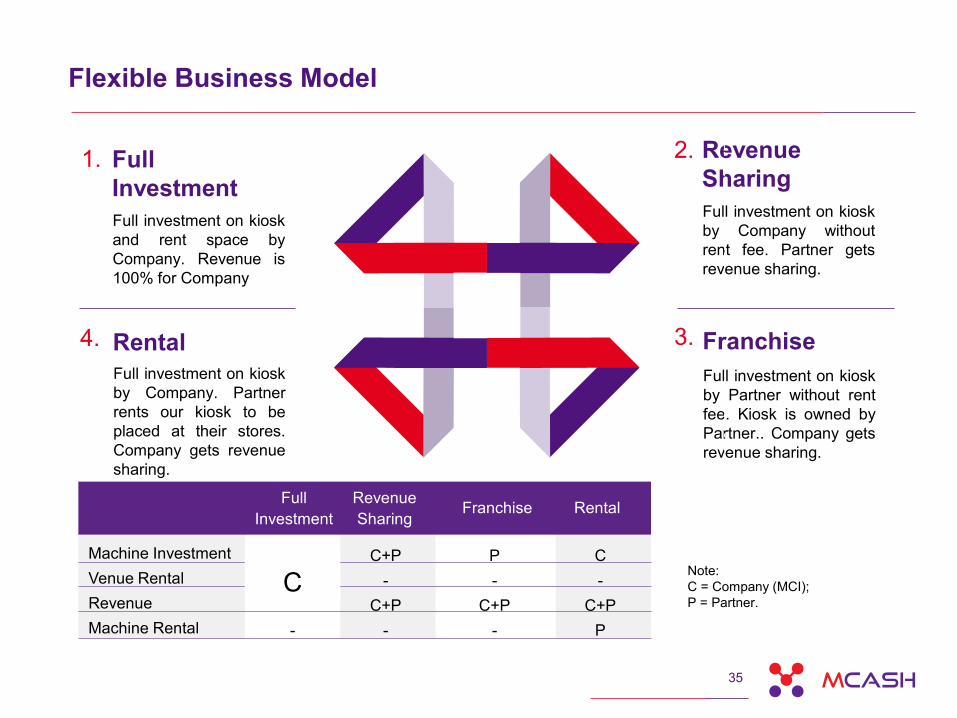
Flexible Business Model
Revenue
Sharing
Full investment on kiosk
by Company without
rent fee. Partner gets
revenue sharing.
Franchise
Full investment on kiosk
by Partner without rent
fee. Kiosk is owned by
Partner.. Company gets
revenue sharing.
Full
Investment
Full investment on kiosk
and rent space by
Company. Revenue is
100% for Company
Rental
Full investment on kiosk
by Company. Partner
rents our kiosk to be
placed at their stores.
Company gets revenue
sharing.
Machine Investment
Venue Rental
Revenue
Machine Rental
P
-
C+P
-
C+P
-
C+P
-
C
-
C+P
P-
Full
Investment
Revenue
SharingFranchise Rental
C
1.
4.
2.
3.
Note:
C = Company (MCI);
P = Partner.
35

Non Organic Growth Strategy
SYNERGY
KIOSK + PRINTING + TELCO
36
TELCO
Telefast
Indonesia
51% 25 %

I Financial

Financial Highlights
38
225,7
343,6 386,4
106,6
269,3
2014 2015 2016 4M16 4M17
0,8
0,5
1,4 1,4
2,0
2014 2015 2016 4M16 4M17
0,4 0,5
3,6
0,9
4,0
2014 2015 2016 4M16 4M17
0,3 0,1
2,8
0,8
3,2
2014 2015 2016 4M16 4M17
Sales (Rpbio)
30.8%
CAGR2Y
Operating profit (Rpbio)
197.7%
CAGR2Y
Net profit (Rpbio)
210.1%
CAGR2Y
152.6%
YoY332.0%
YoY
289.5%
YoY
Gross margin (%)

39
Financial Highlights
4,8 4,6 15,4
106.6
2014 2015 2016 Apr-17
3,2 2,9
9,8
15.4
2014 2015 2016 Apr-17
1,6 1,7 5,6
91.2
2014 2015 2016 Apr-17
0,7 0,2 2,2
45,0
2014 2015 2016 Apr-17
Total assets (Rpbio)
79.1%
CAGR2Y
Total equity (Rpbio)
88.3%
CAGR2Y
590.0%
YTD
1,525.4%
YTD
Net cash (Rpbio)Total liabilities (Rpbio)
70.0%
CAGR2Y
1,982.2%
YTD74.5%
CAGR2Y
56.5%
YTD

40
Financial Highlights
47,3
9,0
38,5
49.4
2014 2015 2016 Apr-17
1,5 1,6 1,6
6,5
2014 2015 2016 Apr-17
Current ratio (x)* Net cash to asset (%)*
Interest coverage ratio (x) Net cash to equity (%)*
15,5
3,3
14,0
42.2
2014 2015 2016 Apr-17
411 550
3.643
109
2014 2015 2016 4M17
*) Including restricted deposit

Profit and Loss
41
In Billion Rupiah 2014 2015 2016 4M16 4M17
Sales 225.7 343.6 386.4 106.6 269.3
Cost of sales 223.9 341.8 381.1 105.1 263.8
Gross profit 1.9 1.8 5.3 1.5 5.5
Operating expenses 1.5 1.3 1.7 0.5 1.5
Operating income 0.4 0.5 3.6 0.9 4.0
Others income (expenses) 0.0 (0.4) 0.1 0.2 0.3
Pre-tax profit 0.4 0.2 3.7 1.1 4.4
Tax expenses 0.1 0.1 0.9 0.3 1.2
Net profit 0.3 0.1 2.8 0.8 3.2

In Billion Rupiah 2014 2015 2016 4M17
ASSETS
Cash & its equivalents 0.7 0.1 2.2 34.1
Trade receivables 1.0 0.4 9.1 14.7
Inventories 3.0 4.0 4.2 18.5
Other current assets - - - 2.2
Total current assets 4.8 4.5 15.4 69.5
Fixed assets - net 0.0 0.0 0.0 2.4
Restricted deposits - - - 21.0
Other non current assets 0.0 0.0 0.0 13.7
Total non current assets 0.1 0.0 0.0 37.1
Total assets 4.8 4.6 15.4 106.6
LIABILITIES
Short-term bank loans - - - 10.1
Trade payables 2.9 2.5 - -
Other current liabilities 0.2 0.3 9.7 3.9
Total current liabilities 3.1 2.8 9.7 14.0
Employee benefits liabilities 0.1 0.1 0.1 0.3
Other non current liabilities 0.1 0.1 0.1 1.1
Total Liabilities 3.2 2.9 9.8 15.4
EQUITY
Capital stocks 0.5 0.5 0.5 3.8
Additional paid-in-capital - - 1.2 80.4
Retained earnings 1.1 1.2 3.9 7.0
Total Equity 1.6 1.7 5.6 91.2
Financial Position
42

43
2014 2015 2016 4M17
Liquidity
Current ratio* (x) 1.5 1.6 1.6 6.5
Quick ratio* (x) 0.5 0.2 1.2 5.0
Cash ratio* (x) 0.2 0.1 0.2 3.9
Solvability
Debt to asset ratio** (%) - - - 9.5
Debt to equity ratio** (%) - - - 11.1
Net cash to equity ratio** (%) 47.3 9.0 38.5 49.4
Interest coverage ratio (x) 411 550 3,643 109
Activity
Receivable turnover (Days) 1.6 0.4 8.5 6.5
Inventory turnover (Days) 4.9 4.2 3.9 8.4
Payable turnover (Days) 4.7 2.7 - -
Cash conversion cycle (Days) 1.7 1.9 12.4 15.0
Profitability
Gross margin (%) 0.8 0.5 1.4 2.0
EBITDA margin (%) 0.2 0.2 0.9 1.5
Operating margin (%) 0.2 0.2 0.9 1.5
Net margin (%) 0.1 0.0 0.7 1.2
Return on assets (%) 6.0 1.5 17.9 3.0
Return on equity (%) 18.1 4.3 49.2 3.5
Financial Ratios
*) Including restricted deposit
**) Debt = interest bearing liabilities

I Transaction Overview

4545
Offering Summary
Company/ Issuer PT M Cash Integrasi Tbk (“MCI” or the ”Company”)
Listing venue Indonesia Stock Exchange (“IDX”)
Offering structure 25% of the issued or maximum 216,983,300 shares
Employee stock allocation 10% of the total shares offered or maximum 21,698,300 shares.
Issued shares 100% issued capital or 867,933,300 shares post listing.
Nominal price Rp. 100,- per share
IPO price range Rp. ● - Rp. ●
Dividend policy Maximum 20% of net income
Use of proceeds
• 60% for working capital
• 30% for the purchase of machines, softwares and other IT infrastructures
• 10% for competence improvement, including human capital
Underwriters PT Kresna Sekuritas and PT Trimegah Sekuritas Indonesia Tbk

6 -13 October
20 October
24 October – 26 October
30 October
30 October
30 October
31 October
Bookbuilding period
OJK registration statements effective
Offering period
Refund
Payment to Company
Shares Distribution
Listing at IDX
October 2017
S T W T F S S
1
2 3 4 5 6 7 8
9 10 11 12 13 14 15
16 17 18 19 20 21 22
23 24 25 26 27 28 29
30 31
46
Indicative Timeline
27 October Allotment

Underwriters
Public AccountantKOSASIH, NURDIYAMAN, MULYADI, TJAHJO & PARTNER
(MEMBER OF CROWE HORWATH INTERNATIONAL)
Legal Consultant MARSINIH MARTOATMODJO ISKANDAR LAW OFFICE
BENEDICTUS DARMAPUSPITA & REKAN
PT RAYA SAHAM REGISTRA
DR. IRAWAN SOERODJO, SH, MSI
Appraiser
Securities Administration
Bureau
Notary
47
Supporting Professions
THANK YOU