Embed Size (px)
Citation preview
Warren A Harrison Psychometric and Rasch analysis of DBQ
Page 1
PSYCHOMETRIC AND RASCH ANALYSIS OF THE DRIVER BEHAVIOUR
QUESTIONNAIRE (DBQ): IMPLICATIONS FOR ITS USE AS AN EVALUATION
TOOL WITH NOVICE DRIVERS
Warren A Harrison BSc(Psychol)(Hons) MEdPsych MCrim(ForensPsych) MAPS
PSYCHOLOGIST
Eastern Professional Services Pty Ltd
Melbourne, Victoria, Australia
Email: [email protected]
Warren A Harrison Psychometric and Rasch analysis of DBQ
Page 2
ABSTRACT
The Driver Behaviour Questionnaire (DBQ) is a widely-used instrument in road safety research. It has
been shown to have a stable factor structure and adequate internal consistency for its four scales,
and there is also some evidence of validity as a road safety measurement tool. The DBQ has been
subjected to traditional psychometric analyses, but has not been evaluated using modern methods.
This paper reports the results of an assessment of the DBQ using traditional and Rasch analysis
methods. The analysis drew on two databases of DBQ responses (N=528 (with four sets of DBQ
responses for each participant over a two-year period) and N=5168). The analyses confirmed the
factor structure and the internal consistency of items in the subscales, but suggested that the
stability of scale scores over time (test-retest reliability) was poor and that the scales were poorly
calibrated against the samples of novice drivers used in the study. It is concluded that the DBQ in its
current form may be unsuitable for use as an evaluation tool with novice drivers.
KEYWORDS
Driver Behaviour Questionnaire, psychometric, reliability, novice driver, calibration
Warren A Harrison Psychometric and Rasch analysis of DBQ
Page 3
1.0 INTRODUCTION
1.1 The Driver Behaviour Questionnaire
The Driver Behaviour Questionnaire (DBQ) is widely used in road safety research. The theoretical
basis for the DBQ is Reason’s (1990) analysis of human error in which a distinction is made between
errors and behaviours resulting from deliberate choices. The DBQ was originally developed by
Reason, Manstead, Stradling, Baxter, and Campbell (1990) as a tool that discriminated between
driving errors and violations, and has been further refined (eg. Lawton, Parker, Stradling &
Manstead, 1997) and used in a broad range of studies (de Winter & Dodou, 2010). The distinction
between unsafe behaviours that are volitional and those that are errors is widely viewed to be an
important one (Özkan, Lajunen, & Summala, 2006) and may contribute to the popularity of the
instrument.
The DBQ commonly includes 27 (eg. Lajunen, Parker, & Summala, 2004) or 28 items (Özkan &
Lajunen, 2005), but has been used in smaller test forms depending on the specific goals of the
research study (eg. Davey, Wishart, Freeman, & Watson, 2007). Factor analytic studies of the DBQ
have had varied outcomes (de Winter & Dodou, 2010), with results generally supporting the
distinction between violations and errors noted by Reason et al. (1990). Many studies suggest a
three- or four-factor structure, with the factors commonly labelled as Errors, Violations, Lapses, and
Aggressive Violations (eg. Lajunen et al., 2004).
The validity of the DBQ as a road safety measure has been assessed by comparing DBQ scale scores
and safety-related measures such as self-reported and official crash data. Despite some variability
across studies, a recently-published meta-analysis of DBQ validity research (de Winter & Dodou,
2010) suggests that there is a small but consistent relationship between scores on the violations
scales (the authors combined the Violations and Aggressive Violations scales into a single category)
and self-reported crash involvement. De Winter and Dodou also reported a less-consistent
relationship between scores on the Errors scales and self-reported crash involvement. These
correlations with crash involvement may be due in part to other factors such as gender, driving
exposure and age as these are predictors of DBQ scores and crash involvement (de Winter & Dodou,
2010), and other variables such as impression management or social desirability (eg. af Wåhlberg,
2009, 2010; Lajunen & Summala, 2003; Sullman & Taylor, 2010). De Winter and Dodou (2010) were
not able to detect a relationship between DBQ scale scores and official crash data – a finding that
they accounted for in terms of inadequate sample size.
Concerns about the reliability of road safety measures such as the DBQ were raised in a review of
methodological issues by af Wåhlberg (2003). He reported that the stability of road safety measures
over time was rarely discussed, and argued that this is an important methodological issue in road
safety research. He expresses some surprise that test-retest reliabilities are rarely reported,
suggesting that without this type of information it is not possible to be certain that measurement
instruments are collecting useful data. He reported that only one of the nine studies he reviewed
that used the DBQ as a predictor of crash involvement reported test-retest reliability data.
Some studies have assessed the psychometric characteristics of the DBQ. Parker, Reason,
Manstead, and Stradling (1995), for example, calculated test-retest reliabilities of a three-factor DBQ
Warren A Harrison Psychometric and Rasch analysis of DBQ
Page 4
structure with seven months between tests, and reported reliabilities of 0.69, 0.81, and 0.75 for
Errors, Violations, and Lapses respectively.
Lajunen et al. (2004) reported internal consistency statistics (Cronbach alpha) for DBQ scale data
collected from drivers in Finland, the Netherlands, and the United Kingdom after demonstrating
similar four-factor structures for the DBQ in these countries. They reported Cronbach alphas
between 0.64 and 0.80, with the highest values for the Violations scale and the lowest for the Lapses
scale. Bener, Özkan, and Lajunen (2008) examined the performance of the DBQ in Qatar and the
United Arab Emirates. The factor structure of the DBQ when used in these countries differed from
that found in previous European research, and the internal consistency statistics (Cronbach alpha)
were relatively low – generally in the 0.5 to 0.7 range.
In his evaluation of a driver improvement program, af Wåhlberg (2010b) reported Cronbach alphas
for the Violations scale of the DBQ between 0.72 and 0.84 and a test-retest reliability of 0.67 over a
seven-month period. He argued that the low test-retest reliability for the Violations scale and other
instruments in his study means that they are highly unstable over time and therefore of
questionable value in an evaluation context.
Özkan et al. (2006) had a sample of 622 drivers (with a mean age of 44 years) complete the DBQ on
two occasions separated by three years. They reported internal consistencies (Cronbach alpha) of
0.81, 0.79, 0.67, and 0.74 for their Mistakes (Errors), Violations, Lapses, and Aggressive Violations
scales respectively. They did not report test-retest reliabilities for their four-factor DBQ structure,
but in a separate analysis in which they examined a two-factor DBQ structure they reported test-
retest reliabilities of 0.50 and 0.76 for the Errors and Violations factors respectively. There is some
uncertainty in their interpretation of these results, however, as they claim in their discussion that
the Error scale was ‘highly stable’ over time but the Violation scale was ‘at the border of
acceptability’, which contradicts the reliability figures they reported in the Results section.
Driver behaviour instruments such as the DBQ have some potential value as evaluation tools. As
there is evidence that some scale scores appear to be correlated with crash data, it might be
reasonable to use the instrument as an additional measure or even as a surrogate outcome measure
to evaluate road safety interventions. The Violations scale of the DBQ was used as an outcome
measure in af Wahlberg’s (2010b) evaluation, and the current author is aware of three significant
evaluations of road safety programs in Australia that are relying at least in part on the DBQ as an
outcome measure.
In addition to the problems associated with impression management or social desirability (eg. af
Wåhlberg, 2009, 2010), the use of the DBQ as an evaluation tool faces challenges that relate to the
stability or reliability of scores over time and its calibration or sensitivity as a measure of behaviour
across all drivers.
Some studies were noted earlier that suggest only moderate levels of test-retest reliability,
suggesting that there may be some concerns with using the DBQ as an outcome measure in
evaluations that rely on comparisons of before- and after-measures. If the outcome measure is not
stable over time, it may be difficult to detect any changes, or to conclude that any changes are the
result of the intervention.
Warren A Harrison Psychometric and Rasch analysis of DBQ
Page 5
The DBQ calibration issue has been noted in previous research. Aberg and Rimmo (1998) reported
low mean responses to DBQ items , and Mesken, Lajunen and Summala (2002) noted that most
responses to the DBQ items were in the bottom two response categories (labelled as ‘Never’ and
‘Hardly ever’ in their study). More recently, Özkan et al. (2006) also reported that the DBQ item
responses were generally in the ‘Never’ and ‘Hardly ever’ categories. These authors all reported the
skewed item responses, but made no further comment about them or possible implications.
If it is true that responses to most or all of the DBQ items are clustered at the low end of the
response scale, the resulting DBQ scale scores for most people (either summed or averaged across
items) will be numerically small compared to the range of possible scores. This suggests that the
DBQ may not be suitable for use in an evaluation context as floor-effects in the scale scores would
make it difficult to detect any improvements resulting from safety-related interventions.
The study reported here was concerned with these issues in particular – the stability of DBQ scale
scores over the time periods commonly used in evaluation studies, and the calibration of items and
scales against the broader population of young drivers.
1.2 Rasch Analysis
The study made use of traditional psychometric techniques and a more-recent development called
Rasch modelling (Bond & Fox, 2001; Linacre, 2009). Rasch modelling converts item response data
into scaled scores that allow item difficulty and person responses or performance to be located on a
single dimension that represents the shared variance of the responses. This dimension represents
the underlying construct measured by the scale. In the case of DBQ items in the Errors scale, for
example, it is assumed that the shared item variance reflects some underlying behavioural construct
that might be described as the tendency to make errors while driving. Rasch modelling transforms
responses into scaled scores along this ‘error’ continuum and allows the items and participants to be
placed along the continuum.
This then provides information about how the items are calibrated in relation to human variation on
the underlying construct. An ideal assessment instrument will have good overlap between the
position of items against the underlying construct and the position of participants against the same
construct (Linacre, 2009). This would help ensure that the instrument is able to discriminate
between people across the full range of behaviours, abilities, or attitudes. If there is relatively little
overlap between items and people and the items are clustered at one end or the other of the
underlying construct, the measurement instrument would be expected to suffer from ceiling or floor
effects and may not be adequate for anything other than broad screening tasks.
Rasch analysis involves assessing the extent to which the data fit the assumptions of the Rasch
model and then using the model to examine the characteristics of the measurement scale. The
analysis provides information about the performance of items that can be used to improve the scale,
and it also provides information about the residual variance to enable assessment of the
dimensionality of the scale.
Rasch modelling has not been applied to the DBQ, and has only been used occasionally in road
safety research. Kay, Bundy, & Clemson (2009) used Rasch analysis as part of their assessment of
the performance of the Driving Awareness Questionnaire – a tool specifically designed for use in a
Warren A Harrison Psychometric and Rasch analysis of DBQ
Page 6
rehabilitation context. The results of this study were used to guide recommendations for using the
instrument and making future improvements to it.
Rasch modelling was central to the development of the current on-road licence test in Victoria
(Harrison, 2008). Rasch modelling was used to identify items (from a large pool of potential driving
tasks) that performed well together as measures of a single underlying dimension that was
correlated with other measures of safe driving. It was also used to ensure that items were well-
calibrated against the skill or competence level of test applicants who, in Victoria, are required to
have at least 120 hours of supervised driving experience as a learner driver before they attend for
the test.
The availability of two large data sets with DBQ responses provided an opportunity to apply Rasch
modelling to the DBQ, with a view to assessing the performance of the items and scales.
2.0 METHOD
2.1 Participants
There were two groups of participants. Recruitment in both groups involved sending an invitation to
take part in an online survey (by post) to potential participants selected from the Victorian driver
database. Potential participants were randomly selected with the key criteria being that they were
Victorian drivers first licensed within the six months preceding the survey who met the main
requirements of the Victorian graduated licensing system. In particular, they were invited to
participate only if they had obtained a learner permit after their 16th birthday and had held their
learner permit for at least six months, and if they were at least 18 years of age when they obtained a
probationary licence.
One group of 2,500 potential participants was invited to take part in an initial survey and then a
series of three follow-up surveys over a two-year period. Only participants who had completed each
preceding survey were invited to take part in subsequent surveys. The response rates for each
survey wave were 49%, 67%, 82%, and 78%, with a resulting response rate over all four repeated
surveys of 21% (N=528). There were 299 females and 229 males, and participants had a mean age of
22.5 years. There were no detectable retention biases relating to age, gender, or residential socio-
economic status (Australian Bureau of Statistics, 2008). DBQ data from this group of participants
(referred to from here on as the small sample) were used to assess traditional psychometric
characteristics of the DBQ subscales.
The second group of participants resulted from three separate recruitment and data collection
episodes in 2008, 2009, and 2010. Over the three survey periods, a total of 11,000 licensed drivers
were invited to complete a single online survey, with a response rate of 47% (N=5168). This sample
was composed of 2,892 females and 2,276 males with a mean age of 22.7 years. DBQ data from this
sample (referred to here as the large sample) were used in the Rasch analysis of the DBQ subscales.
2.2 Procedure
Potential participants selected randomly from the driver database were contacted by mail and
invited to participate in an online survey. Participation was encouraged by providing small retail-
Warren A Harrison Psychometric and Rasch analysis of DBQ
Page 7
store gift vouchers to all participants, and participants were also entered into a prize draw for a
small number of larger gift vouchers. Participants were provided with a unique participant number
that they used when starting the online survey. This number was used to track survey completion.
Participants who had not completed the survey two weeks after the invitation letter were sent a
reminder letter, and after a further two weeks they were contacted by telephone and were invited
to complete the survey by telephone. Social research contractors provided interviewers and
telephone survey systems to facilitate this process.
Participant anonymity was preserved by ensuring that the participant database with names, contact
details, and participant numbers was never linked to the survey responses provided by participants.
The author had access only to the de-identified data set.
The same online (and telephone) survey content was presented to all participants, with some
changes to the later surveys that are irrelevant for the current analysis. The survey included items
concerning experiences as a learner and probationary driver, self-reported driving behaviours and
driving exposure, self-reported crash involvement and violations, and the items from the 27-item
form of the DBQ (Lajunen et al., 2004). Some DBQ items were reworded to maintain the meaning of
the items for Australian participants who drive on the left side of the road. The wording of the items
is shown in Table 1. Participants responded to the DBQ items using a six-point scale anchored at the
end points with “Never” and “Nearly all the time”. The survey took 20-30 minutes to complete.
2.3 Analysis
All analyses were conducted using either the Statistica package (Statsoft, 2004) or Winsteps (Linacre,
2009) for the Rasch analysis.
Data analysis involved three stages. The data from the large sample (N=5168) were used in a factor
analysis to confirm the factor structure of the instrument. Data from the small sample (N=528, with
four complete sets of data per participant) were used to evaluate the DBQ scales’ performance in
relation to internal consistency and test-retest reliability. A Rasch analysis was then conducted using
the data from the large sample.
Factor analysis of the DBQ responses in the large sample involved principle components extraction
of factors, with the number of factors determined by setting the minimum eigenvalue to 1
(Thompson & Daniel, 1996). Factors were then rotated (varimax) and the resulting item loadings
used to interpret the factors. Scale scores on each factor were then calculated for subsequent
analyses using the rating scale responses for DBQ items that loaded on the relevant factor.
Traditional psychometric analysis included the calculation of Cronbach’s alpha as a measure of
internal consistency and calculation of test-retest reliabilities for the scales over the four sets of
repeated-measure DBQ data.
The Rasch analysis involved fitting the data to the Rasch model (Bond & Fox, 2001; Linacre, 2009)
taking into account relevant fit statistics, with a focus on calibration of items and participants against
the underlying construct assessed by each DBQ factor. The Rasch analysis also included an
assessment of item performance for different age and sex subgroups of the sample, so providing an
indication of the DBQ’s behaviour in the context of different participant characteristics.
Warren A Harrison Psychometric and Rasch analysis of DBQ
Page 8
3.0 RESULTS
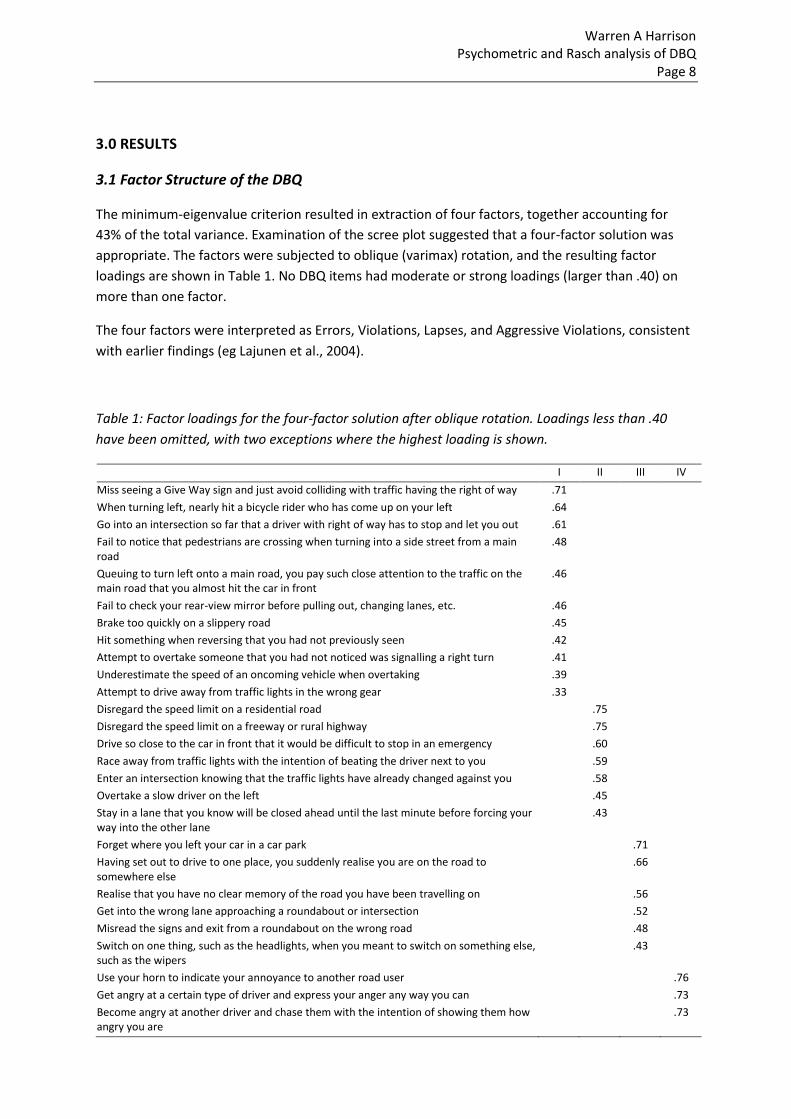
3.1 Factor Structure of the DBQ
The minimum-eigenvalue criterion resulted in extraction of four factors, together accounting for
43% of the total variance. Examination of the scree plot suggested that a four-factor solution was
appropriate. The factors were subjected to oblique (varimax) rotation, and the resulting factor
loadings are shown in Table 1. No DBQ items had moderate or strong loadings (larger than .40) on
more than one factor.
The four factors were interpreted as Errors, Violations, Lapses, and Aggressive Violations, consistent
with earlier findings (eg Lajunen et al., 2004).
Table 1: Factor loadings for the four-factor solution after oblique rotation. Loadings less than .40
have been omitted, with two exceptions where the highest loading is shown.
I II III IV
Miss seeing a Give Way sign and just avoid colliding with traffic having the right of way .71
When turning left, nearly hit a bicycle rider who has come up on your left .64
Go into an intersection so far that a driver with right of way has to stop and let you out .61
Fail to notice that pedestrians are crossing when turning into a side street from a main road
.48
Queuing to turn left onto a main road, you pay such close attention to the traffic on the main road that you almost hit the car in front
.46
Fail to check your rear-view mirror before pulling out, changing lanes, etc. .46
Brake too quickly on a slippery road .45
Hit something when reversing that you had not previously seen .42
Attempt to overtake someone that you had not noticed was signalling a right turn .41
Underestimate the speed of an oncoming vehicle when overtaking .39
Attempt to drive away from traffic lights in the wrong gear .33
Disregard the speed limit on a residential road .75
Disregard the speed limit on a freeway or rural highway .75
Drive so close to the car in front that it would be difficult to stop in an emergency .60
Race away from traffic lights with the intention of beating the driver next to you .59
Enter an intersection knowing that the traffic lights have already changed against you .58
Overtake a slow driver on the left .45
Stay in a lane that you know will be closed ahead until the last minute before forcing your way into the other lane
.43
Forget where you left your car in a car park .71
Having set out to drive to one place, you suddenly realise you are on the road to somewhere else
.66
Realise that you have no clear memory of the road you have been travelling on .56
Get into the wrong lane approaching a roundabout or intersection .52
Misread the signs and exit from a roundabout on the wrong road .48
Switch on one thing, such as the headlights, when you meant to switch on something else, such as the wipers
.43
Use your horn to indicate your annoyance to another road user .76
Get angry at a certain type of driver and express your anger any way you can .73
Become angry at another driver and chase them with the intention of showing them how angry you are
.73
Warren A Harrison Psychometric and Rasch analysis of DBQ
Page 9
3.2 Traditional Psychometric Characteristics of the DBQ Scales
The factor loadings reported above were used to allocate items to one of four DBQ scales – Errors,
Violations, Lapses, or Aggressive Violations. Items were allocated according to their largest factor
loading. Scale scores for each of the DBQ scales were calculated for participants in the small (N=528)
sample. Responses to each item (responses ranged from ‘1’ to ‘6’) in each scale were summed to
produce four scale scores for each of the four DBQ data sets – each participant therefore had four
scale scores (collected over a 2-year period) for each of the four DBQ scales.
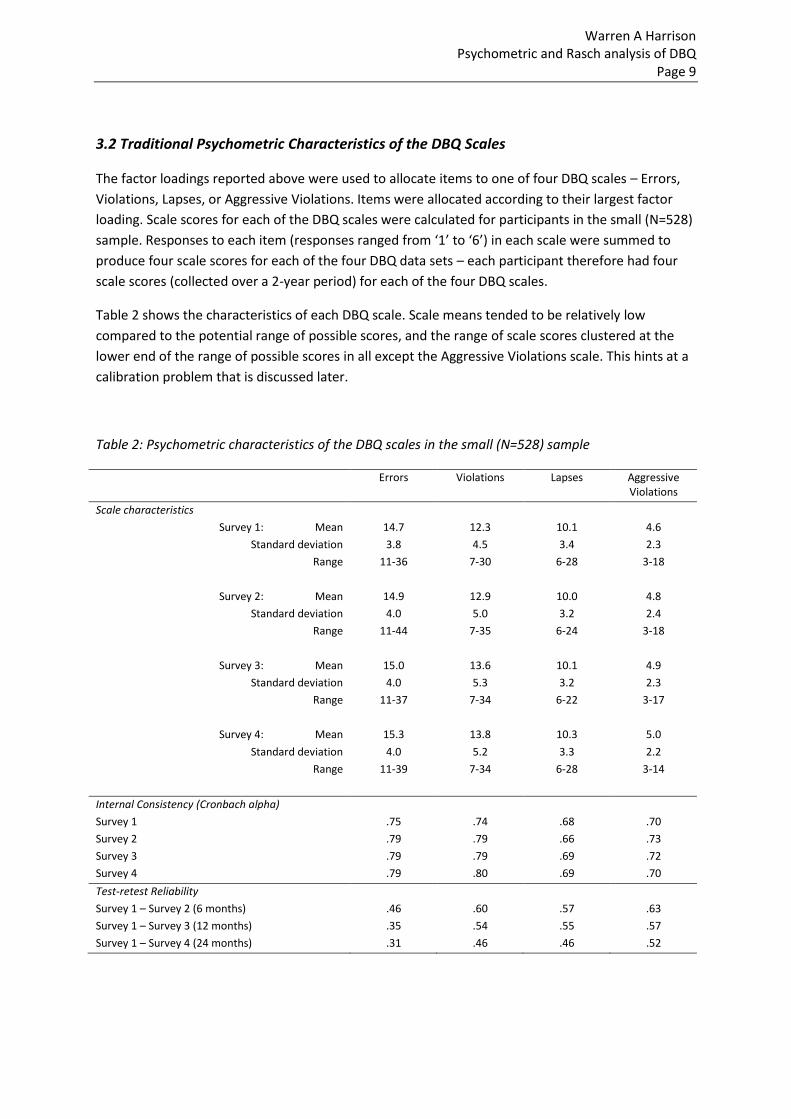
Table 2 shows the characteristics of each DBQ scale. Scale means tended to be relatively low
compared to the potential range of possible scores, and the range of scale scores clustered at the
lower end of the range of possible scores in all except the Aggressive Violations scale. This hints at a
calibration problem that is discussed later.
Table 2: Psychometric characteristics of the DBQ scales in the small (N=528) sample
Errors Violations Lapses Aggressive Violations
Scale characteristics
Survey 1: Mean 14.7 12.3 10.1 4.6
Standard deviation 3.8 4.5 3.4 2.3
Range 11-36 7-30 6-28 3-18
Survey 2: Mean 14.9 12.9 10.0 4.8
Standard deviation 4.0 5.0 3.2 2.4
Range 11-44 7-35 6-24 3-18
Survey 3: Mean 15.0 13.6 10.1 4.9
Standard deviation 4.0 5.3 3.2 2.3
Range 11-37 7-34 6-22 3-17
Survey 4: Mean 15.3 13.8 10.3 5.0
Standard deviation 4.0 5.2 3.3 2.2
Range 11-39 7-34 6-28 3-14
Internal Consistency (Cronbach alpha)
Survey 1 .75 .74 .68 .70
Survey 2 .79 .79 .66 .73
Survey 3 .79 .79 .69 .72
Survey 4 .79 .80 .69 .70
Test-retest Reliability
Survey 1 – Survey 2 (6 months) .46 .60 .57 .63
Survey 1 – Survey 3 (12 months) .35 .54 .55 .57
Survey 1 – Survey 4 (24 months) .31 .46 .46 .52
Warren A Harrison Psychometric and Rasch analysis of DBQ
Page 10
Scores on the Errors, Violations, and Aggressive Violations increased over the four surveys (linear
contrasts were statistically significant (p<.05) using repeated measures ANOVA), but the increase
was too small to have any practical significance – the effect sizes for changes in scale scores over the
two-year period (Cohen’s d) were all less than d=.30.
The internal consistencies (Cronbach’s alpha) were generally high for all four scales in all the surveys,
ranging from 0.66 to 0.80. This level of internal consistency is adequate for use as a research tool
(Bland & Altman, 1997), but the test-retest reliability coefficients raise some concerns about the
stability of responses over time. Test-retest reliabilities were consistently less than r=0.65. For a
twelve-month interval, none of the scales had test-retest reliabilities over r=0.60, and the difference
between the 6-month test-retest reliability and the 2-year test-retest reliability was statistically
significant (p<.05) for each scale. The test-retest reliability of the Errors scale was consistently
significantly less than the test-retest reliability of the other scales (p<.05).
3.3 Rasch Analysis of the DBQ
Responses to the DBQ items (from the large sample, N=5168) were used in four Rasch analyses, one
for each DBQ scale.
Items in each of the four scales generally performed in accordance with the Rasch model – item
polarities were consistent, all infit and outfit statistics were within the range recommended by
Linacre (2009) as indicative of contributing productively to measurement of the underlying trait or
construct, and with three exceptions all the item responses across all the items were consistent with
the model’s assumption that higher rating-scale responses should be associated with participants
who score higher on the underlying construct across all other items. These discrepancies were
related to the highest response category (“6”) on three items and are most likely the result of there
being very few participants who used the highest rating-scale responses on any of the items in the
Violations and Errors scales.
Decomposition of the response variance further confirmed that the DBQ scales were consistent with
the Rasch model – in each case the pattern of explained variance matched the modelled pattern,
and principal components analysis of residual variance suggested that the scales were one-
dimensional.
The DBQ data were analysed to determine if there were differences in item performance for male
and female participants and for participants in different age groups. Differential Item Functioning
(DIF) contrast measures comparing item performance for male and female participants were less
than 0.5 logits for all items in all four DBQ scales, suggesting that item performance was consistent
across gender (Linacre, 2009). The DIF contrast measures comparing item performance across four
age groups (18 years, 19 years, 20-25 years, and 26+ years) were also generally less than 0.5 logits
across all items in the four DBQ scales with the exception of one item in the Errors scale and two
items in the Violations scale. These differences were less than 0.7 logits, suggesting that they are
relatively trivial.
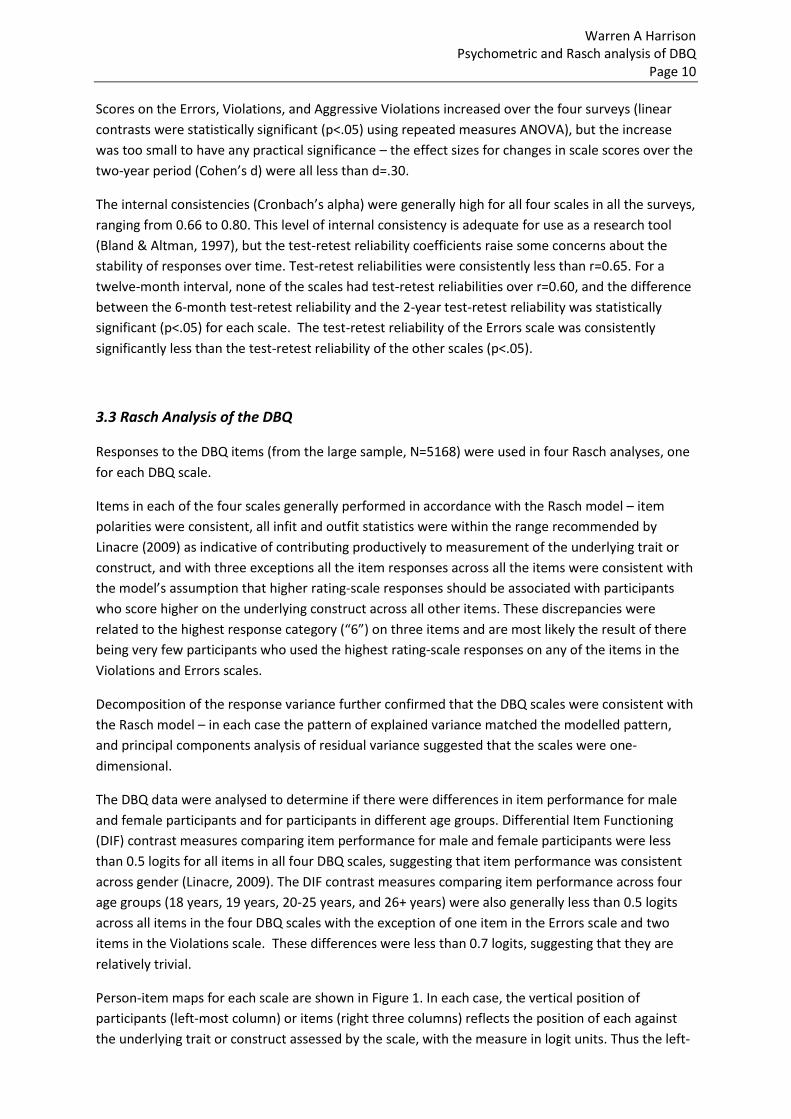
Person-item maps for each scale are shown in Figure 1. In each case, the vertical position of
participants (left-most column) or items (right three columns) reflects the position of each against
the underlying trait or construct assessed by the scale, with the measure in logit units. Thus the left-
Warren A Harrison Psychometric and Rasch analysis of DBQ
Page 11
most columns in the diagrams show the distributions of participants on the Errors, Violations,
Lapses, and Aggressive Violations constructs measured by the DBQ scales.
The middle Item column in each diagram shows the location on the DBQ scale where participants
are equally likely to respond to the item with a high (4, 5, or 6) or low (1, 2, or 3) response. The left
and right Item columns in each diagram show the measure level where participants are likely to give
item responses of “2” or more, or “5” or less respectively. These columns therefore show the
measure levels within with the items are able to discriminate between participants. The three Item
columns therefore provide information about the calibration of the items against the Errors,
Violations, Lapses, and Aggressive Violations constructs, using the same logit measurement metric as
that used to show the distribution of participants in the left-most column.
Figure 1: Person and Item maps for the Errors, Violations, Lapses, and Aggressive Violations Scales
The data shown in Figure 1 suggest that the items in the Errors, Violations, and Lapses scales are not
calibrated over full range of participants’ positions on these three constructs. In each case there are
many participants at the mid-to-lower range of the person distribution who are unlikely to respond
to items with anything other than the lowest possible response (“1”), and many of the DBQ items
are calibrated in such a way that few participants are likely to give responses at the high end of the
Warren A Harrison Psychometric and Rasch analysis of DBQ
Page 12
rating scale. The DBQ scales therefore have their greatest discriminatory power for the small
proportion of participants at the upper end of the distribution of each behavioural construct.
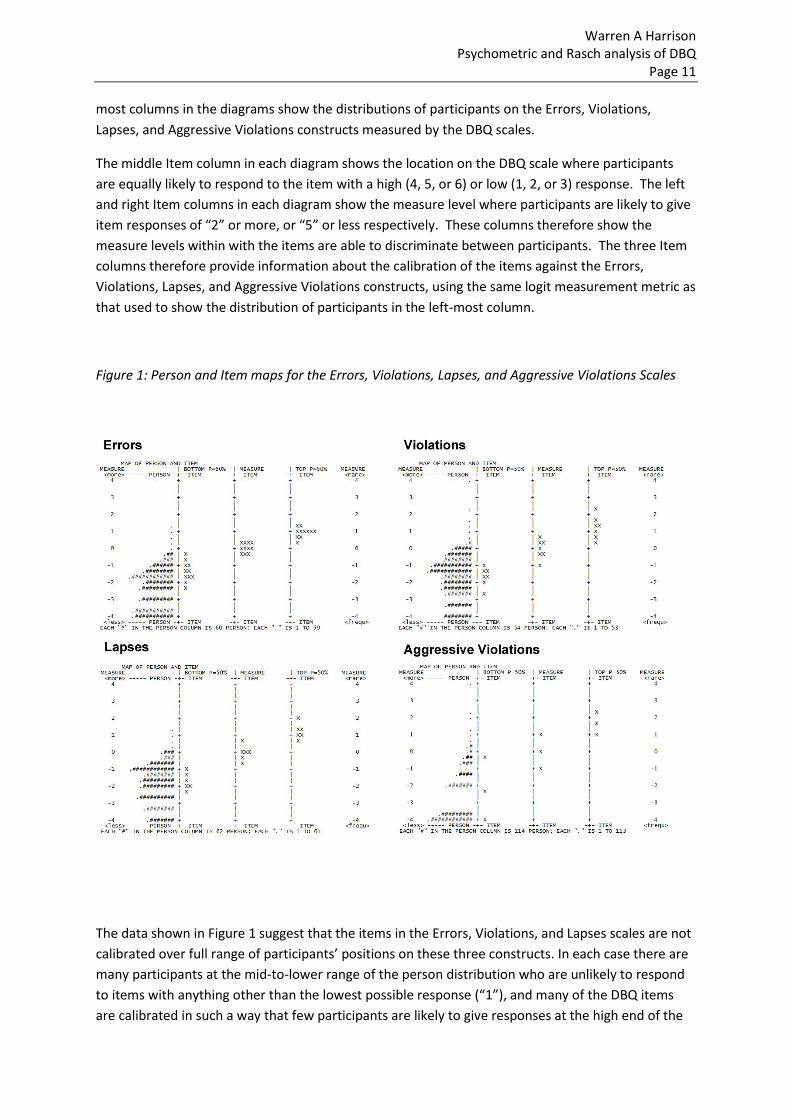
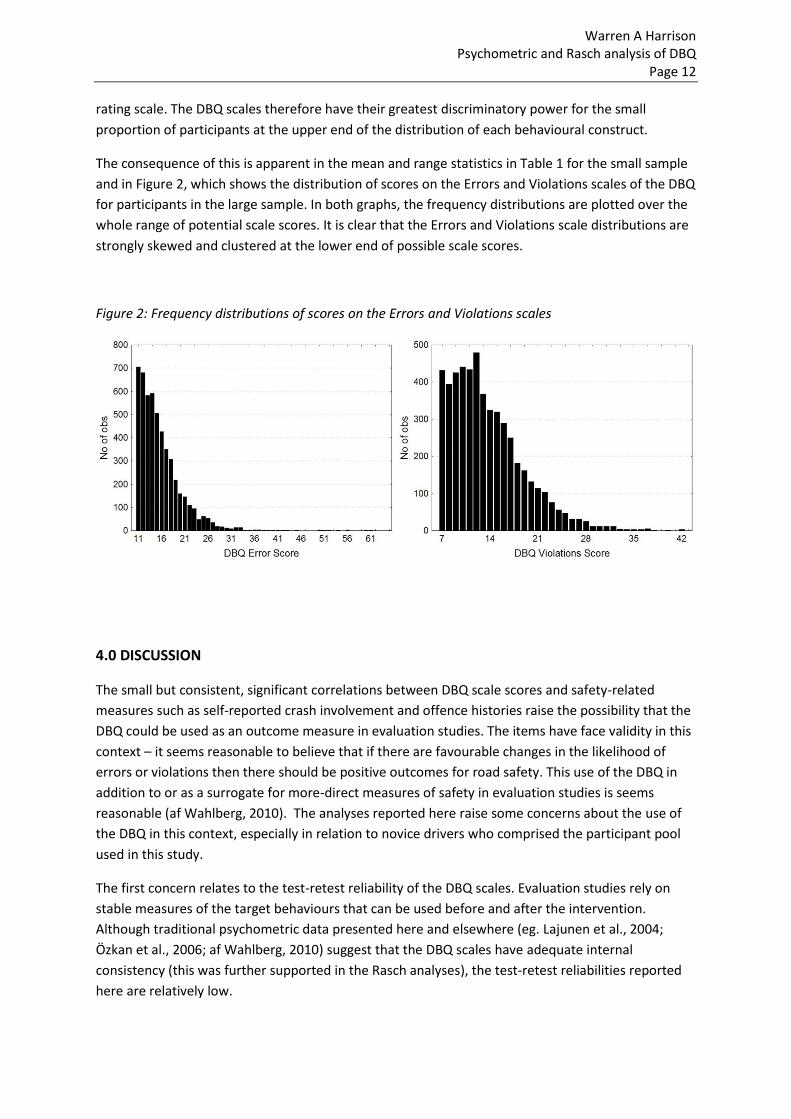
The consequence of this is apparent in the mean and range statistics in Table 1 for the small sample
and in Figure 2, which shows the distribution of scores on the Errors and Violations scales of the DBQ
for participants in the large sample. In both graphs, the frequency distributions are plotted over the
whole range of potential scale scores. It is clear that the Errors and Violations scale distributions are
strongly skewed and clustered at the lower end of possible scale scores.
Figure 2: Frequency distributions of scores on the Errors and Violations scales
4.0 DISCUSSION
The small but consistent, significant correlations between DBQ scale scores and safety-related
measures such as self-reported crash involvement and offence histories raise the possibility that the
DBQ could be used as an outcome measure in evaluation studies. The items have face validity in this
context – it seems reasonable to believe that if there are favourable changes in the likelihood of
errors or violations then there should be positive outcomes for road safety. This use of the DBQ in
addition to or as a surrogate for more-direct measures of safety in evaluation studies is seems
reasonable (af Wahlberg, 2010). The analyses reported here raise some concerns about the use of
the DBQ in this context, especially in relation to novice drivers who comprised the participant pool
used in this study.
The first concern relates to the test-retest reliability of the DBQ scales. Evaluation studies rely on
stable measures of the target behaviours that can be used before and after the intervention.
Although traditional psychometric data presented here and elsewhere (eg. Lajunen et al., 2004;
Özkan et al., 2006; af Wahlberg, 2010) suggest that the DBQ scales have adequate internal
consistency (this was further supported in the Rasch analyses), the test-retest reliabilities reported
here are relatively low.
Warren A Harrison Psychometric and Rasch analysis of DBQ
Page 13
The test-retest reliability of the Violations scale over a 12-month period, for example, was calculated
to be r=0.54, giving r2=0.29. This suggests that the first DBQ Violations score accounts for less than a
third of the variance of a subsequent Violations score twelve months later. In addition to changes in
DBQ Violations scores across participants that might result from maturation and driving experience,
there appear to be considerable individual differences in responses to the DBQ over time.
The combination of reasonable internal consistency and moderate to poor test-retest reliability over
a relatively long period (but the sort of timeframe that might be used in a study with a reasonable
follow-up period) suggests that the DBQ is an internally-consistent measure of some characteristic
that is not stable over time. The behavioural constructs measured by the DBQ for the novice drivers
used in this study may not reflect broader, habitual patterns of behaviour. This may limit the value of
the DBQ as an evaluation tool, at least for novice drivers, because it cannot be assumed that the
behaviours reflected in the DBQ scores will remain constant over the evaluation period in the
absence of an intervention.
The moderate to poor test-retest reliabilities also raise concerns about statistical power issues for
evaluation studies. If the DBQ is used in an evaluation as a before- and after-assessment, any
intervention-related changes in DBQ scale scores will be relatively small compared to the amount of
error variance resulting from the poor stability of the instrument over time. The result is that pre-
post comparisons with the DBQ scales are likely to have relatively low statistical power.
In addition to assessing the reliability of the DBQ, the current study made use of Rasch modelling
methods to assess the performance and calibration of items in relation to the distribution of
participants across the four DBQ scales. These analyses confirmed the internal consistency of the
four scales – in each case the items performed well together to assess some common or shared
underlying construct. The Rasch analysis did raise some concerns, however, about the calibration of
the DBQ items.
The Rasch model makes it possible to place items and persons against the same measurement scale,
which in turn allows assessment of the performance of individual items and the whole scale in
relation to discriminating between participants. Ideally, a measurement instrument that is intended
to be more than a simple screen should have items that are calibrated across the full distribution of
people on the underlying construct (Linacre, 2009). The Errors, Violations, and Lapses scales of the
DBQ do not meet this goal. The items in each scale are clustered at the upper end of the Persons
distributions and there are no items calibrated to discriminate between study participants at low
and moderate levels of Errors, Violations, and Lapses.
This has some consequences for the use of the DBQ. The first is that the DBQ cannot realistically be
used as a broad assessment tool across the population of novice drivers. It may act as an adequate
screen because its items are calibrated such that the scales will discriminate between the small
number of participants with very high scores on the Errors, Violations, and Lapses scales and the
larger majority of low- and moderate-scorers on these scales. Its use as a general measurement tool
for the general population is limited, however, by the lack of items calibrated to match the broader
distribution of novice drivers.
The DBQ may therefore have only limited use as an evaluation tool. The high calibration of items and
the consequent clustering of scale scores near to the bottom of the DBQ scales means that floor
effects are a significant concern. In an evaluation of a road safety intervention for novice drivers, the
Warren A Harrison Psychometric and Rasch analysis of DBQ
Page 14
results reported here suggest that it will be difficult to detect a reduction in scale scores simply as a
result of the clustering of scores at the lower end of the measurement scales. When the majority of
participants are responding with a ‘1’ or a ‘2’ to most items, there is little opportunity for ratings to
decline as a result of the intervention.
While the DBQ may not be well suited to an evaluation involving a broad sample of novice drivers,
the calibration of items does suggest that it may be suitable, at least in relation to calibration, as an
evaluation tool in programs that target high-risk novice drivers such as offenders. The calibration of
items is such that the scales are best suited to discriminating between high-risk young drivers and
detecting changes amongst this group of drivers.
The test-retest reliability problems and the item calibration issue together suggest that some caution
should be exercised in relation to using the DBQ as an evaluation tool where it acts as an outcome
measure in addition to or as a surrogate for crash data. First, scale scores are not stable over longer
time periods, with the result that it is not reasonable to assume there will be no change in scale
scores in the absence of any intervention, and the noise introduced into pre-post comparisons of
scale scores by this instability may reduce the statistical power of any such comparisons. Second,
the calibration of items is such that the scales do not discriminate across the whole novice driver
population and there are likely to be floor effects that will limit the potential detection of positive
road safety effects.
One potential solution to this problem, while maintaining the theoretical rationale of the test and its
internal consistency, would be to develop and trial some additional items for the Violations and
Errors scales that are better-calibrated to the broader population of novice drivers. Careful trialling
using Rasch modelling methods to identify items that perform consistently with the current DBQ
items and that are better calibrated to the lower and middle regions of the distributions of novice
drivers in these two behavioural constructs could improve the value of the DBQ as an assessment
tool and as an evaluation tool for broad interventions.
ACKNOWLEDGEMENTS
This study draws on data collected by VicRoads (Victoria’s driver licensing authority) as part of a
larger evaluation of young driver measures. Data collection was funded and managed by VicRoads.
The opinions expressed here are the author’s and do not necessarily reflect the views of VicRoads.
REFERENCES
Åberg, L., Rimmö, P.-A. (1998). Dimensions of aberrant driver behaviour. Ergonomics, 41, 39–56.
Australian Bureau of Statistics. (2008). Information Paper: An Introduction to Socio-Economic
Indexes for Areas (SEIFA), Document 2039.0 http://www.abs.gov.au
Bener, A., Ozkan, T., & Lajunen, T. (2008). The Driver Behaviour Questionnaire in Arab Gulf countries:
Qatar and United Arab Emirates. Accident Analysis and Prevention, 40, 1411-1417.
Warren A Harrison Psychometric and Rasch analysis of DBQ
Page 15
Bland, J.M., & Altman, D.G. (1997). Statistics notes: Cronbach’s alpha. British Medical Journal, 314,
572.
Bond, T.G., & Fox, C.M. (2001). Applying the Rasch Model: Fundamental Measurement in the Human
Sciences. Mahwah,NJ: Lawrence Earlbaum Associates.
Davey, J., Wishart, D., Freeman, J., & Watson, B. (2007). An application of the driver behaviour
questionnaire in an Australian organisational fleet setting. Transportation Research Part F, 10,
11−21.
Harrison, W.A. (2008). Getting Rasch about assessment: Using a Psychometric approach to select
and confirm items in the new Victorian licence test. Proceedings of the 2008 Road Safety Research
Policing and Education Conference, Adelaide, Australia. http://www.rsconference.com
Kay, L.G., Bundy, A., & Clemson, L. (2009). Validity, reliability, and predictive accuracy of the Driving
Awareness Questionnaire. Disability and Rehabilitation, 31, 1074-1082.
Lajunen, T., & Summala, H. (2003). Can we trust self-reports of driving: Effects of impression
management on driver behaviour questionnaire responses. Transportation Research Part F, 6, 97-
107.
Lajunen, T., Parker, D., & Summala, H. (2004). The Manchester Driver Behaviour Questionnaire: A
cross-cultural study. Accident Analysis and Prevention, 36, 231-238.
Lawton, R., Parker, D., Stradling, S.G., & Manstead, A.S.R. (1997). Predicting road traffic accidents:
The role of social deviance and violations, British Journal of Psychology, 88, 249-262.
Linacre, J.M. (2009). A Users Guide to WINSTEPS Rasch-Model Computer Programs.
www.winsteps.com
Mesken, J., Lajunen, T., Summala, H. (2002). Interpersonal violations, speeding violations and their
relation to accident involvement in Finland. Ergonomics, 45, 469–483.
Özkan, T., & Lajunen, T. (2005). A new addition to DBQ: Positive Driver Behaviours Scale.
Transportation Research Part F, 8, 355–368.
Özkan,T., Lajunen, T., & Summala,H. (2006). Driver Behaviour Questionnaire: A follow-up study.
Accident Analysis and Prevention, 38, 386-395.
Parker, D., Reason, J.T., Manstead, A.S.R., Stradling, S.G. (1995). Driving errors, driving violations and
accident involvement. Ergonomics, 38, 1036–1048.
Reason, J.T. (1990). Human Error. Cambridge University Press, New York.
Reason, J.T., Manstead, A.S.R., Stradling, S., Baxter, J., Campbell, K. (1990). Errors and violations on
the roads. Ergonomics, 33, 1315–1332.
StatSoft, Inc. (2004). STATISTICA data analysis software system, version 6. www.statsoft.com.
Sullman, M.J.M., & Taylor, J.E. (2010). Social desirability and self-reported driving behaviours: Should
we be worried. Transportation Research Part F,13, 215-221.
Warren A Harrison Psychometric and Rasch analysis of DBQ
Page 16
Thompson, B., & Daniel, F.G. (1996). Factorial analytic evidence for the construct validity of scores: a
historical overview and some guidelines. Educ. Psychol. Meas., 56, 197–208.
af Wåhlberg, A. E. (2003). Some methodological deficiencies in studies on traffic accident predictors.
Accident Analysis and Prevention, 35, 473-486.
af Wåhlberg, A. E. (2009). Driver Behaviour and Accident Research Methodology; Unresolved
Problems. Aldershot: Ashgate.
af Wåhlberg, A. E. (2010). Social desirability effects in driver behaviour inventories. Journal of Safety
Research, 41, 99−106.
af Wåhlberg, A. E. (2010b). Re-education of young driving offenders: Effects on self-reports of driver
behavior. Journal of Safety Research, 41, 331-338.
de Winter, J.C.F., & Dodou, D. (2010). The Driver Behaviour Questionnaire as a predictor of
accidents: A meta-analysis. Journal of Safety Research, 41, 463-470.