Embed Size (px)
Citation preview

Boone & Noltemeyer, Cogent Education (2017), 4: 1416898https://doi.org/10.1080/2331186X.2017.1416898
EDUCATIONAL PSYCHOLOGY & COUNSELLING | REVIEW ARTICLE
Rasch analysis: A primer for school psychology researchers and practitionersWilliam J. Boone1 and Amity Noltemeyer1*
Abstract: In order to progress as a field, school psychology research must be in-formed by effective measurement techniques. One approach to address the need for careful measurement is Rasch analysis. This technique can (a) facilitate the development of instruments that provide useful data, (b) provide data that can be used confidently for both descriptive and parametric statistics, and (c) provide outcome measures that offer clinically meaningful guidance to school psychology researchers and practitioners. In this paper, we first introduce the basic principles of Rasch measurement that undergird the use of Rasch analysis in school psychol-ogy. Next, we describe several techniques that can be used to conduct a basic Rasch analysis. In doing so, we use Winsteps software to illustrate the application of these techniques with a single exemplar school psychology rating scale data set. Finally, we provide conclusions and resources to consult for further learning.
Subjects: Educational Research; School Psychology; Educational Psychology
Keywords: Rasch; Winsteps; instrument development; psychometrics; school psychology
1. IntroductionIn order to progress as a field, school psychology research must be informed by effective measure-ment techniques. Suboptimal measurement techniques (e.g. surveys that include redundant items, treating rating scale data as if the scales were linear, very few data quality controls) in school psy-chology research may contribute to muddled results. This problem may stem from a
*Corresponding author: Amity Noltemeyer, Department of Educational Psychology, Miami University, 201 McGuffey Hall, Oxford, OH 45056, USAE-mail: [email protected]
Reviewing editor:Gregory Yates, University of South Australia, Australia
Additional information is available at the end of the article
ABOUT THE AUTHORSWilliam J. Boone is a distinguished research scholar at Miami University (Oxford, Ohio, USA). He earned his PhD from the University of Chicago’s Program in Measurement, Evaluation and Statistical Analysis under the direction of Benjamin Wright. Boone is the lead author of the Rasch text “Rasch Analysis in the Human Sciences.” He has conducted Rasch analyses for over 25 years. A professional goal of Boone is to expand the use of Rasch methods in social science and medical research.
Amity Noltemeyer is a professor in the School Psychology program at Miami University (Oxford, Ohio, USA). She earned her PhD from Kent State University’s School Psychology program. Her research interests include multi-tiered systems of support in schools, resilience, school discipline, and school climate. Noltemeyer has authored many journal articles and book chapters, and co-manages several externally funded grants.
PUBLIC INTEREST STATEMENTResearch in school psychology should be informed by effective measurement techniques. Rasch analysis (Rasch, 1960) is one way to approach this need for careful measurement. This technique can inform the development of instruments (surveys, tests, etc.) that provide useful data. Also, Rasch analysis can provide outcome measures that offer guidance to school psychology researchers and practitioners. In this paper, we first introduce the basic principles of Rasch measurement that undergird the use of Rasch analysis in school psychology. Next, we describe several techniques that can be used to conduct a basic Rasch analysis. In doing so, we use Winsteps (Linacre, 2017) software to illustrate the application of these techniques with a single school psychology rating scale data set. Finally, we provide conclusions and resources to consult for further learning.
Received: 14 September 2017Accepted: 10 December 2017First Published: 18 December 2017
© 2017 The Author(s). This open access article is distributed under a Creative Commons Attribution (CC-BY) 4.0 license.
Page 1 of 13
Page 2 of 13
Boone & Noltemeyer, Cogent Education (2017), 4: 1416898https://doi.org/10.1080/2331186X.2017.1416898
misunderstanding of points made by Stevens (1951) about measurement (see Michell, 1997, 2002 for additional consideration of this issue). One approach to address the need for careful measure-ment is Rasch analysis (Rasch, 1960). This technique can (a) facilitate the development of instru-ments that provide useful data, (b) provide data that can be used confidently for both descriptive and parametric statistics, and (c) provide outcome measures that offer clinically meaningful guid-ance to school psychology researchers and practitioners. In this paper, we first introduce the basic principles of Rasch measurement that undergird the use of Rasch analysis in school psychology. Next, we describe several techniques that can be used to conduct a basic Rasch analysis. In doing so, we use Winsteps (Linacre, 2017) software to illustrate the application of these techniques with a single exemplar school psychology rating scale data set. Finally, we provide conclusions and re-sources to consult for further learning.
2. Rasch measurement
2.1. Theory undergirding the Rasch modelThe Rasch model, credited to Danish mathematician Georg Rasch (1960), aims to support true meas-urement. The mathematics behind the model illustrates the notion that when attempting to meas-ure a single trait, test takers are more likely to correctly answer easy items than difficult items; furthermore, all items are more likely to be correctly answered by people with high ability on the construct being assessed than by those with low ability. Although that description of the Rasch model refers to a dichotomous right/wrong test, the Rasch model has been extended to other data types such as those from rating scales and partial credit models. The need to use Rasch analysis for rating scale data was described in the seminal work, Rating Scale Analysis (Wright & Masters, 1982). Data collected from tests and rating scale surveys used in the field of school psychology, to measure one trait, may never fit the Rasch model expectations exactly, but the assumption is that they should fit the model well enough to produce useful measures. An example of this broad principle is a ther-mometer. A thermometer provides a useful measure of a single trait. Although a measure made with this instrument is not an exact assessment of temperature, the thermometer evaluates tem-perature well enough to provide information that can be used reliably to make decisions.
Rasch measurement is aligned with the idea of “objective measurement”—no matter what con-struct is being measured, or what measurement instrument is being used, a common metric is used to express results (see Program Committee of the Institute for Objective Measurement, 2000). As an analogy, whether we are measuring a three-inch stick or a three-inch glass, a ruler will tell us that both objects are three inches long. In contrast, if we used a ruler made of rubber, we might not al-ways have information on a common scale. Rather, we might incorrectly conclude that the stick is taller than the glass. Some researchers contend that many of the instruments used in the social sciences use a ruler made of rubber because they actually provide ordinal data but are often claimed to provide quasi-interval data. Because Rasch analysis can provide “measures” expressed on an equal interval scale, school psychologists can develop and use measures to confidently inform decisions.
2.2. Exemplars of past applications of the Rasch modelRasch measurement has been applied in a variety of ways in education, school psychology, and many other fields. It has been used to (a) develop, evaluate, and improve surveys and tests, and (b) facilitate the computation of Rasch “measures” that lead to data analysis and interpretation of greater confidence (because equal interval data are being utilized). One example of the latter is the Lexile framework (see Stenner, 1996), a measurement system that has been used to provide infor-mation on the reading ability of individuals and the difficulty of texts on an equal interval Rasch cali-brated scale (Meta Metrics Inc, 2014). Other assessments, such as the Measures of Academic Progress (Northwestern Evaluation Association, 2009), also compute student “measures” using the Rasch model. Furthermore, large-scale international assessment programs such as the Program for International Student Assessment (PISA) and Trends in International Mathematics and Science
Page 3 of 13
Boone & Noltemeyer, Cogent Education (2017), 4: 1416898https://doi.org/10.1080/2331186X.2017.1416898
Study (TIMSS) have used the Rasch model to work toward achieving invariant measurement across settings and over time.
A review of school psychology journals over the past several years has revealed additional instru-ments that have been developed, validated, or otherwise studied using the Rasch model, across several cultural contexts (e.g. DiStefano & Morgan, 2010; Wechsler et al., 2010). Despite this emerg-ing research base, some tests and surveys used in school psychology are not developed based upon a strong theory of what it means to measure nor is Rasch measurement used to compute linear scale score measures. However, it is being increasingly recognized that equal interval measures (Rasch measures) may be a way to produce data that can more thoughtfully inform instruction (Vander Ark, 2013).
2.3. The logit scale and other advantages of Rasch analysisOne reason for the use of Rasch measurement techniques is that raw scores are nonlinear and dif-ferences between any two consecutive raw scores cannot be assumed to represent equal intervals. See Wright (1992) for a discussion of some of these issues. For example, if Jim achieves a raw score of 20, Sue scores 22, and Jen scores 32 on a Likert-scale social skills assessment where answering Strongly Agree (coded as 4 raw score points) is a higher level of social skills than an answer of Agree (3 raw score points) or Disagree (2 raw score points) or Strongly Disagree (1 raw score point), we can deduce that Jen has a higher level of social skills than Sue and Jim and that Sue has a higher level of social skills than Jim. However, we do not know how much higher because the data are ordinal. The jump from Agree to Strongly Agree cannot be assumed to be the same as the jump from Disagree to Agree. One might guess that the difference in social skills between Jen and Sue is greater than the difference between Jim and Sue; however, this conclusion is informed by the erroneous assumption that we are working with equal interval data. All that one knows is that Jen’s social skills > Sue’s social skills > Jim’s social skills. Fortunately for any individual wishing to utilize rating scale surveys to make decisions, these limitations can be addressed through the use of the Rasch model, and Rasch software that uses the Rasch model. Using Rasch techniques allows the data to be expressed on an interval scale, person measures on a logit (interval) scale to be computed, and item measures on the same logit scale to be computed. Details of these and other issues are provided in Best Test Design (Wright & Stone, 1979) and Rating Scale Analysis (Wright & Masters, 1982). In particular, these references provide a “by hand” example of how the raw data are evaluated through the use of the Rasch model.
Why are equal interval measures of importance? Computing “equal interval measures” can allow school psychologists to confidently compare the growth of, and between, schools and students that are located at different portions of a single trait. More specifically, Rasch analysis allows each per-son’s measure to be described using instrument items (e.g. Jen from our example above can be de-scribed in terms of her predicted response to specific items) and compared to other respondents (e.g. Jen’s predicted response to a specific survey item can be compared to Sue’s predicted response to the same survey item). Another benefit of Rasch analysis is that a smaller number of targeted items can provide more reliable measures than a larger number of items (Embretson & Hershberger, 1999); therefore, this technique can be used with small samples. For example, past efforts suggest as few as 30 items administered to 30 respondents can produce useful measures (Linacre, 1994). Using a Rasch approach can also allow school psychologist researchers and practitioners to target instruction/intervention because the expected performance of a person on an item can be inferred from each person’s ability measure and the difficulty of items which are expressed on the same scale. This facilitates effective decisions on what the next skill to teach a person should be. Another reason for utilizing Rasch analysis techniques is that when there are different forms of a survey or test, it is possible to express a person’s measures on the same scale regardless of which survey or test form was completed by a respondent (Wright & Stone, 1979). Finally, numerous indices can be used to evaluate the measurement functioning of an instrument (e.g. validity, reliability), several of which will be reviewed in subsequent sections of this paper. Resources such as Bond and Fox (2007),
Page 4 of 13
Boone & Noltemeyer, Cogent Education (2017), 4: 1416898https://doi.org/10.1080/2331186X.2017.1416898
Boone, Staver, and Yale (2014), and the extensive Winsteps (Linacre, 2012b) manual provide addi-tional guidance as to the assumptions, promise, and limitations of the Rasch model.
3. Rasch analysis techniquesIn this section, we first review some preliminary preparations that must be considered before con-ducting a Rasch analysis. Then, we discuss a number of core Rasch topics: item measures, person measures, Wright Maps, fit statistics, Rasch reliability indices, and some added nuances of rating scale analysis. When covering these topics, we provide an overview of each concept and its utility, rather than step-by-step instructions for how to run an analysis. We do this because of the wealth of information available in other sources that provide this granular level of detail; readers should refer to Boone et al. (2014) and Linacre (2012b) for “how to” information. Finally, throughout this section, we refer to the Resistance to Change in Schools Survey (RCSS) instrument. The second author of the primer presented in this paper developed and piloted this self-report rating scale as a means for dem-onstrating how Rasch analysis techniques can be operationalized and applied in school psychology.
3.1. Using an instrument that measures one traitBefore conducting a Rasch analysis, it is important to ensure that several assumptions are met. First, the instrument should be based on theory concerning the construct. Also, although the Rasch model has been extended to multi-trait measures (e.g. Wu, Adams, Wilson, & Haldane, 2007), for most novice Rasch analysis users it is a best first step to think about how one scale should measure one construct (one variable, one trait). Just as a single metric assessing height, weight, and circumfer-ence would not prove helpful for selecting clothing sizes, neither would a one size fits all metric summarizing multiple distinct psychological constructs be useful to inform specific school psychol-ogy services. When developing the RCSS items, the second author defined the construct being meas-ured as “resistance to change” using Rogers (2003) diffusion of innovation theory as a guiding framework.
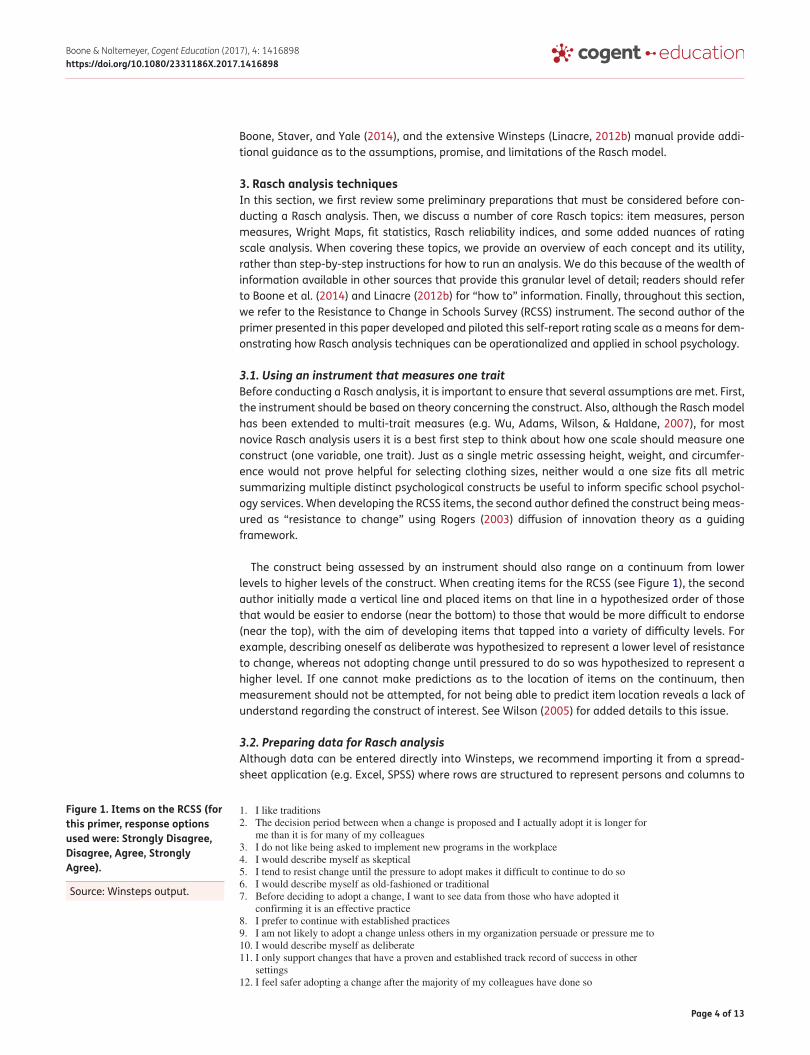
The construct being assessed by an instrument should also range on a continuum from lower levels to higher levels of the construct. When creating items for the RCSS (see Figure 1), the second author initially made a vertical line and placed items on that line in a hypothesized order of those that would be easier to endorse (near the bottom) to those that would be more difficult to endorse (near the top), with the aim of developing items that tapped into a variety of difficulty levels. For example, describing oneself as deliberate was hypothesized to represent a lower level of resistance to change, whereas not adopting change until pressured to do so was hypothesized to represent a higher level. If one cannot make predictions as to the location of items on the continuum, then measurement should not be attempted, for not being able to predict item location reveals a lack of understand regarding the construct of interest. See Wilson (2005) for added details to this issue.
3.2. Preparing data for Rasch analysisAlthough data can be entered directly into Winsteps, we recommend importing it from a spread-sheet application (e.g. Excel, SPSS) where rows are structured to represent persons and columns to
Figure 1. Items on the RCSS (for this primer, response options used were: Strongly Disagree, Disagree, Agree, Strongly Agree).
1. I like traditions2. The decision period between when a change is proposed and I actually adopt it is longer for
me than it is for many of my colleagues3. I do not like being asked to implement new programs in the workplace4. I would describe myself as skeptical5. I tend to resist change until the pressure to adopt makes it difficult to continue to do so6. I would describe myself as old-fashioned or traditional 7. Before deciding to adopt a change, I want to see data from those who have adopted it
confirming it is an effective practice8. I prefer to continue with established practices9. I am not likely to adopt a change unless others in my organization persuade or pressure me to10. I would describe myself as deliberate11. I only support changes that have a proven and established track record of success in other
settings12. I feel safer adopting a change after the majority of my colleagues have done so
Source: Winsteps output.
Page 5 of 13
Boone & Noltemeyer, Cogent Education (2017), 4: 1416898https://doi.org/10.1080/2331186X.2017.1416898
represent items. In addition, we recommend that ordinal or categorical data be assigned numeric values so that the desired performance is the highest number and the least desired performance is the lowest number. For a right–wrong test, a “0” would be an incorrect response and a “1” would be a correct response; in the case of a 4-step Likert scale measuring social skills, a “1” would denote selection of the lowest level of social skills and a “4” would be the highest level of social skills. Missing data should be indicated with a non-numeric value, such as “X” or “.” Finally, it is critical to remem-ber to reverse-code any items assessing the construct in the opposite direction. For example, if we added two items to the RCSS to assess openness to change or innovativeness, the Likert scale coding for those items for each respondent would need to be “flipped” (e.g. a 1 would become a 4 and a 4 would become a 1) since these two new items measure the construct of change in the opposite di-rection of the other items. For the data we evaluated for this primer, we utilized a code of 4 to indi-cate selection of Strongly Agree, a code of 3 to indicate selection of Agree, a code of 2 to indicate selection of Disagree, and a code of 1 to indicate selection of Strongly Disagree.
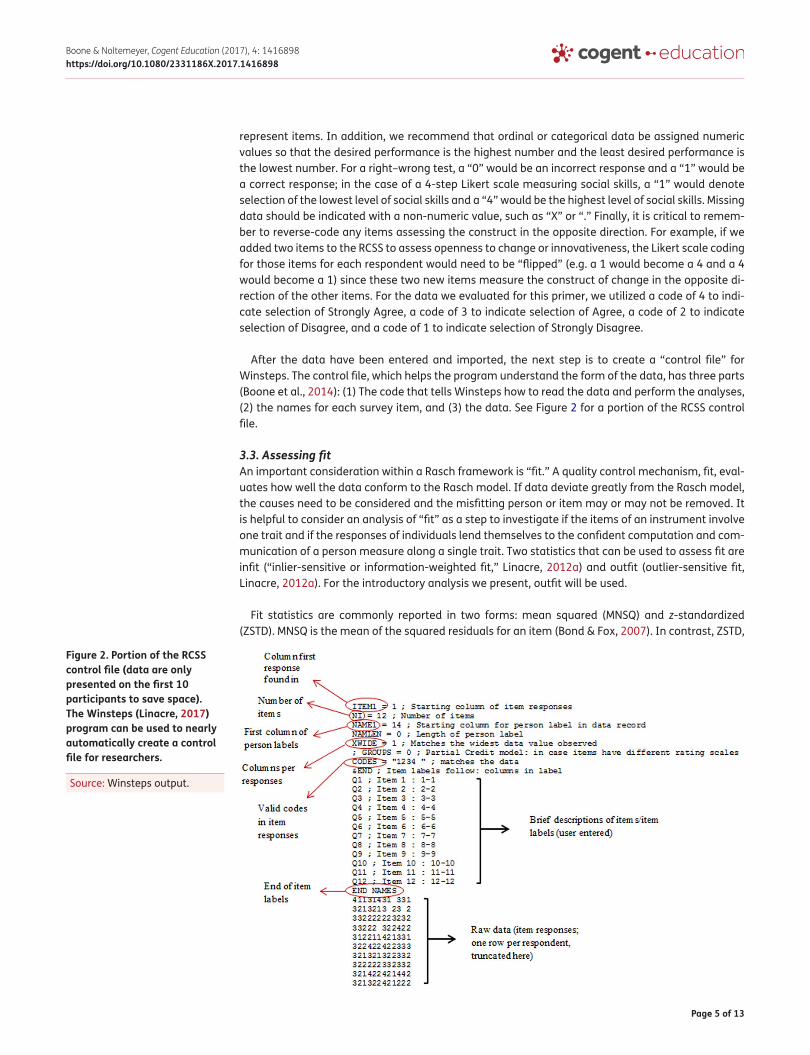
After the data have been entered and imported, the next step is to create a “control file” for Winsteps. The control file, which helps the program understand the form of the data, has three parts (Boone et al., 2014): (1) The code that tells Winsteps how to read the data and perform the analyses, (2) the names for each survey item, and (3) the data. See Figure 2 for a portion of the RCSS control file.
3.3. Assessing fitAn important consideration within a Rasch framework is “fit.” A quality control mechanism, fit, eval-uates how well the data conform to the Rasch model. If data deviate greatly from the Rasch model, the causes need to be considered and the misfitting person or item may or may not be removed. It is helpful to consider an analysis of “fit” as a step to investigate if the items of an instrument involve one trait and if the responses of individuals lend themselves to the confident computation and com-munication of a person measure along a single trait. Two statistics that can be used to assess fit are infit (“inlier-sensitive or information-weighted fit,” Linacre, 2012a) and outfit (outlier-sensitive fit, Linacre, 2012a). For the introductory analysis we present, outfit will be used.
Fit statistics are commonly reported in two forms: mean squared (MNSQ) and z-standardized (ZSTD). MNSQ is the mean of the squared residuals for an item (Bond & Fox, 2007). In contrast, ZSTD,
Figure 2. Portion of the RCSS control file (data are only presented on the first 10 participants to save space). The Winsteps (Linacre, 2017) program can be used to nearly automatically create a control file for researchers.
Source: Winsteps output.
Page 6 of 13
Boone & Noltemeyer, Cogent Education (2017), 4: 1416898https://doi.org/10.1080/2331186X.2017.1416898
the standardized form, is a transformation of the mean square value with a sample size correction (Bond & Fox, 2007). Furthermore, whereas ZSTD is sample-size dependent, MNSQ is, “sample-size independent when the noise in the data is spread evently across the population” (Linacre, 2014). Considering the different types and forms of fit statistics, which should be used to evaluate misfit? Although varying recommendations have been presented, Boone et al. (2014) and others recom-mend examining MNSQ outfit first. Wright and Linacre (1994) suggest that MNSQ values less than 1.4 are acceptable for rating scale data, and values less than 1.3 are acceptable for multiple-choice tests that are not high stakes.
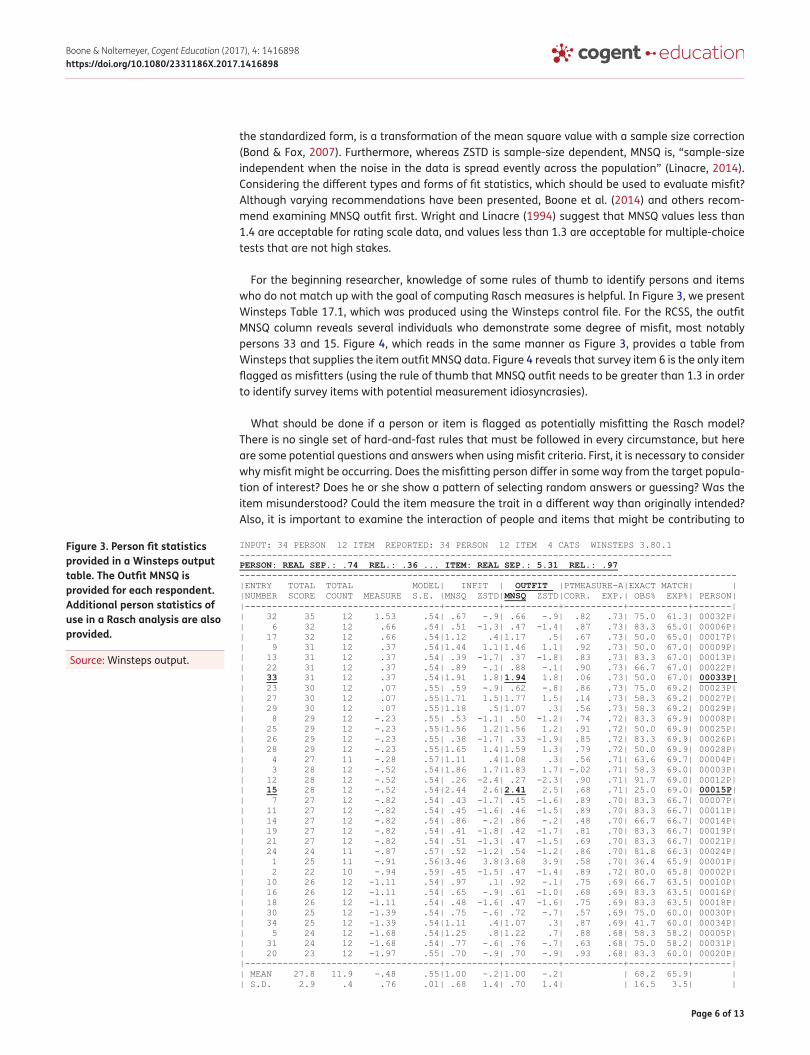
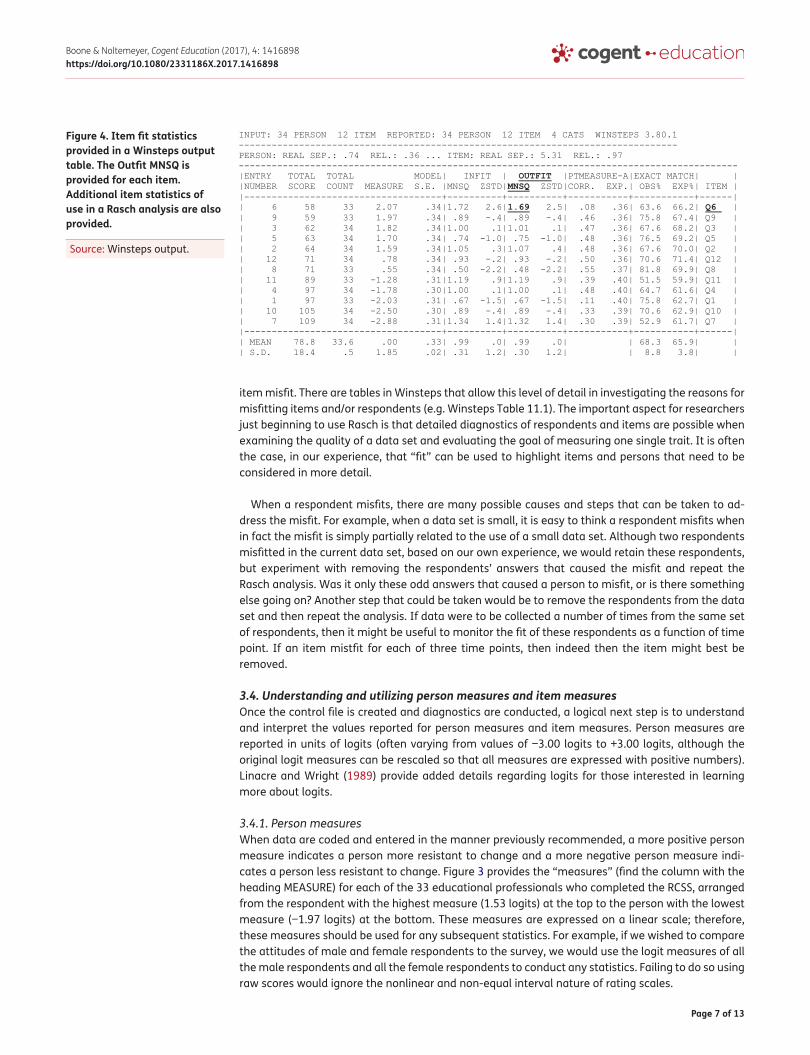
For the beginning researcher, knowledge of some rules of thumb to identify persons and items who do not match up with the goal of computing Rasch measures is helpful. In Figure 3, we present Winsteps Table 17.1, which was produced using the Winsteps control file. For the RCSS, the outfit MNSQ column reveals several individuals who demonstrate some degree of misfit, most notably persons 33 and 15. Figure 4, which reads in the same manner as Figure 3, provides a table from Winsteps that supplies the item outfit MNSQ data. Figure 4 reveals that survey item 6 is the only item flagged as misfitters (using the rule of thumb that MNSQ outfit needs to be greater than 1.3 in order to identify survey items with potential measurement idiosyncrasies).
What should be done if a person or item is flagged as potentially misfitting the Rasch model? There is no single set of hard-and-fast rules that must be followed in every circumstance, but here are some potential questions and answers when using misfit criteria. First, it is necessary to consider why misfit might be occurring. Does the misfitting person differ in some way from the target popula-tion of interest? Does he or she show a pattern of selecting random answers or guessing? Was the item misunderstood? Could the item measure the trait in a different way than originally intended? Also, it is important to examine the interaction of people and items that might be contributing to
Figure 3. Person fit statistics provided in a Winsteps output table. The Outfit MNSQ is provided for each respondent. Additional person statistics of use in a Rasch analysis are also provided.
Source: Winsteps output.
Page 7 of 13
Boone & Noltemeyer, Cogent Education (2017), 4: 1416898https://doi.org/10.1080/2331186X.2017.1416898
item misfit. There are tables in Winsteps that allow this level of detail in investigating the reasons for misfitting items and/or respondents (e.g. Winsteps Table 11.1). The important aspect for researchers just beginning to use Rasch is that detailed diagnostics of respondents and items are possible when examining the quality of a data set and evaluating the goal of measuring one single trait. It is often the case, in our experience, that “fit” can be used to highlight items and persons that need to be considered in more detail.
When a respondent misfits, there are many possible causes and steps that can be taken to ad-dress the misfit. For example, when a data set is small, it is easy to think a respondent misfits when in fact the misfit is simply partially related to the use of a small data set. Although two respondents misfitted in the current data set, based on our own experience, we would retain these respondents, but experiment with removing the respondents’ answers that caused the misfit and repeat the Rasch analysis. Was it only these odd answers that caused a person to misfit, or is there something else going on? Another step that could be taken would be to remove the respondents from the data set and then repeat the analysis. If data were to be collected a number of times from the same set of respondents, then it might be useful to monitor the fit of these respondents as a function of time point. If an item mistfit for each of three time points, then indeed then the item might best be removed.
3.4. Understanding and utilizing person measures and item measuresOnce the control file is created and diagnostics are conducted, a logical next step is to understand and interpret the values reported for person measures and item measures. Person measures are reported in units of logits (often varying from values of −3.00 logits to +3.00 logits, although the original logit measures can be rescaled so that all measures are expressed with positive numbers). Linacre and Wright (1989) provide added details regarding logits for those interested in learning more about logits.
3.4.1. Person measuresWhen data are coded and entered in the manner previously recommended, a more positive person measure indicates a person more resistant to change and a more negative person measure indi-cates a person less resistant to change. Figure 3 provides the “measures” (find the column with the heading MEASURE) for each of the 33 educational professionals who completed the RCSS, arranged from the respondent with the highest measure (1.53 logits) at the top to the person with the lowest measure (−1.97 logits) at the bottom. These measures are expressed on a linear scale; therefore, these measures should be used for any subsequent statistics. For example, if we wished to compare the attitudes of male and female respondents to the survey, we would use the logit measures of all the male respondents and all the female respondents to conduct any statistics. Failing to do so using raw scores would ignore the nonlinear and non-equal interval nature of rating scales.
Figure 4. Item fit statistics provided in a Winsteps output table. The Outfit MNSQ is provided for each item. Additional item statistics of use in a Rasch analysis are also provided.
Source: Winsteps output.
Page 8 of 13
Boone & Noltemeyer, Cogent Education (2017), 4: 1416898https://doi.org/10.1080/2331186X.2017.1416898
3.4.2. Item measuresItem measures are also expressed in logit units. With the coding used for our analysis, a higher item measure indicates an item that was harder to agree with (indicating less openness to change), whereas a lower item measure denotes an item that was easier to agree with (indicating less open-ness to change). Figure 4, which provides item measures, reveals that item 6 is the most difficult item to endorse on the RCSS and item 7 is the easiest item to endorse. More specifically, item 6 is 2.07 logits and item 7 is −2.88 logits. Just as the person measures are expressed using a linear metric (the logit), the item measures are expressed using the same linear logit scale; we discuss the impli-cations of this below when describing Wright Maps.
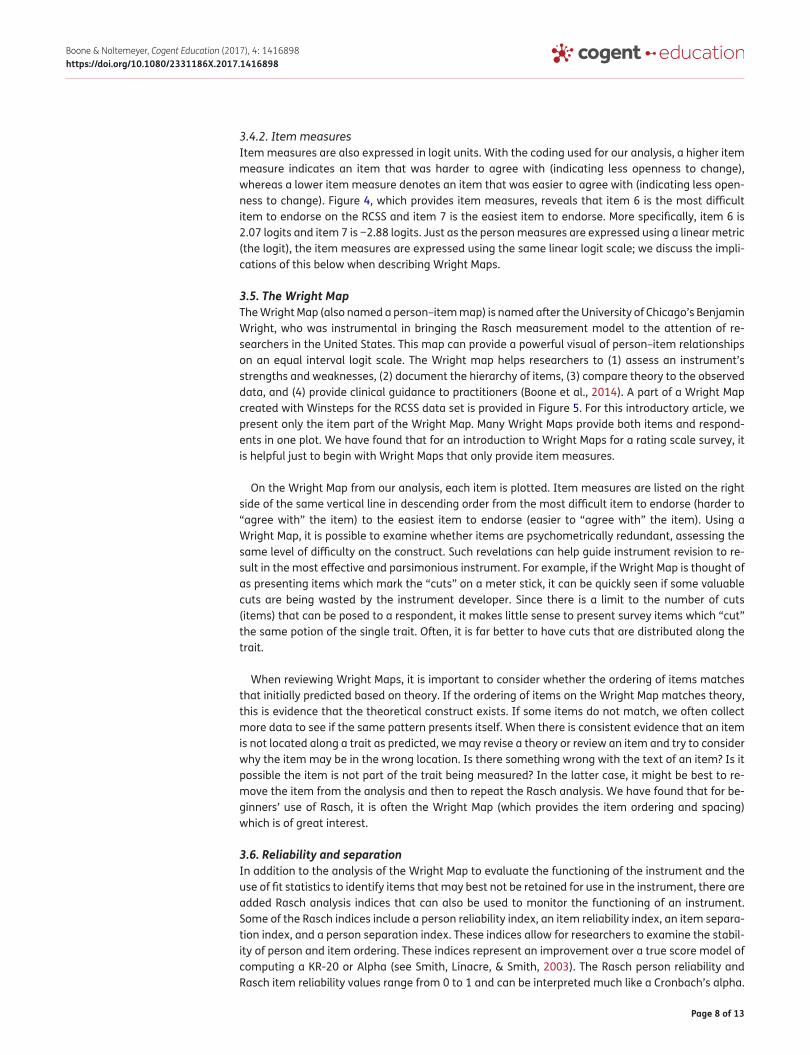
3.5. The Wright MapThe Wright Map (also named a person–item map) is named after the University of Chicago’s Benjamin Wright, who was instrumental in bringing the Rasch measurement model to the attention of re-searchers in the United States. This map can provide a powerful visual of person–item relationships on an equal interval logit scale. The Wright map helps researchers to (1) assess an instrument’s strengths and weaknesses, (2) document the hierarchy of items, (3) compare theory to the observed data, and (4) provide clinical guidance to practitioners (Boone et al., 2014). A part of a Wright Map created with Winsteps for the RCSS data set is provided in Figure 5. For this introductory article, we present only the item part of the Wright Map. Many Wright Maps provide both items and respond-ents in one plot. We have found that for an introduction to Wright Maps for a rating scale survey, it is helpful just to begin with Wright Maps that only provide item measures.
On the Wright Map from our analysis, each item is plotted. Item measures are listed on the right side of the same vertical line in descending order from the most difficult item to endorse (harder to “agree with” the item) to the easiest item to endorse (easier to “agree with” the item). Using a Wright Map, it is possible to examine whether items are psychometrically redundant, assessing the same level of difficulty on the construct. Such revelations can help guide instrument revision to re-sult in the most effective and parsimonious instrument. For example, if the Wright Map is thought of as presenting items which mark the “cuts” on a meter stick, it can be quickly seen if some valuable cuts are being wasted by the instrument developer. Since there is a limit to the number of cuts (items) that can be posed to a respondent, it makes little sense to present survey items which “cut” the same potion of the single trait. Often, it is far better to have cuts that are distributed along the trait.
When reviewing Wright Maps, it is important to consider whether the ordering of items matches that initially predicted based on theory. If the ordering of items on the Wright Map matches theory, this is evidence that the theoretical construct exists. If some items do not match, we often collect more data to see if the same pattern presents itself. When there is consistent evidence that an item is not located along a trait as predicted, we may revise a theory or review an item and try to consider why the item may be in the wrong location. Is there something wrong with the text of an item? Is it possible the item is not part of the trait being measured? In the latter case, it might be best to re-move the item from the analysis and then to repeat the Rasch analysis. We have found that for be-ginners’ use of Rasch, it is often the Wright Map (which provides the item ordering and spacing) which is of great interest.
3.6. Reliability and separationIn addition to the analysis of the Wright Map to evaluate the functioning of the instrument and the use of fit statistics to identify items that may best not be retained for use in the instrument, there are added Rasch analysis indices that can also be used to monitor the functioning of an instrument. Some of the Rasch indices include a person reliability index, an item reliability index, an item separa-tion index, and a person separation index. These indices allow for researchers to examine the stabil-ity of person and item ordering. These indices represent an improvement over a true score model of computing a KR-20 or Alpha (see Smith, Linacre, & Smith, 2003). The Rasch person reliability and Rasch item reliability values range from 0 to 1 and can be interpreted much like a Cronbach’s alpha.
Page 9 of 13
Boone & Noltemeyer, Cogent Education (2017), 4: 1416898https://doi.org/10.1080/2331186X.2017.1416898
Rasch analysis also provides so-called person separation indices and item separation indices; the former reveal how well a set of items separates persons measured, and the latter reveal how well a sample of people is able to separate the items (Wright & Stone, 1999). Separation index values can range from 0 to infinity, and higher values indicate better separation. Linacre (2012b) suggest that item separation indices of 3 or greater are desirable. In terms of person separation, an index of 1.50 is acceptable, 2.00 is good, and 3.00 is excellent (Duncan, Bode, Lai, & Perera, 2003).
At the top of Figure 3, four indices are presented for the RCSS (underlined and bolded). These data reveal strong item separation (5.31) and item reliability (0.97). These values suggest a sufficient sam-ple to reveal the hierarchy and spacing of items across different samples of similar respondents. However, the person separation index (0.74) reveals a lower level of person separation and the person reliability index reveals a lower level of person reliability (0.36). These two low values may be a reflec-tion of survey items that collected redundant information. Readers are asked to remember our com-ments about striving to not make “cuts” with items on the same part of the trait since there is a limit to the number of items which can be presented to a respondent. This suggests that the instrument may not have sufficient sensitivity to consistently differentiate between respondents. It could be that more well-targeted items (items between Q8 and Q11) may be needed in the instrument (see Boone et al., 2014). Another issue may be the role that unused (or rarely used) rating scale steps play in the measurement of respondents. It could be that use of a 6 category rating scale (e.g. Strongly Agree, Agree, Barely Agree, Barely Disagree, Disagree, Strongly Disagree) might better help differentiate re-spondents. This information concerning instrument functioning is one additional example of how in-strumentation for use in school psychology can be enhanced through the use of Rasch analysis.
3.7. Rating scale step analysisThe details provided thus far in this brief summary of Rasch analysis techniques are equally appro-priate issues to consider for both dichtomous data (e.g. right/wrong tests) and rating scale data. Below we provide some nuances of Rasch techniques that are most easily understood using a rating scale, and in this example, we utilize a 4 step RCSS rating scale (Strongly Agree, Agree, Disagree, Strongly Disagree).
Figure 5. Part of a Wright Map from the RCSS data, from Winsteps. Items are plotted on the linear (interval) logit scale that ranges from −3 logits to 2 logits for this analysis. Items that are harder to agree with are plotted toward the top of the Wright Map. Items that are easier to agree with are plotted toward the base of the Wright Map. Items at the same measure value can be viewed as cutting the “thermometer” at the same spot. Such items, from a measurement perspective, might be redundant.
Items That WereHarder to Endorse
Items That WereEasier to Endorse
Source: Winsteps output.
Page 10 of 13
Boone & Noltemeyer, Cogent Education (2017), 4: 1416898https://doi.org/10.1080/2331186X.2017.1416898
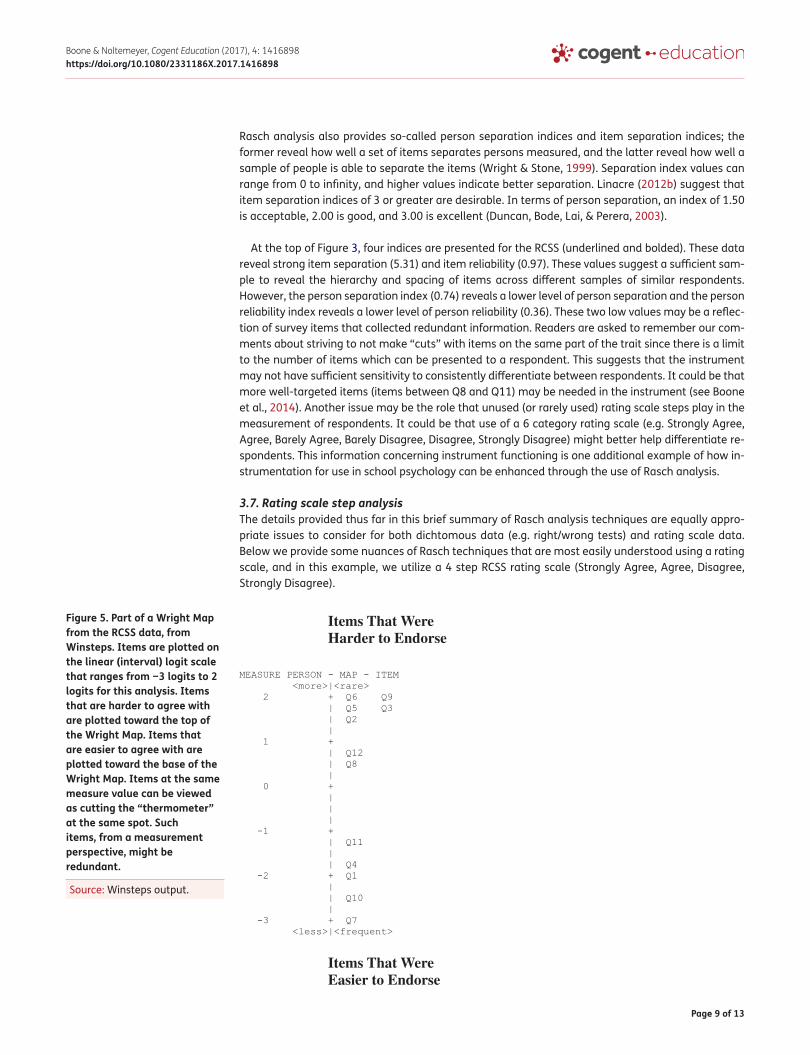
Figure 6 illustrates data from the analysis of one of the RCSS items, Q12. The SCORE VALUE, COUNT, and % provide details with respect to what percent of the sample selected a particular rating scale step when answering item Q12. In this case, we can observe that 25 respondents (74% of the sam-ple) selected a 2 (a “Disagree”) for this item. Although this breakdown in itself is interesting for all the rating scale steps, it is the AVERAGE ABILITY column which is the most important. This column provides the average Rasch person measure (determined from a respondent completing the entire instrument), which must be compared to the AVERAGE ABILITY values for the respondents who an-swered the other rating scale steps. In this example, the average ability of all 7 respondents who selected Strongly Disagree (a “1”) to item Q12 was −1.16 logits, the average ability of all 25 respond-ents who selected a Disagree (a “2”) to item Q12 was a −0.35, and the average ability of all 2 re-spondents who selected a Agree (a “3”) to item Q12 was 0.22. The importance of these average ability measures is that if the instrument is functioning well, an increase in average ability for each step up (e.g., from a “1” to a “2,” from a “2” to a “3”) on the scale would be expected. If this pattern is not present for an item, the item may need to be revised or removed. There are also issues associ-ated with sample size to consider, but for purposes of our article we wish to present this basic analy-sis that considers whether or not the pattern of responses matches that which would be predicted in a well-functioning instrument.
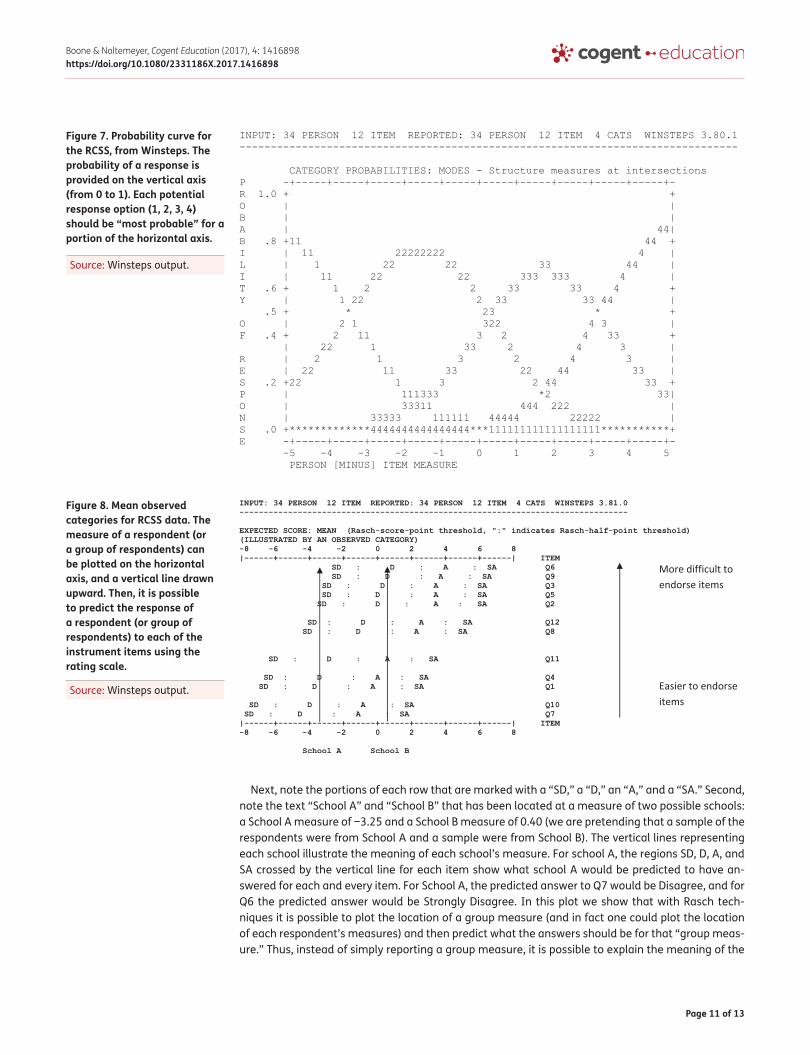
A third step to evaluate the functioning of a rating scale involves the probability curve presented in Figure 7. As discussed by Bond and Fox (2007, p. 224), probability curves “… show the probability of endorsing a given rating scale category for every agreeability-endorsability … difference esti-mate.” Each rating category should have a peak on the curve, revealing that it is the most probable category for some portion of the construct (Bond & Fox, 2007). Figure 7 reveals a well-functioning rating scale and items, with the top trace including 1s, 2s, 3s, and 4s. This suggests that throughout a range of person–item interactions, there are some instances in which each rating scale is “most likely.” If it were not the case that a rating scale was most likely (for example, no segment where the 3s are located in the highest trace), this would suggest a rating scale that did not fully maximize the measurement potential of a rating scale survey.
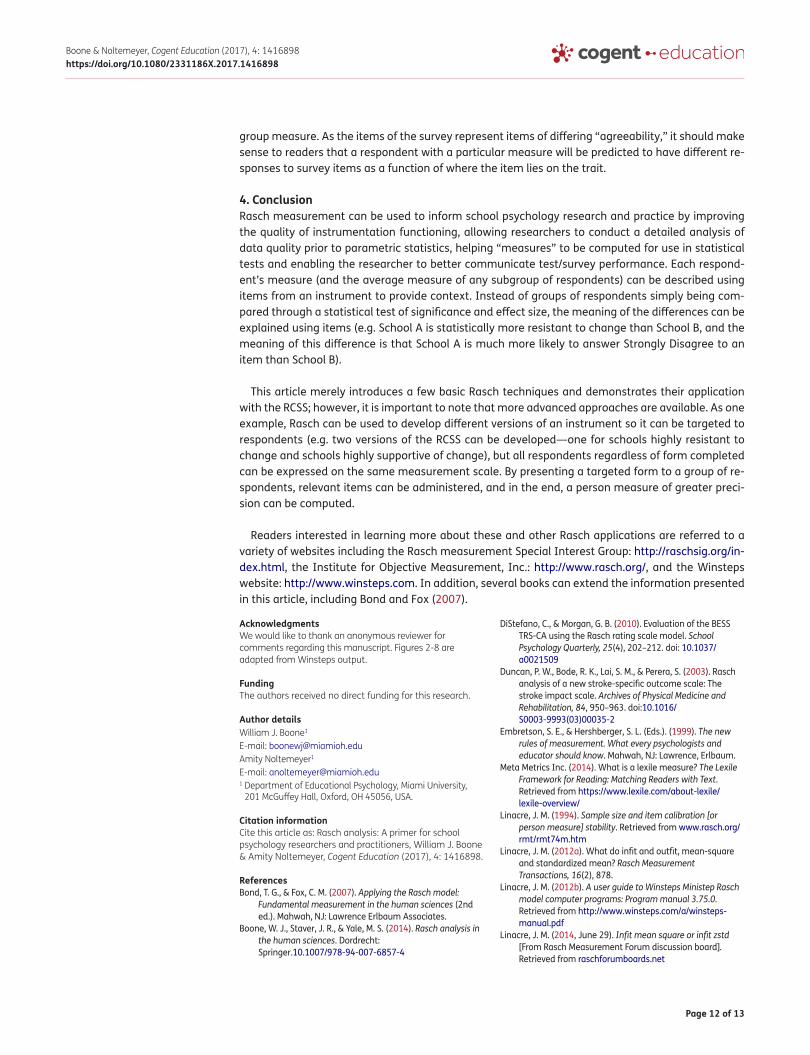
3.8. The interplay of items, persons, and rating scalesEarlier, we introduced readers to the Wright Map, a useful tool for exploring how an instrument’s item marks a trait (readers are reminded that many Wright Maps include both persons and items, and it is for this introductory article we have decided to only present the item part of the Wright Map). Figure 8, which is provided using Winsteps for a Rasch analysis, can be used to bring meaning to the “measure” of a respondent or a group of respondents. To understand the power of the table, first note on the far right side of the table—the listing of items from easiest to agree with to hardest to agree with—Q7 is at the base (the easiest to agree with item), and item Q6 is at the top of the table (the hardest to agree with item). This is the same pattern of item difficulty seen in the Wright Map.
Figure 6. Item option frequencies in measure order for the RCSS. Seven respondents selected “SD” for their answer to Q12, 25 respondents selected “D” for their answer to Q12, and 2 respondents selected “A” for their response to item Q12. The average measure of all seven respondents selecting “SD” was −1.16 logits. Table produced from Winsteps.
Source: Winsteps output.
Page 11 of 13
Boone & Noltemeyer, Cogent Education (2017), 4: 1416898https://doi.org/10.1080/2331186X.2017.1416898
Next, note the portions of each row that are marked with a “SD,” a “D,” an “A,” and a “SA.” Second, note the text “School A” and “School B” that has been located at a measure of two possible schools: a School A measure of −3.25 and a School B measure of 0.40 (we are pretending that a sample of the respondents were from School A and a sample were from School B). The vertical lines representing each school illustrate the meaning of each school’s measure. For school A, the regions SD, D, A, and SA crossed by the vertical line for each item show what school A would be predicted to have an-swered for each and every item. For School A, the predicted answer to Q7 would be Disagree, and for Q6 the predicted answer would be Strongly Disagree. In this plot we show that with Rasch tech-niques it is possible to plot the location of a group measure (and in fact one could plot the location of each respondent’s measures) and then predict what the answers should be for that “group meas-ure.” Thus, instead of simply reporting a group measure, it is possible to explain the meaning of the
Figure 7. Probability curve for the RCSS, from Winsteps. The probability of a response is provided on the vertical axis (from 0 to 1). Each potential response option (1, 2, 3, 4) should be “most probable” for a portion of the horizontal axis.
Source: Winsteps output.
Figure 8. Mean observed categories for RCSS data. The measure of a respondent (or a group of respondents) can be plotted on the horizontal axis, and a vertical line drawn upward. Then, it is possible to predict the response of a respondent (or group of respondents) to each of the instrument items using the rating scale.
Source: Winsteps output.
Page 12 of 13
Boone & Noltemeyer, Cogent Education (2017), 4: 1416898https://doi.org/10.1080/2331186X.2017.1416898
group measure. As the items of the survey represent items of differing “agreeability,” it should make sense to readers that a respondent with a particular measure will be predicted to have different re-sponses to survey items as a function of where the item lies on the trait.
4. ConclusionRasch measurement can be used to inform school psychology research and practice by improving the quality of instrumentation functioning, allowing researchers to conduct a detailed analysis of data quality prior to parametric statistics, helping “measures” to be computed for use in statistical tests and enabling the researcher to better communicate test/survey performance. Each respond-ent’s measure (and the average measure of any subgroup of respondents) can be described using items from an instrument to provide context. Instead of groups of respondents simply being com-pared through a statistical test of significance and effect size, the meaning of the differences can be explained using items (e.g. School A is statistically more resistant to change than School B, and the meaning of this difference is that School A is much more likely to answer Strongly Disagree to an item than School B).
This article merely introduces a few basic Rasch techniques and demonstrates their application with the RCSS; however, it is important to note that more advanced approaches are available. As one example, Rasch can be used to develop different versions of an instrument so it can be targeted to respondents (e.g. two versions of the RCSS can be developed—one for schools highly resistant to change and schools highly supportive of change), but all respondents regardless of form completed can be expressed on the same measurement scale. By presenting a targeted form to a group of re-spondents, relevant items can be administered, and in the end, a person measure of greater preci-sion can be computed.
Readers interested in learning more about these and other Rasch applications are referred to a variety of websites including the Rasch measurement Special Interest Group: http://raschsig.org/in-dex.html, the Institute for Objective Measurement, Inc.: http://www.rasch.org/, and the Winsteps website: http://www.winsteps.com. In addition, several books can extend the information presented in this article, including Bond and Fox (2007).
AcknowledgmentsWe would like to thank an anonymous reviewer for comments regarding this manuscript. Figures 2-8 are adapted from Winsteps output.
FundingThe authors received no direct funding for this research.
Author detailsWilliam J. Boone1
E-mail: [email protected] Noltemeyer1
E-mail: [email protected] Department of Educational Psychology, Miami University,
201 McGuffey Hall, Oxford, OH 45056, USA.
Citation informationCite this article as: Rasch analysis: A primer for school psychology researchers and practitioners, William J. Boone & Amity Noltemeyer, Cogent Education (2017), 4: 1416898.
ReferencesBond, T. G., & Fox, C. M. (2007). Applying the Rasch model:
Fundamental measurement in the human sciences (2nd ed.). Mahwah, NJ: Lawrence Erlbaum Associates.
Boone, W. J., Staver, J. R., & Yale, M. S. (2014). Rasch analysis in the human sciences. Dordrecht: Springer.10.1007/978-94-007-6857-4
DiStefano, C., & Morgan, G. B. (2010). Evaluation of the BESS TRS-CA using the Rasch rating scale model. School Psychology Quarterly, 25(4), 202–212. doi: 10.1037/a0021509
Duncan, P. W., Bode, R. K., Lai, S. M., & Perera, S. (2003). Rasch analysis of a new stroke-specific outcome scale: The stroke impact scale. Archives of Physical Medicine and Rehabilitation, 84, 950–963. doi:10.1016/S0003-9993(03)00035-2
Embretson, S. E., & Hershberger, S. L. (Eds.). (1999). The new rules of measurement. What every psychologists and educator should know. Mahwah, NJ: Lawrence, Erlbaum.
Meta Metrics Inc. (2014). What is a lexile measure? The Lexile Framework for Reading: Matching Readers with Text. Retrieved from https://www.lexile.com/about-lexile/lexile-overview/
Linacre, J. M. (1994). Sample size and item calibration [or person measure] stability. Retrieved from www.rasch.org/rmt/rmt74m.htm
Linacre, J. M. (2012a). What do infit and outfit, mean-square and standardized mean? Rasch Measurement Transactions, 16(2), 878.
Linacre, J. M. (2012b). A user guide to Winsteps Ministep Rasch model computer programs: Program manual 3.75.0. Retrieved from http://www.winsteps.com/a/winsteps-manual.pdf
Linacre, J. M. (2014, June 29). Infit mean square or infit zstd [From Rasch Measurement Forum discussion board]. Retrieved from raschforumboards.net

Page 13 of 13
Boone & Noltemeyer, Cogent Education (2017), 4: 1416898https://doi.org/10.1080/2331186X.2017.1416898
© 2017 The Author(s). This open access article is distributed under a Creative Commons Attribution (CC-BY) 4.0 license.You are free to: Share — copy and redistribute the material in any medium or format Adapt — remix, transform, and build upon the material for any purpose, even commercially.The licensor cannot revoke these freedoms as long as you follow the license terms.
Under the following terms:Attribution — You must give appropriate credit, provide a link to the license, and indicate if changes were made. You may do so in any reasonable manner, but not in any way that suggests the licensor endorses you or your use. No additional restrictions You may not apply legal terms or technological measures that legally restrict others from doing anything the license permits.
Cogent Education (ISSN: 2331-186X) is published by Cogent OA, part of Taylor & Francis Group. Publishing with Cogent OA ensures:• Immediate, universal access to your article on publication• High visibility and discoverability via the Cogent OA website as well as Taylor & Francis Online• Download and citation statistics for your article• Rapid online publication• Input from, and dialog with, expert editors and editorial boards• Retention of full copyright of your article• Guaranteed legacy preservation of your article• Discounts and waivers for authors in developing regionsSubmit your manuscript to a Cogent OA journal at www.CogentOA.com
Linacre, J. M. (2017). Winsteps® Rasch measurement computer program. Beaverton, OR: Winsteps.com.
Linacre, J. M., & Wright, B. D. (1989). The “length” of a logit. Rasch Measurement Transactions, 3(2), 54–55.
Michell, J. (1997). Quantitative science and the definition of measurement in psychology. British Journal of Psychology, 88, 355–383.https//doi.org/10.1111/bjop.1997.88.issue-3
Michell, J. (2002). Steven’s theory of scales of measurement and its place in modern psychology. Australian Journal of Psychology, 54(2), 99–104.https//doi.org/10.1080/00049530210001706563
Northwestern Evaluation Association. (2009). Measures of academic progress [Measurement instrument]. Portland, OR: Author.
Program Committee of the Institute for Objective Measurement. (2000). Definition of objective measurement. Retrieved from http://www.rasch.org/define.htm
Rasch, G. (1960). Probabilistic models for some intelligence and attainment tests. Copenhagen: Danmarks Paedagogiske Institut.
Rogers, E. M. (2003). Diffusion of innovations (5th ed.). New York, NY: Free Press.
Smith, R. M., Linacre, J. M., & Smith, Jr., E. V. (2003). Guidelines for manuscripts. Journal of Applied Measurement, 4, 198–204.
Stenner, J. A. (1996). Measuring reading comprehension with the Lexile framework. Paper presented at the North American Conference on Adolescent/Adult Literacy, Washington, DC. Abstract retrieved from http://eric.ed.gov/?id=ED435977
Stevens, S. S. (1951). Mathematics, measurement, and psychophysics. In S. S. Stevens (Ed.), Handbook of experimental psychology (pp. 1–49). New York, NY: John Wiley.
Vander Ark, T. (2013, June 5). Vander Ark on innovation: A proposal for better growth measures [Web log post]. Retrieved from http://blogs.edweek.org/edweek/on_innovation/2013/06/a_proposal_for_better_growth_measures.html
Wechsler, S. M., Nunes, C. S., Schelini, P. W., Pasian, S. R., Homsi, S. V., Moretti, L., & Anache, A. A. (2010). Brazilian adaptation of the Woodcock-Johnson III cognitive tests. School Psychology International, 31(4), 409–421. doi:10.1177/0143034310377165
Wilson, M. R. (2005). Constructing measures: An items response modeling approach. Mahwah, NJ: Lawrence Erlbaum.
Wright, B. D. (1992). Raw scores are not linear measures: Rasch vs. classical test theory CTT comparison. Rasch Measurement Transactions, 6(1), 208.
Wright, B. D., & Linacre, J. M. (1994). Reasonable mean-square fit values. Rasch Measurement Transactions, 8(3), 370.
Wright, B. D., & Masters, G. (1982). Rating scale analysis. Chicago, IL: MESA Press.
Wright, B., & Stone, M. (1979). Best test design. Chicago, IL: Mesa Press.
Wright, B., & Stone, M. (1999). Measurement essentials (2nd ed.). Wilmington, DE: Wide Range,.
Wu, M. L., Adams, R. J., Wilson, M. R., & Haldane, S. R. (2007) ConQuest generalized item response modeling software (Version 2.0) [Statistical analysis software]. Melbourne: Australian Council for Educational Research.