Embed Size (px)
Citation preview
Full Terms & Conditions of access and use can be found at
http://hrmars.com/index.php/pages/detail/publication-ethics
Rasch Analysis and Differential Item Functioning of STEM Teachers’ Instructional Preparedness Instrument for Urban and Rural Teachers
Nur Farhana Ramli, Othman Talib, Siti Aishah Hassan, Umi Kalthom Abdul Manaf
To Link this Article: http://dx.doi.org/10.6007/IJARPED/v7-i4/4848 DOI: 10.6007/IJARPED/v7-i4/4848
Received: 09 Sept 2018, Revised: 23 October 2018, Accepted: 11 Nov 2018
Published Online: 17 Nov 2018
In-Text Citation: (Ramli, Talib, Hassan, & Manaf, 2018) To Cite this Article: Ramli, N. F., Talib, O., Hassan, S. A., & Manaf, U. K. A. (2018). Rasch Analysis and Differential Item Functioning of STEM Teachers’ Instructional Preparedness Instrument for Urban and Rural Teachers. International Journal of Academic Research in Progressive Education and Development, 7(4), 211–222.
Copyright: © 2018 The Author(s)
Published by Human Resource Management Academic Research Society (www.hrmars.com) This article is published under the Creative Commons Attribution (CC BY 4.0) license. Anyone may reproduce, distribute, translate and create derivative works of this article (for both commercial and non-commercial purposes), subject to full attribution to the original publication and authors. The full terms of this license may be seen at: http://creativecommons.org/licences/by/4.0/legalcode
Vol. 7, No. 4, 2018, Pg. 211 - 222
http://hrmars.com/index.php/pages/detail/IJARPED JOURNAL HOMEPAGE
International Journal of Academic Research in Progressive Education and
Development
Vol. 7 , No. 4, 2018, E-ISSN: 2226-6348 © 2018 HRMARS
212
Rasch Analysis and Differential Item Functioning of STEM Teachers’ Instructional Preparedness
Instrument for Urban and Rural Teachers
Nur Farhana Ramli Faculty of Educational Studies, Universiti Putra Malaysia, 43400, Serdang, Selangor
Email: [email protected]
Othman Talib
Faculty of Educational Studies, Universiti Putra Malaysia, 43400, Serdang, Selangor Email: [email protected]
Siti Aishah Hassan
Faculty of Educational Studies, Universiti Putra Malaysia, 43400, Serdang, Selangor Email: [email protected]
Umi Kalthom Abdul Manaf
Faculty of Educational Studies, Universiti Putra Malaysia, 43400, Serdang, Selangor Email: [email protected]
Abstract STEM Teachers’ Instructional Preparedness instrument (STEMTIP) was developed in this study with of 40 items and consists of 5 main constructs. Using multistage cluster sampling, 252 teachers in Malaysia was selected as sample of the study. Rasch Model analyses the psychometric properties of the STEMTIP instrument. The results indicate that 40 items of the STEMTIP are well fitted to a latent unidimensional structure, as required by the Rasch Model. There are two items (ELA1 and EVA8) that show a psychometric properties of Differential Item Functioning in STEMTIP concerning school location. Finally, psychometric implications derived from the results of the present study are discussed and suggestions are provided for future investigations. Keywords: Rasch Model, Differential Item Functioning, STEM, Preparedness, Malaysia
International Journal of Academic Research in Progressive Education and
Development
Vol. 7 , No. 4, 2018, E-ISSN: 2226-6348 © 2018 HRMARS
213
Introduction STEM is an acronym of Science, Technology, Engineering and Mathematics. The merger of these discipline makes it a high demand in the job market. In 2017, the US Bureau of Labor Statistics reported that STEM related workforce grew by 10.5% between May 2009 and May 2015 compared to a 5.2% net growth in non-STEM related workforce showing a high demand in STEM related occupations (Fayer, Lacey, & Watson, 2017). Malaysia is also not lagging behind with a target of 1 million workers by 2020. However, what is worrying is the latest figure of STEM workforce in 2012 that was only 120K (Academy of Sciences Malaysia, 2015). Therefore, to ensure that goal is met, the related stakeholders have made an initiative towards preparing a quality STEM workforce. Among them is the efforts of Malaysia's Ministry of Education to include STEM as one of the approaches in the standard curriculum of schools beginning 2017 (Curriculum Development Division, 2016). Previous study have reported that the effort to attract students to the science stream in Malaysia has begun since 1967 with the policy of 60:40 Science/Technical: Arts (60:40) (Ministry of Education Malaysia, 2013). The policy refers to the Ministry's target to get more students on science stream compared to the arts stream. However, this policy’s target has never been met due to various factors. The highest ratio was 44: 56 in 2011 and then it dropped to 21:79 in 2014 (Academy of Sciences Malaysia, 2015). Among the factors that influence the lack of student enrolment in STEM are teachers. Teachers have great inspiration in building student interest and motivation in STEM (Price, 2010; van Tuijl & van der Molen, 2016). However, teachers stated that some obstacles in the implementation of STEM in teaching and learning include motivation, syllabus, time constraints, lack of training, inadequate facilities, students' involvement as well as school and community response (Nur Farhana Ramli & Othman Talib, 2017). In addition, the achievement gap for science and mathematics subjects between urban and rural areas is also due to the fact of teachers who have not fully grasped and internalized the standard curriculum (Ministry of Education, 2017). The Malaysia Education Blueprint 2013-2025 reported that besides the factor of limited awareness, perceived difficulties in STEM subjects, limited and outdated infrastructure, teachers’ instructional quality are also one of the factors of the declining of STEM enrolment. Teachers reportedly failed to create a student-centered learning environment and still maintain inactive instructional innovations (Academy of Sciences Malaysia, 2015; Nordin & Ling, 2011). Since student interest is based on a teacher’s instructional method (Henry et al., 2011; Slavit, Nelson, & Lesseig, 2016), the role of the teacher in shaping a pupil's future is important. Teacher Preparedness in STEM Implementation One of the STEM approaches in teaching is through inquiry-based learning. In inquiry-based learning, the teacher will act as a facilitator. In the process, teachers need to master how to offer the right amount of support to scaffolod student learning. Belland (2017) defines instructional scaffolding as support given to allow students to participate and gain skills at a task that they cannot solve without help. The instructional scaffolding may come from the help of teachers, parents, peers or computer aided scaffolding (Belland, 2014). In STEM teaching and learning, instructional scaffolding has been used and is proven to be effective in assisting students in their
International Journal of Academic Research in Progressive Education and
Development
Vol. 7 , No. 4, 2018, E-ISSN: 2226-6348 © 2018 HRMARS
214
learning process (Crippen & Archambault, 2012; Dani, Hartman, & Helfrich, 2017; Rehmat & Bailey, 2014). Teachers’ preparedness in instructional is crucial to ensure the success of the curriculum. Teachers' preparation symbolizes their quality (Darling-Hammond, Chung, & Frelow, 2002). The STEM instructional process requires teachers to play a role and plan to inspire and give opportunities to students to appreciate STEM. Among the tasks of teachers in giving instructional support to pupils are like brainstorming, guiding and developing students' thinking skills, and giving comments and suggestions to given tasks (Curriculum Development Division, 2016b). For that reason, the teacher's instructional preparedness is very vital and needs to be measured as the information obtained can benefit stakeholders and teachers themselves. Previous studies reported that there is an achievement gap reported due to the geographical location of schools, i.e., urban and rural schools (Ministry of Education Malaysia, 2013). Teachers and students in rural areas are also lagging in terms of ICT exposure compared to pupils and teachers in urban areas (Hazura, Hairulliza, Noor, & Yusiof, 2012). They are also more focused on rote learning and teachers do not expose students to thinking skills. This inevitably negatively impacts students' academic achievement (Ministry of Education, 2017). Various efforts have been undertaken to reduce urban and rural differences. One of it is The District Transformation Program (DTP) that aimed at narrowing the gap using the School Improvement Specialist Coach (SISC +). These experts help rural teachers especially in instructions to improve teaching and learning process. Thus, with the determinations undertaken, it is necessary to measure teachers’ instructional preparedness in implementing STEM. The objectives of this study are to analyse the psychometric properties and to identify the biased items in the new development instrument, STEMTIP. Besides producing fair instruments, this study is also expected to provide gap information between the urban and rural teachers. Methodology Sample The sample consisted of 252 science teachers aged from 28 to 59 years old (M age = 43.58 years, SD = 7.752) from secondary schools all over Malaysia. Roughly, 12.7% of the sample was from the north zone, 22.6% from the central zone, 31.3% from the south zone and 33.3% from east coast zone. A total of 252 science teachers were involved in the study consisting of 145 (57.5%) teachers from the city and 107 (42.5%) from rural areas. 35 (13.9%) teachers were male teachers and the rest were females at 217 (86.1%) teachers. All teachers have a teaching experience ranging from 2 to 36 years (M experience = 17.66 years, SD = 6.89 years). All teachers teach either science, chemistry, biology or physics. The breakdown of the teacher based on the taught subjects is displayed in Table 1.
International Journal of Academic Research in Progressive Education and
Development
Vol. 7 , No. 4, 2018, E-ISSN: 2226-6348 © 2018 HRMARS
215
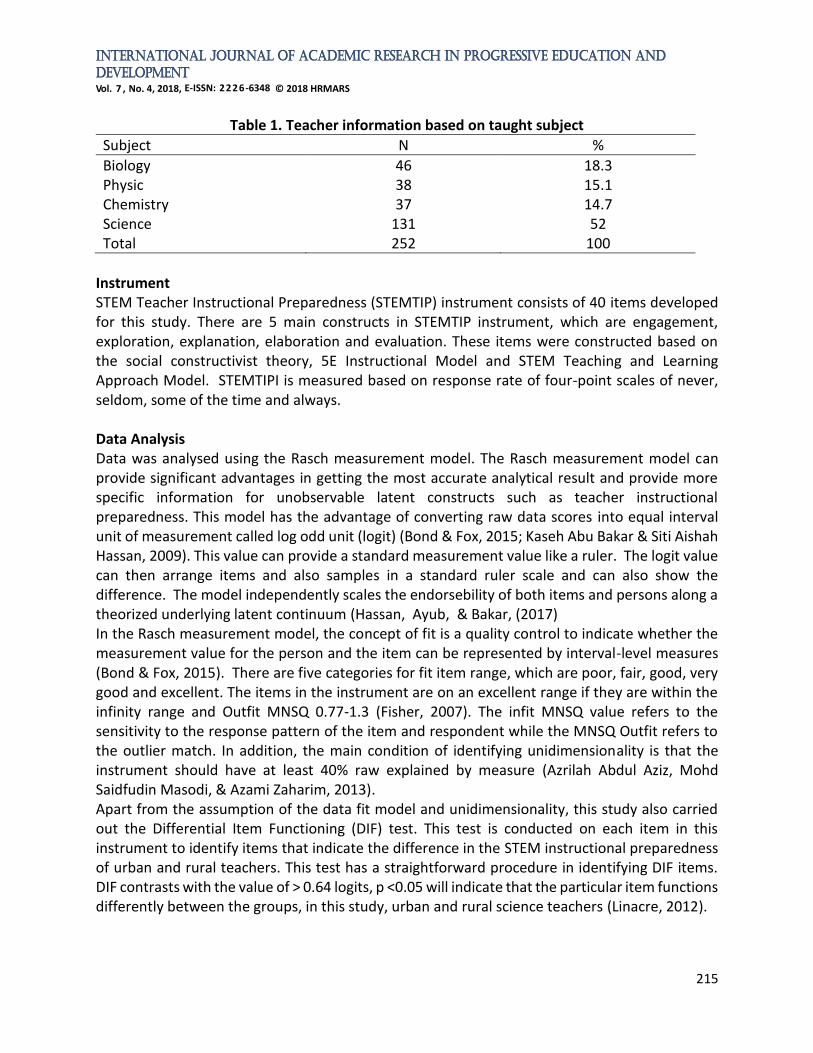
Table 1. Teacher information based on taught subject
Subject N %
Biology 46 18.3 Physic 38 15.1 Chemistry 37 14.7 Science 131 52 Total 252 100
Instrument STEM Teacher Instructional Preparedness (STEMTIP) instrument consists of 40 items developed for this study. There are 5 main constructs in STEMTIP instrument, which are engagement, exploration, explanation, elaboration and evaluation. These items were constructed based on the social constructivist theory, 5E Instructional Model and STEM Teaching and Learning Approach Model. STEMTIPI is measured based on response rate of four-point scales of never, seldom, some of the time and always. Data Analysis Data was analysed using the Rasch measurement model. The Rasch measurement model can provide significant advantages in getting the most accurate analytical result and provide more specific information for unobservable latent constructs such as teacher instructional preparedness. This model has the advantage of converting raw data scores into equal interval unit of measurement called log odd unit (logit) (Bond & Fox, 2015; Kaseh Abu Bakar & Siti Aishah Hassan, 2009). This value can provide a standard measurement value like a ruler. The logit value can then arrange items and also samples in a standard ruler scale and can also show the difference. The model independently scales the endorsebility of both items and persons along a theorized underlying latent continuum (Hassan, Ayub, & Bakar, (2017) In the Rasch measurement model, the concept of fit is a quality control to indicate whether the measurement value for the person and the item can be represented by interval-level measures (Bond & Fox, 2015). There are five categories for fit item range, which are poor, fair, good, very good and excellent. The items in the instrument are on an excellent range if they are within the infinity range and Outfit MNSQ 0.77-1.3 (Fisher, 2007). The infit MNSQ value refers to the sensitivity to the response pattern of the item and respondent while the MNSQ Outfit refers to the outlier match. In addition, the main condition of identifying unidimensionality is that the instrument should have at least 40% raw explained by measure (Azrilah Abdul Aziz, Mohd Saidfudin Masodi, & Azami Zaharim, 2013). Apart from the assumption of the data fit model and unidimensionality, this study also carried out the Differential Item Functioning (DIF) test. This test is conducted on each item in this instrument to identify items that indicate the difference in the STEM instructional preparedness of urban and rural teachers. This test has a straightforward procedure in identifying DIF items. DIF contrasts with the value of > 0.64 logits, p <0.05 will indicate that the particular item functions differently between the groups, in this study, urban and rural science teachers (Linacre, 2012).
International Journal of Academic Research in Progressive Education and
Development
Vol. 7 , No. 4, 2018, E-ISSN: 2226-6348 © 2018 HRMARS
216
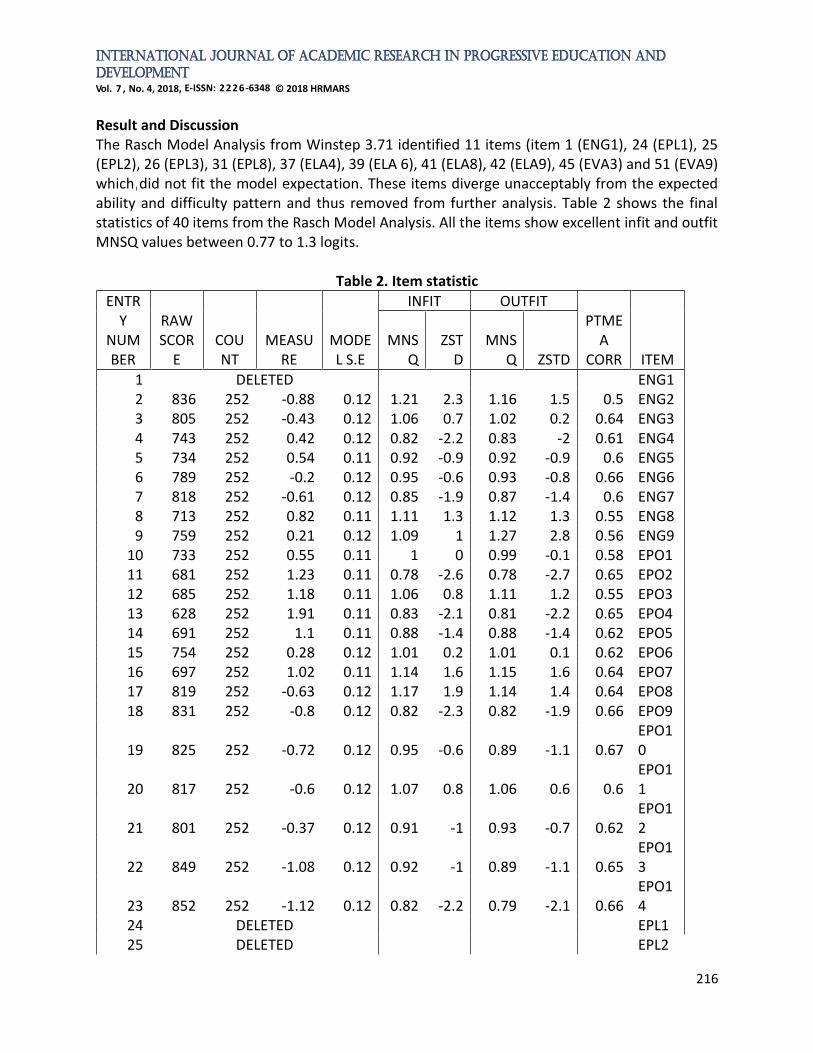
Result and Discussion The Rasch Model Analysis from Winstep 3.71 identified 11 items (item 1 (ENG1), 24 (EPL1), 25 (EPL2), 26 (EPL3), 31 (EPL8), 37 (ELA4), 39 (ELA 6), 41 (ELA8), 42 (ELA9), 45 (EVA3) and 51 (EVA9) which did not fit the model expectation. These items diverge unacceptably from the expected ability and difficulty pattern and thus removed from further analysis. Table 2 shows the final statistics of 40 items from the Rasch Model Analysis. All the items show excellent infit and outfit MNSQ values between 0.77 to 1.3 logits.
Table 2. Item statistic
ENTRY
NUMBER
RAW SCOR
E COUNT
MEASURE
MODEL S.E
INFIT OUTFIT PTME
A CORR ITEM
MNSQ
ZSTD
MNSQ ZSTD
1 DELETED ENG1 2 836 252 -0.88 0.12 1.21 2.3 1.16 1.5 0.5 ENG2 3 805 252 -0.43 0.12 1.06 0.7 1.02 0.2 0.64 ENG3 4 743 252 0.42 0.12 0.82 -2.2 0.83 -2 0.61 ENG4 5 734 252 0.54 0.11 0.92 -0.9 0.92 -0.9 0.6 ENG5 6 789 252 -0.2 0.12 0.95 -0.6 0.93 -0.8 0.66 ENG6 7 818 252 -0.61 0.12 0.85 -1.9 0.87 -1.4 0.6 ENG7 8 713 252 0.82 0.11 1.11 1.3 1.12 1.3 0.55 ENG8 9 759 252 0.21 0.12 1.09 1 1.27 2.8 0.56 ENG9
10 733 252 0.55 0.11 1 0 0.99 -0.1 0.58 EPO1 11 681 252 1.23 0.11 0.78 -2.6 0.78 -2.7 0.65 EPO2 12 685 252 1.18 0.11 1.06 0.8 1.11 1.2 0.55 EPO3 13 628 252 1.91 0.11 0.83 -2.1 0.81 -2.2 0.65 EPO4 14 691 252 1.1 0.11 0.88 -1.4 0.88 -1.4 0.62 EPO5 15 754 252 0.28 0.12 1.01 0.2 1.01 0.1 0.62 EPO6 16 697 252 1.02 0.11 1.14 1.6 1.15 1.6 0.64 EPO7 17 819 252 -0.63 0.12 1.17 1.9 1.14 1.4 0.64 EPO8 18 831 252 -0.8 0.12 0.82 -2.3 0.82 -1.9 0.66 EPO9
19 825 252 -0.72 0.12 0.95 -0.6 0.89 -1.1 0.67 EPO10
20 817 252 -0.6 0.12 1.07 0.8 1.06 0.6 0.6 EPO11
21 801 252 -0.37 0.12 0.91 -1 0.93 -0.7 0.62 EPO12
22 849 252 -1.08 0.12 0.92 -1 0.89 -1.1 0.65 EPO13
23 852 252 -1.12 0.12 0.82 -2.2 0.79 -2.1 0.66 EPO14
24 DELETED EPL1 25 DELETED EPL2
International Journal of Academic Research in Progressive Education and
Development
Vol. 7 , No. 4, 2018, E-ISSN: 2226-6348 © 2018 HRMARS
217
26 DELETED EPL3 27 807 252 -0.46 0.12 0.87 -1.6 0.86 -1.6 0.67 EPL4 28 748 252 0.36 0.12 1.26 2.8 1.28 2.9 0.57 EPL5 29 791 252 -0.23 0.12 1.01 0.1 1 0 0.64 EPL6 30 770 252 0.06 0.12 0.79 -2.6 0.78 -2.6 0.7 EPL7 31 DELETED EPL8 32 851 252 -1.11 0.12 0.81 -2.3 0.78 -2.1 0.68 EPL9 33 869 252 -1.4 0.13 0.87 -1.6 0.85 -1.3 0.64 EPL10 34 820 252 -0.64 0.12 0.97 -0.3 0.96 -0.4 0.61 ELA1 35 843 252 -0.99 0.12 0.96 -0.5 0.92 -0.7 0.65 ELA2 36 815 252 -0.57 0.12 0.85 -1.8 0.85 -1.6 0.64 ELA3 37 DELETED ELA4 38 813 252 -0.54 0.12 0.82 -2.3 0.82 -2 0.63 ELA5 39 DELETED ELA6 40 857 252 -1.2 0.13 0.82 -2.2 0.8 -1.9 0.66 ELA7 41 DELETED ELA8 42 DELETED ELA9 43 714 252 0.8 0.11 1.11 1.3 1.11 1.3 0.6 EVA1 44 694 252 1.06 0.11 1 0 1.01 0.1 0.58 EVA2 45 DELETED EVA3 46 725 252 0.66 0.11 0.86 -1.7 0.85 -1.7 0.67 EVA4 47 854 252 -1.16 0.13 1.02 0.2 0.99 0 0.64 EVA5 48 758 252 0.22 0.12 1.08 1 1.07 0.8 0.61 EVA6 49 779 252 -0.06 0.12 0.9 -1.2 0.89 -1.2 0.66 EVA7 50 748 252 0.36 0.12 0.86 -1.7 0.85 -1.7 0.66 EVA8 51 DELETED EVA9
Meanwhile, based on figure 1, the raw material explained by measures was 46.9%, 4.7% unexplained variance in the first contrast and 3.5 Eigen values indicate that there is no clear second dimension (Fisher, 2007). Because the data meets the assumptions of the fit data model and unidimensionality, the items' measure form the analysis demonstrates the property of equal interval.
Figure 1. Principal component analysis of the residuals Table 3 demonstrates DIF analysis of all 40 items based on urban (class 1) and rural (class 2) teachers. 38 items did not show any significant difference which is less than .64 logits and p <0.05 (Linacre, 2012). It can therefore be concluded 38 items are fair to both rural and urban teachers
-- Empirical -- Modeled
Total raw variance in observations = 75.3 100.0% 100.0%
Raw variance explained by measures = 35.3 46.9% 46.9%
Raw unexplained variance (total) = 40.0 53.1% 100.0% 53.1%
Unexplained variance in 1st contrast = 3.5 4.7% 8.8%
International Journal of Academic Research in Progressive Education and
Development
Vol. 7 , No. 4, 2018, E-ISSN: 2226-6348 © 2018 HRMARS
218
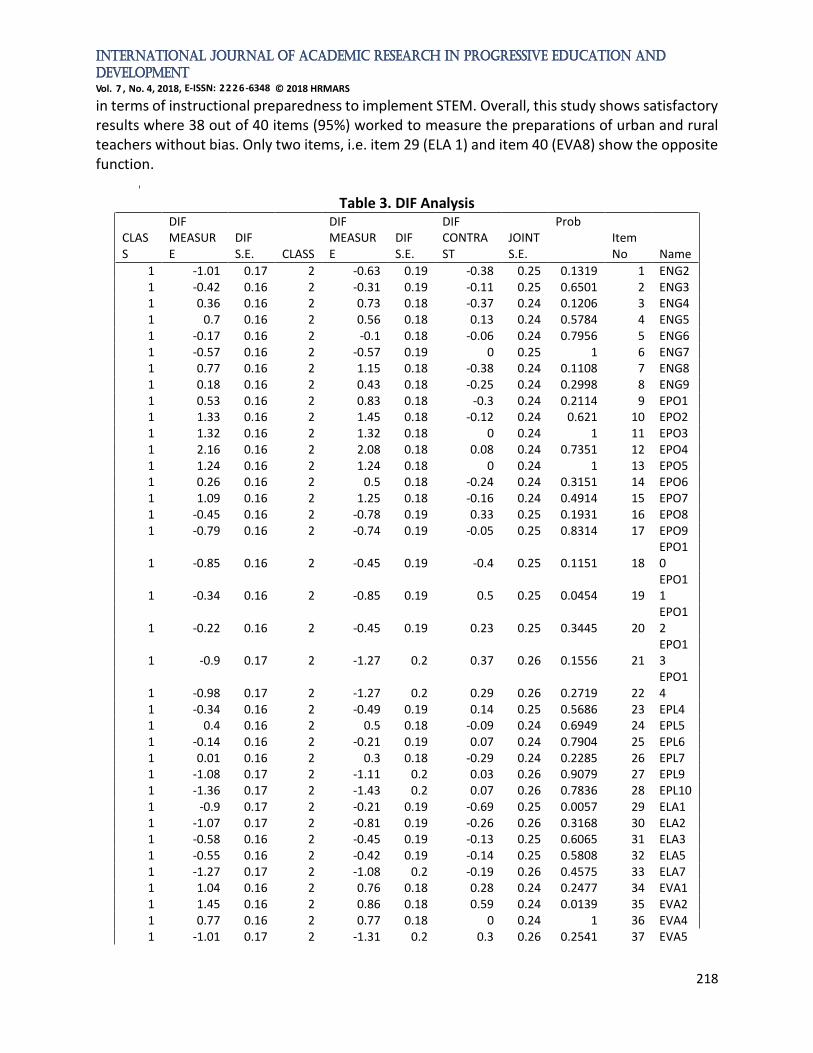
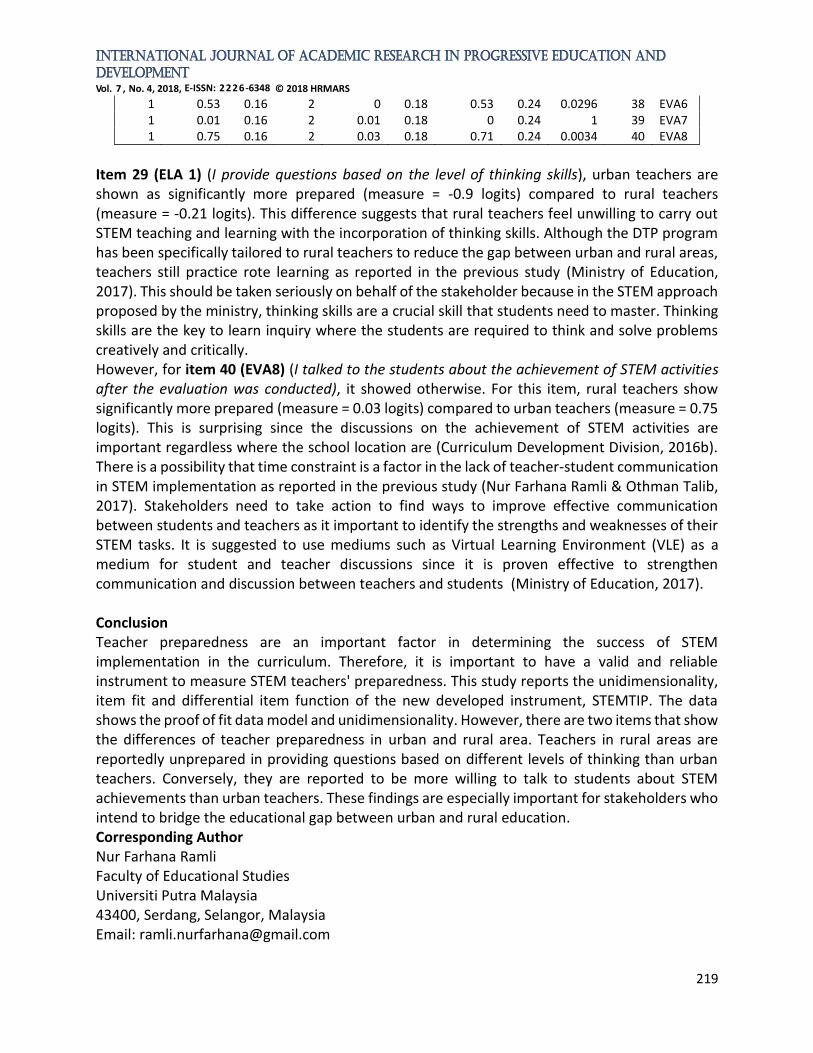
in terms of instructional preparedness to implement STEM. Overall, this study shows satisfactory results where 38 out of 40 items (95%) worked to measure the preparations of urban and rural teachers without bias. Only two items, i.e. item 29 (ELA 1) and item 40 (EVA8) show the opposite function.
Table 3. DIF Analysis
CLASS
DIF MEASURE
DIF S.E. CLASS
DIF MEASURE
DIF S.E.
DIF CONTRAST
JOINT S.E.
Prob Item No Name
1 -1.01 0.17 2 -0.63 0.19 -0.38 0.25 0.1319 1 ENG2 1 -0.42 0.16 2 -0.31 0.19 -0.11 0.25 0.6501 2 ENG3 1 0.36 0.16 2 0.73 0.18 -0.37 0.24 0.1206 3 ENG4 1 0.7 0.16 2 0.56 0.18 0.13 0.24 0.5784 4 ENG5 1 -0.17 0.16 2 -0.1 0.18 -0.06 0.24 0.7956 5 ENG6 1 -0.57 0.16 2 -0.57 0.19 0 0.25 1 6 ENG7 1 0.77 0.16 2 1.15 0.18 -0.38 0.24 0.1108 7 ENG8 1 0.18 0.16 2 0.43 0.18 -0.25 0.24 0.2998 8 ENG9 1 0.53 0.16 2 0.83 0.18 -0.3 0.24 0.2114 9 EPO1 1 1.33 0.16 2 1.45 0.18 -0.12 0.24 0.621 10 EPO2 1 1.32 0.16 2 1.32 0.18 0 0.24 1 11 EPO3 1 2.16 0.16 2 2.08 0.18 0.08 0.24 0.7351 12 EPO4 1 1.24 0.16 2 1.24 0.18 0 0.24 1 13 EPO5 1 0.26 0.16 2 0.5 0.18 -0.24 0.24 0.3151 14 EPO6 1 1.09 0.16 2 1.25 0.18 -0.16 0.24 0.4914 15 EPO7 1 -0.45 0.16 2 -0.78 0.19 0.33 0.25 0.1931 16 EPO8 1 -0.79 0.16 2 -0.74 0.19 -0.05 0.25 0.8314 17 EPO9
1 -0.85 0.16 2 -0.45 0.19 -0.4 0.25 0.1151 18 EPO10
1 -0.34 0.16 2 -0.85 0.19 0.5 0.25 0.0454 19 EPO11
1 -0.22 0.16 2 -0.45 0.19 0.23 0.25 0.3445 20 EPO12
1 -0.9 0.17 2 -1.27 0.2 0.37 0.26 0.1556 21 EPO13
1 -0.98 0.17 2 -1.27 0.2 0.29 0.26 0.2719 22 EPO14
1 -0.34 0.16 2 -0.49 0.19 0.14 0.25 0.5686 23 EPL4 1 0.4 0.16 2 0.5 0.18 -0.09 0.24 0.6949 24 EPL5 1 -0.14 0.16 2 -0.21 0.19 0.07 0.24 0.7904 25 EPL6 1 0.01 0.16 2 0.3 0.18 -0.29 0.24 0.2285 26 EPL7 1 -1.08 0.17 2 -1.11 0.2 0.03 0.26 0.9079 27 EPL9 1 -1.36 0.17 2 -1.43 0.2 0.07 0.26 0.7836 28 EPL10 1 -0.9 0.17 2 -0.21 0.19 -0.69 0.25 0.0057 29 ELA1 1 -1.07 0.17 2 -0.81 0.19 -0.26 0.26 0.3168 30 ELA2 1 -0.58 0.16 2 -0.45 0.19 -0.13 0.25 0.6065 31 ELA3 1 -0.55 0.16 2 -0.42 0.19 -0.14 0.25 0.5808 32 ELA5 1 -1.27 0.17 2 -1.08 0.2 -0.19 0.26 0.4575 33 ELA7 1 1.04 0.16 2 0.76 0.18 0.28 0.24 0.2477 34 EVA1 1 1.45 0.16 2 0.86 0.18 0.59 0.24 0.0139 35 EVA2 1 0.77 0.16 2 0.77 0.18 0 0.24 1 36 EVA4 1 -1.01 0.17 2 -1.31 0.2 0.3 0.26 0.2541 37 EVA5
International Journal of Academic Research in Progressive Education and
Development
Vol. 7 , No. 4, 2018, E-ISSN: 2226-6348 © 2018 HRMARS
219
1 0.53 0.16 2 0 0.18 0.53 0.24 0.0296 38 EVA6 1 0.01 0.16 2 0.01 0.18 0 0.24 1 39 EVA7 1 0.75 0.16 2 0.03 0.18 0.71 0.24 0.0034 40 EVA8
Item 29 (ELA 1) (I provide questions based on the level of thinking skills), urban teachers are shown as significantly more prepared (measure = -0.9 logits) compared to rural teachers (measure = -0.21 logits). This difference suggests that rural teachers feel unwilling to carry out STEM teaching and learning with the incorporation of thinking skills. Although the DTP program has been specifically tailored to rural teachers to reduce the gap between urban and rural areas, teachers still practice rote learning as reported in the previous study (Ministry of Education, 2017). This should be taken seriously on behalf of the stakeholder because in the STEM approach proposed by the ministry, thinking skills are a crucial skill that students need to master. Thinking skills are the key to learn inquiry where the students are required to think and solve problems creatively and critically. However, for item 40 (EVA8) (I talked to the students about the achievement of STEM activities after the evaluation was conducted), it showed otherwise. For this item, rural teachers show significantly more prepared (measure = 0.03 logits) compared to urban teachers (measure = 0.75 logits). This is surprising since the discussions on the achievement of STEM activities are important regardless where the school location are (Curriculum Development Division, 2016b). There is a possibility that time constraint is a factor in the lack of teacher-student communication in STEM implementation as reported in the previous study (Nur Farhana Ramli & Othman Talib, 2017). Stakeholders need to take action to find ways to improve effective communication between students and teachers as it important to identify the strengths and weaknesses of their STEM tasks. It is suggested to use mediums such as Virtual Learning Environment (VLE) as a medium for student and teacher discussions since it is proven effective to strengthen communication and discussion between teachers and students (Ministry of Education, 2017). Conclusion Teacher preparedness are an important factor in determining the success of STEM implementation in the curriculum. Therefore, it is important to have a valid and reliable instrument to measure STEM teachers' preparedness. This study reports the unidimensionality, item fit and differential item function of the new developed instrument, STEMTIP. The data shows the proof of fit data model and unidimensionality. However, there are two items that show the differences of teacher preparedness in urban and rural area. Teachers in rural areas are reportedly unprepared in providing questions based on different levels of thinking than urban teachers. Conversely, they are reported to be more willing to talk to students about STEM achievements than urban teachers. These findings are especially important for stakeholders who intend to bridge the educational gap between urban and rural education. Corresponding Author Nur Farhana Ramli Faculty of Educational Studies Universiti Putra Malaysia 43400, Serdang, Selangor, Malaysia Email: [email protected]
International Journal of Academic Research in Progressive Education and
Development
Vol. 7 , No. 4, 2018, E-ISSN: 2226-6348 © 2018 HRMARS
220
References Academy of Sciences Malaysia. (2015). Science Outlook 2015: Action Towards Vision. (Academy
of Sciences Malaysia, Ed.). Ministry of Sciene, Technology And Innovation. Nordin, A. & Ling, L. H. (2011). Hubungan Sikap Terhadap Mata Pelajaran Sains Dengan
Penguasaan Konsep Asas Sains Pelajar Tingkatan Dua. Journal of Science & Mathematics Educational, 2(June), 89–101. https://doi.org/10.1017/CBO9781107415324.004
Belland, B. R. (2014). Scaffolding : Definition , current debates and future directions. In J. M. Spector, M. D. Merrill, J. Elen, & M. J. Bisho (Eds.), Handbook of Research on Educational Communications and Technology (4th ed., pp. 505–518). New York: Springer.
Belland, B. R. (2017). Instructional scaffolding in STEM education : strategies and efficacy evidence. Utah: Springer. https://doi.org/10.1007/978-3-319-02565-0
Bond, T. G., & Fox, C. M. (2015). Applying the Rasch model : fundamental measurement in the human sciences (3rd ed., Vol. 1). New York: Routledge. https://doi.org/10.1207/S15327574IJT013&4_10
Crippen, K. J., & Archambault, L. (2012). Scaffolded inquiry-based instruction with technology: a signature pedagogy for STEM education. Computers in the Schools: Interdisciplinary Journal of Practice, Theory, and Applied Research, 29(1–2), 157–173. https://doi.org/10.1080/07380569.2012.658733
Curriculum Development Division. (2016). Buku Penerangan Kurikulum Standard Sekolah Menengah (KSSM). Putrajaya: Ministry of Education.
Dani, D. E., Hartman, S. L., & Helfrich, S. R. (2017). Learning to Teach Science: Elementary Teacher Candidates Facilitate Informal STEM Events. The New Educator, 00(00), 1–18. https://doi.org/10.1080/1547688X.2017.1356413
Fayer, S., Lacey, A., & Watson, A. (2017). STEM Occupations : Past , Present , And Future. Hazura Mohamed, Hairulliza Mohamad Judi, Siti Fadzilah M. Noor, & Zawiyah M. Yusiof. (2012).
Jurang digital dan pendidikan di luar bandar : Tahap literasi teknologi maklumat dan komunikasi pelajar. Asia-Pacific Journal of Information Technology and Multimedia, 1(2), 1–13. Retrieved from http://www.ftsm.ukm.my/apjitm
Henry, G. T., Thompson, C. L., Bastian, K. C., Kershaw, D. C., Purtell, K. M., & Zulli, R. A. (2011). Does Teacher Preparation Affect Student Achievement? Education Finance and Policy. Retrieved from http://0-search.ebscohost.com.library.uark.edu/login.aspx?direct=true&db=a9h&AN=27639277&site=ehost-live&scope=site
Linacre, J. M. (2012). A user’s guide to WINSTEPS: Rasch Model Computer Programs. Chicago: MESA Press. https://doi.org/ISBN 0-941938-03-4
Ministry of Education. (2017). Malaysia Education Blueprint 2013-2025 : 2016 Annual Report. Ministry of Education Malaysia. (2013). Malaysia Education Blueprint 2013 - 2025 : Preschool to
post-secondary education. Ministry of Education Malaysia. Putrajaya. https://doi.org/10.1016/j.tate.2010.08.007
Price, J. (2010). The effect of instructor race and gender on student persistence in STEM fields. Economics of Education Review, 29(6), 901–910. https://doi.org/10.1016/j.econedurev.2010.07.009
Rehmat, A. P., & Bailey, J. M. (2014). Technology Integration in a Science Classroom: Preservice
International Journal of Academic Research in Progressive Education and
Development
Vol. 7 , No. 4, 2018, E-ISSN: 2226-6348 © 2018 HRMARS
221
Teachers’ Perceptions. Journal of Science Education and Technology, 23(6), 744–755. https://doi.org/10.1007/s10956-014-9507-7
Slavit, D., Nelson, T. H., & Lesseig, K. (2016). The Teachers’ Role in Developing, Opening, and Nurturing an Inclusive STEM-focused School. International Journal of STEM Education, 3(1), 7. https://doi.org/10.1186/s40594-016-0040-5
Van Tuijl, C., & Van der Molen, J. H. W. (2016). Study choice and career development in STEM fields: an overview and integration of the research. International Journal of Technology and Design Education, 26(2), 159–183. https://doi.org/10.1007/s10798-015-9308-1


![Running Head: DIFFERENTIAL ITEM FUNCTIONING OF THE SRQ …timo.gnambs.at/sites/default/files/gnambs+hanfstingl2013.pdf · DIF OF THE SRQ-A[G] 3 A Differential Item Functioning Analysis](https://img.pdfslide.us/doc/110x75/5b89a81a7f8b9a655f8cae19/running-head-differential-item-functioning-of-the-srq-timo-hanfstingl2013pdf.jpg)