Embed Size (px)
Citation preview

This is a repository copy of Rasch analysis of the Chedoke–McMaster Attitudes towards Children with Handicaps scale.
White Rose Research Online URL for this paper:http://eprints.whiterose.ac.uk/96138/
Version: Accepted Version
Article:
Armstrong, M, Morris, C, Tarrant, M et al. (2 more authors) (2017) Rasch analysis of the Chedoke–McMaster Attitudes towards Children with Handicaps scale. Disability and Rehabilitation, 39 (3). pp. 281-290. ISSN 0963-8288
https://doi.org/10.3109/09638288.2016.1140833
© 2016 Informa UK Limited, trading as Taylor & Francis Group. This is an Accepted Manuscript of an article published by Taylor & Francis in Disability and Rehabilitation on 16February 2016, available online: https://doi.org/10.3109/09638288.2016.1140833
[email protected]://eprints.whiterose.ac.uk/
Reuse
Unless indicated otherwise, fulltext items are protected by copyright with all rights reserved. The copyright exception in section 29 of the Copyright, Designs and Patents Act 1988 allows the making of a single copy solely for the purpose of non-commercial research or private study within the limits of fair dealing. The publisher or other rights-holder may allow further reproduction and re-use of this version - refer to the White Rose Research Online record for this item. Where records identify the publisher as the copyright holder, users can verify any specific terms of use on the publisher’s website.
Takedown
If you consider content in White Rose Research Online to be in breach of UK law, please notify us by emailing [email protected] including the URL of the record and the reason for the withdrawal request.
Rasch analysis of the CATCH
1
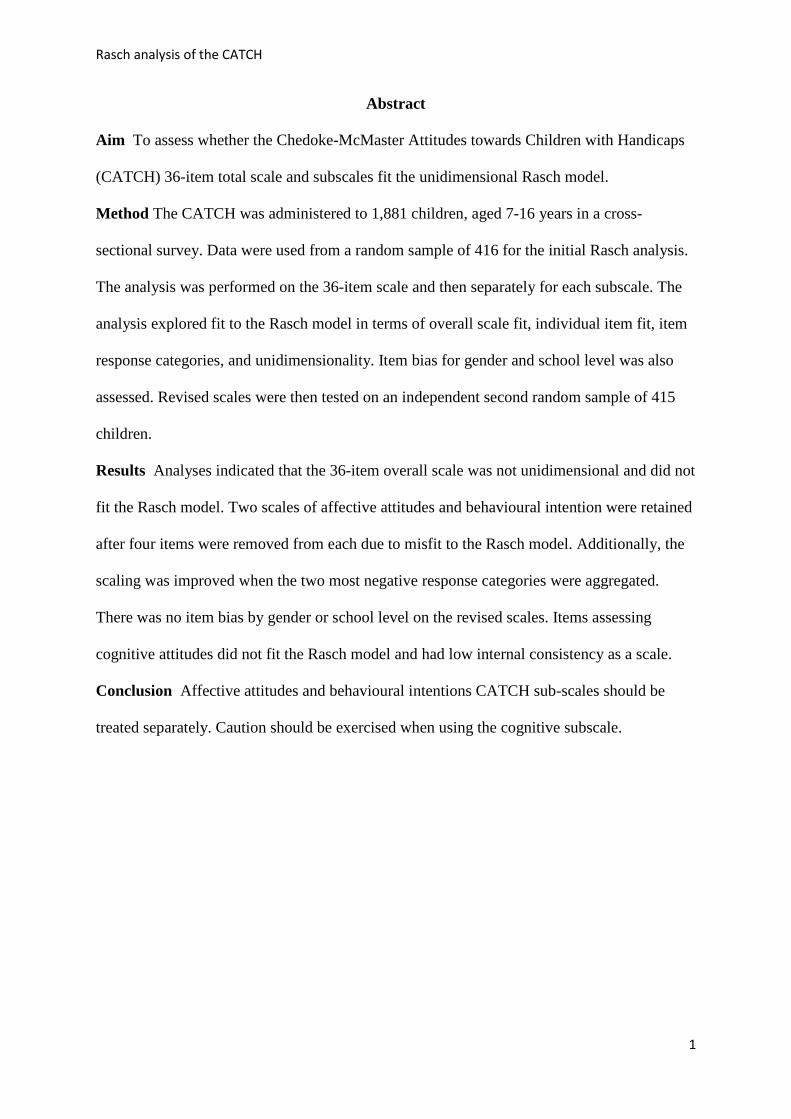
Abstract
Aim To assess whether the Chedoke-McMaster Attitudes towards Children with Handicaps
(CATCH) 36-item total scale and subscales fit the unidimensional Rasch model.
Method The CATCH was administered to 1,881 children, aged 7-16 years in a cross-
sectional survey. Data were used from a random sample of 416 for the initial Rasch analysis.
The analysis was performed on the 36-item scale and then separately for each subscale. The
analysis explored fit to the Rasch model in terms of overall scale fit, individual item fit, item
response categories, and unidimensionality. Item bias for gender and school level was also
assessed. Revised scales were then tested on an independent second random sample of 415
children.
Results Analyses indicated that the 36-item overall scale was not unidimensional and did not
fit the Rasch model. Two scales of affective attitudes and behavioural intention were retained
after four items were removed from each due to misfit to the Rasch model. Additionally, the
scaling was improved when the two most negative response categories were aggregated.
There was no item bias by gender or school level on the revised scales. Items assessing
cognitive attitudes did not fit the Rasch model and had low internal consistency as a scale.
Conclusion Affective attitudes and behavioural intentions CATCH sub-scales should be
treated separately. Caution should be exercised when using the cognitive subscale.
Rasch analysis of the CATCH
2
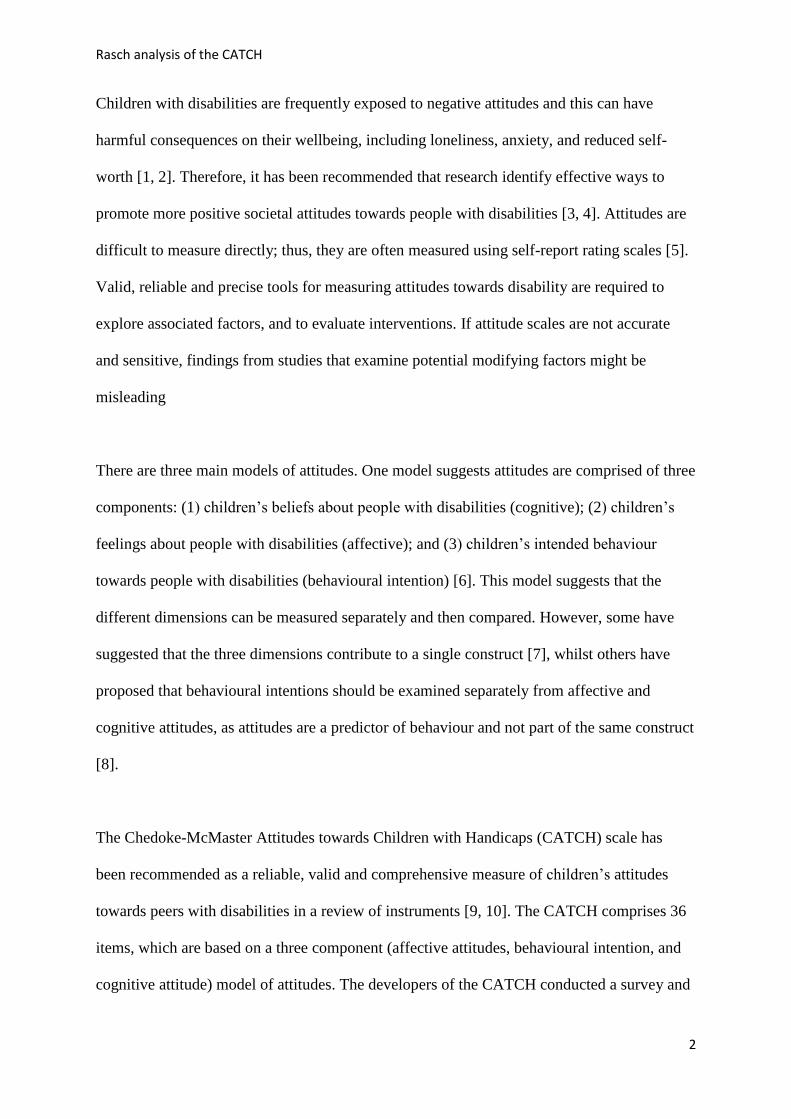
Children with disabilities are frequently exposed to negative attitudes and this can have
harmful consequences on their wellbeing, including loneliness, anxiety, and reduced self-
worth [1, 2]. Therefore, it has been recommended that research identify effective ways to
promote more positive societal attitudes towards people with disabilities [3, 4]. Attitudes are
difficult to measure directly; thus, they are often measured using self-report rating scales [5].
Valid, reliable and precise tools for measuring attitudes towards disability are required to
explore associated factors, and to evaluate interventions. If attitude scales are not accurate
and sensitive, findings from studies that examine potential modifying factors might be
misleading
There are three main models of attitudes. One model suggests attitudes are comprised of three
components: (1) children’s beliefs about people with disabilities (cognitive); (2) children’s
feelings about people with disabilities (affective); and (3) children’s intended behaviour
towards people with disabilities (behavioural intention) [6]. This model suggests that the
different dimensions can be measured separately and then compared. However, some have
suggested that the three dimensions contribute to a single construct [7], whilst others have
proposed that behavioural intentions should be examined separately from affective and
cognitive attitudes, as attitudes are a predictor of behaviour and not part of the same construct
[8].
The Chedoke-McMaster Attitudes towards Children with Handicaps (CATCH) scale has
been recommended as a reliable, valid and comprehensive measure of children’s attitudes
towards peers with disabilities in a review of instruments [9, 10]. The CATCH comprises 36
items, which are based on a three component (affective attitudes, behavioural intention, and
cognitive attitude) model of attitudes. The developers of the CATCH conducted a survey and

Rasch analysis of the CATCH
3
used exploratory factor analysis to construct the scales [9]. They reported that the 36 item
total scale and the three subscales had good test-retest reliability. The internal consistency, as
measured by Cronbach’s alpha, was 0.91 for affective attitudes, 0.74 for behavioural
intention, 0.65 for cognitive attitude, and 0.90 for the full CATCH scale. The cognitive scale
showed lower internal reliability compared to the affective and behavioural subscales, and
slightly below the recommended standard criterion of 0.7 [11].
The developers of the CATCH were undecided as to whether the total score or the individual
subscale scores should be used [9]. Therefore, due to the ambiguity, research since the
development of the CATCH has reported both the total score [12] and the subscales
separately [4]. The issue of dimensionality of the CATCH scale has been explored in other
studies. One study suggested that the behavioural and affective components comprise one
scale and the cognitive another [13]. A recent Belgian study conducted a confirmatory factor
analysis to test the structural validity of the CATCH and failed to detect the original three
subscales [14]. Using exploratory factor analysis on their data, these authors proposed a 7
item scale comprising of five affective items and two behavioural intention items. Overall, it
appears there is some uncertainty whether the CATCH is unidimensional or comprised of
separate subscales.
Most researchers using the CATCH have favoured total scores [12, 15, 16], although subscale
scores have also been reported [4]. When the subscales were explored separately, it was
found that children reported attitudes that are more negative on the cognitive scale. Based on
such findings, it could be concluded that interventions for changing attitudes towards
disability should target children’s beliefs about people with disabilities rather than their
Rasch analysis of the CATCH
4
feelings and intended behaviours. Therefore, it is important to examine rigorously whether
the subscales should be measured separately.
The CATCH has been translated for use in different languages (e.g., Belgian and French) [4,
17]. Translation and cultural variation can affect how people respond to items, hence the
measurement properties of adapted instruments cannot be assumed and require re-evaluation
[18]. We used the CATCH in a school-based study evaluating factors associated with
children’s attitudes towards disability in England; the questionnaire was adapted for use with
a British sample.
Rasch analysis is a method for checking the appropriateness of summing all of the CATCH
items to create a total score by fitting data to the unidimensional Rasch measurement model.
Rasch analysis offers a unified framework that will assess the unidimensionality of the
CATCH. The Rasch model also assumes a hierarchy of items by difficulty, and this ordering
of items will discriminate people with different levels of the construct being assessed [19,
20]. Items are assessed to confirm whether they act in the expected manner.
Rasch analysis offers a means to test additional factors that can affect the fit of data to the
model: (1) response category function and ordering (whether item response categories are
working as intended); (2) response dependence (whether the response to one item has a direct
implication to the response to any other item); and (3) differential item functioning (DIF) (a
form of item bias that assesses whether participant subgroups respond differently to an item,
despite being at the same level of the underlying trait). These factors are important in
creating accurate attitude measurement. For example, if the response categories are not
Rasch analysis of the CATCH
5
working as intended, it suggests that the assumed underlying hierarchy of the response
categories is not being realised.
Furthermore, past research has often found that females hold more positive attitudes towards
people with disabilities and a trend for age differences has not yet been found [4]. Until it is
certain that there is no DIF, researchers cannot be completely sure whether this is due to an
actual difference in attitudes, rather than certain groups of people responding differently to
the items. Overall, the Rasch analysis can optimise internal reliability, precision and
sensitivity of scales, and provide a more efficient questionnaire with fewer items and, to our
knowledge, this has not been explored before with the CATCH.
The aims of this paper were to appraise whether the CATCH total and/or subscales were
unidimensional. If no higher order construct was apparent for the overall scale, then the
individual subscales should be considered separately. Within the context of the total scale, or
each individual subscale, an additional aim was to test if individual items fit the Rasch model,
whether response categories were discriminative, and whether there was any item
dependency or DIF for gender and school year. If there was misfit to the Rasch model,
revisions of the scales were performed and retested.
METHOD
Procedure
Ethical approval
The Peninsula College of Medicine and Dentistry Research Ethics Committee approved the
procedures for this study on 28th February 2012 (reference 11/12/131).

Rasch analysis of the CATCH
6
Stakeholder involvement
The Peninsula Cerebra Research Unit (PenCRU) involves families of children with
disabilities as partners in research. Parents of children with disabilities had advocated for
research aimed at improving children’s attitudes towards disability and were involved at
various stages in the project. Before the main study began, a group of ten children aged 8-15
years were involved in reviewing the wording of the CATCH and other survey procedures.
They were split into two groups of primary and secondary school children, as it was predicted
that different age groups may have different concerns. Each group was led by a researcher to
identify words or phrases that were difficult to understand. All instructions and items were
read aloud and the children were asked to discuss what they thought the item meant and to
give some examples. If any items were difficult to understand or disliked, the researcher
suggested alternative wording whilst keeping the same meaning. Changes were discussed and
agreed within the age-groups, and again at the end when the two groups were brought back
together. Additionally, a head teacher, who is also a parent of a child with a disability,
advised on strategies for recruiting schools and checked the final wording of the survey to
ensure the language was understandable
Recruitment
Mainstream schools across South West England (N=483) were invited to take part in a study
of children’s attitudes towards disability via a generic email circulation list. Of these, 20
schools agreed to participate and 1,946 children were invited to take in the survey (Figure 1).
Parent/carer consent was solicited on an opt-out basis two weeks prior to the study; children’s
consent was sought on the day of the study. After any parental opt-outs (N=19) or children
declining to take part (N=46), 1,881 participants completed the survey.
Rasch analysis of the CATCH
7
Insert Figure 1 about here
Survey content and administration
Although only the CATCH is presented here for the Rasch analysis, the survey included
several measures including: the 36 item CATCH, a six item measure of contact with people
with disabilities [21], three item measures of empathy [22] and anxiety [21] towards people
with disabilities and a two item measure of perceived group similarity [23]. All scales were
adapted from previous research to use in the disability context apart from the CATCH, which
was developed specifically for this context. Additionally, we added a question asking
participants which disabilities they considered when completing the survey. Participants were
also asked to report their gender, school year, and whether they were disabled or not. The
survey was administered during a scheduled class either online or using a paper-based
version. Each question was read aloud and participants were asked to answer questions on
their own without talking. Participants were asked to think about people their own age when
completing the survey.
Measures
Chedoke-McMaster Attitudes towards Children with Handicaps scale
The CATCH is comprised of 36 items. Each subscale (affective, behavioural intention,
cognitive) has 12 items, and each item has five response options (strongly disagree, disagree,
can’t decide, agree, and strongly agree). Negatively worded items are reverse-scored for
analysis. Total and domain scores are calculated by summing items, with higher scores
representing more positive construct scores, for example, stronger intentions to interact.
Because the CATCH was originally designed in 1986 and in a North American context, some
of the phrases are not commonly used anymore (i.e., handicapped) and, therefore, the

Rasch analysis of the CATCH
8
wording was adapted when working with an involvement group of young people
(Supplementary file 1).
Originally, the CATCH had 18 positive and 18 negative items; however, due to several of the
items being adapted to be make more sense for the involvement group and target population
there are 19 positively-worded and 17 negatively-worded items. We changed the word
‘child/children’ to ‘person/people’ as the teenagers did not like being classified as a ‘child’;
however, we specified in the survey that participants should consider people their own age.
The original CATCH questions use the term ‘handicapped child’. This was changed to
‘disabled person’ consistent with current UK parlance. Other minor cultural changes were
‘special friend’ to ‘best friend’, and ‘recess’ was adapted to ‘break time’ The direction of the
items was altered on items from the affective and behavioural scale. The phrasing was altered
for items on all three subscales.
Participants and sample selection for Rasch analysis
For the purpose of having an interpretable test of fit within the Rasch analysis, the sample
size was reduced. The Rasch model relies on statistical significance testing and large sample
sizes can create misleading errors in the interpretation of test of fit (i.e., incorrectly rejecting
the null hypothesis) [24]. There is no rule for what the largest interpretable sample size
should be in Rasch analyses, but it is suggested a sample size of 250 will allow 99%
confidence in the stability of the Rasch analysis calibrations, and a sample of around 450 will
allow ‘robust’ confidence [25]. Therefore, two smaller randomly constructed samples were
used for the Rasch analysis. The samples were generated in Excel 2010 using the RAND
function [26]. The whole sample of 1,881 was randomised and 50% percent of the sample
were used for Rasch analysis (two groups of N=470). After sorting and based on children’s
Rasch analysis of the CATCH
9
self-reports of their own disability, if any, children with disabilities (N=93) and with missing
data on more than 5% of the CATCH [27] (N=16) were removed from the analysis.
The first sample (n=416) included 200 males and 211 females (5 missing values for gender)
and 350 from primary schools and 61 from secondary schools (5 missing data for school
type). The second sample (n=415) contained 200 males and 211 females (4 missing data for
gender) 318 were from primary schools and 92 were from secondary schools (5 missing data
for school type). Although fewer secondary schools took part in the survey, there were still
sufficient participants to conduct DIF analyses. Overall, participants’ ages ranged from 7 to
16 years, with a mean of 10.2 (SD=1.8), spanning school years 3-11.
Statistical analysis
Analyses were performed using Rasch Unidimensional Measurement Model (RUMM2030)
software [28]. Initial analyses were conducted on the first sample, and the second sample was
used to confirm any scale amendments.
The developers of the CATCH confirmed construct validity by testing whether a group
containing females and people that had a disabled friend, displayed significantly more
positive CATCH scores when compared to a group containing males and people without a
disabled friend [9]. The same analysis, using independent sample t-tests, was conducted on
the revised scales to confirm construct validity.
Dimensionality
The 36 item CATCH and individual subscales were assessed for unidimensionality using
standardised procedures [29, 30], where a series of t-tests determines whether individual
Rasch analysis of the CATCH
10
person estimates are equivalent across different subsets of items. Evidence of
unidimensionality is apparent if less than 5% (with binomial confidence intervals applied) of
participants have significantly different (p<0.05) estimates on the subsets.
Overall fit of the CATCH to the Rasch model
The chi-squared interaction statistics provide an indication of overall item and sample fit to
the model, with a non-significant chi-squared statistic indicating adequate model fit.
Tests of individual item and person fit
All individual items and persons were assessed for fit to the Rasch model, where differences
between observed and expected responses indicate a source of misfit. Individual fit residual
statistics are transformed to a z score where a mean of 0 and a SD of 1 would suggest perfect
fit to the model and individual item/person residuals that are above 2.5 or below -2.5 are
considered to indicate inadequate fit [31]. All individual items were assessed in terms of their
fit residual values and chi-square fit statistics.
Response category functioning
Category probability curves display response category functioning for each item. If the
categories work as intended, each response option should represent an increase in positive
attitudes. Items with disordered score thresholds were modified by collapsing adjacent
response categories so that each threshold represented a gradually increasing level of positive
attitude towards disability.
Local dependency
Rasch analysis of the CATCH
11
Residual correlations were inspected to ensure that there was no item dependency. We used a
residual correlation value >0.2 to indicate response dependency [32], and any apparent
response dependencies were also assessed in terms of their item content to ensure conceptual
sense.
Internal consistency
The person separation index (PSI) provides an estimate of the internal consistency of the
scales, where the value should be above 0.7 to be considered acceptable [30].
Differential item functioning (DIF)
Differential item functioning examines potential item bias between participants with different
characteristics (for example, whether participants respond systematically differently to items
despite having the same level of the underlying attitude). DIF was explored for gender and
school level (i.e., primary and secondary school). Bonferroni-adjusted statistical significance
values of p<0.05 were taken to indicate potential DIF.
Raw score to interval-level measurement
Once the CATCH had been revised and the data fit the Rasch model, raw scores of the
CATCH were transformed into interval scores using the complete dataset of children without
disabilities (N=1,533). The raw score to interval level logit score transformation table is
available in RUMM2030.
RESULTS
Unidimensionality of the 36 item CATCH

Rasch analysis of the CATCH
12
Initial analysis of the complete set of 36 items revealed considerable misfit to the Rasch
model (2 (324) = 1,114, p<0.001) (Table 1, analysis 1). Analysis of the total CATCH score
indicated a high degree of multidimensionality within the item set (23.6% of t-tests were
significant). Furthermore, the principal component loadings of the item residuals revealed
that all of the items belonging to the cognitive attitudes scale grouped together, whilst the
affective and behavioural items grouped together. This analysis suggested that the subscales
should be treated separately.
Response categories
Disordered response category function was apparent for all items, evidenced by underuse of
the ‘agree’ response option (‘disagree’ option on positively worded items); this was indicated
by the category probability curves. Therefore, a generic rescore was implemented in which
the original response categories of ‘strongly agree’ and ‘agree’ for negatively worded items,
and ‘strongly disagree’ and ‘disagree’ for positively worded items, were assigned a score of
0. As a result, each scale item was now scored with values of 0-3.
Affective attitudes subscale
Dimensionality and fit to the Rasch model
The 12-item affective scale was initially found to be multidimensional (11.6% of t-tests were
significant) and had poor fit to the model (2 (84) = 336.3, p<0.001) (see Table 1, analysis 2).
Person fit was acceptable, as indicated by the mean and SD of the residuals. Following the
iterative removal of four misfitting items, as indicated by the high (>2.5) individual item fit
residuals, (‘I feel upset when I see disabled people’; ‘I feel sorry for disabled people’; ‘I
would prefer to have a friend who was not disabled’; and ‘I would like having a disabled

Rasch analysis of the CATCH
13
person live next door to me’), the fit and dimensionality statistics were acceptable, as
indicated by the chi-squared test and the unidimensionality t-tests (Table 1, analysis 3).
Item dependency
There was no evidence of dependency across the remaining eight items. All residual
correlations were <0.2.
Differential item functioning
DIF analysis indicated there was no item bias between gender or school levels for any of the
remaining eight items (all p values >0.05)
Validation test
The resulting eight items (Supplementary file 2) were then tested in the second sample in
order to test the validity of the revised scale. The validation sample indicated that the items
were acceptable as a scale for affective attitudes (Table 1, analysis 4).
Internal consistency
The scale had good internal consistency (PSI=0.80 – 0.81).
Behavioural intention subscale
Dimensionality and fit to the model
The 12-item behavioural intention subscale was also found to be multidimensional (7.7% of
t-tests were significant), with poor fit to the Rasch model (2 (84) = 201.7, p<0.001) (Table 1,
analysis 5). However, person fit was acceptable. The iterative removal of four misfitting
items due to high (>2.5) individual item fit residuals: ‘I wouldn't know what to say to a

Rasch analysis of the CATCH
14
disabled person’; ‘I try not to look at disabled people’; ‘I would sit next to a disabled person’;
and ‘I would invite a disabled person to my birthday party’, yielded acceptable fit and
dimensionality statistics (Table 1, analysis 6).
Item dependency
There was no evidence of dependency across the remaining eight items. All residual
correlations were <0.2.
Differential item functioning
DIF analysis indicated there was no item bias between gender or school levels for any of the
eight remaining item (all p values >0.05)
Validation test
The remaining eight items (Supplementary file 3) were tested in the validation sample and
confirmed that the items were acceptable as a scale for behavioural intention (Table 1,
analysis 7).
Internal consistency
The scale had good internal consistency (PSI=0.80 – 0.83).
Cognitive attitudes subscale
Dimensionality and fit to the model
The 12-item set of cognitive attitudes was also found to be multidimensional (10.5% of t-tests
were significant) and had poor fit to the Rasch model (2 (108) = 182, p<0.001) (Table 1,
analysis 8). The residuals of the person fit were acceptable. Despite removing poorly fitting

Rasch analysis of the CATCH
15
items in an iterative way, no item set appeared to satisfy the requirements of the Rasch
model. Although an improvement in model fit and dimensionality was found following the
removal of two items (‘Disabled people make friends easily’ and ‘Disabled people are often
sad’: Table 1, analysis 9), disordered response category thresholds remained.
Item dependency
There was no evidence of dependency across the ten remaining items. All residual
correlations were <0.2.
Differential item functioning
DIF analysis indicated there was no item bias between gender for any of the remaining ten
items (all p values >0.05). However, CATCH items 3, 5, 11, 14, 17, and 27 reported
significant variance between primary and secondary schools.
Internal consistency
The removal of the two CATCH items resulted in an already low PSI value (0.68) dropping
further below an acceptable level (0.66), indicating poor internal consistency. Overall, these
items appeared not to form an internally valid or consistent scale for measuring cognitive
attitude within this sample.
Raw score to interval-level measurement
For future use in research with the two revised eight-item scales of affective attitudes and
behavioural intention, the scores were transformed from ordinal raw scores to interval level
equivalent scores, as transformed from the logit scores available within RUMM2030
(Supplementary file 4).

Rasch analysis of the CATCH
16
Insert Table 1 about here
Construct validity of the revised scales
The independent sample t-test revealed that there was a significant difference between males’
and females’ scores on the affective attitudes; t(1528)=4.47, p<0.001, and behavioural
intentions; t(1528)=7.9, p<0.001. The same finding was found between those who reported
having a disabled friend and those who did not for affective attitudes; t(1531)=11.8, p<0.001,
and behavioural intentions; t(1531) =11.3, p<0.001.
DISCUSSION
The application of the Rasch measurement model indicated that the overall CATCH 36 item
scale was not unidimensional. Analyses of the subscales indicated that affective attitude and
behavioural intention were unidimensional and provided good fit to the Rasch model when
two response categories were aggregated and four misfitting items were removed from both
subscales. These two scales both showed good internal consistency (PSI >0.80). A
satisfactory cognitive attitude scale could not be created using our version of the CATCH due
to low internal consistency and numerous additional indicators of poor fit to the Rasch model.
The CATCH has enabled researchers to measure children’s attitudes towards disability, but
measurement properties should be monitored and evaluated, particularly when translated.
Rasch analysis of our version to the CATCH modified for the UK at the present time led to
some refinements included collapsing the two most negative response options to take account
of the fact that few respondents were discriminating between the negative response options.
As there were still a number of items contributing to poor fit of the data to the Rasch model,

Rasch analysis of the CATCH
17
the contribution of each item to the scale score was appraised by removing the most
misfitting item in an iterative manner. Analysis of the affective attitude and behavioural
intention scales indicated four items that needed to be removed from each scale.
Previous research has indicated a trend for younger children and females to make attitude
ratings that are more positive than older children and males [4, 33]. The revised affective and
behavioural attitude scale items appeared to be free from DIF between gender and school
(primary and secondary) levels. As such, any differences in observed scores on the revised
CATCH scales between gender or school level could reasonably be presumed to be due to an
actual difference in attitudes, rather than to any inherent item bias.
The original developers of the CATCH themselves questioned whether the scale should be
treated as unidimensional or as separate subscales [9]. Despite widespread use, relatively few
studies have examined this issue. Findings from our study suggest that the 36-item CATCH
scale should not be treated as unidimensional and rather the subscales should be reported and
interpreted independently. This finding is consistent with the commonly used three
component model of attitudes that proposes attitudes have an affective, cognitive and
behavioural component; however, they can be measured separately and, therefore, compared
[6].
Our analysis also suggests the cognitive items may not perform as an internally consistent
scale. This finding is consistent with previous research that has also found that the internal
consistency of the cognitive attitude subscale is lower that the affective attitude and
behavioural intention subscales [9, 14]. However, the cognitive aspect is important to
measure, as it is included as one aspect of attitudes in most theories [6-8]. Cognitive attitudes
Rasch analysis of the CATCH
18
have also been found to perform differently in the context of children’s attitudes towards
disability compared to affective attitudes and behavioural intentions, with children reporting
more negative cognitive attitudes [4]. Therefore, we suggest, until a more robust measure is
developed, researchers should be cautious when using the cognitive attitude scale.
Limitations to our study include the modifications made to items on the original CATCH
scale. The items were adapted for the UK based on an involvement group of young people
aged 8-16 who advised on the items that were difficult to understand or ambiguous. Then we
discussed alternative words or phrasing to help make the item more understandable. The
change from ‘handicapped’ to ‘disabled’ reflects cultural changes in the 30 years since the
questionnaire was developed. Other changes reflect the broader age group and our inclusion
of teenagers. The original developer of the CATCH has reviewed the modifications and made
three points: (1) changing ‘handicapped’ to ‘disabled’ was acceptable; (2) modifying ‘child’
to ‘person’ may cause participants to consider people beyond their peers; and (3) there was an
even split of negative to positive items originally and now there is a slight imbalance of this.
Other limitations include a low participation response from schools. This may indicate a
selection bias from head teachers only participating if they had a particular interest in
promoting inclusive education. It is also likely that not all the head teachers received the
invitation personally to take part in the study, as the emails were sent to generic email
addresses. Schools are also under various obligations and competing priorities, and the timing
of this research project might not have fitted with their other activities. Nevertheless, the
testing of measurement properties is more dependent on variability in the responses than the
representativeness of the sample, and the calibrations of the Rasch analysis are independent
from the distribution of the sample. The sample was recruited from schools in an area of
Rasch analysis of the CATCH
19
England with low ethnic variation. According to the 2011 census, South West England has
the highest proportion of people declaring themselves ‘White British’ compared to the rest of
England and Wales [34]. Cultural variation in surveys of children’s attitudes towards
disability is an area that has been largely neglected, and should be evaluated in future
research. Finally, items were removed from the scale if they did not statistically fit the Rasch
model; however, it is not known whether the items removed added to the theoretical construct
of the individual scales (i.e., affective attitudes and behavioural intentions). Nonetheless, the
two scales retained eight items each to capture and measure the constructs accurately.
The proposed revised CATCH scales from this study for affective attitude and behavioural
intention towards disability appear to have a high level of precision; however, our analyses
do not confirm whether the scales will detect meaningful changes in attitudes. Therefore,
longitudinal studies should investigate whether the revised CATCH scales do detect attitude
change, magnitude of measurement error, and the smallest increment of change likely to be
meaningful. These measurement properties are required to determine whether interventions
are effective at improving attitudes towards disability.
Notwithstanding these limitations, this study has explored the psychometrics of the CATCH
in the context of South West England for children aged 7 to 16 and suggested two revised
scales derived from the CATCH. The two eight item scales are internally consistent and both
can be confidently summed to create a total score of attitudes. Furthermore, the raw scores
from these revised scales can also be transformed to an interval level equivalent score.
Affective attitudes and behavioural intentions can now be compared to determine whether
certain factors are associated with both components or just one and interventions should be
tailored to address children’s feelings about people with disabilities, as well as how they
Rasch analysis of the CATCH
20
intend to behave. Additionally, the response scaling have been altered so that each increase
on the response scale represents an increase in positive attitudes and the scales can be
accurately used to compare groups of people based on their age or gender. Improving the
accuracy and sensitivity of attitude measurement will advance the strength of conclusions that
can be made, as well as effectively locate factors associated with those attitudes.
CONCLUSION
Using Rasch analysis, a number of potentially useful modifications to improve the scaling of
the original CATCH are highlighted. The 36-item CATCH was not unidimensional and,
therefore, the subscales should be treated separately. After removing four items each, the
affective attitude and behavioural intention scales were unidimensional and fit the Rasch
model; however, despite attempted amendments, the cognitive attitude scale items did not
satisfy the requirements of the Rasch model. Our proposed revised scales for measuring
affective attitude and behavioural intention may provide greater precision and, therefore,
merit further evaluation.

Rasch analysis of the CATCH
21
Acknowledgements
We thank the Family Faculty at PenCRU, and the staff and pupils at the schools who
participated in this project.

Rasch analysis of the CATCH
22
Declaration of interest
We acknowledge funding from the National Institute for Health Research (NIHR)
Collaboration for Leadership in Applied Health Research and Care of the South West
Peninsula (PenCLAHRC), and the charity Cerebra. The views and opinions expressed in this
paper are those of the authors and not necessarily those of the NHS, the NIHR, the
Department of Health, or Cerebra.
Rasch analysis of the CATCH
23
References
1. Sentenac M, Arnaud C, Gavin A, Molcho M, Gabhainn SN, Godeau E. Peer victimization
among school-aged children with chronic conditions. Epidemiologic Reviews. 2012;34(1):120-8.
2. Graham S, Juvonen J. Self-blame and peer victimization in middle school: an attributional
analysis. Developmental psychology. 1998;34(3):587-99.
3. World Health Organization WHO. World report on disability: World Health Organization;
2011.
4. Vignes C, Godeau E, Sentenac M, Coley N, Navarro F, Grandjean H, et al. Determinants of
Students' Attitudes towards Peers with Disabilities. Developmental Medicine & Child Neurology.
2009;51(6):473-9.
5. MacMillan M, Tarrant M, Abraham C, Morris C. The association between children's contact
with people with disabilities and their attitudes towards disability: a systematic review.
Developmental Medicine & Child Neurology. 2013;56(6):529 - 46.
6. Triandis HC. Attitude and attitude change: Wiley New York; 1971.
7. Albarracín D, Zanna MP, Johnson BT, Kumkale GT. Attitudes: Introduction and Scope. 2005.
8. Ajzen I. Attitudes, personality, and behavior: McGraw-Hill International; 2005.
9. Rosenbaum PL, Armstrong RW, King SM. Children's attitudes toward disabled peers: a self-
report measure. Journal of Pediatric Psychology. 1986;11(4):517-30.
10. Vignes C, Coley N, Grandjean H, Godeau E, Arnaud C. Measuring Children's Attitudes
towards Peers with Disabilities: A Review of Instruments. Developmental Medicine & Child
Neurology. 2008;50(3):182-9.
11. Nunnally J. Psychometric methods. McGraw-Hill, New York, NY. 1978.
12. Tavares W. An evaluation of the Kids are Kids disability awareness program: increasing social
inclusion among children with physical disabilities. Journal of Social Work in Disability &
Rehabilitation. 2011;10(1):25-35.
13. de Boer A, Timmerman M, Pijl SJ, Minnaert A. The psychometric evaluation of a
questionnaire to measure attitudes towards inclusive education. European journal of psychology of
education. 2012;27(4):573-89.
14. Bossaert G, Petry K. Factorial validity of the Chedoke-McMaster Attitudes towards Children
with Handicaps Scale (CATCH). Research in Developmental Disabilities. 2013;34(4):1336-45.
15. Holtz KD. The psychosocial implications of Tourette Syndrome in children: Evaluation of an
intervention. Dissertation Abstracts International: Section B: The Sciences and Engineering.
2000;61(4-B):2242.
16. Rosenbaum PL, Armstrong RW, King SM. Improving attitudes toward the disabled: a
randomized controlled trial of direct contact versus Kids-on-the-Block. Journal of Developmental &
Behavioral Pediatrics. 1986;7(5):302-7.
17. Bossaert G, Colpin H, Pijl SJ, Petry K. The attitudes of Belgian adolescents towards peers with
disabilities. Research in Developmental Disabilities. 2011;32(2):504-9.
18. Wild D, Grove A, Martin M, Eremenco S, McElroy S, VWヴテWWどLラヴWミ┣ Aが Wデ ;ノく PヴキミIキヮノWゲ ラa GララS Pヴ;IデキIW aラヴ デエW Tヴ;ミゲノ;デキラミ ;ミS C┌ノデ┌ヴ;ノ AS;ヮデ;デキラミ PヴラIWゲゲ aラヴ P;デキWミデどRWヮラヴデWS O┌デIラマWゲ ふPROぶ Measures: Report of the ISPOR Task Force for Translation and Cultural Adaptation. Value in health.
2005;8(2):94-104.
19. Rasch G. Probabilistic models for some intelligence and achievement tests. Copenhagen,
Denmark: Danish Institute for Educational Research. 1960:1960.
20. Hagquist C, Bruce M, Gustavsson JP. Using the Rasch model in nursing research: An
introduction and illustrative example. International Journal of Nursing Studies. 2009;46(3):380-93.
21. Turner RN, Hewstone M, Voci A. Reducing explicit and implicit outgroup prejudice via direct
and extended contact: The mediating role of self-disclosure and intergroup anxiety. Journal of
Personality and Social psychology. 2007;93(3):369-88.
22. Swart H, Hewstone M, Christ O, Voci A. Affective mediators of intergroup contact: A three-
wave longitudinal study in South Africa. J Personality & Soc Psychol. 2011;101:1221, 2.

Rasch analysis of the CATCH
24
23. Jetten J, Spears R, Manstead AS. Strength of identification and intergroup differentiation:
The influence of group norms. European Journal of Social Psychology. 1997;27(5):603-9.
24. Tennant A, Pallant J, F. The Root Mean Square Error of Approximation (RMSEA) as a
supplementary statistic to determine fit to the Rasch model with large sample sizes. Rasch
Measurement Transactions. 2012;25(4):1348-9.
25. Linacre JM. Sample size and item calibration stability. Rasch measurement transactions.
1994;7(4):328.
26. Carlberg C. Statistical Analysis: Microsoft Excel 2010: Pearson Education; 2011.
27. Norman GR, Streiner DL. Biostatistics: the bare essentials: Bc Decker Hamilton, Ontario;
2008.
28. Andrich D, Lyne A, Sheridan B, Luo G. RUMM2030: A windows interactive program for
analysing item response data according to Rasch Unidimensional Measurement Model. Perth,
Western Australia: RUMM Laboratory Pty Ltd; 2009.
29. Smith Jr EV. Understanding Rasch measurement: Detecting and evaluating the impact of
multidimenstionality using item fit statistics and principal component analysis of residuals. Journal of
applied measurement. 2002.
30. Tennant A, Conaghan PG. The Rasch measurement model in rheumatology: what is it and
why use it? When should it be applied, and what should one look for in a Rasch paper? Arthritis Care
& Research. 2007;57(8):1358-62.
31. Pallant JF, Tennant A. An introduction to the Rasch measurement model: an example using
the Hospital Anxiety and Depression Scale (HADS). British Journal of Clinical Psychology.
2007;46(1):1-18.
32. Hissbach JC, Klusmann D, Hampe W. Dimensionality and predictive validity of the HAM-Nat,
a test of natural sciences for medical school admission. BMC medical education. 2011;11(1):83.
33. McDougall J, DeWit DJ, King G, Miller LT, Killip S. High School-Aged Youths' Attitudes Toward
their Peers with Disabilities: The role of school and student interpersonal factors. International
Journal of Disability, Development and Education. 2004;51(3):287-313.
34. OaaキIW aラヴ N;デキラミ;ノ Sデ;デキゲデキIゲく CWミゲ┌ゲ ェキ┗Wゲ キミゲキェエデゲ キミデラ Iエ;ヴ;IデWヴキゲデキIゲ ラa デエW Sラ┌デエ WWゲデげゲ population. Retrieved on 06.05.2014 from www.ons.gov.uk 2012.