Embed Size (px)
Citation preview

CompanyPresentation
March 2021
Disclaimer
2
Important noticeThis presentation (the “Presentation”) has been prepared by HeliosTowers plc (the “Company”) for information purposes only. As arecipient of this Presentation, you: (i) will be deemed to haveagreed to the obligations and restrictions set out below; and (ii)represent and warrant that you are duly authorised to receive thisPresentation.The distribution of this document in certain jurisdictions may berestricted by law and persons into whose possession thisPresentation comes should inform themselves about, and observe,any such restrictions. References in this notice to the“Presentation” shall be deemed to include any other materials orinformation given or distributed to you by or on behalf of theCompany in connection with this Presentation, whether before,during or after this Presentation and whether given or distributedorally, in writing or otherwise.No investment adviceThis Presentation does not constitute or form part of, and shouldnot be construed as, an offer, invitation or inducement orrecommendation to purchase or subscribe for any securities in theCompany or any of its affiliates or subsidiaries (together the“Group”) in any jurisdiction nor should it or any part of it form thebasis of, or be relied on in connection with, any contract topurchase or subscribe for any securities of the Company or anymember of its group or with any other contract or commitmentwhatsoever.Further, it should not be treated as giving investment, legal,accounting, regulatory, taxation or other advice and recipientsshould each make their own evaluation of the Company and ofthe relevance and adequacy of the information containedherein.No warrantyNo representations or warranties, express or implied are given in,or in respect of, this Presentation. To the fullest extent permitted bylaw, in no circumstances will the Company, or any of its respectivesubsidiaries, shareholders, affiliates, representatives, partners,directors, officers, employees, advisers or agents be responsible orliable for any direct, indirect or consequential loss, loss of profit,damages or costs arising from the use of this Presentation, itscontents, its omissions, reliance on the information containedwithin it, or on opinions communicated in relation thereto orotherwise arising in connection therewith. The informationcontained in this Presentation has not been independentlyverified.
Third party sourcesCertain statistical and other information about the Company, itsaffiliates, the industry and the market where the Group operatesincluded in this Presentation is sourced from publicly availablethird party sources. Third-party industry publications, studies andsurveys generally state that the data therein have been obtainedfrom sources believed to be reliable, but that there is noguarantee of the fairness, quality, accuracy, relevance,completeness or sufficiency of such data. As such it presents theviews of those third parties, but may not necessarily correspond tothe views held by the Company or its Representatives and theCompany expressly disclaims any responsibility for, or liability inrespect of, such information.Such research and estimates, and their underlying methodologyand assumptions, have not been verified by any independentsource for accuracy or completeness and are subject to changewithout notice. Accordingly, undue reliance should not be placedon any of the industry or market data contained in thisPresentation.Forward-looking statementsThis Presentation contains illustrative returns, projections, estimatesand beliefs and similar information (together, “Forward LookingStatements”). The Forward Looking Statements can be identifiedby the use of forward looking terminology, including the terms“believes”, “estimates”, “anticipates”, “expects”, “intends”,“plans”, “may”, “will” or “should” or, in each case, their negativeor other variations or comparable terminology.The Forward Looking Statements are subject to inherentuncertainties and qualifications and are based on numerousassumptions, in each case whether or not identified in thePresentation. The Forward Looking Statements are provided forillustrative purposes only and are not intended to serve as, andmust not be relied upon by any investor as a guarantee, anassurance, a prediction or a definitive statement of fact orprobability.Nothing in this Presentation should be construed as a profitforecast. Actual events and circumstances are difficult orimpossible to predict and will differ from assumptions. Manyactual events and circumstances are beyond the control of theCompany. Some important factors that could cause actualresults to differ materially from those in any Forward LookingStatements could include changes in domestic and foreignbusiness, market, financial, political and legal conditions. Therecan be no assurance that any particular Forward LookingStatements will be realised, and the performance of the Companymay be materially and adversely different from the ForwardLooking Statements. The Forward Looking Statements speak only
as of the date of this Presentation. The Company expresslydisclaims any obligation or undertaking to release any updates orrevisions to any Forward Looking Statements to reflect any changein the Company’s expectations with regard thereto or anychanges in events, conditions or circumstances on which anyForward Looking Statements are based. Accordingly, no relianceshould be placed upon the Forward Looking Statements.Other important remarksThe Presentation contains financial information regarding theGroup. Such financial information may not have been audited,reviewed or verified by any independent accounting firm. Inparticular, the preliminary results for FY 2020 in this presentationhave not been audited or reviewed. The Group’s audited resultscould vary from the preliminary results presented herein.The inclusion of such financial information in the Presentationshould not be regarded as a representation or warranty by theGroup or any Representatives as to the accuracy orcompleteness of such information’s portrayal of the financialposition or results of operations of the Group. In addition, thisPresentation contains certain unaudited pro forma and asadjusted financial information. The Group’s auditors have notperformed any procedures with respect to such unaudited proforma and as adjusted financial information for the purpose ofinclusion herein and accordingly, they have not expressed anopinion or provided any form of assurance with respect thereto. Inaddition, although we believe the unaudited financial informationto be reasonable, our actual results may vary from the informationcontained herein and such variations could be material. As such,you should not place undue reliance on the inclusion of suchunaudited financial information and it should not be regarded asan indication that it will be an accurate prediction of futureevents.Furthermore, certain financial data included in the Presentationconsists of “non-IFRS financial measures”, which may not becomparable to similarly-titled measures as presented by othercompanies, nor should they be considered as an alternative tothe historical financial results or other indicators of the Group’scash flow based on IFRS. You are cautioned not to place unduereliance on any non-IFRS financial measures and ratios includedherein.
Agenda
• Investment thesis
1) A Leading Independent Tower Company
2) Structurally Attractive Markets
3) Highly Visible Revenue Stream with FX and Cost Inflation Protection
4) Experienced Management Team and Board of Directors
• FY 2020 update
3
1
3
2
4
A Leading Independent Tower Company
1
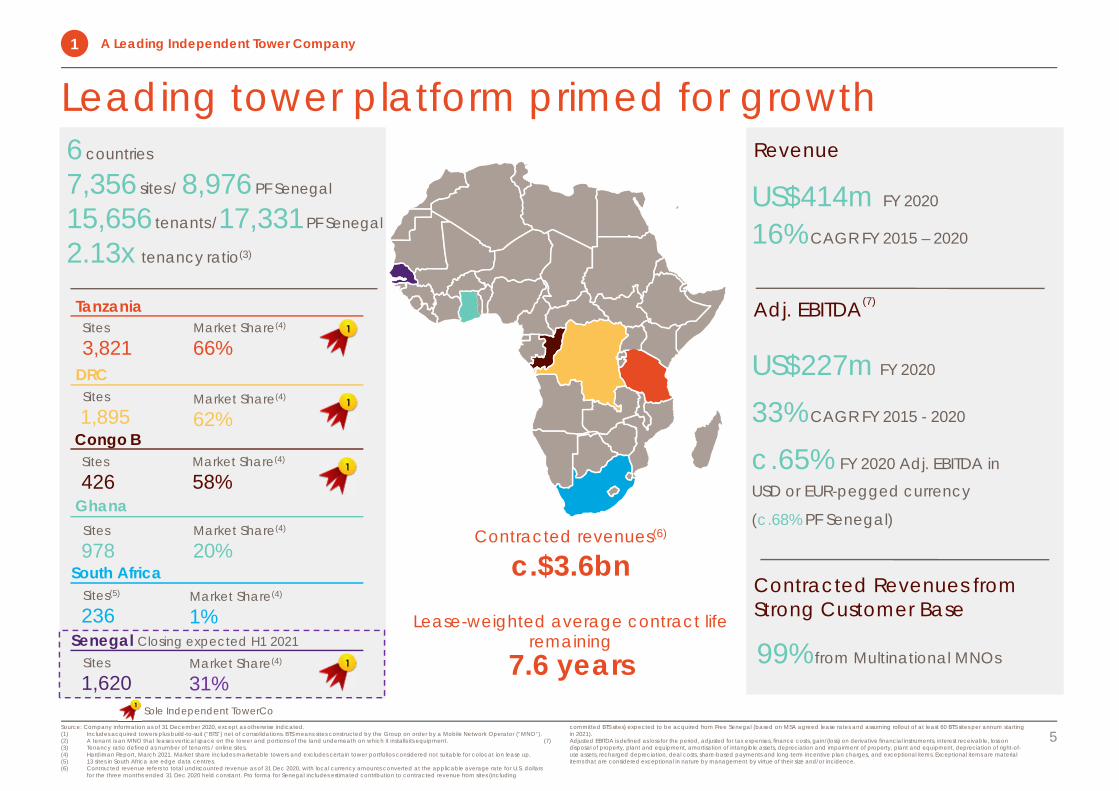
6 countries
7,356 sites/ 8,976 PF Senegal
15,656tenants/17,331PF Senegal
2.13x tenancy ratio(3)
Senegal Closing expected H1 2021
Leading tower platform primed for growth
5
Sole Independent TowerCo
TanzaniaSites
3,821DRCSites
1,895Congo BSites
426
Sites
978
Ghana
Market Share(4)
66%
Market Share(4)
62%
Market Share(4)
58%
Market Share(4)
20%Contracted revenues(6)
c.$3.6bn
Lease-weighted average contract life remaining
7.6 years
South Africa
US$414m FY 2020
16% CAGR FY 2015 – 2020
99% from Multinational MNOs
US$227m FY 2020
33% CAGR FY 2015 - 2020
c.65% FY 2020 Adj. EBITDA in
USD or EUR-pegged currency
(c.68% PF Senegal)
Revenue
Contracted Revenues from Strong Customer Base
(7)Adj. EBITDA
Source: Company information as of 31 December 2020, except as otherwise indicated.(1) Includes acquired towers plus build-to-suit (“BTS”) net of consolidations. BTS means sites constructed by the Group on order by a Mobile Network Operator (“MNO”).(2) A tenant is an MNO that leases vertical space on the tower and portions of the land underneath on which it installs its equipment.(3) Tenancy ratio defined as number of tenants / online sites.(4) Hardiman Report, March 2021. Market share includes marketable towers and excludes certain tower portfolios considered not suitable for colocat ion lease up.(5) 13 sites in South Africa are edge data centres.(6) Contracted revenue refers to total undiscounted revenue as of 31 Dec 2020, with local currency amounts converted at the applicable average rate for U.S. dollars
for the three months ended 31 Dec 2020 held constant. Pro forma for Senegal includes estimated contribution to contracted revenue from sites (including
committed BTS sites) expected to be acquired from Free Senegal (based on MSA agreed lease rates and assuming rollout of at least 60 BTS sites per annum starting in 2021).
(7) Adjusted EBITDA is defined as loss for the period, adjusted for tax expenses, finance costs, gain/(loss) on derivative financial instruments, interest receivable, loss on disposal of property, plant and equipment, amortisation of intangible assets, depreciation and impairment of property, plant and equipment, depreciation of right-of-use assets, recharged depreciation, deal costs, share-based payments and long-term incentive plan charges, and exceptional items. Exceptional items are material items that are considered exceptional in nature by management by virtue of their size and/or incidence.
A Leading Independent Tower Company1
Sites(5)
236
Sites
1,620
Market Share(4)
1%
Market Share(4)
31%
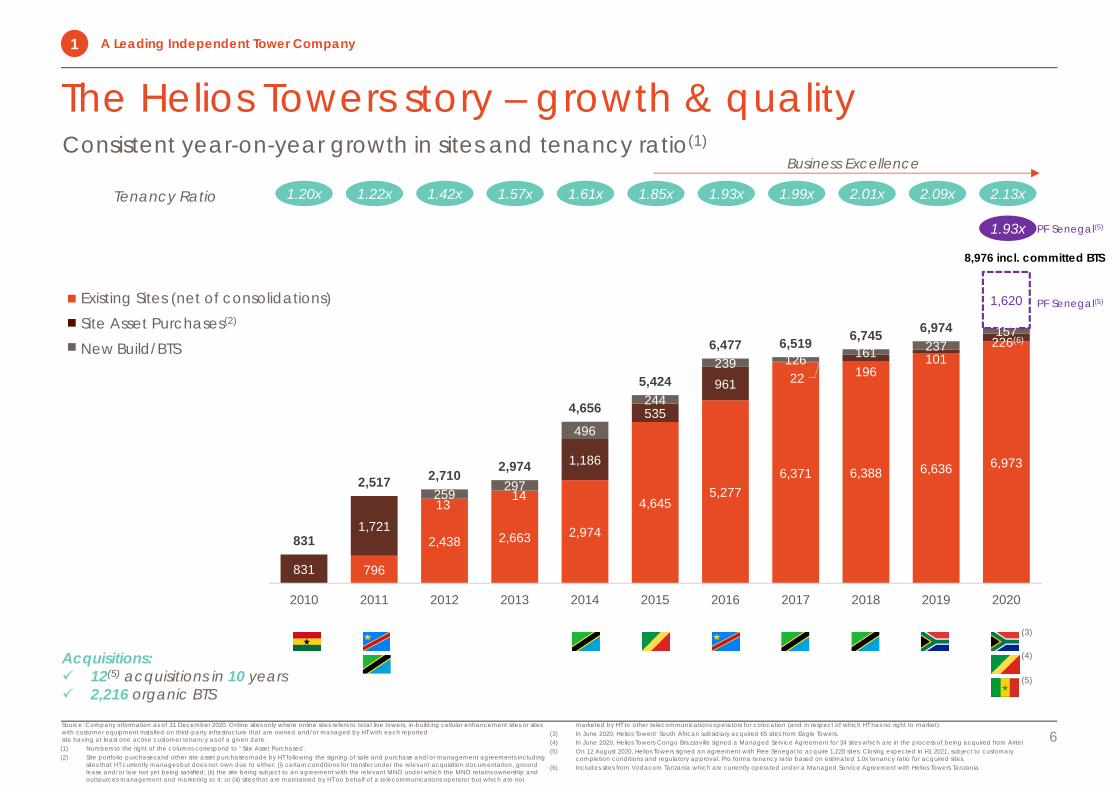
-796
2,438 2,663 2,974
4,6455,277
6,371 6,388 6,636 6,973
831
1,72113
14
1,186
535
961 22 196101
226(6)
259 297
496
244
239 126 161 237157
1,620
831
2,517 2,710 2,974
4,656
5,424
6,477 6,519 6,745 6,974
2010 2011 2012 2013 2014 2015 2016 2017 2018 2019 2020
Source: Company information as of 31 December 2020. Online sites only where online sites refers to total live towers, in-building cellular enhancement sites or sites with customer equipment installed on third-party infrastructure that are owned and/or managed by HT with each reported site having at least one active customer tenancy as of a given date.(1) Numbers to the right of the columns correspond to “Site Asset Purchases”.(2) Site portfolio purchases and other site asset purchases made by HT following the signing of sale and purchase and/or management agreements including
sites that HT currently manages but does not own due to either: (i) certain conditions for transfer under the relevant acquisition documentation, ground lease and/or law not yet being satisfied; (ii) the site being subject to an agreement with the relevant MNO under which the MNO retains ownership and outsources management and marketing to it; or (iii) sites that are maintained by HT on behalf of a telecommunications operator but which are not
marketed by HT to other telecommunications operators for colocation (and in respect of which HT has no right to market).(3) In June 2020, Helios Towers’ South African subsidiary acquired 65 sites from Eagle Towers.(4) In June 2020, Helios Towers Congo Brazzaville signed a Managed Service Agreement for 34 sites which are in the process of being acquired from Airtel(5) On 12 August 2020, Helios Towers signed an agreement with Free Senegal to acquire 1,220 sites. Closing expected in H1 2021, subject to customary
completion conditions and regulatory approval. Pro forma tenancy ratio based on estimated 1.0x tenancy ratio for acquired sites.(6) Includes sites from Vodacom Tanzania which are currently operated under a Managed Service Agreement with Helios Towers Tanzania.
Existing Sites (net of consolidations)Site Asset Purchases(2)
New Build/BTS
Consistent year-on-year growth in sites and tenancy ratio(1)
6
Acquisitions: 12(5) acquisitions in 10 years 2,216 organic BTS
Tenancy Ratio
Business Excellence
A Leading Independent Tower Company1
1.20x 1.22x 1.42x 1.57x 1.61x 1.93x 1.99x1.85x 2.01x 2.09x 2.13x
1.93x
(3)
(4)
(5)
PF Senegal(5)
PF Senegal(5)
8,976 incl. committed BTS
The Helios Towers story – growth & quality
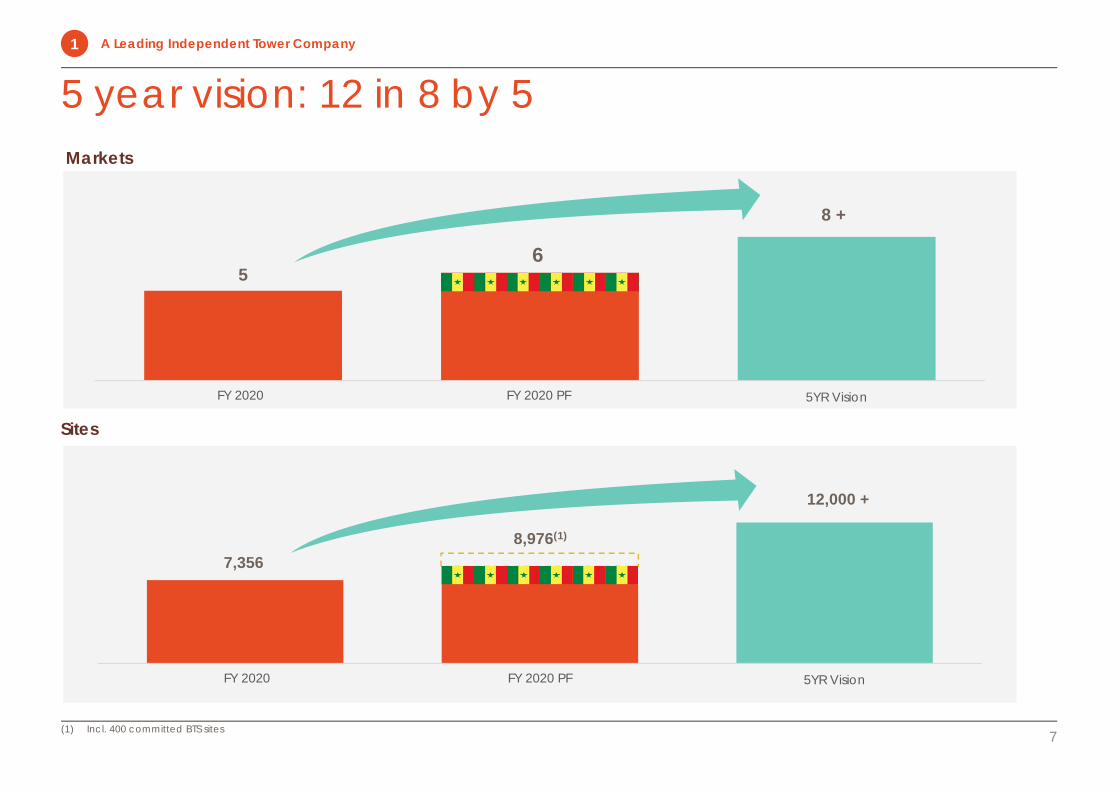
5 year vision: 12 in 8 by 5
7
5
8 +
Q2 20 Q2 20 PF 5YR Vision
Sites
Markets
6
7,3568,976(1)
12,000 +
Q2 20 Q2 20 PF 5YR Vision
(1) Incl. 400 committed BTS sites
A Leading Independent Tower Company1
FY 2020 PF
FY 2020 PFFY 2020
FY 2020
0.00%
20.00%
40.00%
60.00%
80.00%
100.00%
Q1 18 Q2 18 Q3 18 Q4 18 Q1 19 Q2 19 Q3 19 Q4 19 Q1 20 Q2 20 Q3 20 Q4 20
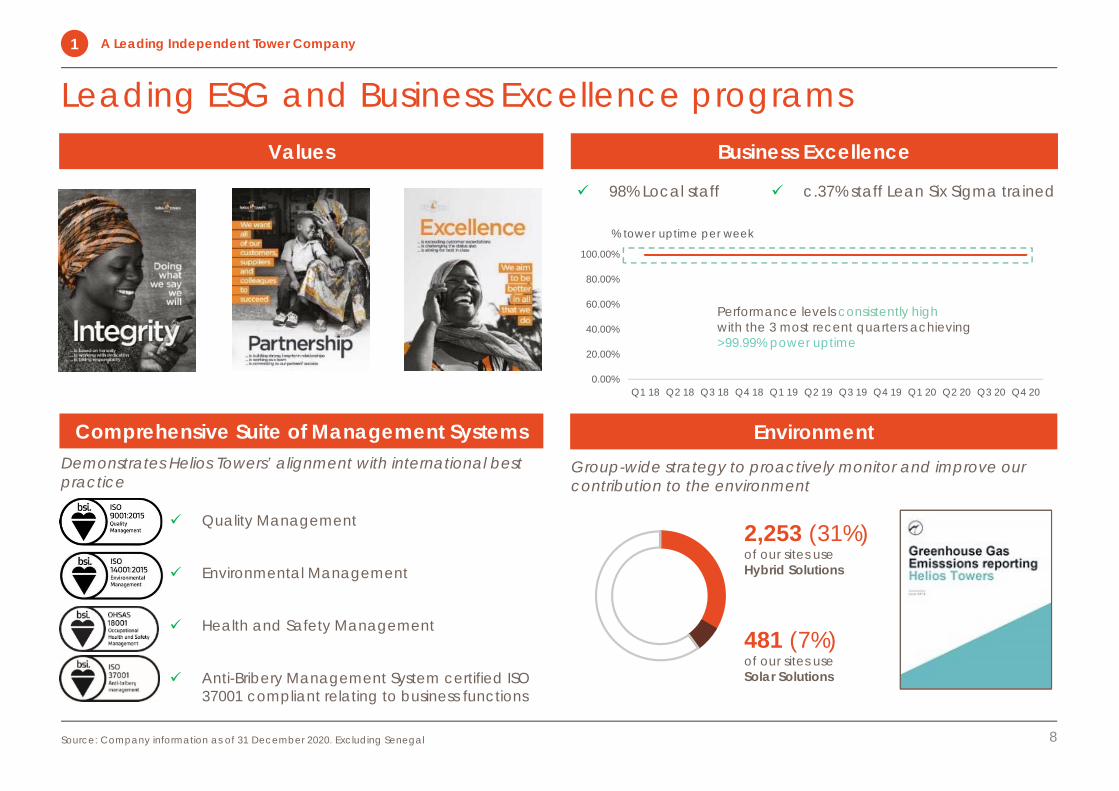
Leading ESG and Business Excellence programs
8Source: Company information as of 31 December 2020. Excluding Senegal
Business Excellence
Comprehensive Suite of Management Systems
Values
Demonstrates Helios Towers’ alignment with international best practice
EnvironmentGroup-wide strategy to proactively monitor and improve our contribution to the environment
Quality Management
Environmental Management
Health and Safety Management
Anti-Bribery Management System certified ISO 37001 compliant relating to business functions
A Leading Independent Tower Company1
98% Local staff
% tower uptime per week
Performance levels consistently highwith the 3 most recent quarters achieving >99.99% power uptime
c.37% staff Lean Six Sigma trained
2,253 (31%)of our sites use Hybrid Solutions
481 (7%)of our sites use Solar Solutions
42 50 60 63 83 85
126 127 133 138 148 164 168 176 181 186 195 201 210 215 216 220 230 240
25%27% 28% 28%
35% 35%39% 38% 40% 40%
42%46% 47%
49% 51% 52% 52% 52%54% 54% 53% 54% 55% 57%
0%
10%
20%
30%
40%
50%
60%
70%
80%
90%
100%
(40)
10
60
110
160
210
260
Q1 15 Q2 15 Q3 15 Q4 15 Q1 16 Q2 16 Q3 16 Q4 16 Q1 17 Q2 17 Q3 17 Q4 17 Q1 18 Q2 18 Q3 18 Q4 18 Q1 19 Q2 19 Q3 19 Q4 19 Q1 20 Q2 20 Q3 20 Q4 20
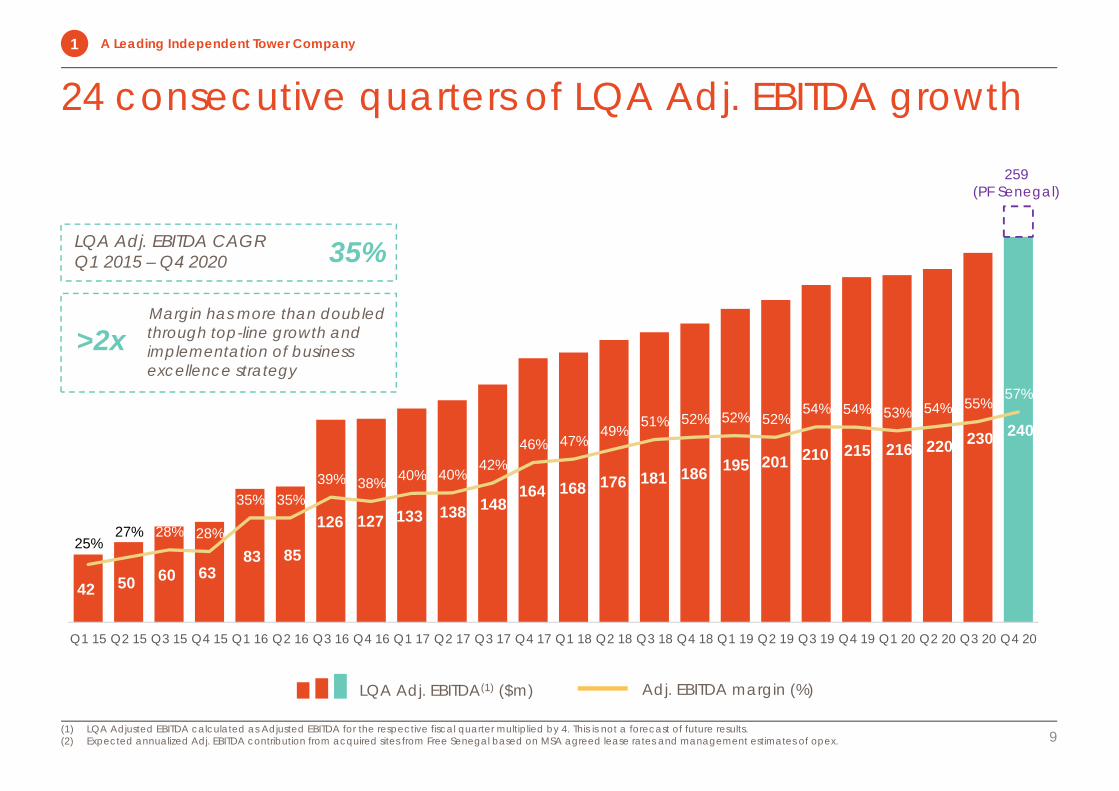
24 consecutive quarters of LQA Adj. EBITDA growth
9(1) LQA Adjusted EBITDA calculated as Adjusted EBITDA for the respective fiscal quarter multiplied by 4. This is not a forecast of future results.(2) Expected annualized Adj. EBITDA contribution from acquired sites from Free Senegal based on MSA agreed lease rates and management estimates of opex.
A Leading Independent Tower Company1
LQA Adj. EBITDA CAGR Q1 2015 – Q4 2020 35%
Margin has more than doubled through top-line growth and implementation of business excellence strategy
>2x
Adj. EBITDA margin (%)LQA Adj. EBITDA(1) ($m)
259 (PF Senegal)
Structurally Attractive Markets for Organic and Inorganic Growth
2
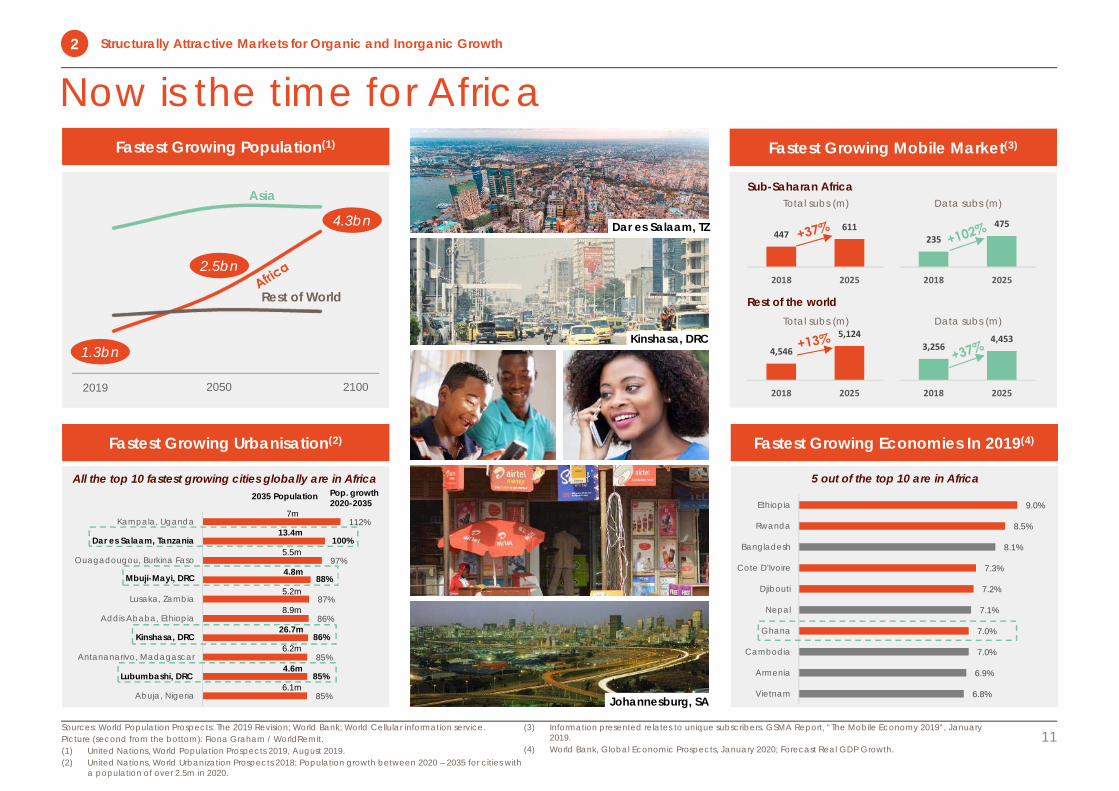
Now is the time for Africa
11Sources: World Population Prospects: The 2019 Revision; World Bank; World Cellular information service.Picture (second from the bottom): Fiona Graham / WorldRemit.(1) United Nations, World Population Prospects 2019, August 2019.(2) United Nations, World Urbanization Prospects 2018; Population growth between 2020 – 2035 for cities with
a population of over 2.5m in 2020.
(3) Information presented relates to unique subscribers. GSMA Report, “The Mobile Economy 2019”, January 2019.
(4) World Bank, Global Economic Prospects, January 2020; Forecast Real GDP Growth.
5 out of the top 10 are in Africa
4.3bn
1.3bn
Fastest Growing Population(1)
Rest of World
4,546
5,124
2018 2025
3,2564,453
2018 2025
Fastest Growing Urbanisation(2) Fastest Growing Economies In 2019(4)
Fastest Growing Mobile Market(3)
2.5bn
Sub-Saharan Africa
Rest of the world
2019 2050 2100
Total subs (m) Data subs (m)
Kinshasa, DRC
Dar es Salaam, TZ
Johannesburg, SA
9.0%
8.5%
8.1%
7.3%
7.2%
7.1%
7.0%
7.0%
6.9%
6.8%
Ethiopia
Rwanda
Bangladesh
Cote D'Ivoire
Djibouti
Nepal
Ghana
Cambodia
Armenia
Vietnam
All the top 10 fastest growing cities globally are in AfricaPop. growth 2020-2035
2035 Population
85%
85%
85%
86%
86%
87%
88%
97%
100%
112%
Abuja, Nigeria
Lubumbashi, DRC
Antananarivo, Madagascar
Kinshasa, DRC
Addis Ababa, Ethiopia
Lusaka, Zambia
Mbuji-Mayi, DRC
Ouagadougou, Burkina Faso
Dar es Salaam, Tanzania
Kampala, Uganda13.4m
5.5m
4.8m
5.2m
8.9m
26.7m
6.2m
4.6m
6.1m
7m
Dar es Salaam, Tanzania
Mbuji-Mayi, DRC
Kinshasa, DRC
Lubumbashi, DRC
100%
88%
86%
85%
13.4m
4.8m
26.7m
4.6m
447611
2018 2025
Total subs (m)
235
475
2018 2025
Data subs (m)Asia
Structurally Attractive Markets for Organic and Inorganic Growth2
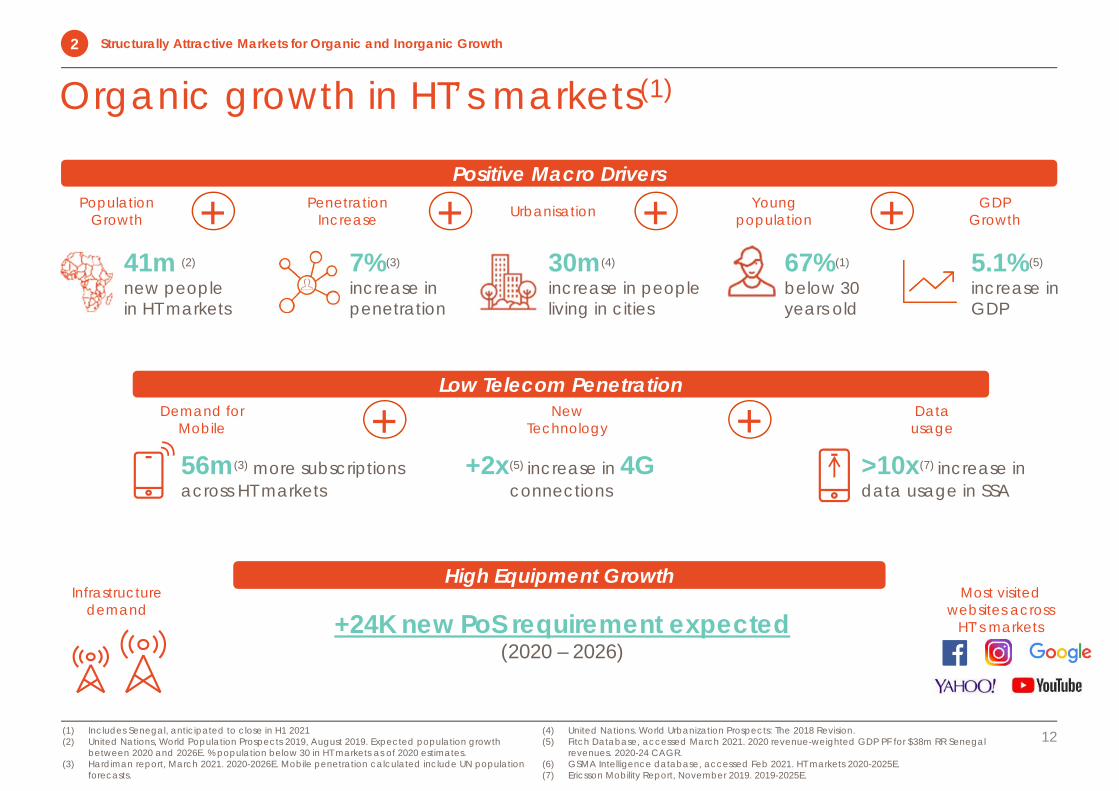
Organic growth in HT’s markets(1)
Infrastructure demand
(1) Includes Senegal, anticipated to close in H1 2021 (2) United Nations, World Population Prospects 2019, August 2019. Expected population growth
between 2020 and 2026E. % population below 30 in HT markets as of 2020 estimates.(3) Hardiman report, March 2021. 2020-2026E. Mobile penetration calculated include UN population
forecasts.
(4) United Nations. World Urbanization Prospects: The 2018 Revision.(5) Fitch Database, accessed March 2021. 2020 revenue-weighted GDP PF for $38m RR Senegal
revenues. 2020-24 CAGR. (6) GSMA Intelligence database, accessed Feb 2021. HT markets 2020-2025E.(7) Ericsson Mobility Report, November 2019. 2019-2025E.
41m (2)
new people in HT markets
Population Growth
7%(3)
increase in penetration
Penetration Increase Urbanisation
30m(4)
increase in people living in cities
Young population
67%(1)
below 30 years old
GDP Growth
5.1%(5)
increase in GDP
+Positive Macro Drivers
+ + +
High Equipment Growth
+24K new PoS requirement expected(2020 – 2026)
56m(3) more subscriptions across HT markets
Demand for Mobile
+2x(5) increase in 4Gconnections
Data usage
>10x(7) increase in data usage in SSA
+Low Telecom Penetration
+ New Technology
Most visited websites across
HT’s markets
12
Structurally Attractive Markets for Organic and Inorganic Growth2
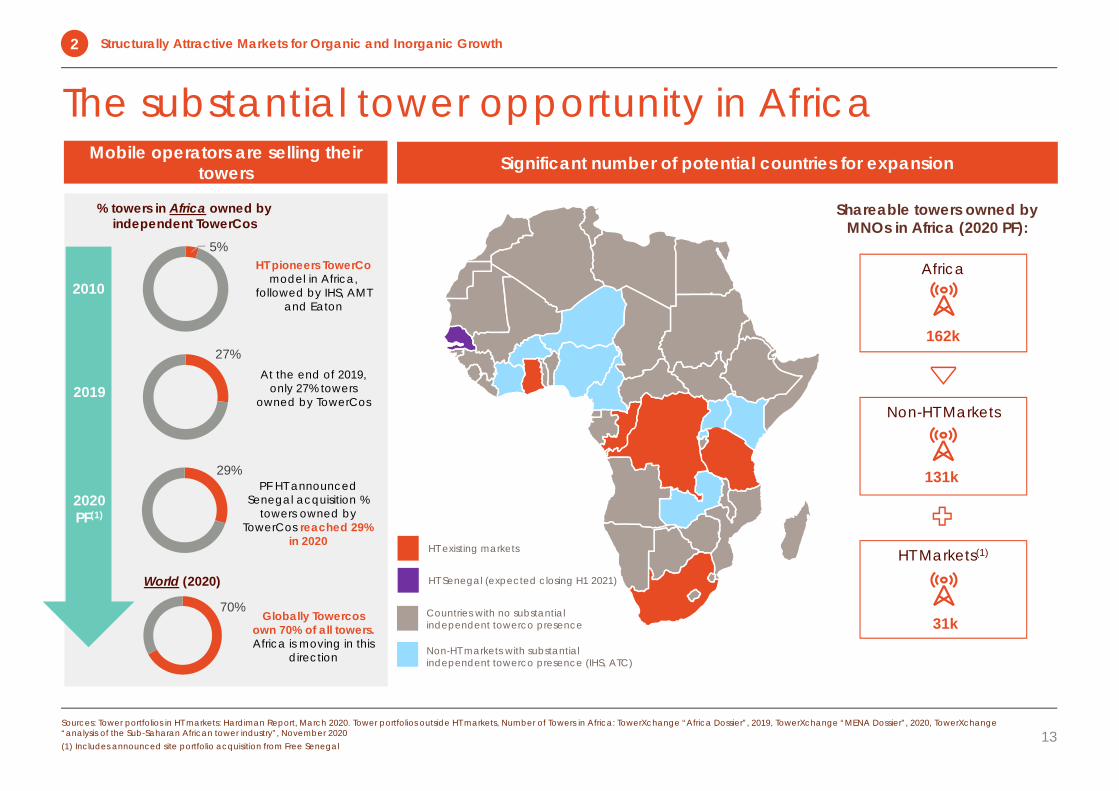
The substantial tower opportunity in AfricaMobile operators are selling their
towers
70%
World (2020)
% towers in Africa owned by independent TowerCos
Shareable towers owned by MNOs in Africa (2020 PF):
HT Markets(1)
31k
Non-HT Markets
131k
Non-HT markets with substantial independent towerco presence (IHS, ATC)
Countries with no substantial independent towerco presence
Significant number of potential countries for expansion
Africa
162k
Sources: Tower portfolios in HT markets: Hardiman Report, March 2020. Tower portfolios outside HT markets, Number of Towers in Africa: TowerXchange “Africa Dossier”, 2019, TowerXchange “MENA Dossier”, 2020, TowerXchange“analysis of the Sub-Saharan African tower industry”, November 2020(1) Includes announced site portfolio acquisition from Free Senegal
HT existing markets
HT Senegal (expected closing H1 2021)
2010
2019
HT pioneers TowerComodel in Africa,
followed by IHS, AMT and Eaton
Globally Towercos own 70% of all towers.Africa is moving in this
direction
29%
2020PF(1)
PF HT announced Senegal acquisition %
towers owned by TowerCos reached 29%
in 2020
27%
5%
At the end of 2019, only 27% towers
owned by TowerCos
13
Structurally Attractive Markets for Organic and Inorganic Growth2
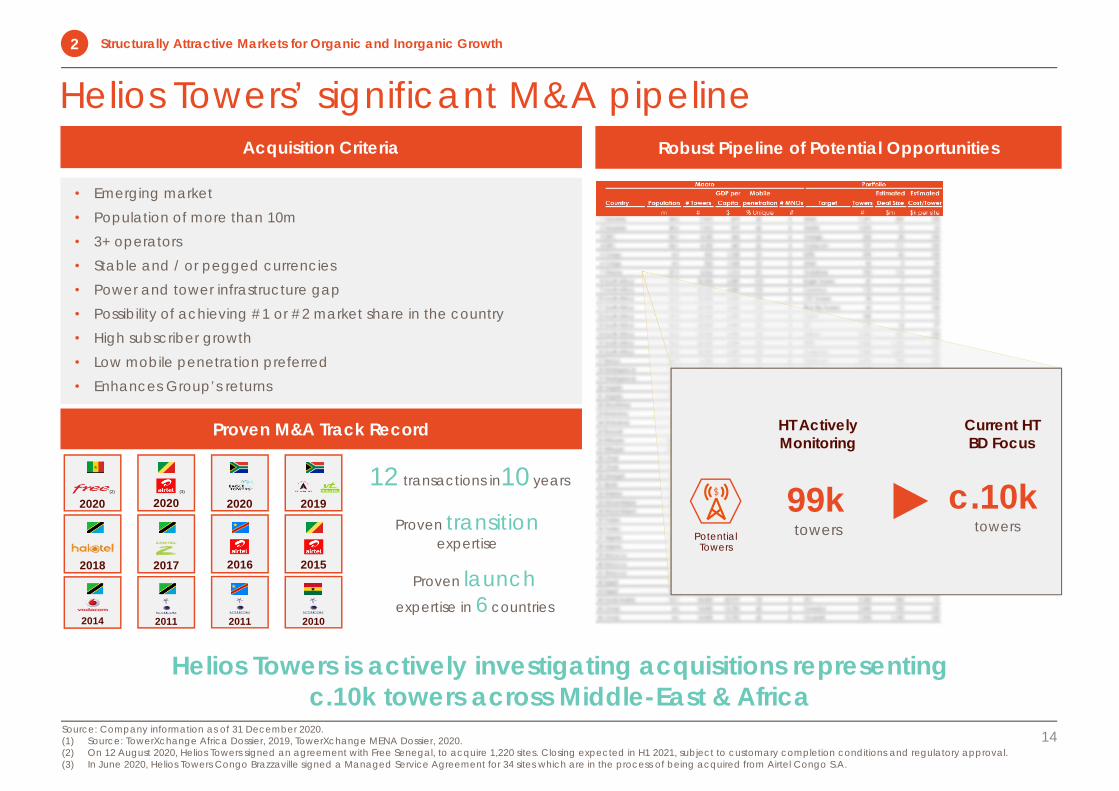
Helios Towers’ significant M&A pipeline
14Source: Company information as of 31 December 2020.(1) Source: TowerXchange Africa Dossier, 2019, TowerXchange MENA Dossier, 2020.(2) On 12 August 2020, Helios Towers signed an agreement with Free Senegal, to acquire 1,220 sites. Closing expected in H1 2021, subject to customary completion conditions and regulatory approval.(3) In June 2020, Helios Towers Congo Brazzaville signed a Managed Service Agreement for 34 sites which are in the process of being acquired from Airtel Congo S.A.
Acquisition Criteria Robust Pipeline of Potential Opportunities
Proven M&A Track Record
• Emerging market• Population of more than 10m• 3+ operators• Stable and / or pegged currencies• Power and tower infrastructure gap• Possibility of achieving #1 or #2 market share in the country• High subscriber growth• Low mobile penetration preferred• Enhances Group’s returns
2019
2018 2017 20152016
2014 2011
12 transactions in10 years
Proven transitionexpertise
Proven launchexpertise in 6 countries
HT Actively Monitoring
Current HT BD Focus
99ktowers
c.10ktowers
Potential Towers
2020
2011 2010
20202020(2) (3)
Structurally Attractive Markets for Organic and Inorganic Growth2
Helios Towers is actively investigating acquisitions representing c.10k towers across Middle-East & Africa
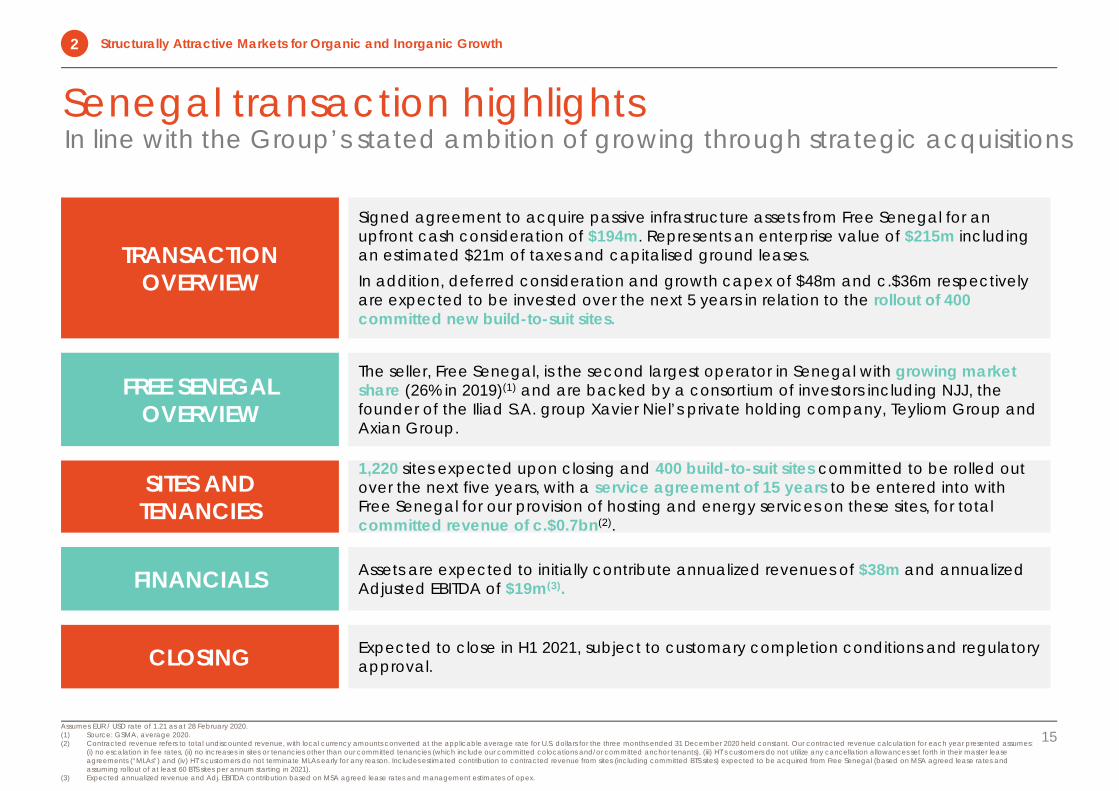
In line with the Group’s stated ambition of growing through strategic acquisitionsSenegal transaction highlights
15Assumes EUR / USD rate of 1.21 as at 28 February 2020.(1) Source: GSMA, average 2020.(2) Contracted revenue refers to total undiscounted revenue, with local currency amounts converted at the applicable average rate for U.S. dollars for the three months ended 31 December 2020 held constant. Our contracted revenue calculation for each year presented assumes:
(i) no escalation in fee rates, (ii) no increases in sites or tenancies other than our committed tenancies (which include our committed colocations and/or committed anchor tenants), (iii) HT’s customers do not utilize any cancellation allowances set forth in their master lease agreements (“MLAs”) and (iv) HT’s customers do not terminate MLAs early for any reason. Includes estimated contribution to contracted revenue from sites (including committed BTS sites) expected to be acquired from Free Senegal (based on MSA agreed lease rates and assuming rollout of at least 60 BTS sites per annum starting in 2021).
(3) Expected annualized revenue and Adj. EBITDA contribution based on MSA agreed lease rates and management estimates of opex.
TRANSACTION OVERVIEW
Signed agreement to acquire passive infrastructure assets from Free Senegal for an upfront cash consideration of $194m. Represents an enterprise value of $215m including an estimated $21m of taxes and capitalised ground leases.In addition, deferred consideration and growth capex of $48m and c.$36m respectively are expected to be invested over the next 5 years in relation to the rollout of 400 committed new build-to-suit sites.
SITES AND TENANCIES
1,220 sites expected upon closing and 400 build-to-suit sites committed to be rolled out over the next five years, with a service agreement of 15 years to be entered into with Free Senegal for our provision of hosting and energy services on these sites, for totalcommitted revenue of c.$0.7bn(2).
FINANCIALS Assets are expected to initially contribute annualized revenues of $38m and annualized Adjusted EBITDA of $19m(3).
CLOSING Expected to close in H1 2021, subject to customary completion conditions and regulatory approval.
FREE SENEGALOVERVIEW
The seller, Free Senegal, is the second largest operator in Senegal with growing market share (26% in 2019)(1) and are backed by a consortium of investors including NJJ, the founder of the Iliad S.A. group Xavier Niel’s private holding company, Teyliom Group and Axian Group.
Structurally Attractive Markets for Organic and Inorganic Growth2
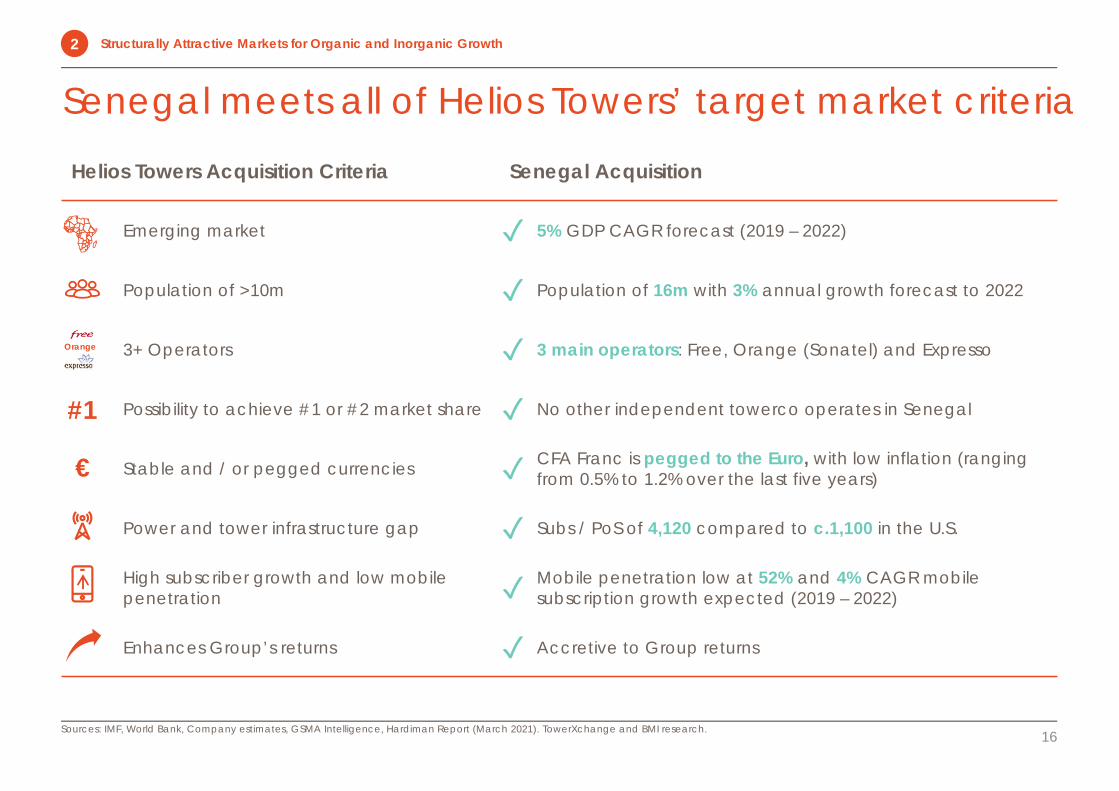
Helios Towers Acquisition Criteria Senegal Acquisition
Emerging market ✓ 5% GDP CAGR forecast (2019 – 2022)
Population of >10m ✓ Population of 16m with 3% annual growth forecast to 2022
3+ Operators ✓ 3 main operators: Free, Orange (Sonatel) and Expresso
Possibility to achieve #1 or #2 market share ✓ No other independent towerco operates in Senegal
Stable and / or pegged currencies ✓ CFA Franc is pegged to the Euro, with low inflation (ranging from 0.5% to 1.2% over the last five years)
Power and tower infrastructure gap ✓ Subs / PoS of 4,120 compared to c.1,100 in the U.S.
High subscriber growth and low mobile penetration ✓ Mobile penetration low at 52% and 4% CAGR mobile
subscription growth expected (2019 – 2022)
Enhances Group’s returns ✓ Accretive to Group returns
Senegal meets all of Helios Towers’ target market criteria
16Sources: IMF, World Bank, Company estimates, GSMA Intelligence, Hardiman Report (March 2021). TowerXchange and BMI research.
€
#1
Orange
Structurally Attractive Markets for Organic and Inorganic Growth2
Highly Visible Revenue Stream with FX and Cost Inflation Protection
3
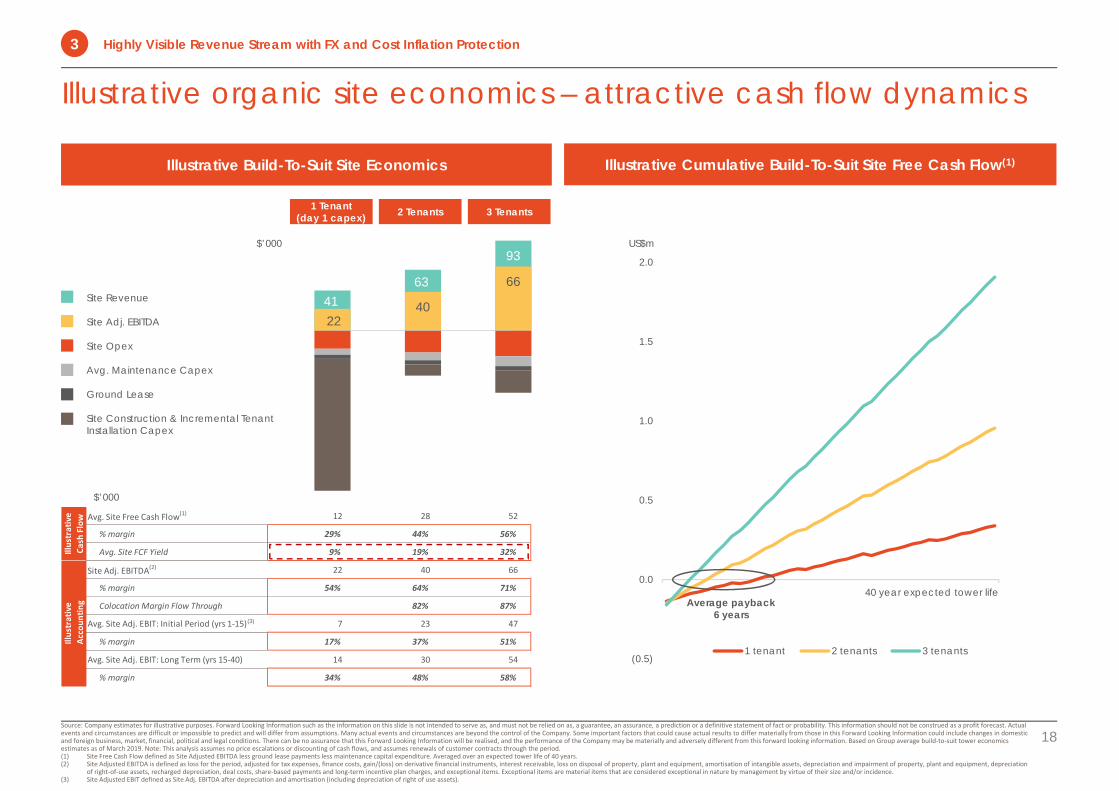
Illustrative Cumulative Build-To-Suit Site Free Cash Flow(1)
Illustrative organic site economics – attractive cash flow dynamics
18
Illustrative Build-To-Suit Site Economics
Source: Company estimates for illustrative purposes. Forward Looking Information such as the information on this slide is not intended to serve as, and must not be relied on as, a guarantee, an assurance, a prediction or a definitive statement of fact or probability. This information should not be construed as a profit forecast. Actual events and circumstances are difficult or impossible to predict and will differ from assumptions. Many actual events and circumstances are beyond the control of the Company. Some important factors that could cause actual results to differ materially from those in this Forward Looking Information could include changes in domestic and foreign business, market, financial, political and legal conditions. There can be no assurance that this Forward Looking Information will be realised, and the performance of the Company may be materially and adversely different from this forward looking information. Based on Group average build‐to‐suit tower economics estimates as of March 2019. Note: This analysis assumes no price escalations or discounting of cash flows, and assumes renewals of customer contracts through the period.(1) Site Free Cash Flow defined as Site Adjusted EBITDA less ground lease payments less maintenance capital expenditure. Averaged over an expected tower life of 40 years.(2) Site Adjusted EBITDA is defined as loss for the period, adjusted for tax expenses, finance costs, gain/(loss) on derivative financial instruments, interest receivable, loss on disposal of property, plant and equipment, amortisation of intangible assets, depreciation and impairment of property, plant and equipment, depreciation
of right‐of‐use assets, recharged depreciation, deal costs, share‐based payments and long‐term incentive plan charges, and exceptional items. Exceptional items are material items that are considered exceptional in nature by management by virtue of their size and/or incidence.(3) Site Adjusted EBIT defined as Site Adj. EBITDA after depreciation and amortisation (including depreciation of right of use assets).
(0.5)
0.0
0.5
1.0
1.5
2.0
40 year expected tower life
1 tenant 2 tenants 3 tenants
Average payback6 years
$’000 US$m
1 Tenant(day 1 capex) 2 Tenants 3 Tenants
Site Revenue
Site Adj. EBITDA
Site Opex
Avg. Maintenance Capex
Ground Lease
Site Construction & Incremental Tenant Installation Capex
4163
93
2240
66
$’000
Avg. Site Free Cash Flow(1) 12 28 52
% margin 29% 44% 56%
Avg. Site FCF Yield 9% 19% 32%
Site Adj. EBITDA(2) 22 40 66
% margin 54% 64% 71%
Colocation Margin Flow Through 82% 87%
Avg. Site Adj. EBIT: Initial Period (yrs 1‐15) 7 23 47
% margin 17% 37% 51%
Avg. Site Adj. EBIT: Long Term (yrs 15‐40) 14 30 54
% margin 34% 48% 58%
Illustrative
Cash Flow
Illustrative
Accou
nting
(3)
Highly Visible Revenue Stream with FX and Cost Inflation Protection3
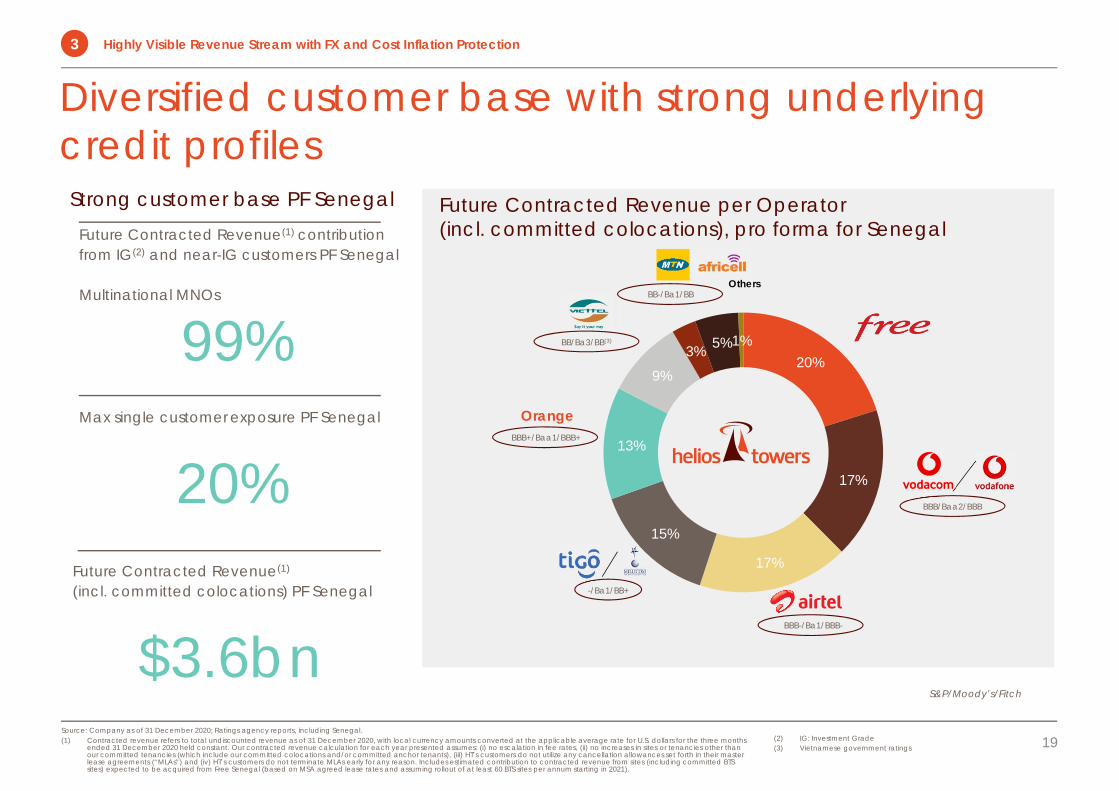
20%
17%
17%
15%
13%
9% 3% 5% 1%
Strong customer base PF SenegalFuture Contracted Revenue(1) contributionfrom IG(2) and near-IG customers PF Senegal
Multinational MNOs
99%Max single customer exposure PF Senegal
20%
Future Contracted Revenue per Operator(incl. committed colocations), pro forma for Senegal
Others
BBB-/Ba1/BBB-
S&P/Moody’s/Fitch
BB-/Ba1/BB
-/Ba1/BB+
Future Contracted Revenue(1)
(incl. committed colocations) PF Senegal
$3.6bn
BB/Ba3/BB(3)
19
Diversified customer base with strong underlying credit profiles
(2) IG: Investment Grade (3) Vietnamese government ratings
Source: Company as of 31 December 2020; Ratings agency reports, including Senegal.(1) Contracted revenue refers to total undiscounted revenue as of 31 December 2020, with local currency amounts converted at the applicable average rate for U.S. dollars for the three months
ended 31 December 2020 held constant. Our contracted revenue calculation for each year presented assumes: (i) no escalation in fee rates, (ii) no increases in sites or tenancies other than our committed tenancies (which include our committed colocations and/or committed anchor tenants), (iii) HT’s customers do not utilize any cancellation allowances set forth in their master lease agreements (“MLAs”) and (iv) HT’s customers do not terminate MLAs early for any reason. Includes estimated contribution to contracted revenue from sites (including committed BTS sites) expected to be acquired from Free Senegal (based on MSA agreed lease rates and assuming rollout of at least 60 BTS sites per annum starting in 2021).
Highly Visible Revenue Stream with FX and Cost Inflation Protection3
BBB+/Baa1/BBB+
Orange
BBB/Baa2/BBB
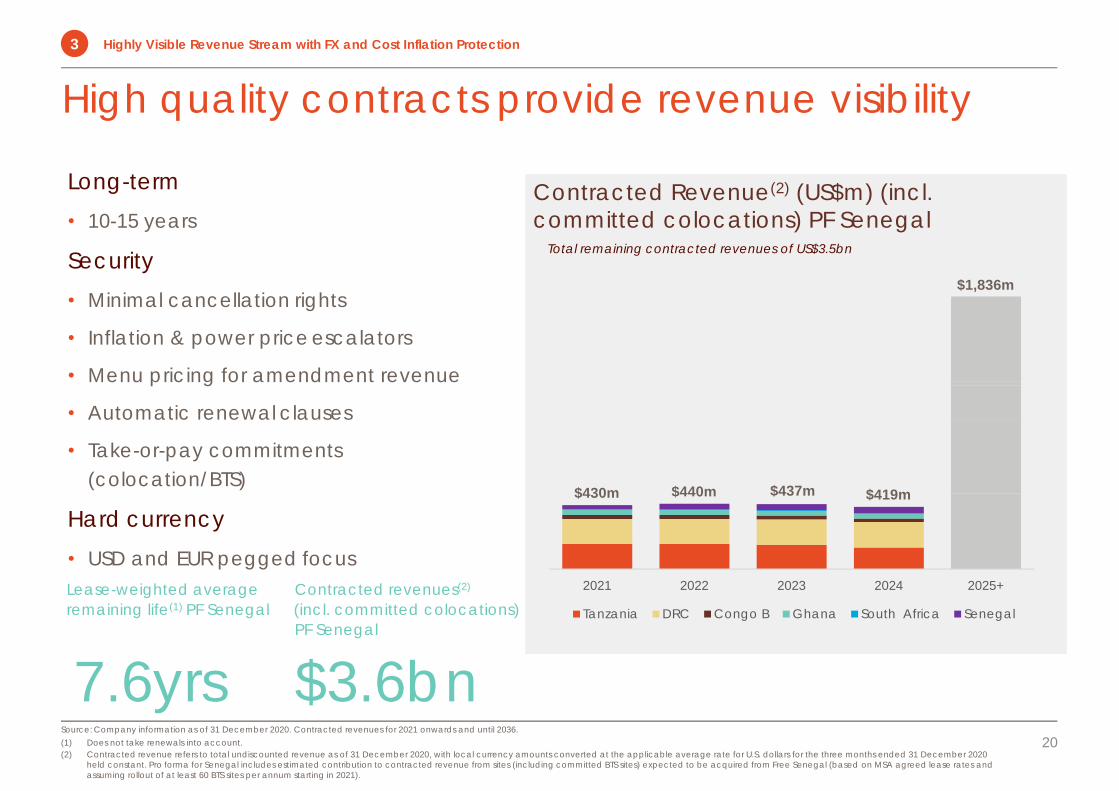
Long-term• 10-15 years
Security• Minimal cancellation rights
• Inflation & power priceescalators
• Menu pricing for amendment revenue
• Automatic renewal clauses
• Take-or-pay commitments (colocation/BTS)
Hard currency• USD and EUR pegged focus
High quality contracts provide revenue visibility
Lease-weighted average Contracted revenues(2)
remaining life(1) PF Senegal (incl. committed colocations) PF Senegal
7.6yrs $3.6bn
Contracted Revenue(2) (US$m) (incl. committed colocations) PF Senegal
Total remaining contracted revenues of US$3.5bn
Source: Company information as of 31 December 2020. Contracted revenues for 2021 onwards and until 2036.(1) Does not take renewals into account.(2) Contracted revenue refers to total undiscounted revenue as of 31 December 2020, with local currency amounts converted at the applicable average rate for U.S. dollars for the three months ended 31 December 2020
held constant. Pro forma for Senegal includes estimated contribution to contracted revenue from sites (including committed BTS sites) expected to be acquired from Free Senegal (based on MSA agreed lease rates and assuming rollout of at least 60 BTS sites per annum starting in 2021).
20
Highly Visible Revenue Stream with FX and Cost Inflation Protection3
$430m $440m $437m $419m
$1,836m
2021 2022 2023 2024 2025+
Tanzania DRC Congo B Ghana South Africa Senegal
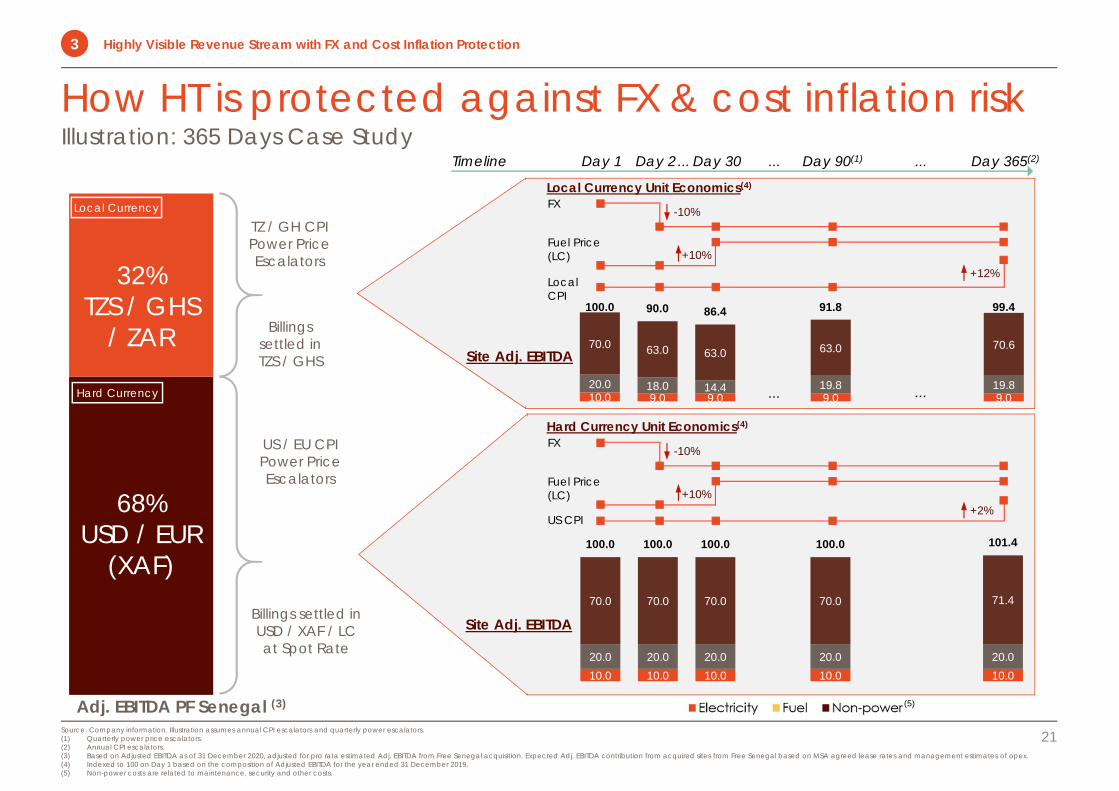
10.0 9.0 9.0 9.0 9.020.0 18.0 14.4 19.8 19.8
70.0 63.0 63.0 63.0 70.6
100.0 90.0 86.4 91.8 99.4
How HT is protected against FX & cost inflation riskIllustration: 365 Days Case Study
21
Adj. EBITDA PF Senegal (3)
32% TZS / GHS
/ ZAR
68% USD / EUR
(XAF)
US / EU CPI Power Price Escalators
Billings settled in USD / XAF / LC at Spot Rate
TZ / GH CPI Power Price Escalators
Billings settled in TZS / GHS
Day 1 Day 2 Day 30 Day 90(1) Day 365(2)
Local Currency Unit Economics(4)
Site Adj. EBITDA
Hard Currency Unit Economics(4)
Local Currency
Hard Currency
FX
Fuel Price (LC)
Local CPI
-10%
+10%+12%
Site Adj. EBITDA
Timeline ... ......
... ...
FX
Fuel Price (LC)
US CPI
-10%
+10%+2%
10.0 10.0 10.0 10.0 10.020.0 20.0 20.0 20.0 20.0
70.0 70.0 70.0 70.0 71.4
100.0 100.0 100.0 100.0 101.4
(5)
Source: Company information. Illustration assumes annual CPI escalators and quarterly power escalators.(1) Quarterly power price escalators.(2) Annual CPI escalators. (3) Based on Adjusted EBITDA as of 31 December 2020, adjusted for pro rata estimated Adj. EBITDA from Free Senegal acquisition. Expected Adj. EBITDA contribution from acquired sites from Free Senegal based on MSA agreed lease rates and management estimates of opex.(4) Indexed to 100 on Day 1 based on the composition of Adjusted EBITDA for the year ended 31 December 2019. (5) Non-power costs are related to maintenance, security and other costs.
Highly Visible Revenue Stream with FX and Cost Inflation Protection3
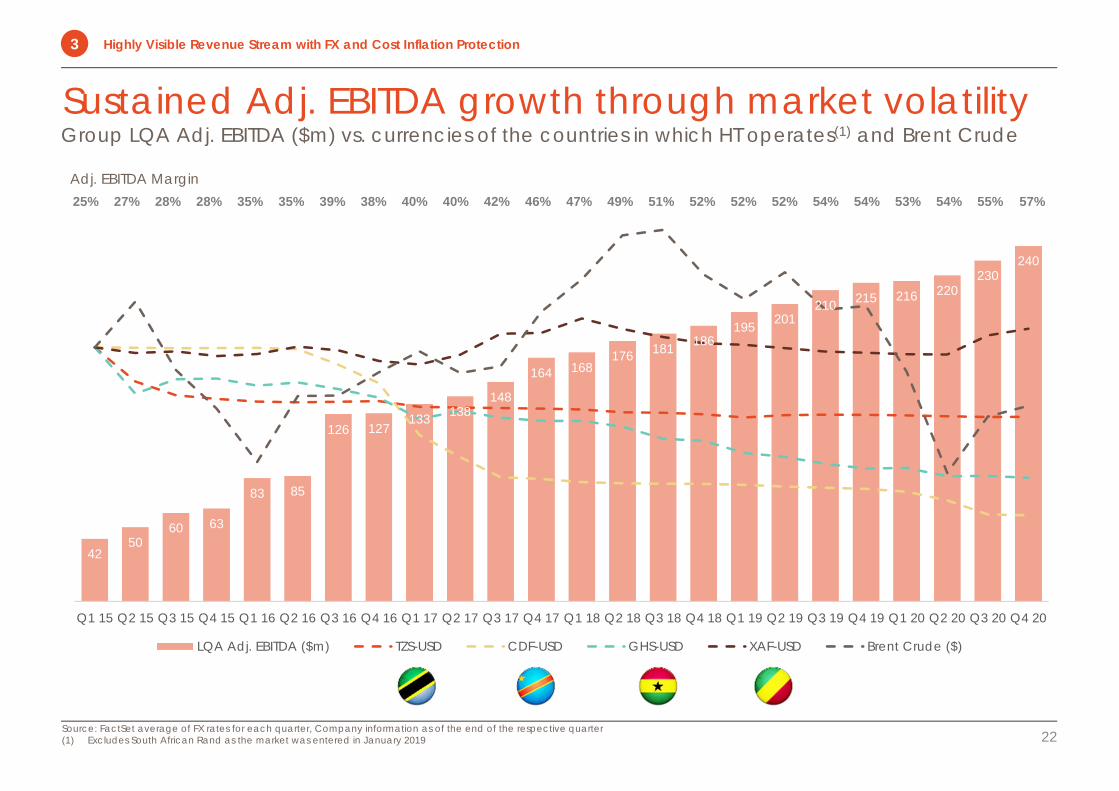
4250
60 63
83 85
126 127133 138
148
164 168176 181 186
195 201210 215 216 220
230240
0
50
100
150
200
250
300
20%
40%
60%
80%
100%
120%
140%
160%
Q1 15 Q2 15 Q3 15 Q4 15 Q1 16 Q2 16 Q3 16 Q4 16 Q1 17 Q2 17 Q3 17 Q4 17 Q1 18 Q2 18 Q3 18 Q4 18 Q1 19 Q2 19 Q3 19 Q4 19 Q1 20 Q2 20 Q3 20 Q4 20
LQA Adj. EBITDA ($m) TZS-USD CDF-USD GHS-USD XAF-USD Brent Crude ($)
Sustained Adj. EBITDA growth through market volatility Group LQA Adj. EBITDA ($m) vs. currencies of the countries in which HT operates(1) and Brent Crude
22Source: FactSet average of FX rates for each quarter, Company information as of the end of the respective quarter(1) Excludes South African Rand as the market was entered in January 2019
Adj. EBITDA Margin35% 35% 39% 38% 40% 40% 42% 49%46% 51%25% 27% 28% 28% 52% 52% 52%47% 54% 54% 53% 54% 55%
Highly Visible Revenue Stream with FX and Cost Inflation Protection3
57%
Experienced Management Team and Board of Directors
4
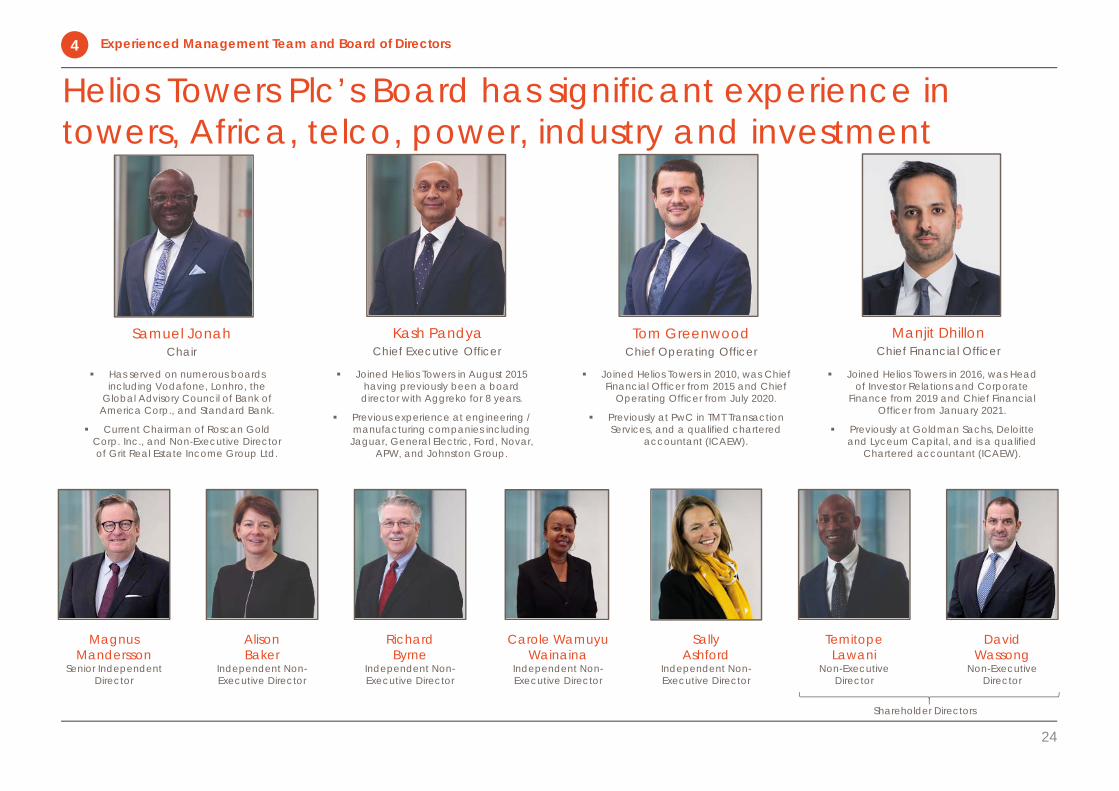
Helios Towers Plc’s Board has significant experience in towers, Africa, telco, power, industry and investment
24
Samuel JonahChair
Kash PandyaChief Executive Officer
Tom GreenwoodChief Operating Officer
Magnus Mandersson
Senior Independent Director
Alison Baker
Independent Non-Executive Director
Richard Byrne
Independent Non-Executive Director
Carole Wamuyu Wainaina
Independent Non-Executive Director
Sally Ashford
Independent Non-Executive Director
Temitope Lawani
Non-Executive Director
David Wassong
Non-Executive Director
Has served on numerous boards including Vodafone, Lonhro, the
Global Advisory Council of Bank of America Corp., and Standard Bank.
Current Chairman of Roscan Gold Corp. Inc., and Non-Executive Director of Grit Real Estate Income Group Ltd.
Joined Helios Towers in August 2015 having previously been a board
director with Aggreko for 8 years.
Previous experience at engineering / manufacturing companies including
Jaguar, General Electric, Ford, Novar, APW, and Johnston Group.
Joined Helios Towers in 2010, was Chief Financial Officer from 2015 and Chief
Operating Officer from July 2020.
Previously at PwC in TMT Transaction Services, and a qualified chartered
accountant (ICAEW).
Shareholder Directors
Manjit DhillonChief Financial Officer
Joined Helios Towers in 2016, was Head of Investor Relations and Corporate
Finance from 2019 and Chief Financial Officer from January 2021.
Previously at Goldman Sachs, Deloitte and Lyceum Capital, and is a qualified
Chartered accountant (ICAEW).
Experienced Management Team and Board of Directors4
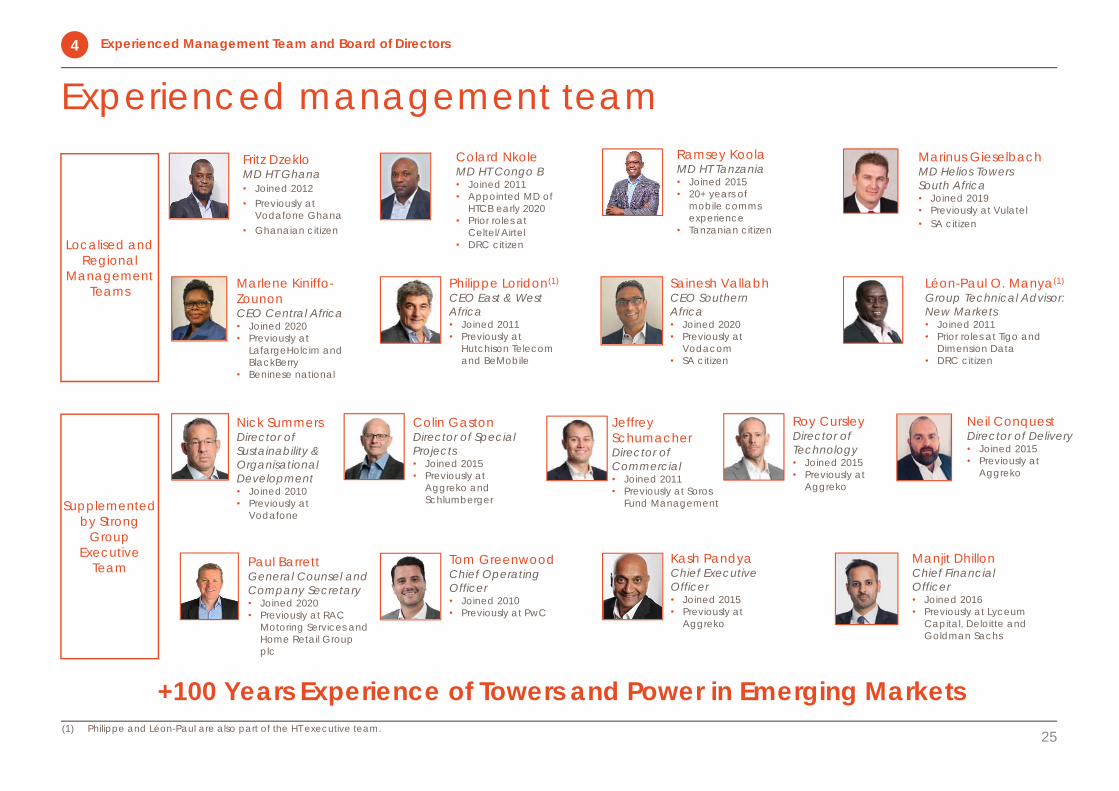
Sainesh VallabhCEO Southern Africa• Joined 2020• Previously at
Vodacom• SA citizen
Philippe Loridon(1)
CEO East & West Africa• Joined 2011• Previously at
Hutchison Telecom and BeMobile
Experienced management team
25
Ramsey KoolaMD HT Tanzania• Joined 2015• 20+ years of
mobile commsexperience
• Tanzanian citizen
Colard NkoleMD HT Congo B• Joined 2011• Appointed MD of
HTCB early 2020• Prior roles at
Celtel/Airtel• DRC citizen
Jeffrey SchumacherDirector of Commercial• Joined 2011• Previously at Soros
Fund Management
Localised and Regional
ManagementTeams
Supplemented by Strong
Group Executive
Team
Léon-Paul O. Manya(1)
Group Technical Advisor: New Markets• Joined 2011• Prior roles at Tigo and
Dimension Data• DRC citizen
+100 Years Experience of Towers and Power in Emerging Markets(1) Philippe and Léon-Paul are also part of the HT executive team.
Nick SummersDirector of Sustainability & Organisational Development• Joined 2010• Previously at
Vodafone
Tom GreenwoodChief Operating Officer• Joined 2010• Previously at PwC
Roy CursleyDirector ofTechnology• Joined 2015• Previously at
Aggreko
Kash PandyaChief Executive Officer• Joined 2015• Previously at
Aggreko
Paul BarrettGeneral Counsel and Company Secretary• Joined 2020• Previously at RAC
Motoring Services and Home Retail Group plc
Fritz DzekloMD HT Ghana• Joined 2012• Previously at
Vodafone Ghana• Ghanaian citizen
Colin GastonDirector of Special Projects• Joined 2015• Previously at
Aggreko and Schlumberger
Experienced Management Team and Board of Directors4
Manjit DhillonChief Financial Officer• Joined 2016• Previously at Lyceum
Capital, Deloitte and Goldman Sachs
Neil ConquestDirector of Delivery• Joined 2015• Previously at
Aggreko
Marlene Kiniffo-ZounonCEO Central Africa• Joined 2020• Previously at
LafargeHolcim and BlackBerry
• Beninese national
Marinus GieselbachMD Helios TowersSouth Africa• Joined 2019• Previously at Vulatel• SA citizen
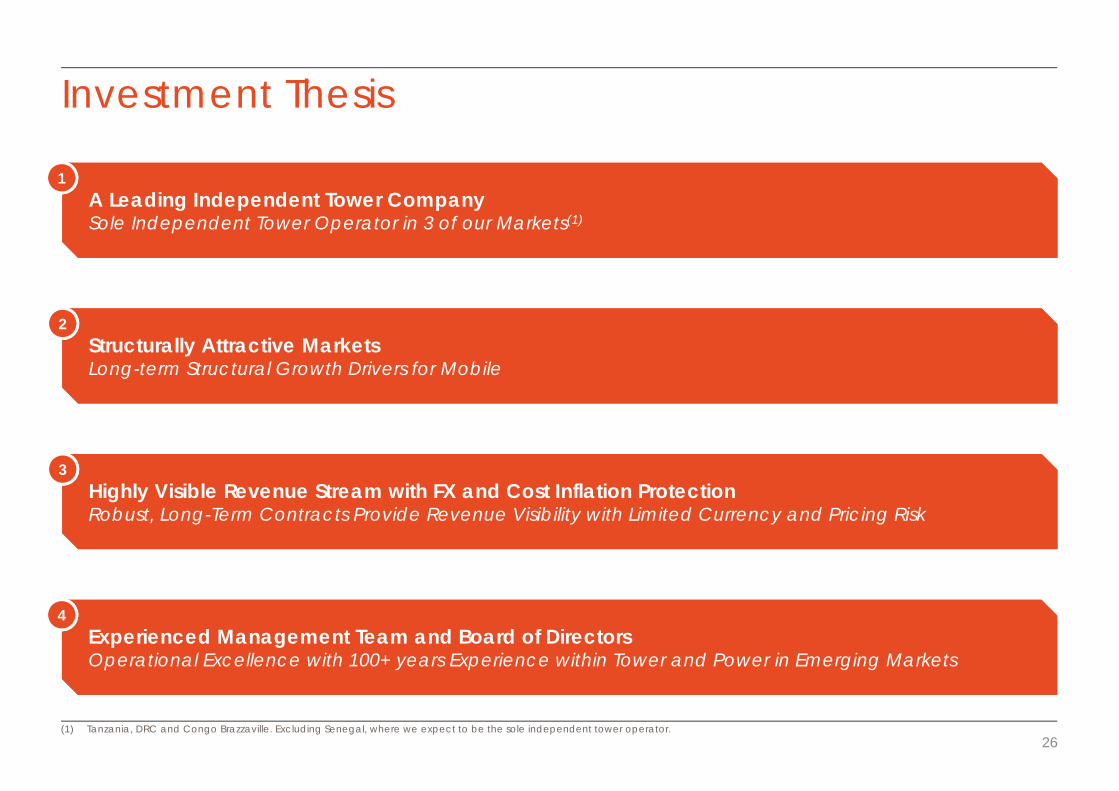
Investment Thesis
A Leading Independent Tower CompanySole Independent Tower Operator in 3 of our Markets(1)A Leading Independent Tower CompanySole Independent Tower Operator in 3 of our Markets(1)
1
Highly Visible Revenue Stream with FX and Cost Inflation ProtectionRobust, Long-Term Contracts Provide Revenue Visibility with Limited Currency and Pricing RiskHighly Visible Revenue Stream with FX and Cost Inflation ProtectionRobust, Long-Term Contracts Provide Revenue Visibility with Limited Currency and Pricing Risk
3
Structurally Attractive MarketsLong-term Structural Growth Drivers for MobileStructurally Attractive MarketsLong-term Structural Growth Drivers for Mobile
2
26
Experienced Management Team and Board of DirectorsOperational Excellence with 100+ years Experience within Tower and Power in Emerging MarketsExperienced Management Team and Board of DirectorsOperational Excellence with 100+ years Experience within Tower and Power in Emerging Markets
4
(1) Tanzania, DRC and Congo Brazzaville. Excluding Senegal, where we expect to be the sole independent tower operator.
FY 2020 Update
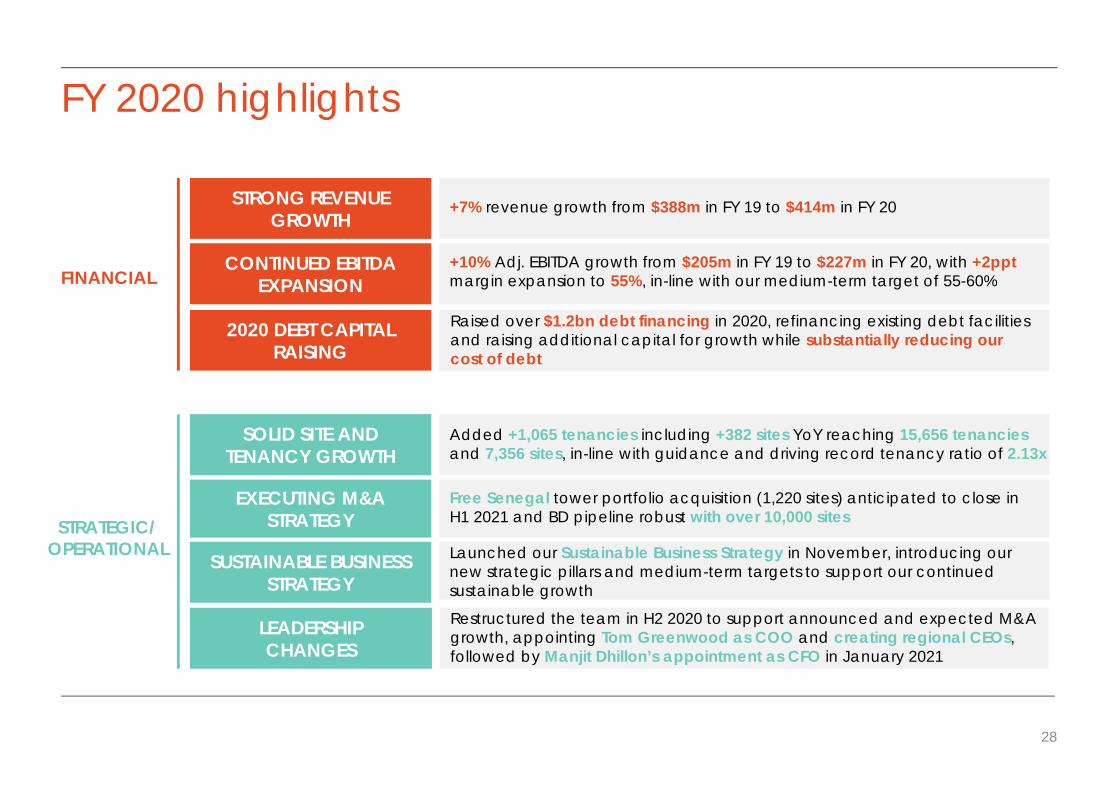
FY 2020 highlights
+10% Adj. EBITDA growth from $205m in FY 19 to $227m in FY 20, with +2pptmargin expansion to 55%, in-line with our medium-term target of 55-60%
CONTINUED EBITDA EXPANSIONFINANCIAL
STRONG REVENUE GROWTH
+7% revenue growth from $388m in FY 19 to $414m in FY 20
STRATEGIC/OPERATIONAL Launched our Sustainable Business Strategy in November, introducing our
new strategic pillars and medium-term targets to support our continued sustainable growth
SUSTAINABLE BUSINESS STRATEGY
Restructured the team in H2 2020 to support announced and expected M&A growth, appointing Tom Greenwood as COO and creating regional CEOs, followed by Manjit Dhillon’s appointment as CFO in January 2021
LEADERSHIPCHANGES
Raised over $1.2bn debt financing in 2020, refinancing existing debt facilities and raising additional capital for growth while substantially reducing our cost of debt
2020 DEBT CAPITAL RAISING
Added +1,065 tenancies including +382 sites YoY reaching 15,656 tenancies and 7,356 sites, in-line with guidance and driving record tenancy ratio of 2.13x
SOLID SITE AND TENANCY GROWTH
Free Senegal tower portfolio acquisition (1,220 sites) anticipated to close in H1 2021 and BD pipeline robust with over 10,000 sites
EXECUTING M&ASTRATEGY
28
105
146
178
205227
37%
42%
50%53%
55%
2016 2017 2018 2019 2020
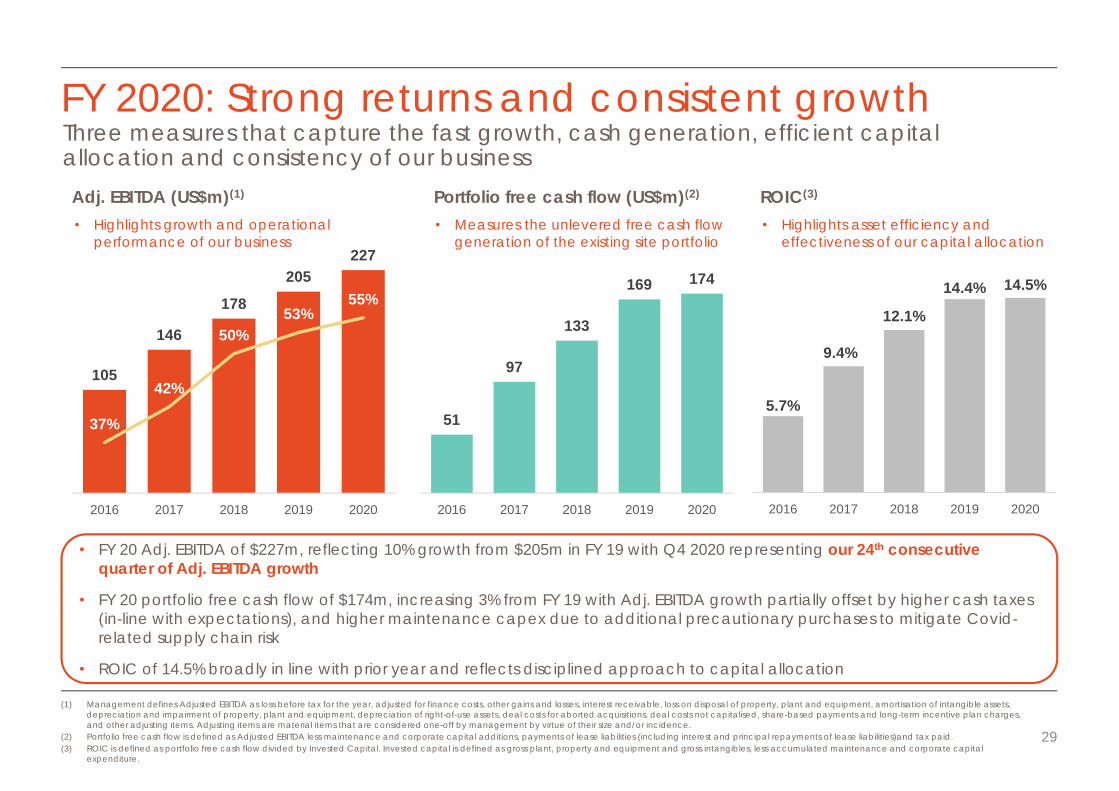
FY 2020: Strong returns and consistent growth
• FY 20 Adj. EBITDA of $227m, reflecting 10% growth from $205m in FY 19 with Q4 2020 representing our 24th consecutive quarter of Adj. EBITDA growth
• FY 20 portfolio free cash flow of $174m, increasing 3% from FY 19 with Adj. EBITDA growth partially offset by higher cash taxes (in-line with expectations), and higher maintenance capex due to additional precautionary purchases to mitigate Covid-related supply chain risk
• ROIC of 14.5% broadly in line with prior year and reflects disciplined approach to capital allocation
Adj. EBITDA (US$m)(1) Portfolio free cash flow (US$m)(2) ROIC(3)
• Highlights growth and operational performance of our business
• Measures the unlevered free cash flow generation of the existing site portfolio
• Highlights asset efficiency and effectiveness of our capital allocation
Three measures that capture the fast growth, cash generation, efficient capital allocation and consistency of our business
51
97
133
169 174
2016 2017 2018 2019 2020
(1) Management defines Adjusted EBITDA as loss before tax for the year, adjusted for finance costs, other gains and losses, interest receivable, loss on disposal of property, plant and equipment, amortisation of intangible assets, depreciation and impairment of property, plant and equipment, depreciation of right-of-use assets, deal costs for aborted acquisitions, deal costs not capitalised, share-based payments and long-term incentive plan charges, and other adjusting items. Adjusting items are material items that are considered one-off by management by virtue of their size and/or incidence.
(2) Portfolio free cash flow is defined as Adjusted EBITDA less maintenance and corporate capital additions, payments of lease liabilities (including interest and principal repayments of lease liabilities)and tax paid.(3) ROIC is defined as portfolio free cash flow divided by Invested Capital. Invested capital is defined as gross plant, property and equipment and gross intangibles, less accumulated maintenance and corporate capital
expenditure.
29
5.7%
9.4%
12.1%
14.4% 14.5%
2016 2017 2018 2019 2020
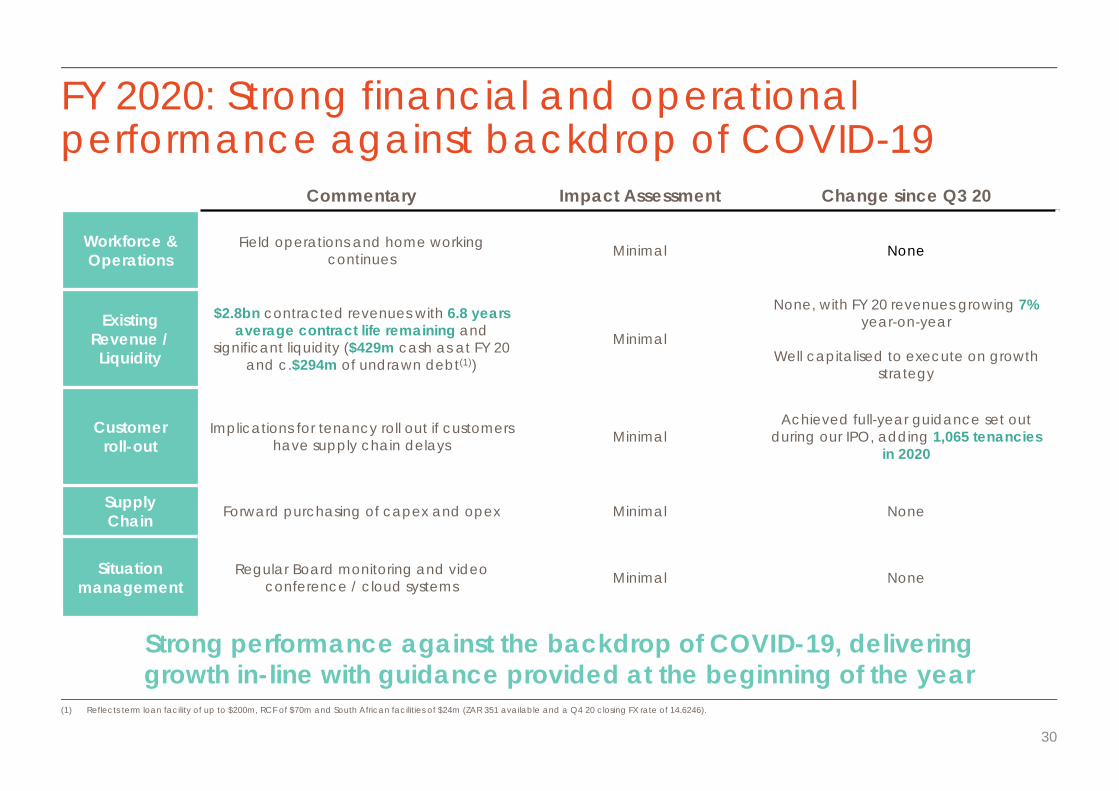
FY 2020: Strong financial and operational performance against backdrop of COVID-19
Commentary Impact Assessment Change since Q3 20
Workforce & Operations
Field operations and home working continues Minimal None
Existing Revenue / Liquidity
$2.8bn contracted revenues with 6.8 years average contract life remaining and
significant liquidity ($429m cash as at FY 20 and c.$294m of undrawn debt(1))
Minimal
None, with FY 20 revenues growing 7% year-on-year
Well capitalised to execute on growth strategy
Customer roll-out
Implications for tenancy roll out if customers have supply chain delays Minimal
Achieved full-year guidance set out during our IPO, adding 1,065 tenancies
in 2020
Supply Chain Forward purchasing of capex and opex Minimal None
Situation management
Regular Board monitoring and video conference / cloud systems Minimal None
(1) Reflects term loan facility of up to $200m, RCF of $70m and South African facilities of $24m (ZAR 351 available and a Q4 20 closing FX rate of 14.6246).
Strong performance against the backdrop of COVID-19, deliveringgrowth in-line with guidance provided at the beginning of the year
30
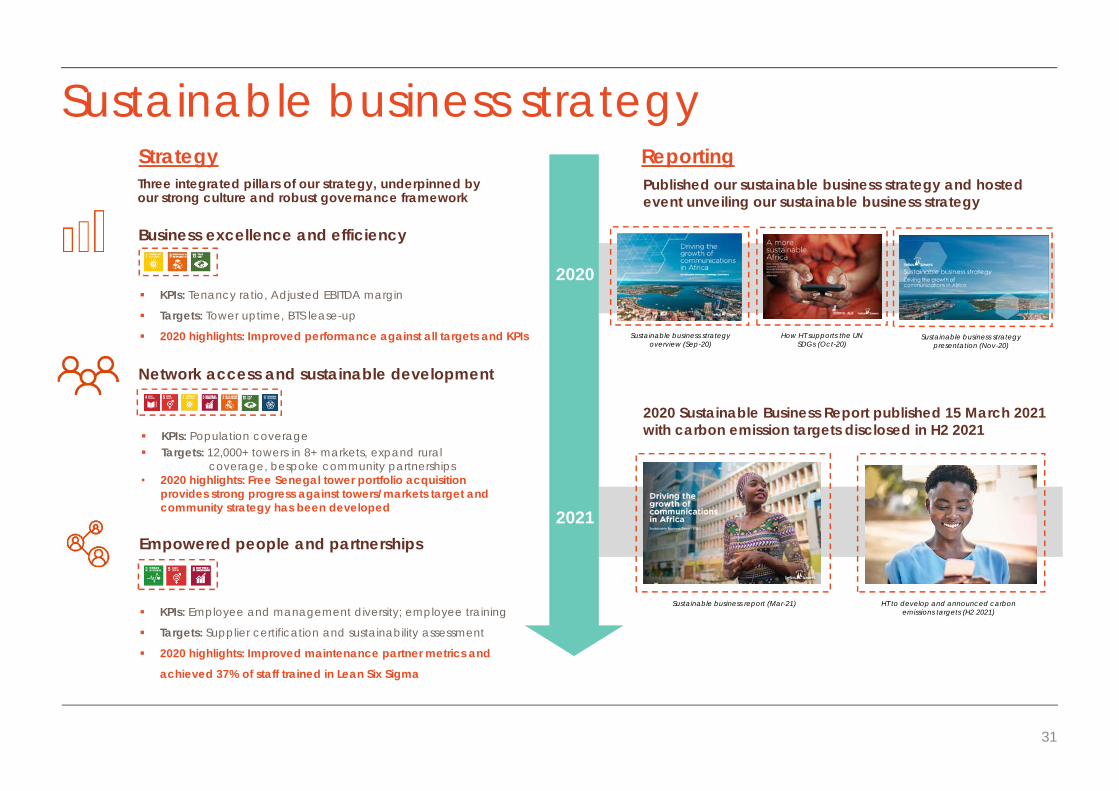
Sustainable business strategy
31
Strategy
Business excellence and efficiency
Network access and sustainable development
Empowered people and partnerships
2020
2021
Reporting Published our sustainable business strategy and hosted event unveiling our sustainable business strategy
2020 Sustainable Business Report published 15 March 2021with carbon emission targets disclosed in H2 2021
KPIs: Tenancy ratio, Adjusted EBITDA margin
Targets: Tower uptime, BTS lease-up
2020 highlights: Improved performance against all targets and KPIs
KPIs: Population coverage Targets: 12,000+ towers in 8+ markets, expand rural
coverage, bespoke community partnerships• 2020 highlights: Free Senegal tower portfolio acquisition
provides strong progress against towers/markets target and community strategy has been developed
KPIs: Employee and management diversity; employee training
Targets: Supplier certification and sustainability assessment
2020 highlights: Improved maintenance partner metrics and
achieved 37% of staff trained in Lean Six Sigma
Three integrated pillars of our strategy, underpinned by our strong culture and robust governance framework
Sustainable business strategy presentation (Nov-20)
Sustainable business strategy overview (Sep-20)
How HT supports the UNSDGs (Oct-20)
Sustainable business report (Mar-21) HT to develop and announced carbon emissions targets (H2 2021)
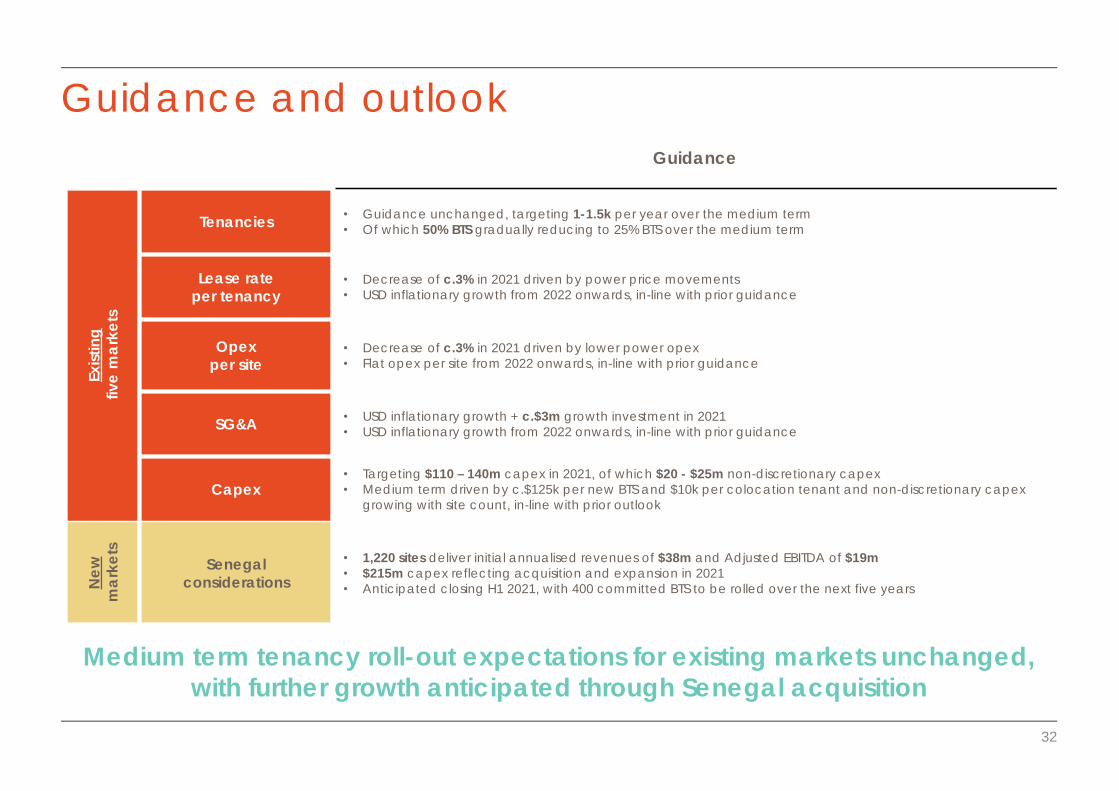
Guidance and outlook
32
Guidance
Exist
ing
five
mar
kets
Tenancies • Guidance unchanged, targeting 1-1.5k per year over the medium term• Of which 50% BTS gradually reducing to 25% BTS over the medium term
Lease rateper tenancy
• Decrease of c.3% in 2021 driven by power price movements• USD inflationary growth from 2022 onwards, in-line with prior guidance
Opexper site
• Decrease of c.3% in 2021 driven by lower power opex• Flat opex per site from 2022 onwards, in-line with prior guidance
SG&A • USD inflationary growth + c.$3m growth investment in 2021• USD inflationary growth from 2022 onwards, in-line with prior guidance
Capex• Targeting $110 – 140m capex in 2021, of which $20 - $25m non-discretionary capex• Medium term driven by c.$125k per new BTS and $10k per colocation tenant and non-discretionary capex
growing with site count, in-line with prior outlook
New
mar
kets
Senegalconsiderations
• 1,220 sites deliver initial annualised revenues of $38m and Adjusted EBITDA of $19m• $215m capex reflecting acquisition and expansion in 2021• Anticipated closing H1 2021, with 400 committed BTS to be rolled over the next five years
Medium term tenancy roll-out expectations for existing markets unchanged, with further growth anticipated through Senegal acquisition