Embed Size (px)
Citation preview
© 2007 Pearson Education
The logical relationship between the start and finish of one activity and the start and finish of another activity.
Four logical relationships between tasks1. Finish to Start2. Finish to Finish3. Start to Start4. Start to Finish
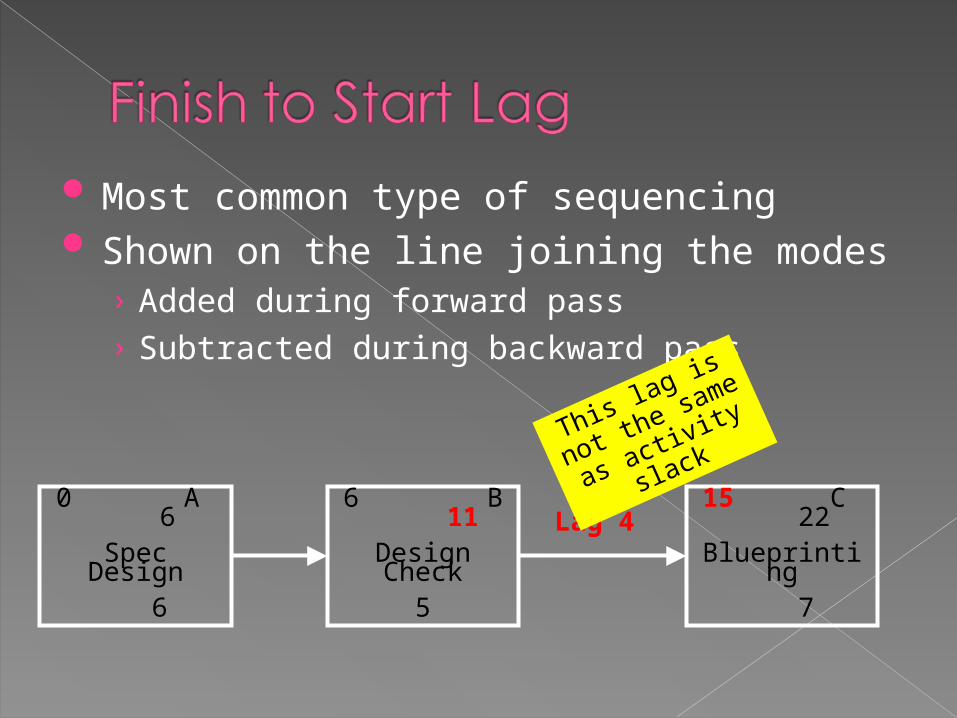
Most common type of sequencing Shown on the line joining the modes
› Added during forward pass› Subtracted during backward pass
0 A 6Spec Design
6
6 B 11Design Check
5
15 C 22Blueprinting
7
Lag 4
This lag is not
the same as
activity slack
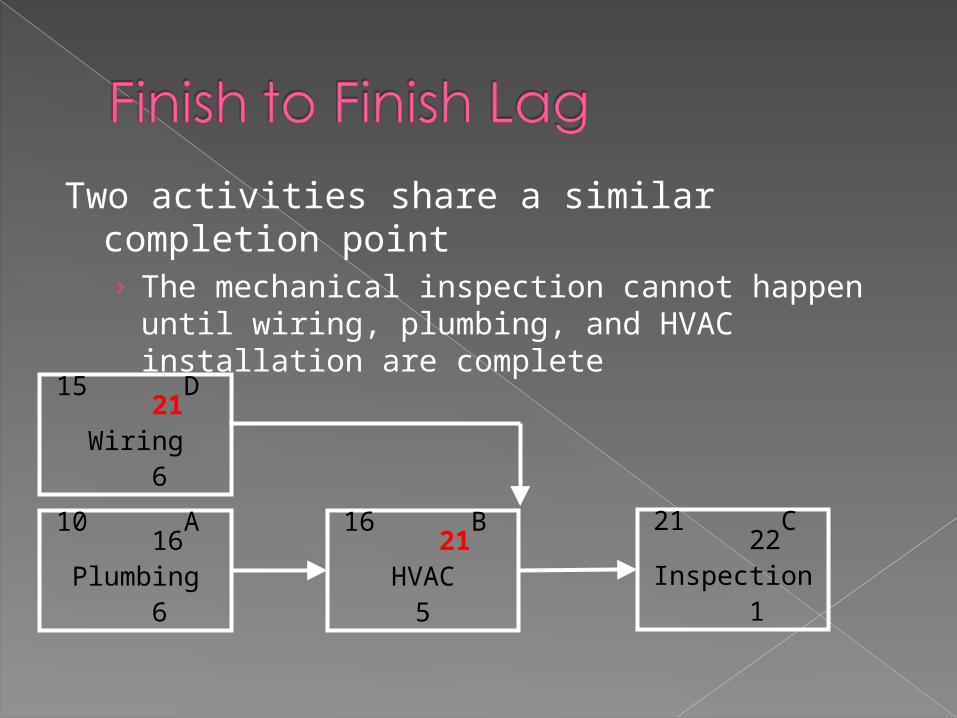
Two activities share a similar completion point› The mechanical inspection cannot happen
until wiring, plumbing, and HVAC installation are complete
10 A 16Plumbing
6
16 B 21HVAC
5
21 C 22Inspection
1
15 D 21Wiring
6
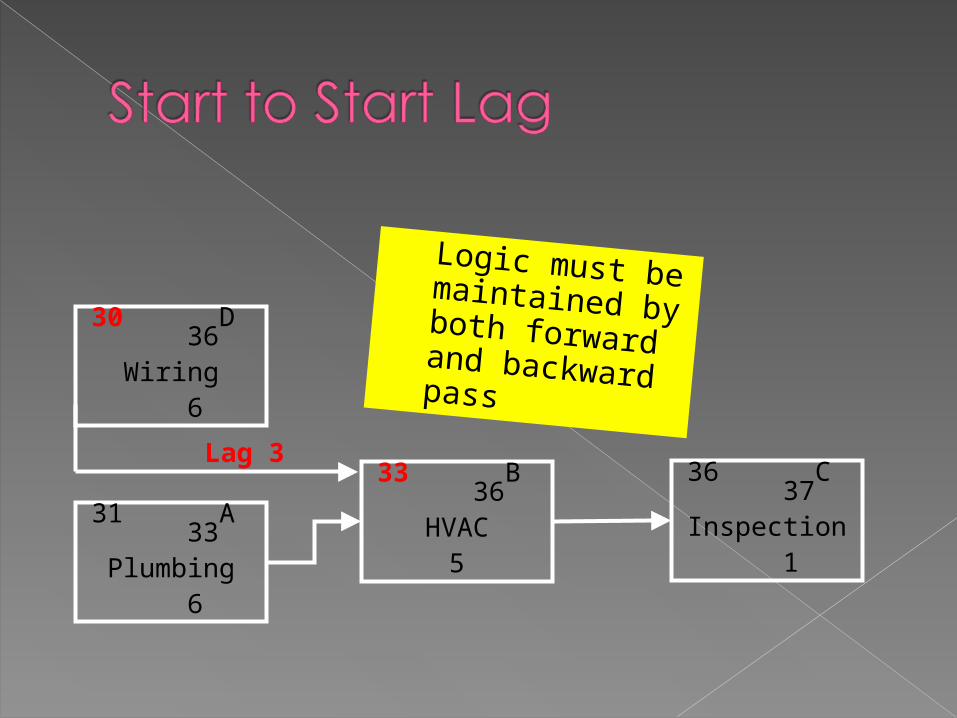
31 A 33Plumbing
6
33 B 36HVAC
5
36 C 37Inspection
1
30 D 36Wiring
6
Lag 3
Logic must be maintained by both forward and backward pass
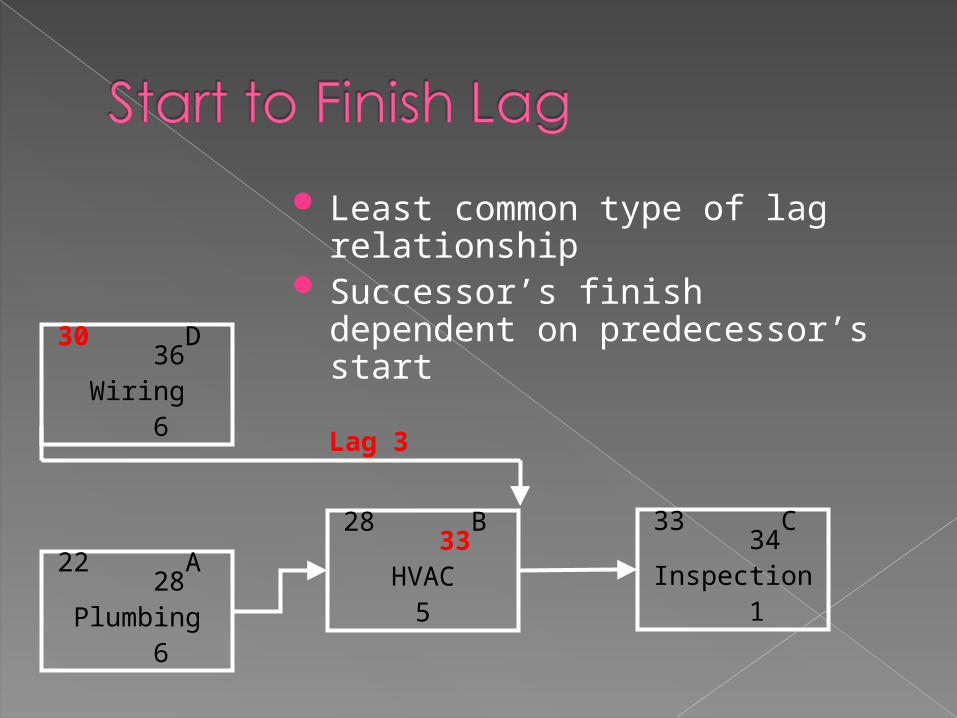
Least common type of lag relationship
Successor’s finish dependent on predecessor’s start
22 A 28Plumbing
6
28 B 33HVAC
5
33 C 34Inspection
1
30 D 36Wiring
6Lag 3
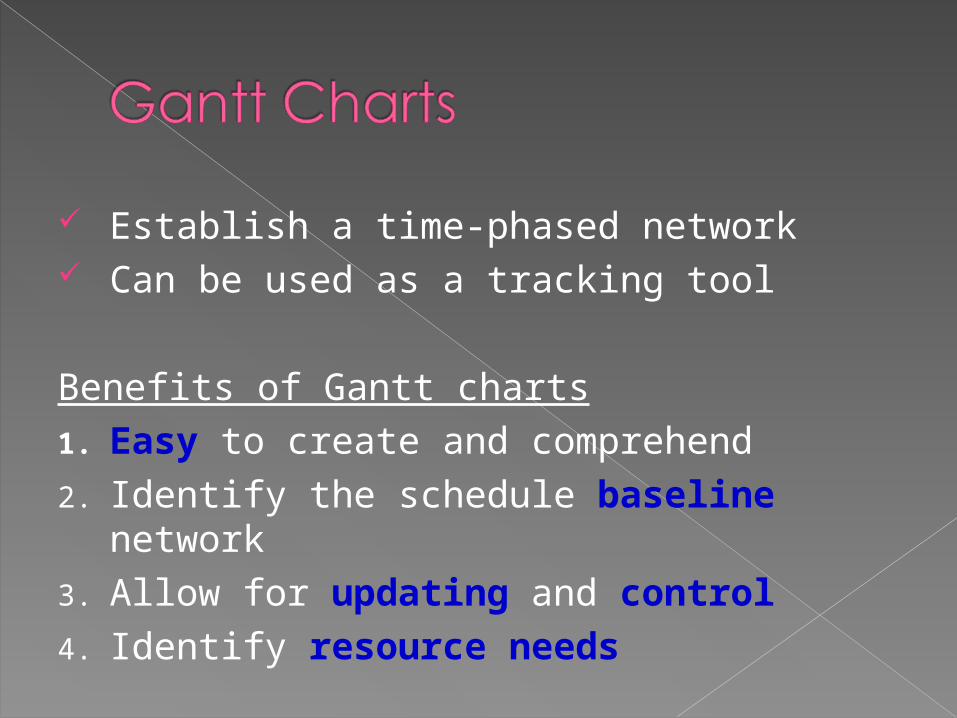
Establish a time-phased network Can be used as a tracking tool
Benefits of Gantt charts1. Easy to create and comprehend2. Identify the schedule baseline network3. Allow for updating and control4. Identify resource needs
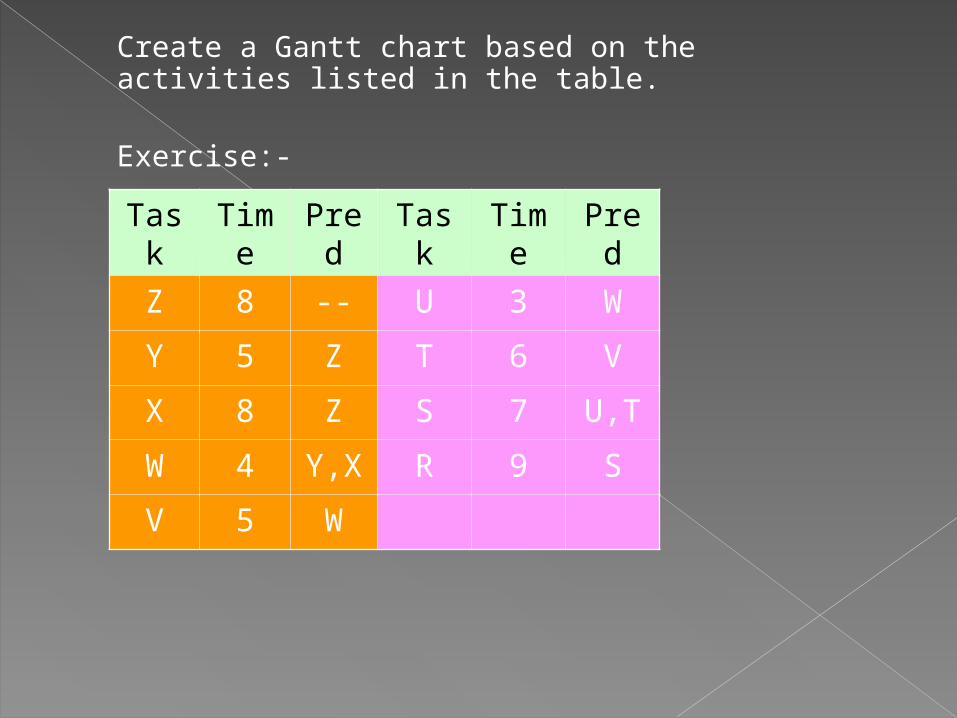
Create a Gantt chart based on the activities listed in the table.
Exercise:-
Task Time Pred Task Time Pred
Z 8 -- U 3 W
Y 5 Z T 6 V
X 8 Z S 7 U,T
W 4 Y,X R 9 S
V 5 W
Accelerating a project by committing more resources than initially planned
Principal methods for crashing Improving existing resources’
productivity Changing work methods Increasing the quantity of resources
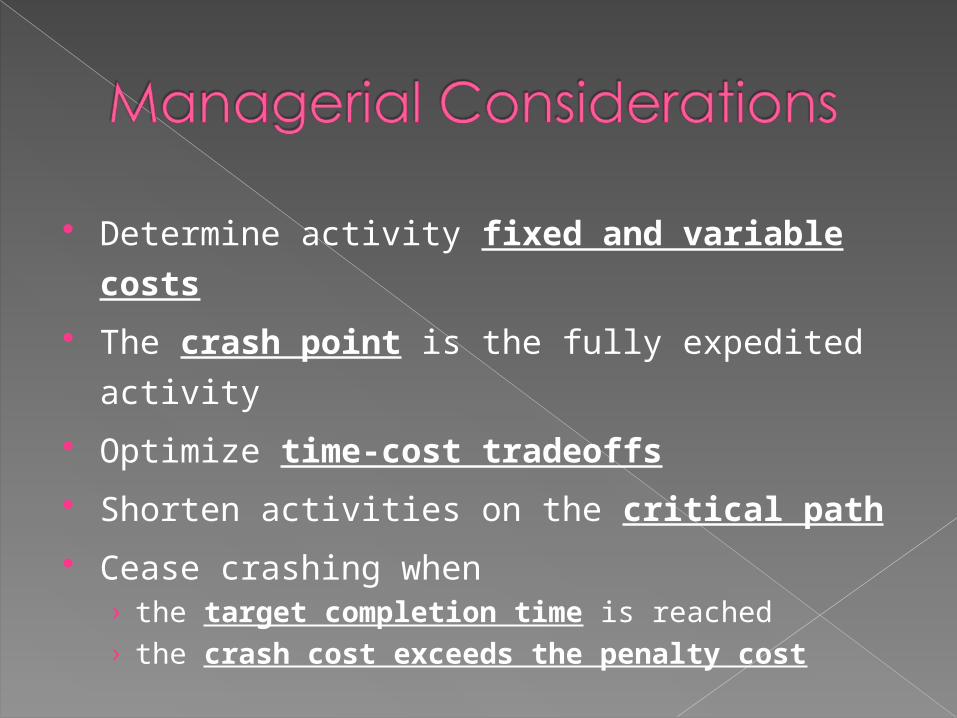
Determine activity fixed and variable
costs
The crash point is the fully expedited
activity
Optimize time-cost tradeoffs
Shorten activities on the critical path
Cease crashing when› the target completion time is reached› the crash cost exceeds the penalty cost
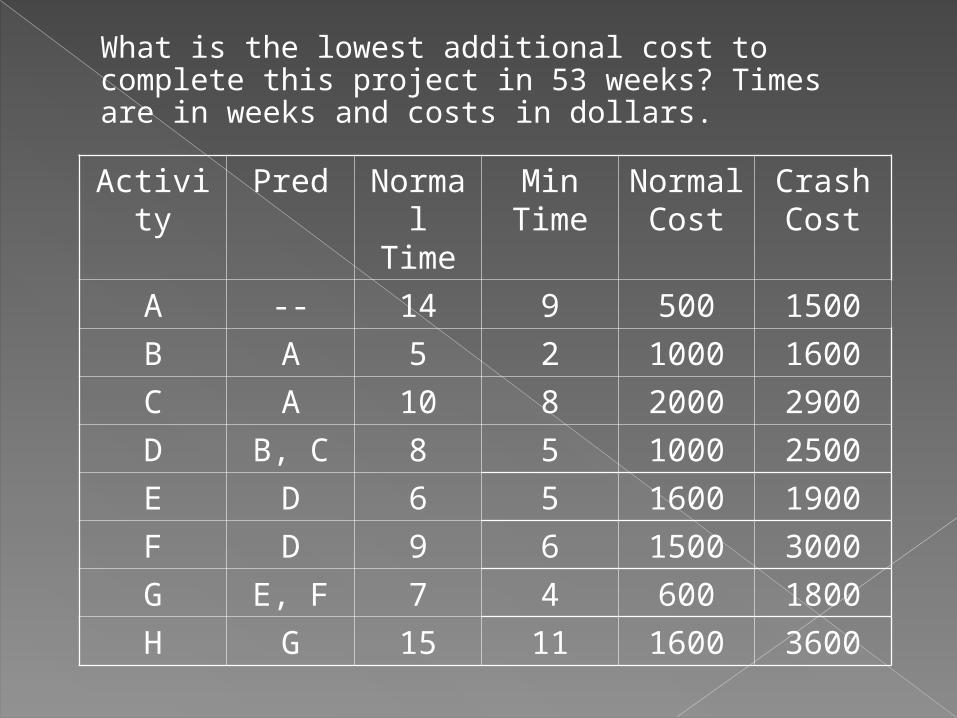
What is the lowest additional cost to complete this project in 53 weeks? Times are in weeks and costs in dollars.Activity Pred Normal
TimeMin
TimeNormal
CostCrash Cost
A -- 14 9 500 1500
B A 5 2 1000 1600
C A 10 8 2000 2900
D B, C 8 5 1000 2500
E D 6 5 1600 1900
F D 9 6 1500 3000
G E, F 7 4 600 1800
H G 15 11 1600 3600
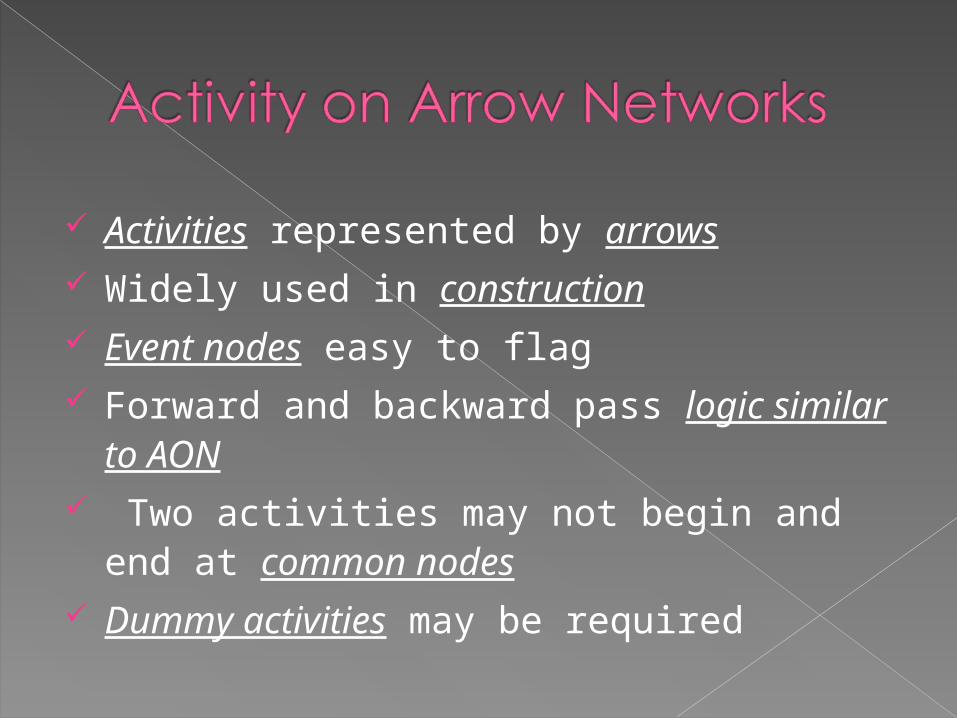
Activities represented by arrows Widely used in construction Event nodes easy to flag Forward and backward pass logic similar
to AON Two activities may not begin and end at
common nodes Dummy activities may be required
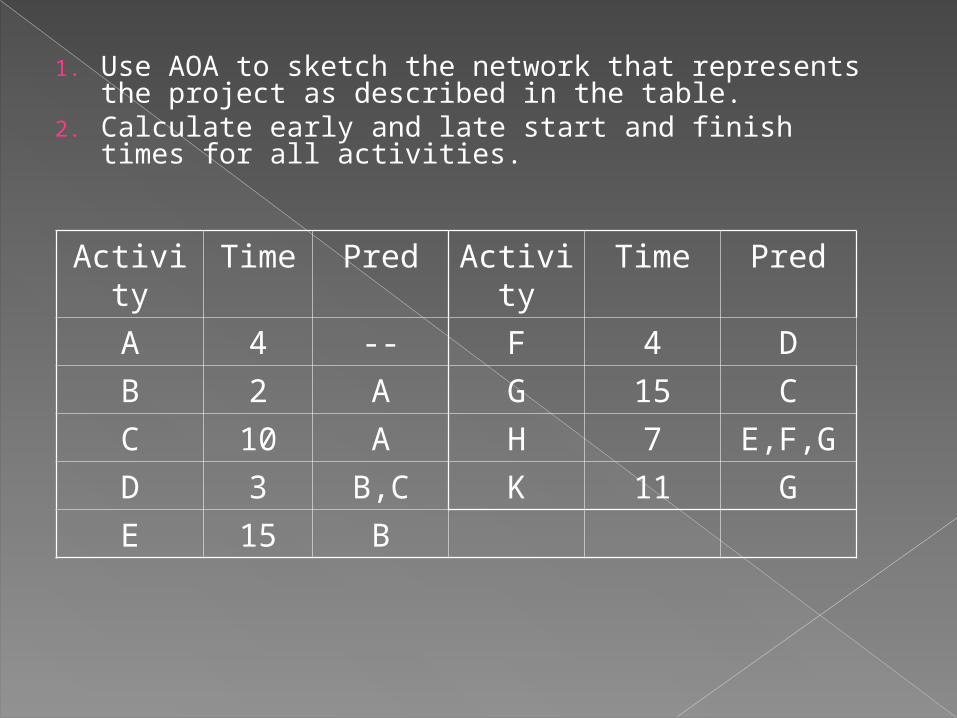
1. Use AOA to sketch the network that represents the project as described in the table.
2. Calculate early and late start and finish times for all activities.
Activity Time Pred Activity Time Pred
A 4 -- F 4 D
B 2 A G 15 C
C 10 A H 7 E,F,G
D 3 B,C K 11 G
E 15 B
Networks can be too complex
Poor network construction creates
problems
Networks may be used inappropriately
When employing subcontractors› The master network must be available to them› All sub-networks must use common methods
Positive bias exists in PERT networks