Embed Size (px)
Citation preview

College of Engineering
Department of Mechanical Engineering
Spring 2017-2018
Senior Design Project Report
Design of Dynamometer for Engine Testing
In partial fulfillment of the requirements for the Degree of Bachelor of Science in Mechanical
Engineering
Team Members
Student Name Student ID
1 Rayan Ababutain 201200459
2 Mohammed Abu Alsaud 201302399
3 Hassan Al wayal 201200150
4 Saleh Samhood 201201571
5 Ibrahim Aloreifej 201200230
Project Advisors: Dr. PANAGIOTIS SPHICAS, Dr. ESAM JASSIM
Advisor Name: Dr. PANAGIOTIS SPHICAS
Co-Advisor Name: Dr. ESAM JASSIM

2
Abstract
Strict emission regulations for vehicles and advances in automotive technology,
dictate the thorough testing of engines, fuels and emissions. In past work at PMU, a port fuel
injection engine was assembled and tested on biofuel blends. However, the engine was
operating on free load. To simulate the effect of load torque on the engine, in this project, we
design a break dynamometer. The dynamometer consists of a flange to mount on the PMU
engine, a break array, a strain gage, and protective covers. The students will have to perform
extensive stresses calculations and FEA analysis prior to manufacturing.

3
Acknowledgments
We are group of five mechanical engineering students, we have divided the work
based on strength and weaknesses of each member. One member is in charge of Solid Design
program, while others were in charge of Ordering parts, taking measurements, calculations,
and organization of the project report. In addition, the support of our project advisor can’t be
denied. The printed table of the portfolio will show the tasks each member.

4
List of Figures:
Figure 1.1 Parts getting assembled ................................................................. 8
Figure 2.1 Prony brake .................................................................................. 11
Figure 2.2 Rope break dynamomter.............................................................. 12
Figure 2.3 Eddy current dynamometer ......................................................... 13
Figure 2.4 Hyrdaulic dynamometer .............................................................. 14
Figure 2.5 Transmission dynamometer ........................................................ 15
Figure 3.1 Square key ................................................................................... 18
Figure 3.2 Shaft used for our dynamometer ................................................. 19
Figure 3.3 bearing design in solid works ...................................................... 20
Figure 3.4 shaft design in solid works .......................................................... 20
Figure 3.5 caliber stand with shaft, caliber and other parts .......................... 20
Figure 3.6 caliber stand with shaft, caliber and other parts(assembled) ....... 21
Figure 4.1 setup and location of sensors ...................................................... 21

5
List of Tables:
Table 1.1 parts ........................................................................................... 24 Table 4.1 speed motor of 4.4 ...................................................................... 24 Table 4.2 speed motor of 5.8 ..................................................................... 24 Table 4.3 speed motor of 6.4 ..................................................................... 24 Table 4.4 speed motor of 7.2 ..................................................................... 24 Table 4.5 speed motor of 8.7 ..................................................................... 24 Table 4.6 speed motor of 9.6 ..................................................................... 24 Table 4.7 speed motor of 10.2 ................................................................... 25 Table 4.8 speed motor of 11.7 ................................................................... 25 Table 4.9 motor @ 1727rpm ...................................................................... 25 Table 4.10 motor @ 1727rpm .................................................................... 26 Table 5.1 Duration of the tasks .................................................................. 27 Table 5.2 Tasks distribution ....................................................................... 28 Table 5.3 Table of activivites ..................................................................... 29 Table 5.4 List of materials ........................................................................ 31
6
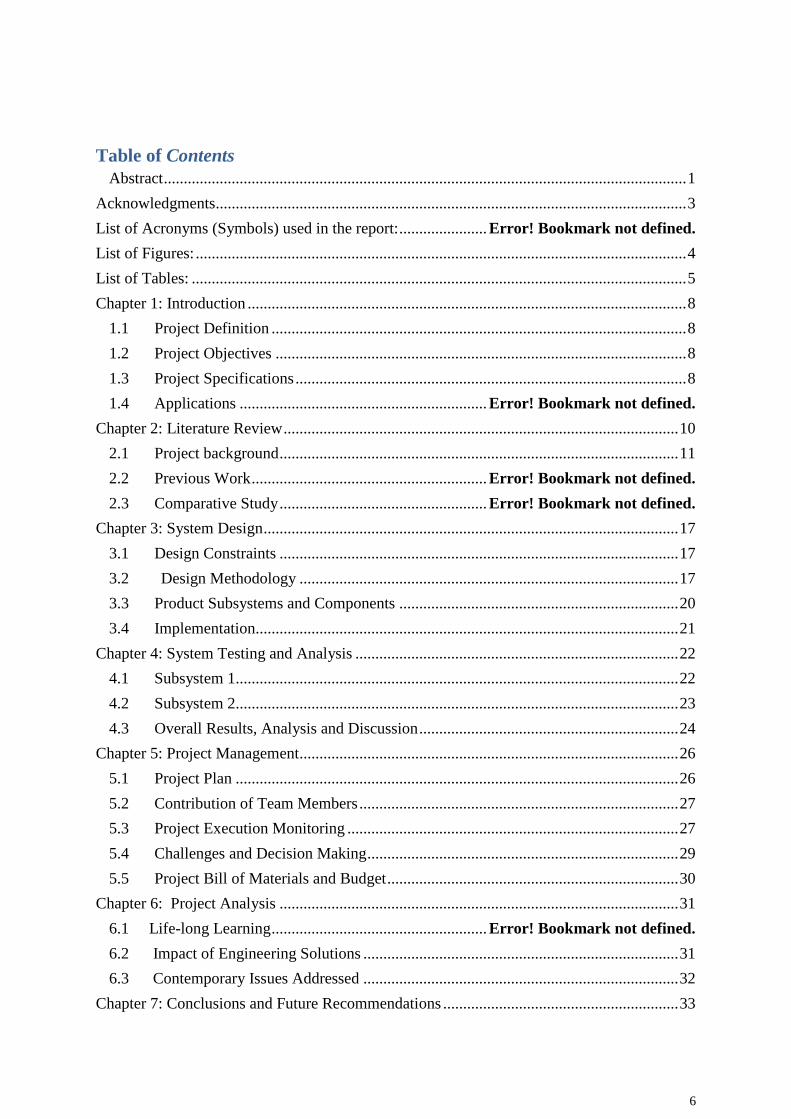
Table of Contents
Abstract ................................................................................................................................... 1
Acknowledgments...................................................................................................................... 3
List of Acronyms (Symbols) used in the report: ...................... Error! Bookmark not defined.
List of Figures: ........................................................................................................................... 4
List of Tables: ............................................................................................................................ 5
Chapter 1: Introduction .............................................................................................................. 8
1.1 Project Definition ........................................................................................................ 8
1.2 Project Objectives ....................................................................................................... 8
1.3 Project Specifications .................................................................................................. 8
1.4 Applications .............................................................. Error! Bookmark not defined.
Chapter 2: Literature Review ................................................................................................... 10
2.1 Project background .................................................................................................... 11
2.2 Previous Work ........................................................... Error! Bookmark not defined.
2.3 Comparative Study .................................................... Error! Bookmark not defined.
Chapter 3: System Design ........................................................................................................ 17
3.1 Design Constraints .................................................................................................... 17
3.2 Design Methodology ............................................................................................... 17
3.3 Product Subsystems and Components ...................................................................... 20
3.4 Implementation.......................................................................................................... 21
Chapter 4: System Testing and Analysis ................................................................................. 22
4.1 Subsystem 1............................................................................................................... 22
4.2 Subsystem 2............................................................................................................... 23
4.3 Overall Results, Analysis and Discussion ................................................................. 24
Chapter 5: Project Management ............................................................................................... 26
5.1 Project Plan ............................................................................................................... 26
5.2 Contribution of Team Members ................................................................................ 27
5.3 Project Execution Monitoring ................................................................................... 27
5.4 Challenges and Decision Making .............................................................................. 29
5.5 Project Bill of Materials and Budget ......................................................................... 30
Chapter 6: Project Analysis .................................................................................................... 31
6.1 Life-long Learning ...................................................... Error! Bookmark not defined.
6.2 Impact of Engineering Solutions ............................................................................... 31
6.3 Contemporary Issues Addressed ............................................................................... 32
Chapter 7: Conclusions and Future Recommendations ........................................................... 33

7
7.1 Conclusions ............................................................................................................... 33
7.2 Future Recommendations .......................................................................................... 35
8. References ......................................................................................................................... 36
Appendix A: Drawings ............................................................................................................ 37
8
Chapter 1: Introduction
1.1 Project Definition
This project is intended to design and manufacture a simple rotor test rig, where rotor faults
can be inserted and tested. The test rig is to be fitted with vibration sensors to enable
collecting data and use it to monitor the health of machines. The project is very important to
industry as through understanding the characteristics of failure, time and money will be
saved. This is also very important from the safety prospective as this will lead to a safe
operating environment for rotary machines.
This project is intended design a break dynamometer. The dynamometer consists of a
flange to mount on the PMU engine, a break array, a strain gage, and protective covers. The
students will have to perform extensive stresses calculations and FEA analysis prior to
manufacturing.
1.2 Project Objectives
1. Design and build a dynamometer (shaft, breaks, safety cover, bearings and housing)
2. Develop the instrumentation of the dynamometer (force gage, rotational speed meter
and optical temperature)
3. Test the dynamometer
4. Measure break engine power output
1.3 Project Specifications
The dynamometer can be used on any type of engine with only adjustments required
for the type of engine it’s going to be used on. The parts for dynamometer can be seen in
table 1.1 below.

9
Parts
Shaft
Brakes
Bearings
Tachometer
Optical thermometer
Force gauge
Disk
Shaft
Bearings
trolley
Safety cover
Caliper holder
Table 0.1 Parts
The above mentioned parts can be seen in the figure 1.1 below.

10
Figure 1.1(parts getting assembled)
To measure brake power, the angular speed and torque has to be measured. Therefore, the
rotor is driven by the engine under test by Hydraulic, mechanical or electromagnetic means.
1.4 Applications
The dynamometer can be used for many different applications. It can fit many criteria
to help people in certain areas. The following are the applications for dynamometer:
Test the IC engine
Measuring torque of any rotary member, just by coupling with the shaft of
dynamometer
Can be used as a speed controller or load controller

11
Chapter 2: Literature Review
2.1 Project background
Rolling element bearings are core components of our revolutionary life and developments.
They exist in almost all rotary machines, supporting their dynamic forces and facilitating
their rotation. The failure of a rolling element bearing may have a catastrophic consequence
on the machine if it went undetected and without follow-up. We attempt to monitor these
vital components through observing their temperature, noise, vibrations, oil wear debris etc.
Among all these monitored parameters, vibration signals have proven to be of great
assistance for maintenance personnel, not only in detecting the presence of a fault but also in
locating its source. Most recently, information from vibration signals has been used to
provide analysts with an idea about the size of the fault and consequently enable prediction of
the useful remaining life of the bearing (prognostics). However, vibrations picked up by
accelerometers have to go through a number of rigorous processing steps to enable extraction
of the fault symptoms and identification and quantification of fault size.
Mechanical force gauge
Mechanical force gauge is an instrument that used to measure both compression and tension
force for both ways pulling or pushing. Depends of the vendor product, its considered as a
highly accurate tool to measure the mentioned forces above also it measure Peak force by
using the peak indicator needle and depends on the weight of the attached item.
1- Spring gauge :
It’s a type of weighing scale which is a device to measure mass and this spring made of a fixe
spring at on side with hook to attach an object at the other, this spring works by Hooke's Law
( F= KX) where K represent constant factor characteristic of the spring and X represent the
distance. On the other hand, spring force gauge can only measure weight and can't measure
mass. Moreover, A spring gauge can only scan properly in a very frame of
reference wherever the acceleration within the spring axis is constant, for example on
12
earth, wherever the acceleration is as a result of gravity).Also, spring gauge have different
sizes, in general small size that measure newton will have a less fixed grip on the spring than
the larger size that can be measure thousands and tens of newton’s or even more than that and
that depends on the scale that you use. In fact, the largest spring gauges measurement can be
ranged from 5000 to 8000 newton.
2- Deformation gauge:
Knows also as strain gauge , it convert force weight , tension and pressure into in to
electrical resistance that can be measure. When you applied external forces to a fixed object
strain and stress are the result. A typical gauge arranges an
extended, skinny conductive strip during a zigzag pattern of parallel lines. This doesn't
increase the sensitivity, since the percentage modification in resistance for a given strain
for the complete zigzag is that the same as for any single trace. However, one linear trace
would need to be very thin and therefore at risk of over warming (which
would each modification its resistance and cause it to expand), or would got to be operated
at a far lower voltage, creating it tougher to measure resistance changes accurately.
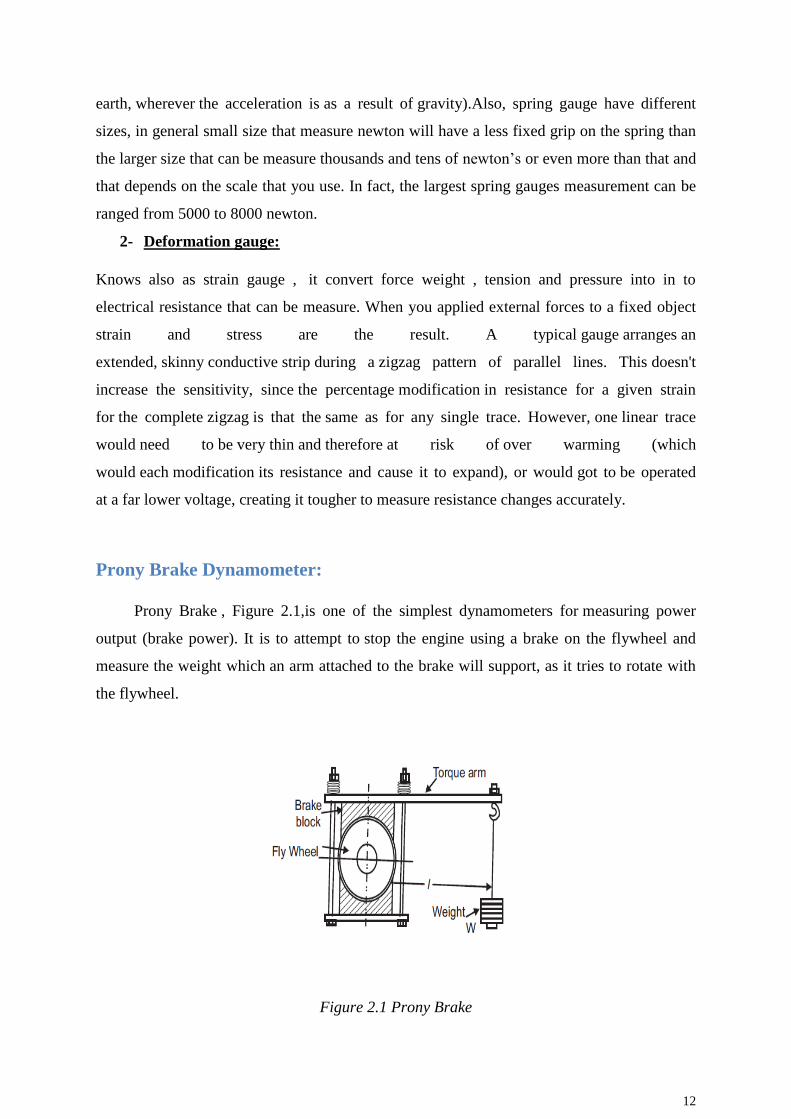
Prony Brake Dynamometer:
Prony Brake , Figure 2.1,is one of the simplest dynamometers for measuring power
output (brake power). It is to attempt to stop the engine using a brake on the flywheel and
measure the weight which an arm attached to the brake will support, as it tries to rotate with
the flywheel.
Figure 2.1 Prony Brake

13
The Prony brake shown in the above consists of a wooden block, frame, rope, brake
shoes and flywheel. It works on the principle of converting power into heat by dry friction.
Spring-loaded bolts are provided to increase the friction by tightening the wooden block. The
whole of the power absorbed is converted into heat and hence this type of dynamometer must
the cooled.
Rope Brake Dynamometer:
Rope brake dynamometer is used to measuring the power of the engine shaft. And it
contains a shaft that will measure the power from rotating the shaft. Also, it has ropes which
are one rope connecting to a spring balance and the other rope attached with the weight. So,
this kind of dynamometer it basically works on principle of absorption of power. It has rope
tights on brake drum and then the rope will stop the brake drum, when brake drum has
stopped then the spring balance will show the reading. A rope break dynamometer can be
seen in the figure 2.2 below.
Figure 2.2 Rope Brake Dynamometer
The brake power is given by the formula
Brake Power (bp) = π DN (W − S)
Where D is the brake drum diameter, W is the weight of the load and S is the spring balance
reading.
14
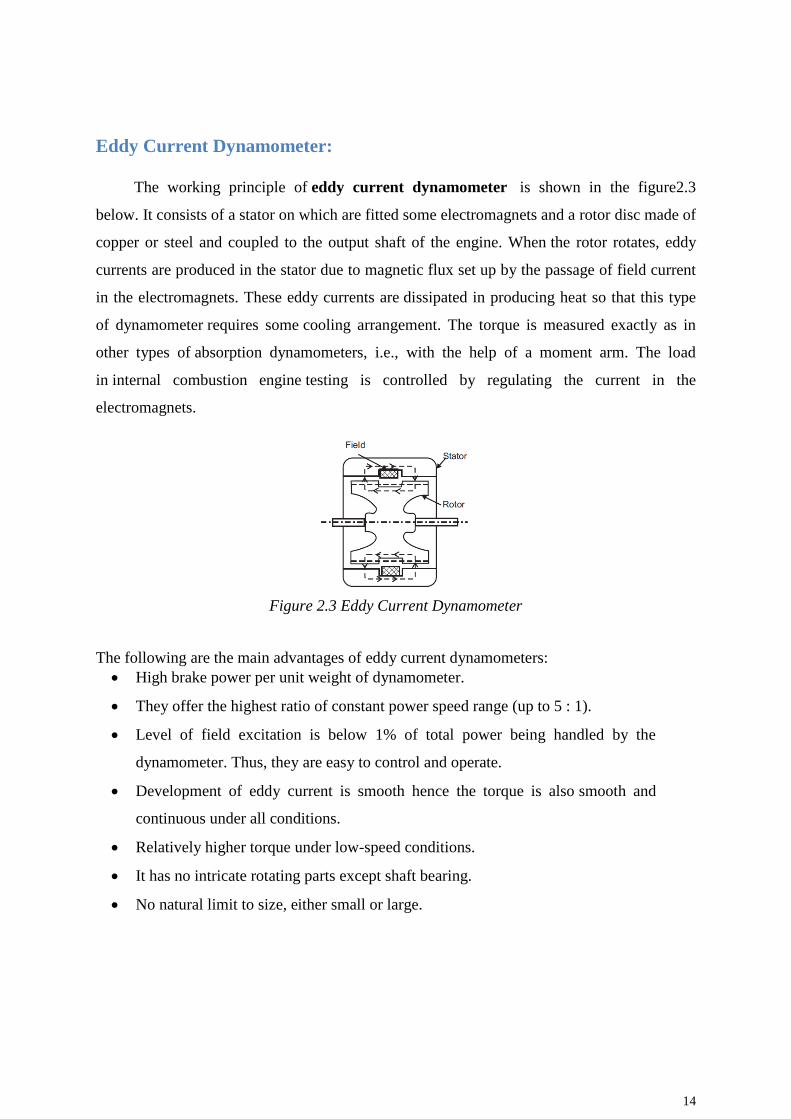
Eddy Current Dynamometer:
The working principle of eddy current dynamometer is shown in the figure2.3
below. It consists of a stator on which are fitted some electromagnets and a rotor disc made of
copper or steel and coupled to the output shaft of the engine. When the rotor rotates, eddy
currents are produced in the stator due to magnetic flux set up by the passage of field current
in the electromagnets. These eddy currents are dissipated in producing heat so that this type
of dynamometer requires some cooling arrangement. The torque is measured exactly as in
other types of absorption dynamometers, i.e., with the help of a moment arm. The load
in internal combustion engine testing is controlled by regulating the current in the
electromagnets.
Figure 2.3 Eddy Current Dynamometer
The following are the main advantages of eddy current dynamometers:
High brake power per unit weight of dynamometer.
They offer the highest ratio of constant power speed range (up to 5 : 1).
Level of field excitation is below 1% of total power being handled by the
dynamometer. Thus, they are easy to control and operate.
Development of eddy current is smooth hence the torque is also smooth and
continuous under all conditions.
Relatively higher torque under low-speed conditions.
It has no intricate rotating parts except shaft bearing.
No natural limit to size, either small or large.

15
Hydraulic Dynamometer:
Hydraulic dynamometer is the devices that used to measure power output. It specified
to use with oil and water. A hydraulic dynamometer working about rotating disk that rotates
during the operation and the rotating disk connecting with a shaft. Which is also the engine
shaft will rotating and we want to measure the output power of the engine shaft. At that time
the oil go inside the chamber to rotate casing. So, then we can measure the amount of torque.
A hydraulic dynamometer as shown in the figure 2.4 below works on the principle of
dissipating the power in fluid friction rather than in dry friction.
Figure 2.4 Hydraulic Dynamometer
In principle, hydraulic dynamometer construction is similar to that of a fluid
flywheel.
Hydraulic dynamometer consists of an impeller or inner rotating member
coupled to the output shaft of the engine.
The impeller in this dynamometer rotates in a casing filled with a fluid.
Due to the centrifugal force developed in the outer casing, tends to revolve with
the impeller, but is resisted by a torque arm supporting the balance weight.
The frictional forces generated between the impeller and the fluid are
measured by the spring balance fitted on the casing.
The heat developed due to the dissipation of power in Hydraulic dynamometer is
carried away by a continuous supply of the working fluid.
16
The output power can be controlled by regulating the sluice gates which can be
moved in and out to partially or wholly obstruct the flow of water between the
casing and the impeller.
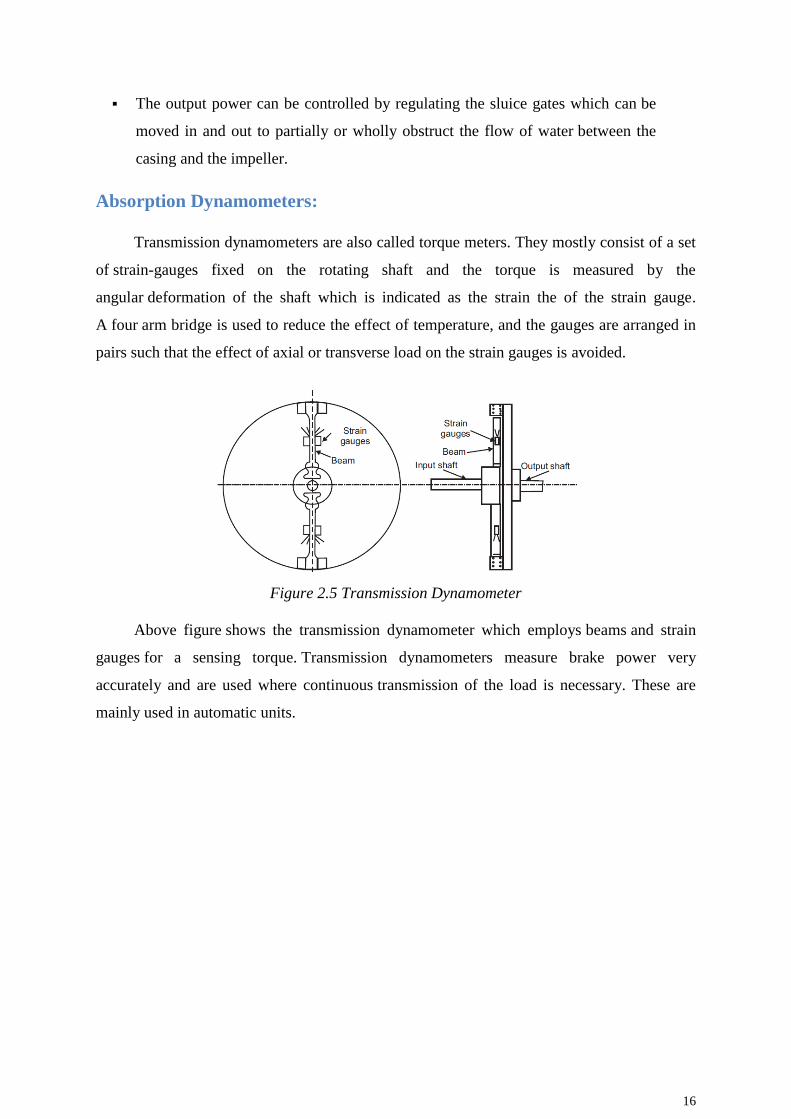
Absorption Dynamometers:
Transmission dynamometers are also called torque meters. They mostly consist of a set
of strain-gauges fixed on the rotating shaft and the torque is measured by the
angular deformation of the shaft which is indicated as the strain the of the strain gauge.
A four arm bridge is used to reduce the effect of temperature, and the gauges are arranged in
pairs such that the effect of axial or transverse load on the strain gauges is avoided.
Figure 2.5 Transmission Dynamometer
Above figure shows the transmission dynamometer which employs beams and strain
gauges for a sensing torque. Transmission dynamometers measure brake power very
accurately and are used where continuous transmission of the load is necessary. These are
mainly used in automatic units.

17
Chapter 3: System Design
3.1 Design Constraints and Design Methodology
Geometrical Constraints
Calculations has been done to design our project are bearing life, volume and mass of the
shaft, radial load, and key dimensions.
Sustainability
Based on design and material property standards, we expect a sustainable system.
Social and Environmental
Dynamometers are important technology that effect social communication through the
automobile industry, and environmentally by reducing the consumption of fuel in these types
of systems.
Manufacturability
Dimension and solidwork design will be given to the workshop to execute and manufacture
the parts.
Safety
Our system will be covered by heavy plastic to avoid injuries while running tests.
3.2 Engineering Design standards
Engine testing (Engine power code: J2723-_201509)
Shaft standard (Steel AISI1020)
Bearing
Caliber
Caliber stand
Table

18
3.3 Theory and Theoretical Calculations
Where:
Lₗ₀: Bearing life
LR: Desired life, hours
Cₗ₀: Catalog rating life
N: revolution per minute
Fe: equivalent steady radial load
Volume of shaft:
𝑣 = 𝜋𝑟2𝐿 (Eq. 1.1)
𝑣 = 𝜋(0.025𝑚)2(1𝑚) = 1.9625 × 10⁻³𝑚3
Mass of Shaft:
𝑚 = 𝜌 × 𝑣 (Eq. 1.2)
𝑚 = 7872𝑘𝑔
𝑚3× 1.9625 × 10−3𝑚3 = 15.45𝑘𝑔
Radial load
𝐹ᵣ =𝑇
𝑟 (Eq. 1.4)
𝐹ᵣ = 143 𝑁.𝑚
0.025 𝑚= 5720 𝑁
Steady equivalent radial load Fe
Fe = X₂ V Fᵣ + Y₂ Fₐ (Eq. 1.3)
𝐹𝑎
𝐶0 =
5720 𝑁
19.6 𝑥103 𝑁= 0.29 which e is between 0.28 and 0.42
Interpolating for e
0.42−0.28
0.42−0.29 =
0.42− 0.38
0.42 − 𝑥 = e= 0.384
𝐹𝑎
𝑉∗Fᵣ =
5720
1∗15.45𝑥103 = 0.37 so Y₂ = 1
Fe = X₂*V*Fᵣ + Y₂*Fₐ = 0.56(1) (15.45x10³) + 1(5720) = 14823.9 KN

19
Bearing life
Lₗ₀ = LR
60(𝑁)(
C10
𝐹𝑒)ᵌ (Eq. 1.4)
Final calculation for bearing life:
Cₗ₀ = 35.1 KN
C₀ = 19.6 KN
N: Revolution per minute RPM= 7000
Fe = 14824.9 KN
a = 3 because it is ball bearing
Lₗ₀ = 106
60(7000)∗ (
35100
14823.9) ᵌ = 316.07 ℎ
Key Calculation
The UNS steel shaft is G10350,heat-treated to minimum yield strength has a radius of
25mm.the shaft rotates at 7000RPm and transmits 143Nm through a gear. So select an
appropriate key for the gear. The key can be seen in the figure 3.1 below.
Figure 3.1: 2.024 mm square key
A 2.024-mm square key is selected, UNS G10200 cold-drawn steel being used .The design
will be based on yield strength of 455MPa. A factor of 2.80 will be employed in the absence
of exact information about the nature of the load. The torque is obtained from the horsepower
equation.
Angle of speed w= 70000*2/60= 733.04rad/s

20
T=143/733.04=0.195Nm
Force at surface of the shaft is
F=T/r=0.195/0.025=7.8N
By the distortion-Energy theory, Ssy will be
Ssy=0.577*Sy
Ssy=0.577*455=262,535
Failure by shear a cross and will create a stress of t=F/L substituting the strength divided by
the factor of safety for t gives
Ssy/n = F/t l
which it is 262.535*10^6/2.80=7.8/0.01 L
so L=8.31*10^-6mm
To resist crushing, the area of one-half the face of the key is used :
Sy/n= F/t l /2
which it is 455*10 ^6/2.8=7.8/0.01*L/2
L=9.6*10^-6mm
The shaft was carefully manufactured after the calculations and hence it can be seen in the
figure 3.2 below:
Figure 3.2: Shaft used for our dynamometer
21
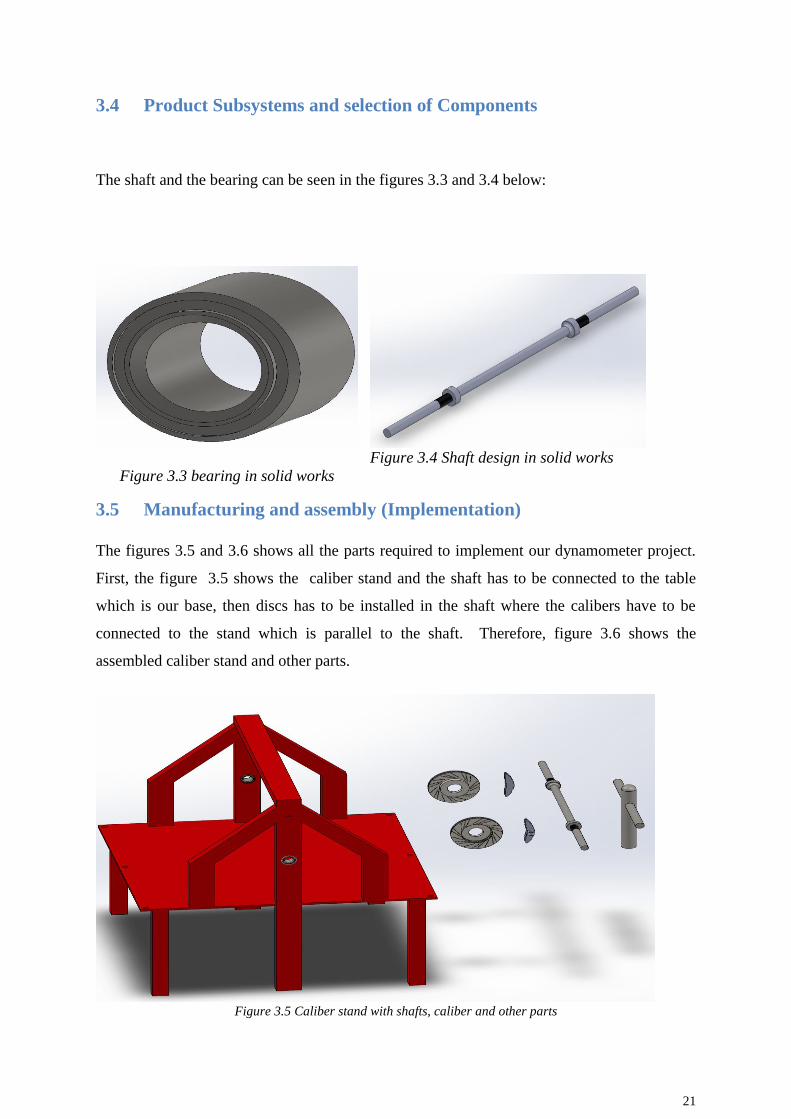
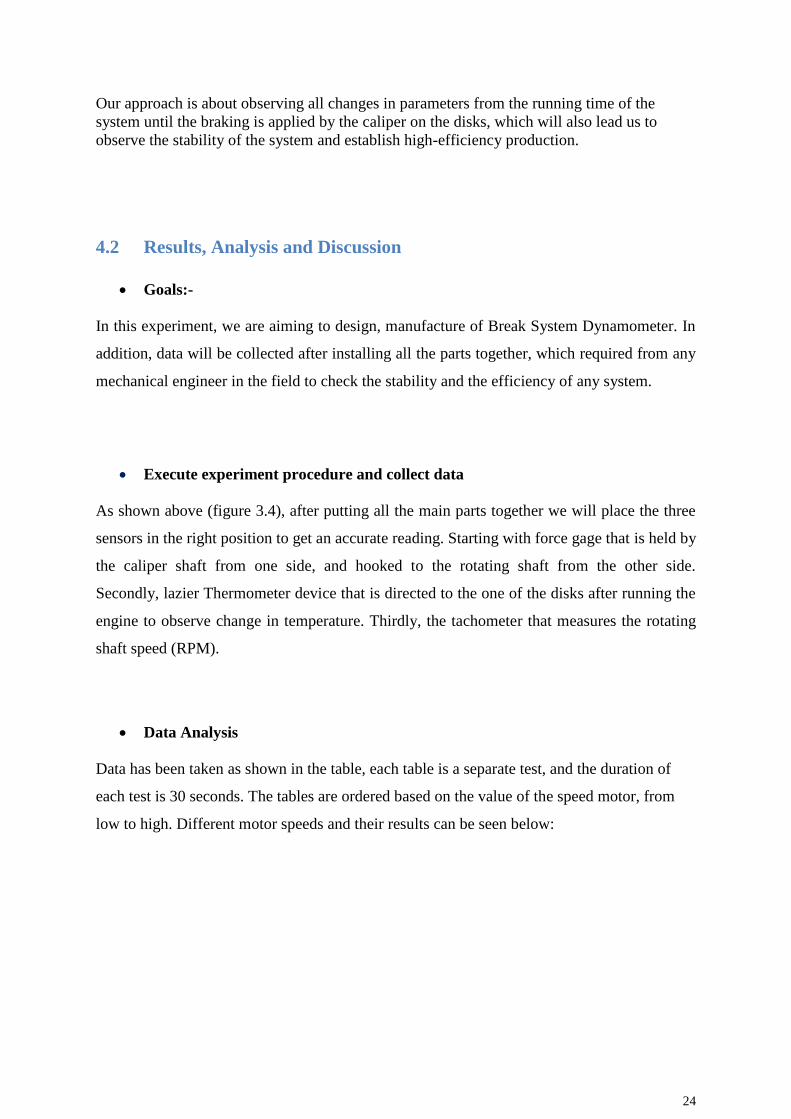
3.4 Product Subsystems and selection of Components
The shaft and the bearing can be seen in the figures 3.3 and 3.4 below:
Figure 3.4 Shaft design in solid works
Figure 3.3 bearing in solid works
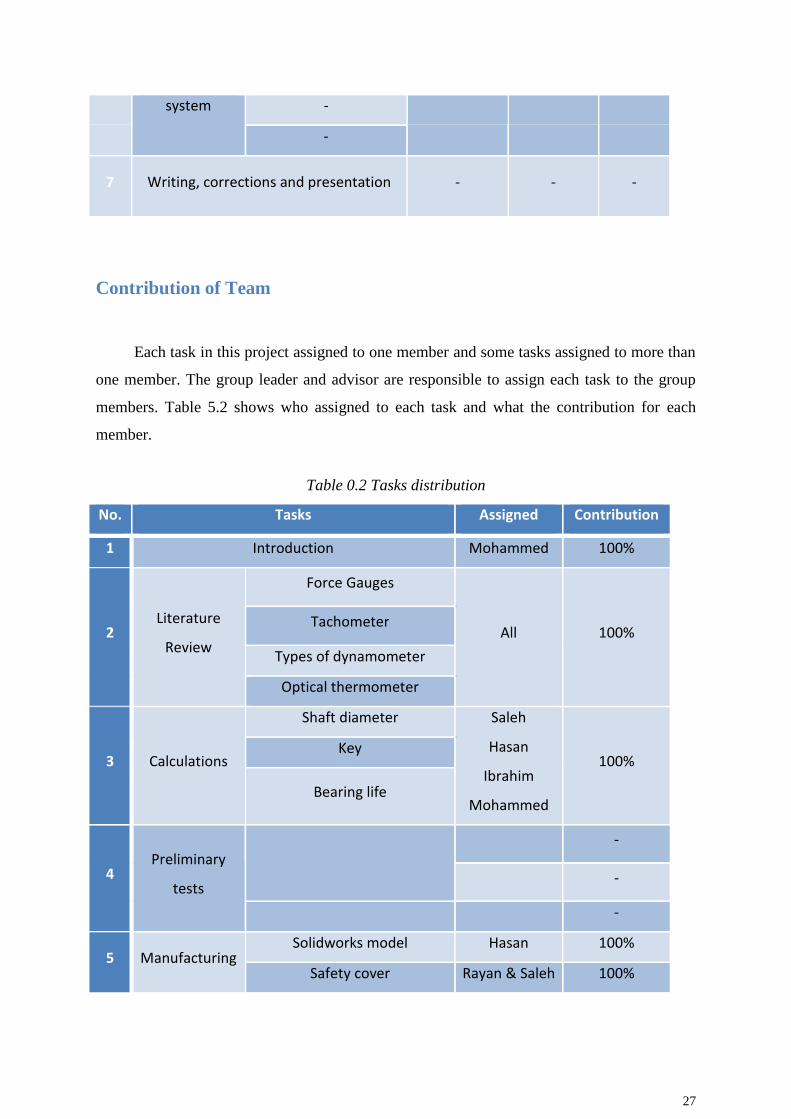
3.5 Manufacturing and assembly (Implementation)
The figures 3.5 and 3.6 shows all the parts required to implement our dynamometer project.
First, the figure 3.5 shows the caliber stand and the shaft has to be connected to the table
which is our base, then discs has to be installed in the shaft where the calibers have to be
connected to the stand which is parallel to the shaft. Therefore, figure 3.6 shows the
assembled caliber stand and other parts.
Figure 3.5 Caliber stand with shafts, caliber and other parts

22
Figure 4.1: Setup & Location of Sensors
Figure 3.6 (Assembled) Caliber stand with shafts, caliber and other parts
Chapter 4: System Testing and Analysis
4.1 Experimental Setup, Sensors and data acquisition system
The setup of the dynamometer can be seen in figure 4.1 below:
List the specification of the sensor and explain why you chose them.
Force gage specification:
Digital professional hanging scale up to 300kg

23
Accurate reloading spring sensor
Large 2” backlight display
Sturdy built aluminum body
Stainless steel rotary hook, shackle
Mode function (Ib/kg/n)
Weight data hold, tare function
Low battery indication, auto-off
2 AAA batteries included
Net weight 22oz/620g
Assembled in P.R.C.
Designed by Modern step in California, www.mscranescale.com
Tachometer specifications
Measures the rotational speed with visibale red light beem from a powerful LED
High intensity class II laser measures from 2.5 - 99,999 RPM
Extra-large 5-digit LCD display, high accuracy of +/- 0.05%
Auto zero adjustment, stores last, minimum, and maximum readings
Can be used for HVAC applications in measuring fan speed
Powered by 4 x AA battery
Size: 180 x 72 x 37mm (7.0 x 2.8 x 1.5 inch)
Thermometer specification
Measurement range: -50 to 650°C (-58 to 1202°F)
Accuracy: ± 2°C
Emissivity: fixed, 0.95
Field of View: D/S=Approx. 12:1 ratio (D: Distance; S=Spot or Target)
Response time: Less than 1s
Diode laser: output < 1mw at 630-670mm class 11 laser produce
Display: LCD Backlight
Auto Power Shut Off: YES, 7s
Low Battery Indication: YES
Reasons of chosen Sensor Devices:
Force Gage: it’s required for us to measure pulling force through this device
Tachometer: it’s required to measure speed of rotating the shaft RPM
Thermometer: it’s required to measure the changing temperature of disks
The limited performance of the devices fits our need
Due to our limited budget we chose smartly to get best quality with low price
Testing parameters and approach:
Temperature – Rotation Speed – Pulling Force – Efficiency of the System
24
Our approach is about observing all changes in parameters from the running time of the
system until the braking is applied by the caliper on the disks, which will also lead us to
observe the stability of the system and establish high-efficiency production.
4.2 Results, Analysis and Discussion
Goals:-
In this experiment, we are aiming to design, manufacture of Break System Dynamometer. In
addition, data will be collected after installing all the parts together, which required from any
mechanical engineer in the field to check the stability and the efficiency of any system.
Execute experiment procedure and collect data
As shown above (figure 3.4), after putting all the main parts together we will place the three
sensors in the right position to get an accurate reading. Starting with force gage that is held by
the caliper shaft from one side, and hooked to the rotating shaft from the other side.
Secondly, lazier Thermometer device that is directed to the one of the disks after running the
engine to observe change in temperature. Thirdly, the tachometer that measures the rotating
shaft speed (RPM).
Data Analysis
Data has been taken as shown in the table, each table is a separate test, and the duration of
each test is 30 seconds. The tables are ordered based on the value of the speed motor, from
low to high. Different motor speeds and their results can be seen below:

25
Motor Speed & Power
o
Mototr Speed & Torque
Motor Speed & Torque

26
Chapter 5: Project Management
Project Plan
We worked as a group for this project and we only have few months to build and test it. Here
you can see table 5.1 which provides detailed presentation of the duration of the different
tasks during the life of project.
Table 0.1 Duration of the tasks
No. Tasks Start Date Finish Date Duratio
n
1 Introduction March 5, 18 March 7,
18 3 Days
2 Literature
Review
Force gages
February 8,
18
February
11, 18 4 Days
Tachometer
Optical Thermometer
Types of
dynamometer
3 Calculations
Shaft Diameter February 18,
18
February
28, 18 10 Days Key
Bearing
4 Preliminary
tests
-
-
5 Manufacturing
Shaft
March 26, 18 April 18,18 23 Days Trolley
Safety cover
Caliper holder
6 Test the - April 24, 18 April 30, 18 7 Days
27
system -
-
7 Writing, corrections and presentation - - -
Contribution of Team
Each task in this project assigned to one member and some tasks assigned to more than
one member. The group leader and advisor are responsible to assign each task to the group
members. Table 5.2 shows who assigned to each task and what the contribution for each
member.
Table 0.2 Tasks distribution
No. Tasks Assigned Contribution
1 Introduction Mohammed 100%
2 Literature
Review
Force Gauges
All 100% Tachometer
Types of dynamometer
Optical thermometer
3 Calculations
Shaft diameter Saleh
Hasan
Ibrahim
Mohammed
100% Key
Bearing life
4 Preliminary
tests
-
-
-
5 Manufacturing Solidworks model Hasan 100%
Safety cover Rayan & Saleh 100%

28
Shaft & Hasan
Caliper holder
Trolley
6 Test the
system
-
- - -
7 Writing, corrections and presentation Rayan &
Mohammed -
Project Execution Monitoring
We had many activities during our project period. Some of the activities are continuous
and some of them are taking place only one time. Table 5.3 shows the time for each activity.
Table 0.3 Table of activities
Time Activities
Two times a week Assessment class
Weekly meeting With group members
weekly meeting With advisor
Thu, March 29 Midterm presentation
Preliminary test
Test the system
Final presentation

29
Challenging and Decision Making
During working on our project we have faced some difficulties such as: Throughout our
senior project period we faced many difficulties and challenges such as:
1. Material and equipment resourcing (purchasing).
2. Design problems.
3. Report writing and document.
5.1.1 Material and equipment resourcing (purchasing)
1- Thermometer
2- Disk
Our project needs many things to purchase either from local stores or international stores.
We faced a variety of difficulties when we start purchasing the parts that we need. Some
difficulties were:
International stores.
one of the measurement devices is that the thermometer we fine it in international
stores and we chose the good device that fit with our project but when we order it they
said it cannot be shipped to Saudi Arabia then we tried to find another one until we
found a device from china but it will take more time than the other devices but we
don’t have a choice, so we ordered it from china and It arrived before the test time
5.1.2 Design problems
One of the main challenges that we faced is that finding good disk that have a
diameter above the minimum number so we were about buying truck’s disks until we
found a car disk that has required diameter. On the other hand, we designed a shaft
with required diameter but the disks have grove so we needed to redesign the shaft
with making grove on the shaft to fit with disks.

30
5.1.3 Report writing and document
When we start writing the report every member writes a part and everyone has different
ability than others. We found some mistakes that might affect the value of report, so we make
a plan to fix them by some process such as:
1- Read each other part’s and fix the mistakes.
2- Our advisor take a place to find some mistakes and help us to fix it.
3- Give the co-advisor some parts to take a look on it if need to fix.
By doing these process we get benefited of advisor and co-advisor experience to
decrease the mistakes.
Project Bill of Materials and Budget
Table 5.4 provides the costs of all the material and equipment that we have purchased and
manufactured.
Table 0.4 List of material and their cost
Materials Cost (SR)
Tachometer 71
Optical thermometer 71
Force gauge 180
Disk 600
Shaft 850
Bearings 100
trolley 600
Safety cover -
Caliper holder -
Total -

31
Chapter 6: Project Analysis
6.1 Life Long Learning
In this project we have learned and increase the level of knowledge, skills and
experiences. Working in a group have taught us how to work in limited time with many tasks,
and using communication skills. We gained different things of skills, experience, and
knowledge. What we have learned during our project will be divided into some section to me
explained more.
6.1.1 Improve our Skills in Some Software Tools
Every university student knows how to use software tools. In our projects we need to
use some software such as: solid work, Microsoft word, Microsoft PowerPoint, and excel. All
of us knows how to use them but for our project we used it in professional ways and we get
improved our skills on them.
6.1.2 Time Management Skill
We always hear about time management and how it is important for projects life. In
this project we apply what we have learned about time management to achieve the project
objective on time. There are many tasks and they have specific time to be submitted. When
we start working for the project we gave each member a task to do it and finish it before the
time. These challenges gave us a great skill to manage the time. We had something called
GANTTS chart which include each task with its time so it make them easier to be achieved
during project’s life. It was very useful by showing us the start and end time.
6.1.3 Problem Solving
Every one or group will face some problems while doing projects. While we worked on
the project we faced some problem that need to be solved. By solving these problems we
gained some new knowledge, skills, and experience of how we solved them. We faced some
32
problems while working on our project such as: purchasing right tools, finding workshop, and
designing good parts.
6.2 Impact of Engineering Solutions
Our project achieved great impact on the society, environment, and economy. We will
explain the impact of each of them in details.
6.2.1 Society
While doing projects people have to think about what is the benefit of the project to
society. One of the targets that we want to provide is a good impact on society. One of the
uses of our project is to test engines so when people want to buy a used engine they can test it
before buy it and make sure that it works well. We know that pollution is one of the most
important problems that we want to solve so by using our project to test engines we can find
that it works well and doesn’t produce smoke that might affect society. The project can be
used for many kinds of engines so it will reduce problems for many people.
6.2.2 Environment
There are many ways that can polluted the environment and car engines are one of the
ways when it doesn’t work well and have some problem. With our project we can test the
engine before we connect it to the car so we can know earlier if we can use it or not, so that
will prevent it to make some pollution.
6.2.3 Economy
When it comes to the impacts that our project achieved on the economy, our project is a
simple example of an efficient economic Dynamometer. Our project doesn’t have a software,
but instead of it we will use some cheap tools to measure temperature, force and output
power. Also, our project will test the engine itself so no need to put it in the car to test it by
wheels.
33
Chapter 7: Conclusions and Future Recommendations
7.1 Conclusions
Project experience
Working on this senior project was a very rich experience for our future, yet we were faced
by many challenges. These challenges included, but not limited to, working under pressure
and working effectively as a one team. We had a very limited time to finish the project tasks
which some of them requires much time and effort. We were rushed to buy the tools and parts
and do the assembling and testing to the machine. At the same moment, we were required to
know and understand each other in the team and work effectively to solve the challenges we
having.
In fact, we overcome these challenges by managing each process of the project alone. The
project work was broken down into smaller tasks and these tasks were assigned to individual
members of the team or to groups with a certain deadline to finish. This reduces the conflicts
and improved the communication among the team.
However, management of team and work was not the only challenge, we had more technical
and design problems. We used what we learned during our courses to analyze the problems
and provide the best solution by using critical thinking and best design practices. For
example, we used FEA analysis to perform structural and analysis and we used Solidworks
software to provide the best design solution. We had to be familiar with these advanced tools
and techniques in the context of dealing with a real design situations.
Project experience
During the project time we learnt and improved so many skills and we gained huge amount of
knowledge. We learned how to work under pressure and perform complex tasks quickly in
short time. We, also, applied what we learned in course to actual work and used the design
principles to produce and test a new working machine. These lessons included:
1. Improve our skills in using design and analysis software.
To finish the project work we had to utilize many of the available software tools.
These tools included but not limited to Solidworks, Microsoft Word, and Microsoft
34
PowerPoint. These software tools are not new for us, but we had used them in a more
professional way. We learned many things in these software tools that we had not
learned them before. It was a wonderful opportunity that we had the chance to apply
these tools to a real problem.
2. Time management
Time is always a valuable resource in any work or project that need to be completed.
In this project we were supposed to finish within small window of time so that we had
to effectively utilize our time to be able to finish successfully. The project work was
complicated with many tasks to complete and many of these tasks were depended on
each other. Some tasks when delayed will has significant effect on the whole project.
Accordingly, we identified the critical tasks that may affect the deadline of the project
and we put more focus on completing them.
During the work on the project many tasks were assigned at specific time. This
challenge gave us a great skill and experience to manage our time. To do so we used
GANTTS chart that includes all the tasks and the subtasks that we have to achieve
them through the project’s life. GANTTS chart a useful tool that help to know when
we should start and when we should end each task.
3. Problem solving
During the project time we faced many problems at various levels that we eventually
solved. Some of these problems were related to technical or management issues. For
technical issues we used engineering concepts and fundamental principles of design to
find the best solutions. For such problems, we tried to use what we learned effectively
to be able to judge the results. On the other hand, for management problems we tried
to utilize the best practices to effectively manage our time and finish the work within
the time limit. Solving these problems provided us with many useful skills that will
benefit us greatly.

35
7.2 Future work
Our future recommendation can summarized briefly in several point:
1- Regular checkup and maintenance of the brakes.
2- Adding bearing and support in the middle of the shaft is recommended for future
work
3- Replacing the motor-shaft coupler to an elastic coupler.
4- To better readings in the future, it is recommended to wild the force gage on the frame
of the table
5- Getting a high efficiency tachometer, will advance future studies.

36
8- References
For Mechanical force gauge
https://imada.com/product-category/force-measurement/force-gauges/mechanical-
force-gauges/
Spring gauge
https://en.wikipedia.org/wiki/Spring_scale
Hewison, Christian H. (1983). Locomotive Boiler Explosions. David and Charles.
p. 18. ISBN 0-7153-8305-1.
Deformation gauge (strain gauge)
https://www.omega.com/prodinfo/straingages.html
https://gndec.ac.in/~igs/ldh/conf/2009/articles/T05_05.pdf
https://www.google.com.sa/search?q=dynamometer&safe=strict&rlz=1C1PRFB_enS
A794SA794&ei=Rg7eWvPKOcSKgAbSmqjgAQ&start=10&sa=N&biw=1680&bih=
944
https://www.setra.com/blog/test-and-measurement-dynamometer
http://www.autotraining.edu/blog/what-does-an-engine-dynamometer-do/
Earth Policy Institute (EPI), Report 2007, www.epi.org.
International Electrotechnical Commission (IEC) Standard 61724. Photovoltaic
system performance monitoring—guidelines for measurement, data exchange and
analysis.
T. Oozeki, T. Izawa, K. Otani and K. Kurokawa, “An evaluation method of PV
systems,” Solar Energy Materials & Solar cells, vol. 75, 2003, pp. 687- 695.
T. Yamaguchi, H. Wakabayashi, T. Yamada, K. Hasegawa, T. Agarashi, K. Sakuta,
T. Takashima, and K. Otani, “ Measurement and analysis of residential PV systems in
Japanese monitoring program,” 3rd World Conference on PV Energy Conversion,
Osaka, Japan, May 11-18, 2003, pp. 2463-2465.
J. D. Mondol, Y. Yohanis, M. Smyth and B. Norton, “Long term performance
analysis of a grid connected photovoltaic system in Northern Ireland,” Energy
Conversion and Management, vol. 47, 2006, pp. 2925-2947.

37
Appendix A: Drawings

38

39