Embed Size (px)
Citation preview
Professor Moira LivingstonClinical Director NHS IQ
www.hqip.org.uk
Session 4: Using QI methodologies to inform commissioning and create better care
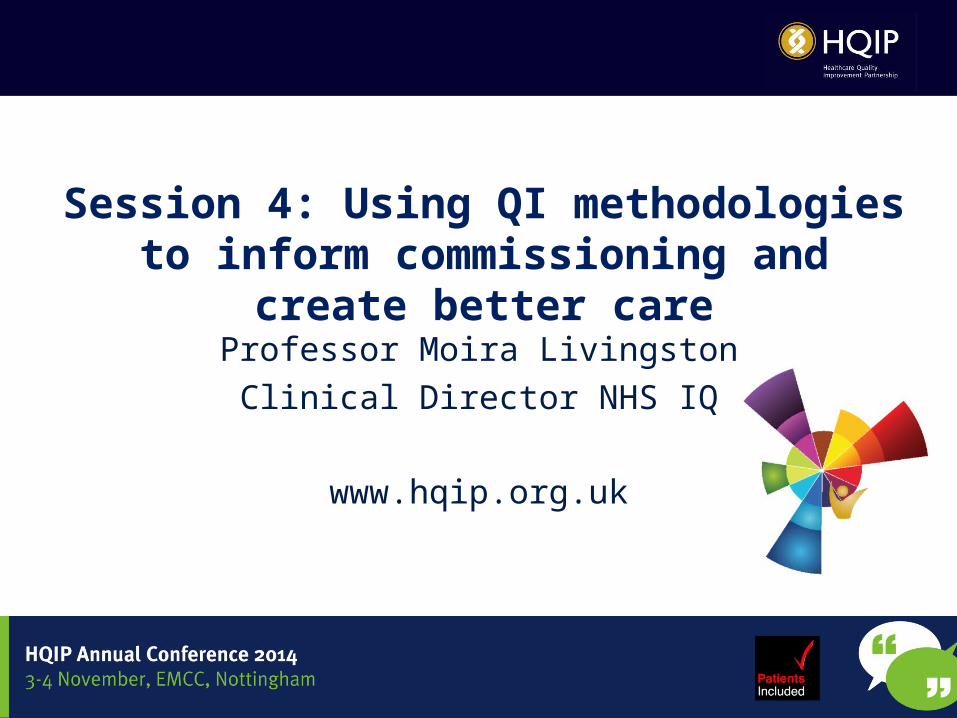
Using QI methodologies to inform commissioning and create better care
• Outline• Why are we here• The NHS Change model :a framework for
change• Commissioning for quality and transformation• Measurement and method• Key messages
Why are we here?Everyone Everywhere Every time experiences the safest and highest quality healthcare
•Financial challenges•Quality: Safety, outcomes and experience, is the focus•Rising expectations•Increasing complex health needs•Unacceptable variation
We need to do more, for less... and better
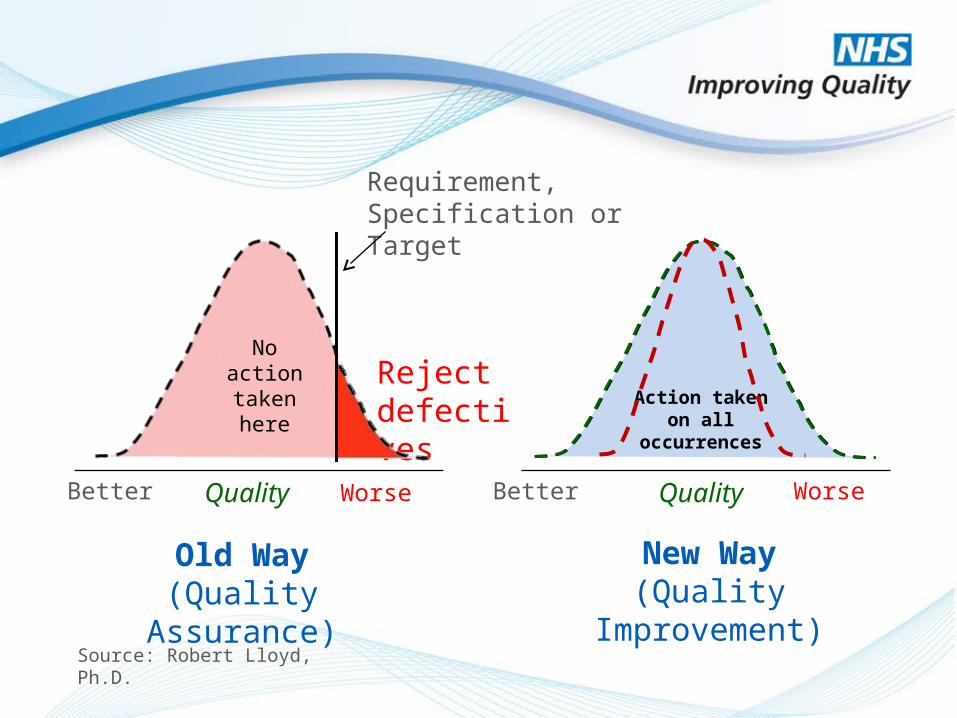
QualityBetter
Old Way(Quality Assurance)
QualityBetter Worse
New Way(Quality Improvement)
Action taken on all occurrences
Reject defectives
Source: Robert Lloyd, Ph.D.
Requirement,Specification or Target
No action taken here
Worse
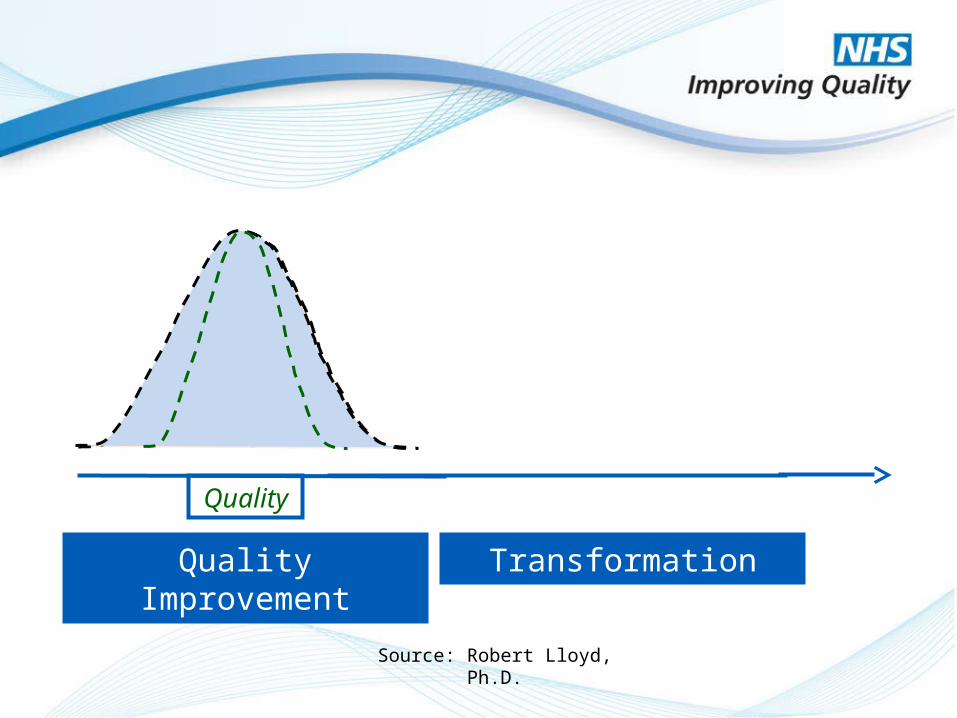
Quality
Quality Improvement Transformation
Source: Robert Lloyd, Ph.D.
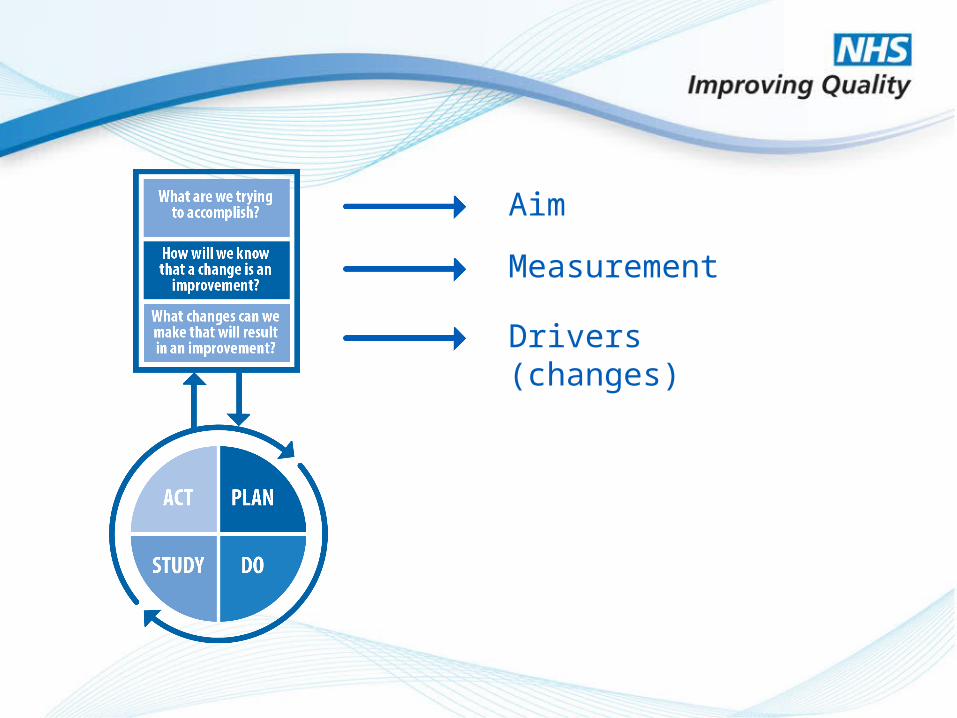
Aim
Measurement
Drivers (changes)
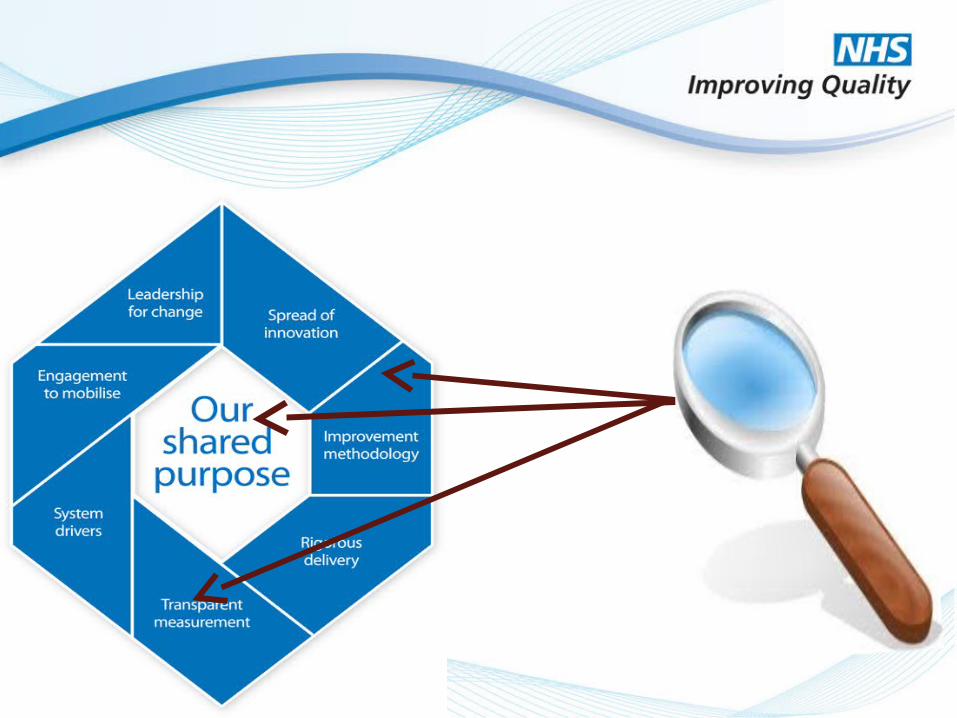
Common Shared Purpose
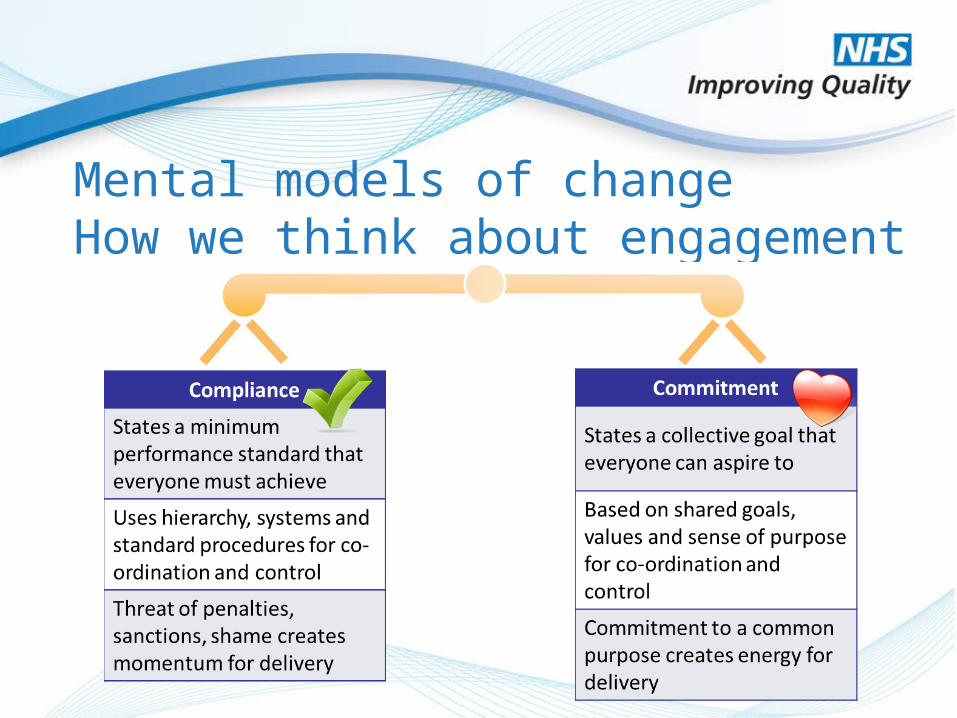
Mental models of change How we think about engagement
It’s all about BALANCE.
Commissioning for quality and transformation
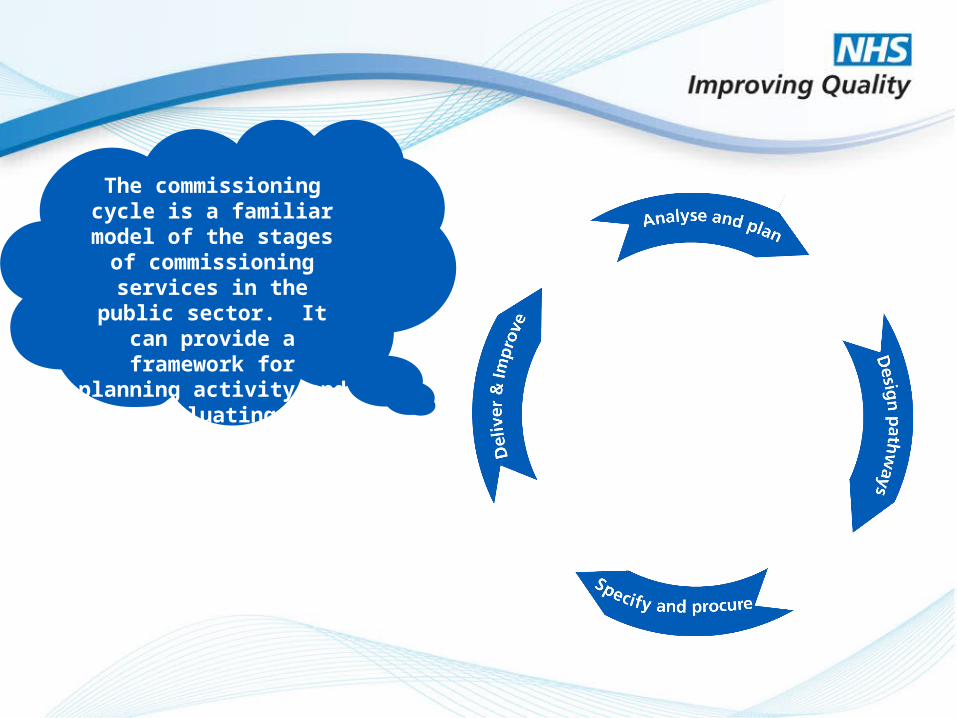
The commissioning cycle is a familiar model of the stages of commissioning services in the public sector. It can provide a
framework for planning activity and evaluating development
needs.
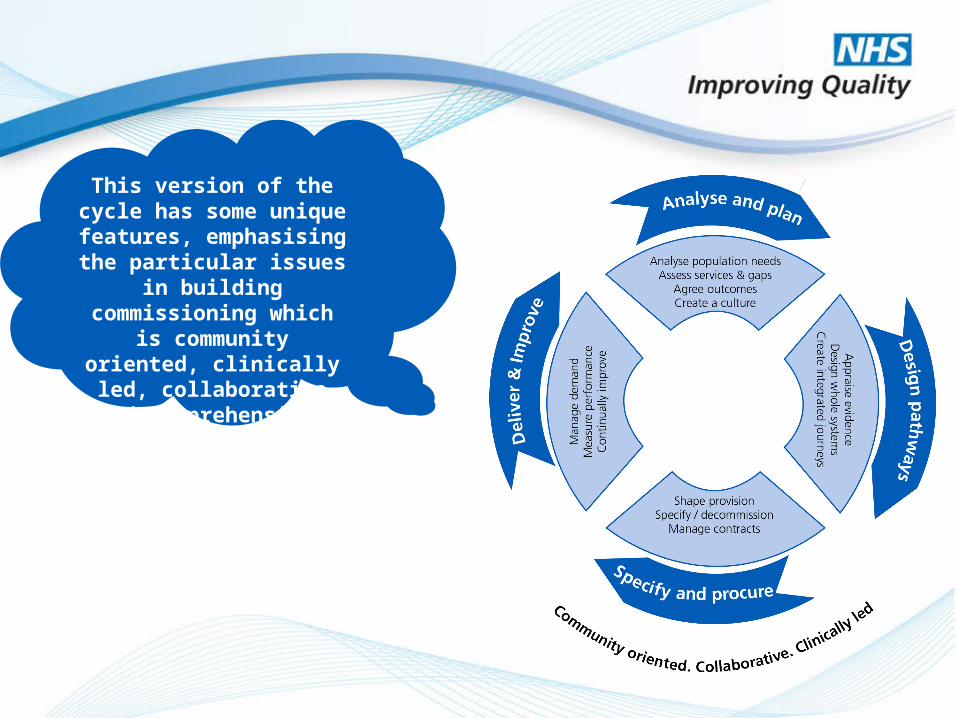
This version of the cycle has some unique features,
emphasising the particular issues in building
commissioning which is community oriented, clinically
led, collaborative and comprehensive.
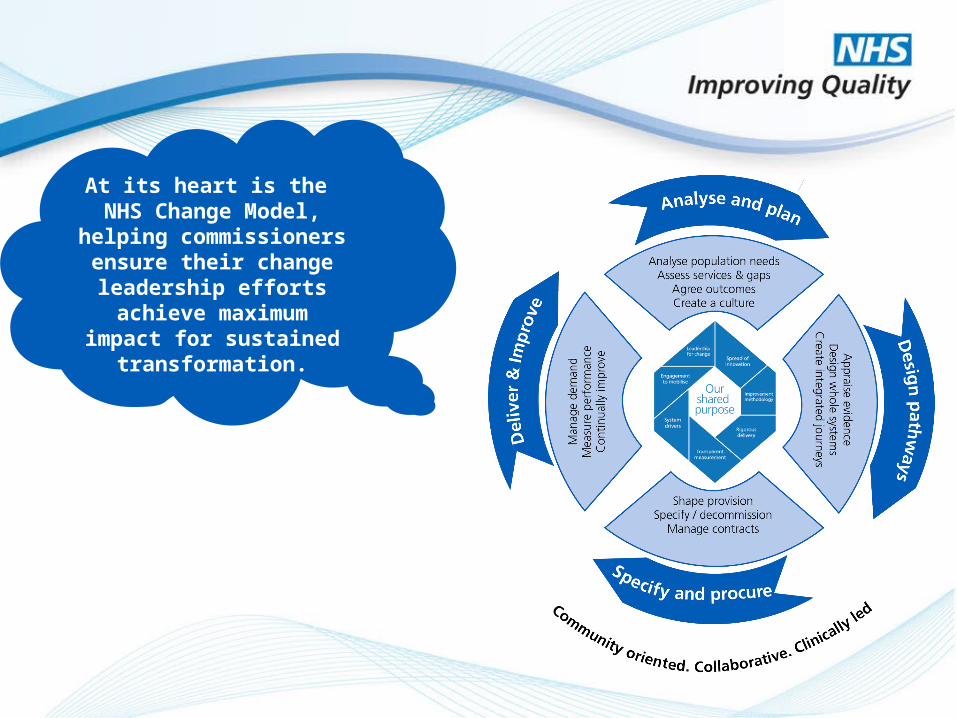
At its heart is the NHS Change Model, helping commissioners ensure their
change leadership efforts achieve maximum impact for
sustained transformation.
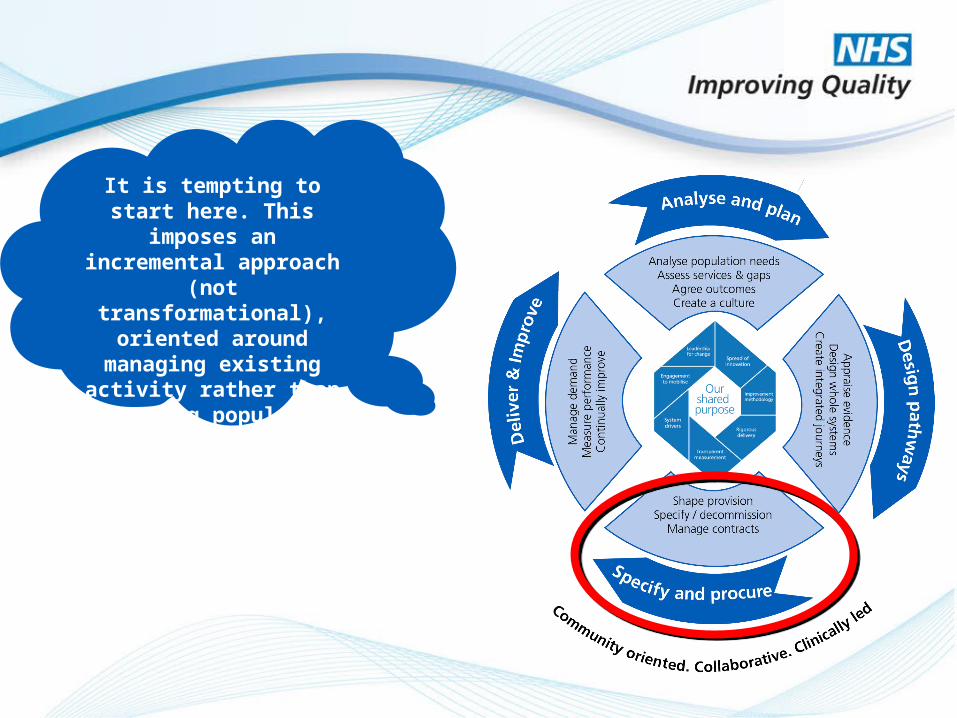
It is tempting to start here. This imposes an incremental
approach (not transformational), oriented around managing existing
activity rather than improving population outcomes.
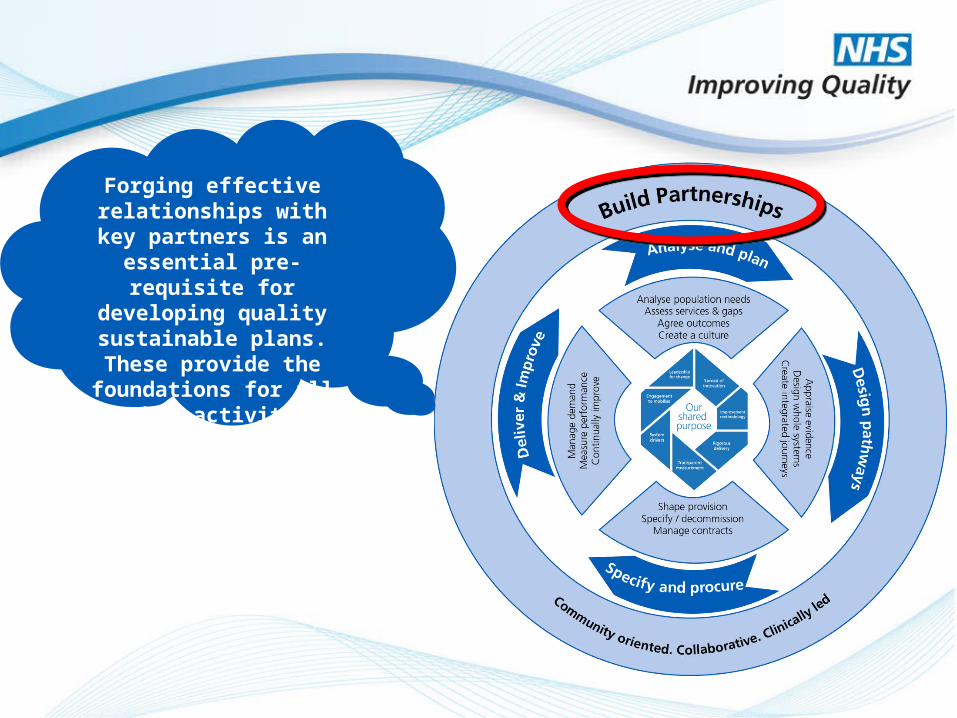
Forging effective relationships with key partners is an
essential pre-requisite for developing quality sustainable
plans. These provide the foundations for all other
activity, ensuring a collaborative approach.
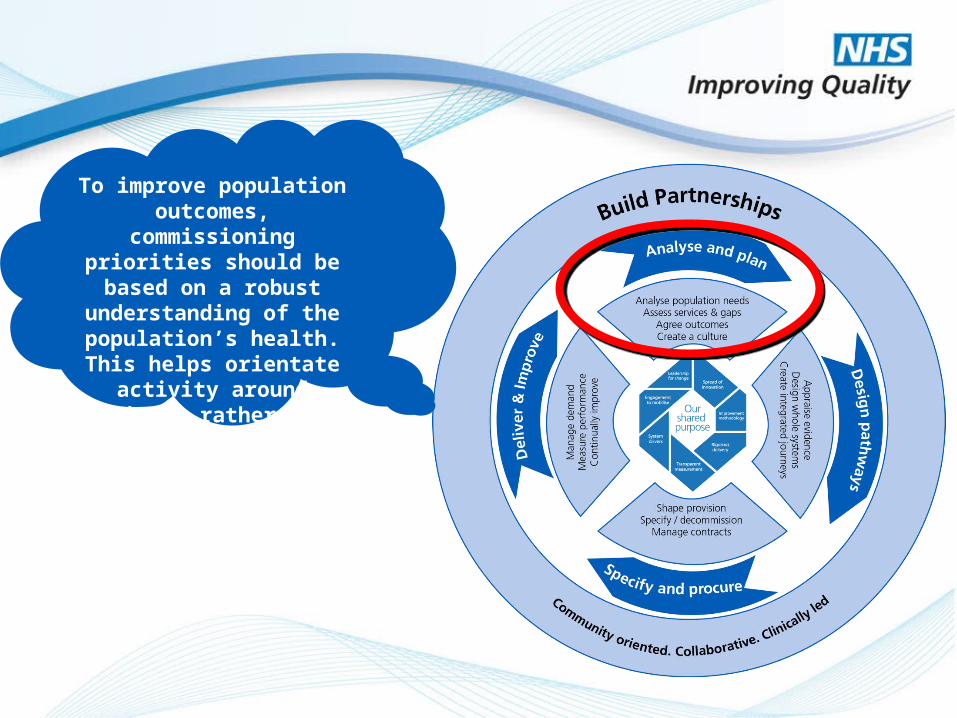
To improve population outcomes, commissioning
priorities should be based on a robust understanding of the
population’s health. This helps orientate activity around
patients rather than services.
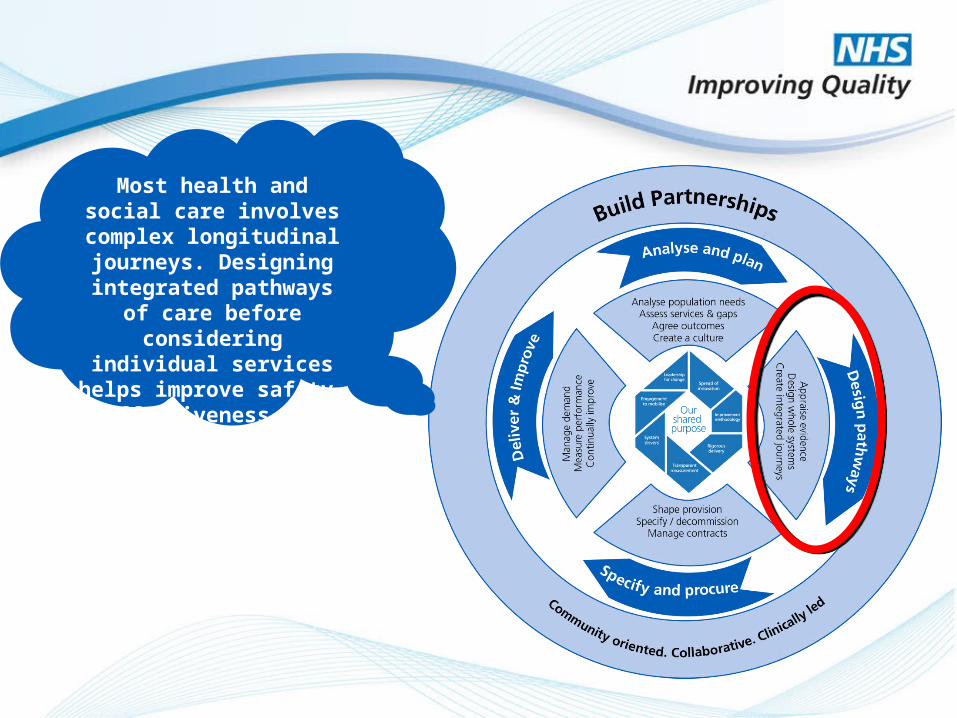
Most health and social care involves complex longitudinal journeys. Designing integrated
pathways of care before considering individual services
helps improve safety, effectiveness and value.
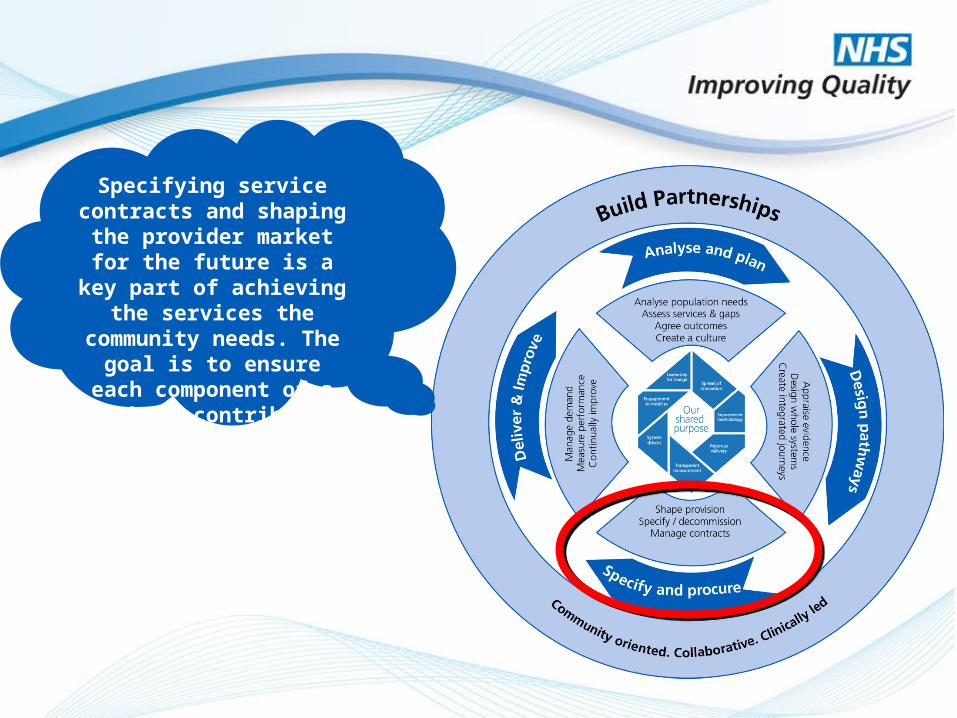
Specifying service contracts and shaping the provider
market for the future is a key part of achieving the services
the community needs. The goal is to ensure each component of
a pathway contributes to the whole.
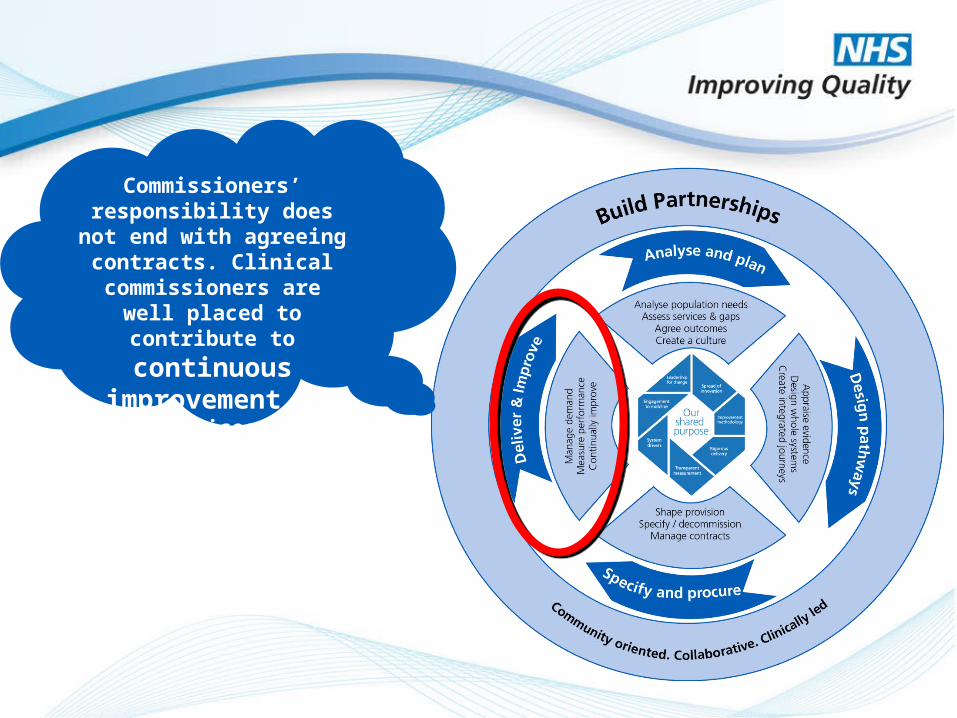
Commissioners’ responsibility does not end with agreeing
contracts. Clinical commissioners are well placed to contribute to continuous improvement of services,
collaborating between providers.
Transparent MeasurementData…Information…Knowledge
Transparent MeasurementData… Information…knowledge
Transparent MeasurementData… Information…knowledge
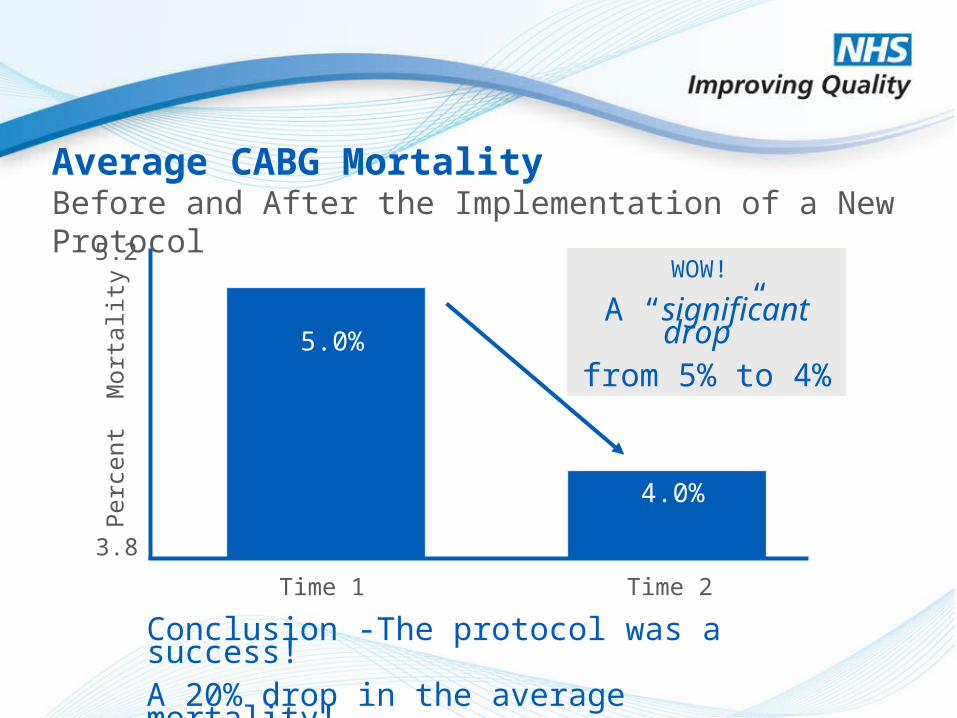
Average CABG MortalityBefore and After the Implementation of a New Protocol
Perc
ent
Mor
talit
y
Time 1 Time 2
3.8
5.2
5.0%
4.0%
WOW!
A “significant drop”from 5% to 4%
Conclusion -The protocol was a success! A 20% drop in the average mortality!
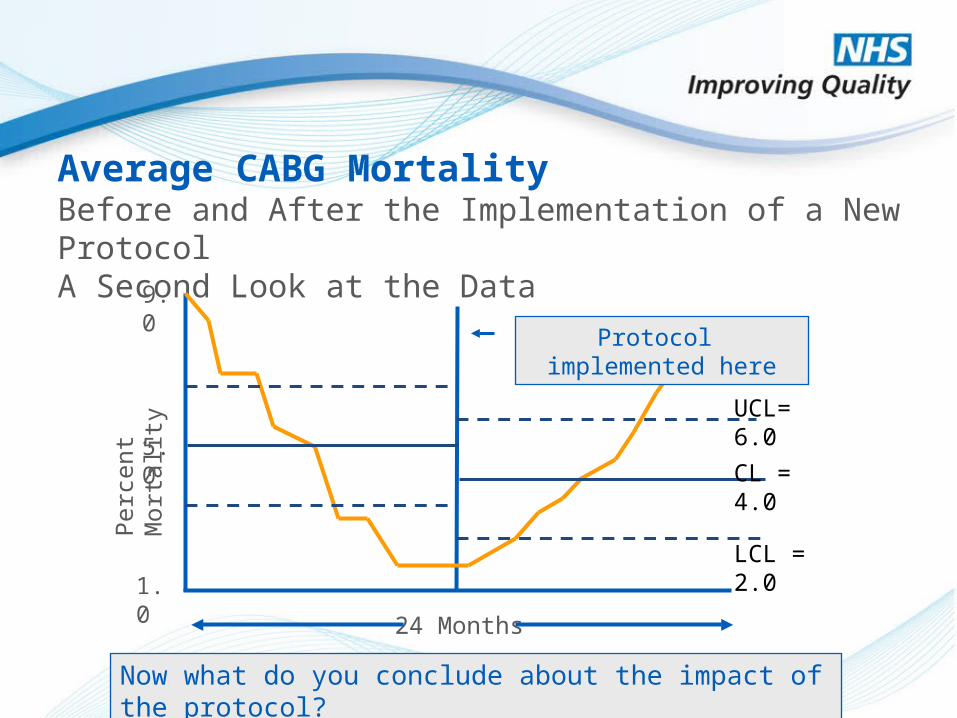
Average CABG MortalityBefore and After the Implementation of a New Protocol A Second Look at the Data
Now what do you conclude about the impact of the protocol?
Perc
ent
Mor
talit
y
24 Months
1.0
9.0
5.0
UCL= 6.0
LCL = 2.0
CL = 4.0
Protocol implemented here
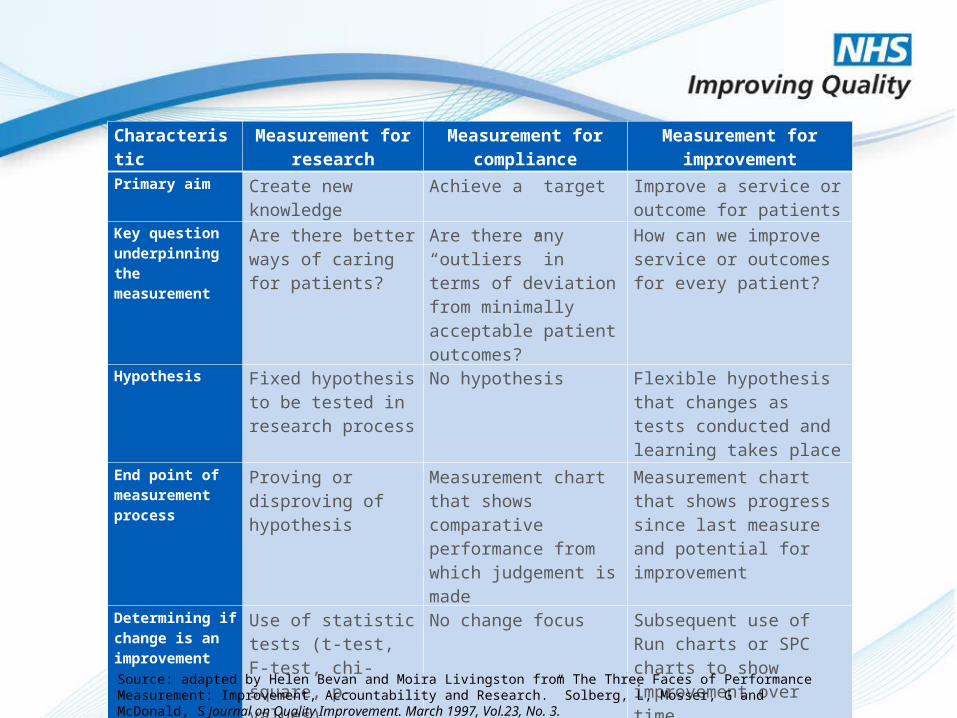
Characteristic Measurement forresearch
Measurement forcompliance
Measurement forimprovement
Primary aim Create new knowledge
Achieve a target Improve a service or outcome for patients
Key question underpinning the measurement
Are there better ways of caring for patients?
Are there any “outliers” in terms of deviation from minimally acceptable patient outcomes?
How can we improve service or outcomes for every patient?
Hypothesis Fixed hypothesis to be tested in research process
No hypothesis Flexible hypothesis that changes as tests conducted and learning takes place
End point of measurement process
Proving or disproving of hypothesis
Measurement chart that shows comparative performance from which judgement is made
Measurement chart that shows progress since last measure and potential for improvement
Determining if change is an improvement
Use of statistic tests (t-test, F-test, chi-square, p-values)
No change focus Subsequent use of Run charts or SPC charts to show improvement over time
Source: adapted by Helen Bevan and Moira Livingston from The Three Faces of Performance Measurement: Improvement, Accountability and Research.” Solberg, L, Mosser, G and McDonald, S Journal on Quality Improvement. March 1997, Vol.23, No. 3.
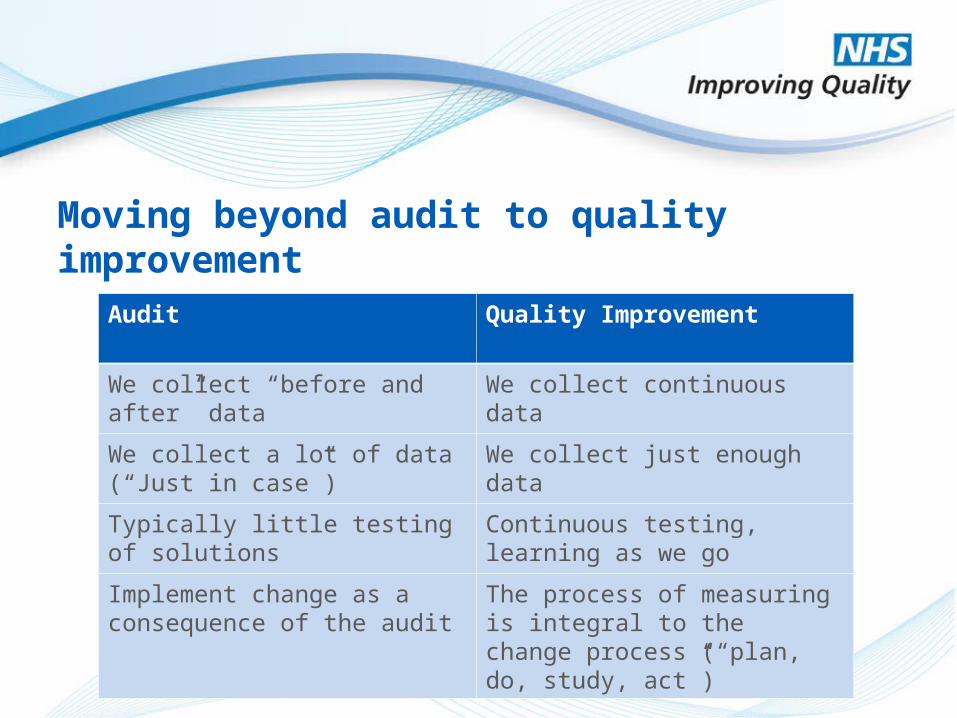
Audit Quality Improvement
We collect “before and after” data We collect continuous data
We collect a lot of data (“Just in case”)
We collect just enough data
Typically little testing of solutions Continuous testing, learning as we go
Implement change as a consequence of the audit
The process of measuring is integral to the change process (“plan, do, study, act”)
Moving beyond audit to quality improvement
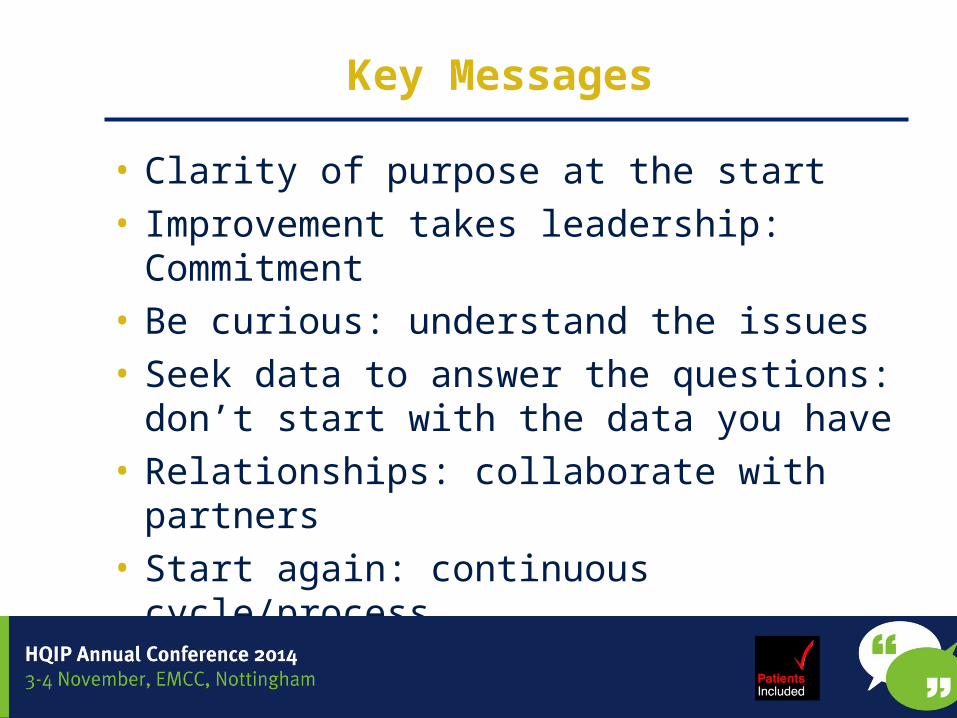
Key Messages
• Clarity of purpose at the start• Improvement takes leadership: Commitment• Be curious: understand the issues• Seek data to answer the questions: don’t start
with the data you have• Relationships: collaborate with partners• Start again: continuous cycle/process