Embed Size (px)
Citation preview
PROCESS MODELING AND TECHNO-
ECONOMIC ANALYSIS OF ZEOLITE
MEMBRANE SEPARATION PROCESSES
A DISSERTATION
SUBMITTED TO THE FACULTY OF THE GRADUATE SCHOOL
OF THE UNIVERSITY OF MINNESOTA
BY
Nitish Mittal
IN PARTIAL FULFILLMENT OF THE REQUIREMENTS
FOR THE DEGREE OF
DOCTOR OF PHILOSOPHY
Advised by:
Michael Tsapatsis
Prodromos Daoutidis
April, 2018

© Nitish Mittal 2018
ALL RIGHTS RESERVED
i
Acknowledgements
I would like to thank my advisors Professor Michael Tsapatsis and Professor Prodromos Daoutidis
for giving me the opportunity to work on a wide variety of projects and applications. They have
always been approachable and patient especially during tough times. Their guidance and support
throughout my graduate studies has been instrumental in preparation of this thesis and to my general
academic progress.
I would also like to thank Professor J. Ilja Siepmann with whose group I have extensively
collaborated to obtain transport and thermodynamic properties using molecular simulations.
I would like to acknowledge both the group members who have been generous with their time and
always willingly participated in helpful discussions over the years.
A sincere thanks to all my friends who have made my stay at Minnesota worthwhile and provided
me with wonderful and lifelong memories of the amazing time we spent together.
Most importantly, I would like to thank my family who have always believed in me and supported
me in every decision, and I would like to dedicate my work to them.

ii
To my family
iii
Abstract
Zeolite membrane separation is considered to be a promising alternative to the traditional energy-
intensive industrial separation techniques such as distillation. Currently, zeolite membranes are
implemented in industry only for solvent dehydration applications. However, good separation
performance is obtained at laboratory scale for various applications such as bioethanol enrichment,
hydrogen recovery, natural gas purification, butane isomer separation, xylene isomer separation,
etc. This progress should pave the way for the industrial implementation for other applications.
Although significant progress has been made in preparation, characterization and
commercialization of zeolite membranes, rigorous models, which can predict the membrane
performance in industrial settings, are not available in the literature. Mathematical and process
modeling plays an important role in the implementation and evaluation of any new technology or
application. Thus, specific objectives of this thesis are to (i) design and develop a detailed
mathematical model of a zeolite membrane separation process for accurate performance prediction
under a wide variety of operating conditions, and (ii) develop and optimize a conceptual process
design approach and perform a techno-economic evaluation for several significant application
specific flowsheets.
In this thesis, complex challenges both at the chemical engineering fundamentals and the process
scale have been addressed. A detailed mathematical model of a zeolite membrane separation based
on adsorption-diffusion phenomenon is formulated using Maxwell-Stefan equations. In addition to
the adsorption and diffusion based transport through zeolite layer, factors such as mass transfer
through the porous support, the use of a sweep gas, concentration polarization phenomenon and
presence of defects are also discussed. The adsorption-diffusion model (including external
resistances) is then integrated with the process-scale governing equations to assess the industrial
potential of zeolite membranes. Further, conceptual process designs have been modeled and
techno-economic evaluation has been performed to evaluate the scope of zeolite membrane
separation for several applications in chemical and bio-based refineries, including butane isomer
separation, bioethanol enrichment and propylene-propane separation. Both the stand-alone
membrane systems and hybrid membrane-distillation systems have been considered. A hybrid
membrane-distillation process is found to be energy efficient and economically attractive over
stand-alone membrane systems. Finally, a net present value of the system is analyzed to generate a
set of performance targets in term of the permeance and the membrane cost.
iv
Contents
Acknowledgements .................................................................................................................... i
Abstract .................................................................................................................................... iii
Contents .................................................................................................................................... iv
List of tables ........................................................................................................................... viii
List of figures ........................................................................................................................... ix
Chapter 1: Introduction ............................................................................................................. 1
Chapter 2: Zeolite membrane modeling review and advancements .......................................... 6
2.1 Introduction ..................................................................................................................... 6
2.2 Transport model for zeolite layer .................................................................................... 7
2.2.1 Adsorption modeling ............................................................................................... 8
2.2.2 Diffusion modeling ................................................................................................ 11
2.3 Transport model for external resistances ...................................................................... 15
2.3.1 Model for the support ............................................................................................ 16
2.3.2 Model for the sweep gas ........................................................................................ 18
2.3.3 Model for the concentration polarization ............................................................... 19
2.3.4 Model for the defects ............................................................................................. 21
2.4 Process model for zeolite membranes ........................................................................... 21
2.4.1 Stand-alone membrane process ............................................................................. 22
2.4.2 Hybrid membrane/distillation process ................................................................... 23
v
2.5 Concluding remarks ...................................................................................................... 25
Chapter 3: Butane isomer separation using hybrid membrane-distillation ............................. 27
3.1 Introduction ................................................................................................................... 27
3.2 Adsorption modeling ..................................................................................................... 27
3.2.1 Single component adsorption parameters .............................................................. 27
3.2.2 Multi component adsorption parameters ............................................................... 30
3.3 Diffusion modeling ....................................................................................................... 32
3.3.1 Microscopic techniques for diffusion properties ................................................... 33
3.3.2 Macroscopic techniques for diffusion properties ................................................... 35
3.3.3 Molecular simulations for diffusion properties ..................................................... 41
3.3.4 Single component diffusion parameters ................................................................ 44
3.3.5 Multi-component diffusion parameters ................................................................. 45
3.3.6 Discrepancy between diffusion properties in crystals and membranes ................. 47
3.4. Model validation .......................................................................................................... 49
3.5 Scope of improvement .................................................................................................. 52
3.5.1 Effect of support and sweep gas on membranes with improved performance ...... 53
3.5.2 Effect of concentration polarization on membranes with improved performance . 58
3.6 Process design ............................................................................................................... 61
3.6.1 Base Case ............................................................................................................... 61
3.6.2 Single stage membrane process ............................................................................. 62
3.6.3 Multistage membrane process ............................................................................... 63
vi
3.6.4 Hybrid membrane/distillation process ................................................................... 65
3.7 Conclusion ................................................................................................................ 68
Chapter 4: Bioethanol enrichment using hydrophilic and hydrophobic membranes .............. 70
4.1 Introduction ................................................................................................................... 70
4.2 Model for hydrophilic zeolite membrane ...................................................................... 71
4.3 Model for hydrophobic zeolite membrane .................................................................... 72
4.4 Molecular simulation methods ...................................................................................... 72
4.5 Adsorption modeling ..................................................................................................... 73
4.6 Diffusion modeling ....................................................................................................... 75
4.7 Model validation ........................................................................................................... 77
4.8 Review of process design studies .................................................................................. 81
4.9 Base-case distillation for ethanol enrichment ............................................................... 82
4.10 Application of zeolite membranes at low ethanol concentration ................................ 84
4.11 Application of zeolite membranes at intermediate ethanol concentration .................. 91
4.11.1 Hydrophobic membranes ..................................................................................... 91
4.11.2 Hydrophilic membranes ....................................................................................... 94
4.11.3 Combination of hydrophobic and hydrophilic membranes ................................. 97
4.12 Techno-economic analysis .......................................................................................... 99
4.13 Conclusion ................................................................................................................ 101
Chapter 5: Debottlenecking heat-integrated propylene-propane distillation separation using
membranes ............................................................................................................................ 103
vii
5.1 Introduction ................................................................................................................. 103
5.2 Separation using distillation ........................................................................................ 105
5.2.1 Conventional distillation column ......................................................................... 105
5.2.2 Heat integrated distillation column ...................................................................... 106
5.2.3 Remarks on operation of conventional and heat-integrated columns .................. 107
5.3 Separation using membranes....................................................................................... 108
5.3.1 Literature review .................................................................................................. 108
5.3.2 Membrane modeling ............................................................................................ 110
5.3.3 Membrane permeation ......................................................................................... 111
5.4 Separation using hybrid membrane-distillation .......................................................... 112
5.5 Recovery from reactor purge ...................................................................................... 115
5.6 Conclusion .................................................................................................................. 118
Chapter 6: Concluding remarks ............................................................................................. 119
Bibliography .......................................................................................................................... 121
viii
List of tables
Table 3.1. Pre-exponential factor of diffusion coefficient at zero loading and the
corresponding activation energy for butane isomers in MFI crystals. 45
Table 3.2. Feed conditions and separation performance of distillation for butane isomer 61
Table 3.3. Capital and annual operating cost of distillation column for butane isomer 62
Table 3.4. Membrane area and product purity for two-stage membrane system 63
Table 4.1. Mixture diffusion coefficients (Maxwell-Stefan obtained using molecular
simulations) of water and ethanol in MFI zeolite at T = 323 K for various loading and
mole fraction. 76
Table 4.2. Cost of utilities based on 2017 prices of natural gas ($3.50/GJ) and electricity
($0.07/kWh). 100
Table 5.1. Feed conditions and separation performance of C3 splitter 105
ix
List of figures
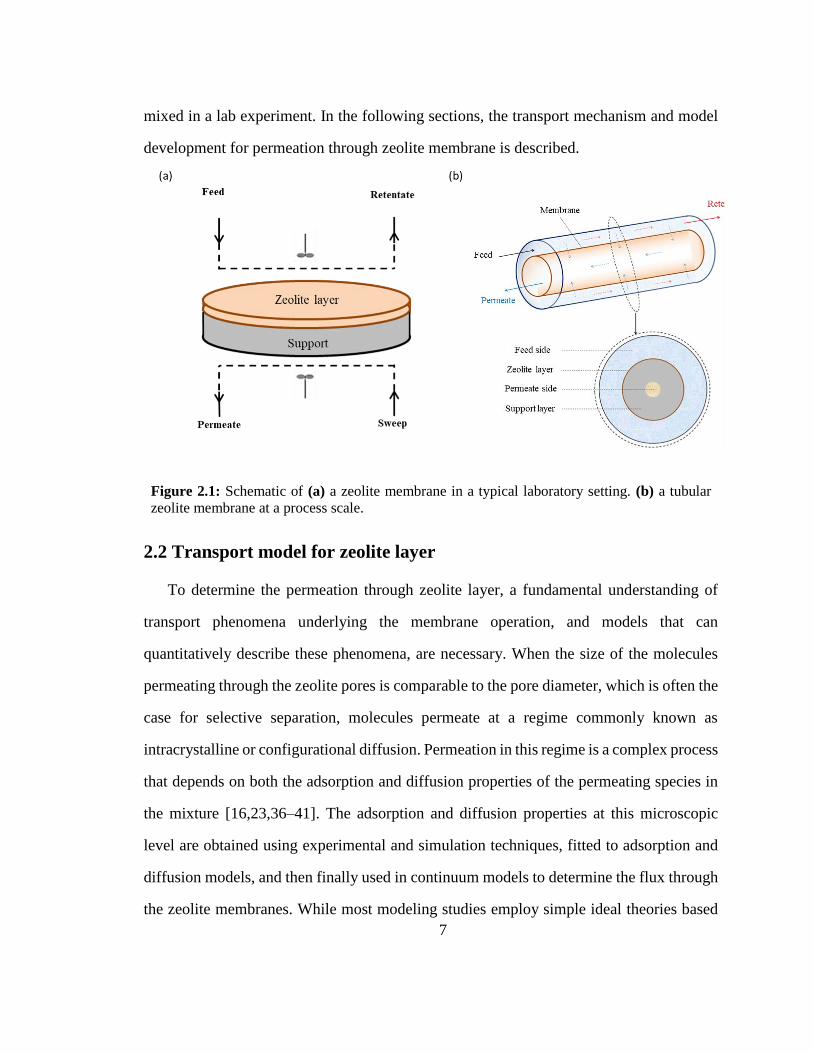
Figure 2.1: Schematic of (a) a zeolite membrane in a typical laboratory setting. (b) a
tubular zeolite membrane at a process scale. 7
Figure 2.2: Molecular simulation results and IAST prediction for multicomponent
adsorption on MFI crystals: (a) success of IAST for methane-ethane mixture [2], (b)
failure of IAST for water-ethanol mixture [2]. 10
Figure 2.3: (a) Effect of intersection blocking: diffusivity of methane (linear alkane)
decreases more steeply in presence of i-butane (branched alkane) as compared to n-
butane (linear alkane) in MFI [2], (b) Corrected diffusivity of water-methanol mixture
in FAU at 300 K obtained through MD simulations [2]. 15
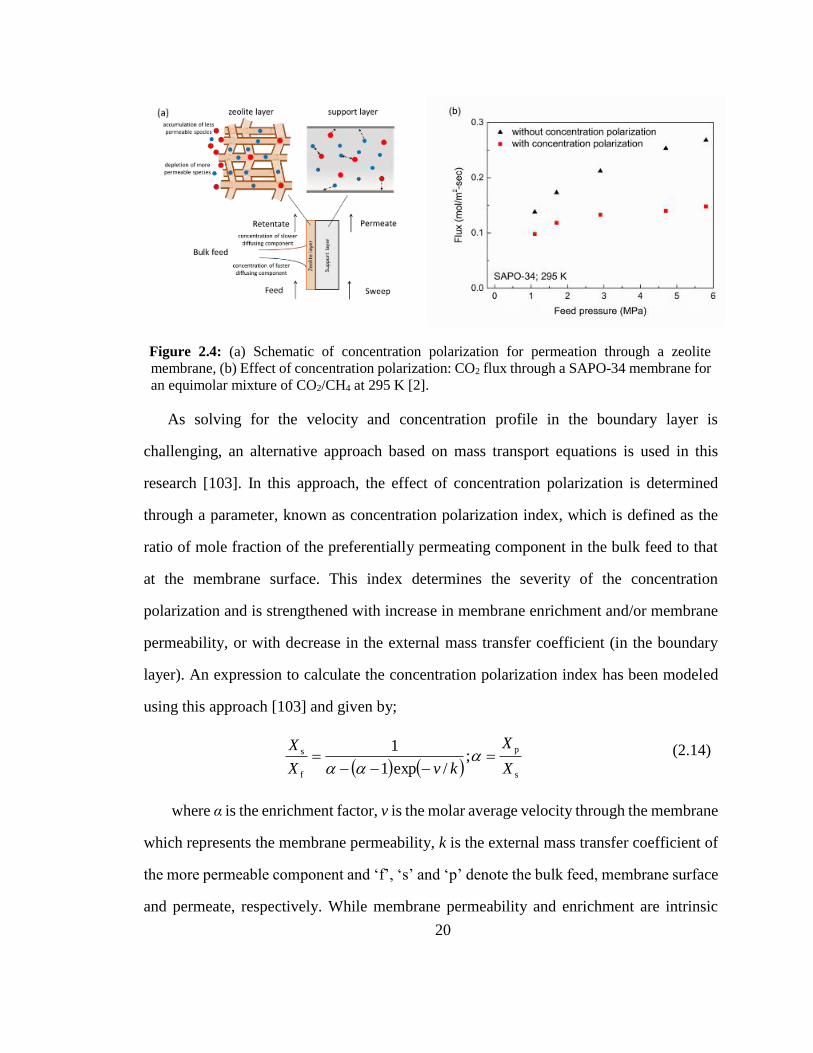
Figure 2.4: (a) Schematic of concentration polarization for permeation through a zeolite
membrane, (b) Effect of concentration polarization: CO2 flux through a SAPO-34
membrane for an equimolar mixture of CO2/CH4 at 295 K [2]). 20
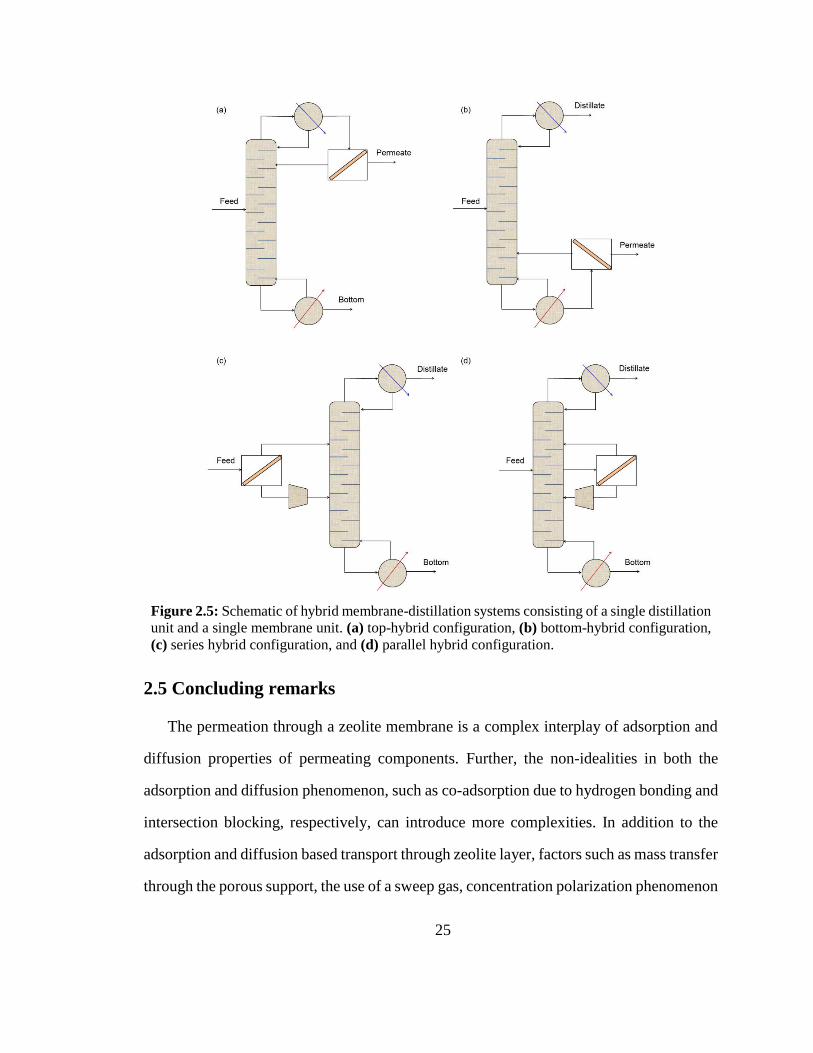
Figure 2.5: Schematic of hybrid membrane-distillation systems consisting of a single
distillation unit and a single membrane unit. (a) top-hybrid configuration, (b) bottom-
hybrid configuration, (c) series hybrid configuration, and (d) parallel hybrid
configuration. 25
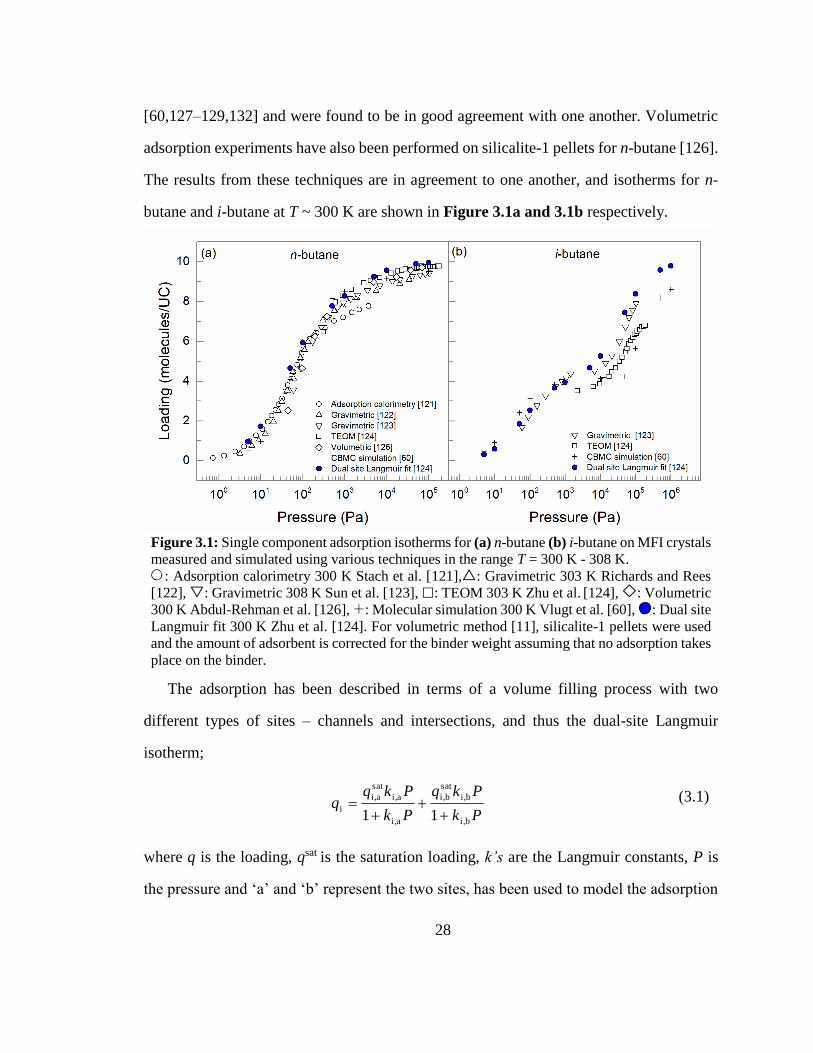
Figure 3.1: Single component adsorption isotherms for (a) n-butane (b) i-butane on MFI
crystals measured and simulated using various techniques in the range T = 300 K - 308
K. 28
Figure 3.2: n-Butane Henry’s coefficients for adsorption on MFI crystals obtained using
molecular simulations at various temperatures. 30
Figure 3.3: Adsorption isotherm for an equimolar mixture of n-butane and i-butane at
(a) T = 323 K, and (b) T = 343 K; RAST model compared to molecular simulation data
by Lu et. al. [53]. 32
Figure 3.4: n-butane self-diffusion coefficients in MFI crystals obtained using
microscopic techniques (NMR and QENS) at various temperatures. The corresponding
loading in molecules/UC and Si/Al ratio for ZSM-5 crystals are shown in the legend. 34
Figure 3.5: i-butane self-diffusion coefficients in MFI crystals obtained using
microscopic techniques (NMR, QENS and NSE) at various temperatures. The
corresponding loading in molecules/UC and Si/Al ratio for ZSM-5 crystals are shown
in the legend. 35
Figure 3.6: n-butane corrected diffusivity in MFI crystals obtained at infinite dilution
using macroscopic techniques (CPC and ZLC) for various temperatures. Values
obtained using NMR and molecular simulations are also shown for comparison. 36
x
Figure 3.7: i-butane corrected diffusivity in MFI crystals obtained using macroscopic
techniques (CPC and ZLC) for various temperatures. Self-diffusivity values obtained
using NSE and molecular simulations are also shown for comparison. Values shown
are at infinite dilution (zero loading) except wherever mentioned. 37
Figure 3.8: n-butane self-diffusion coefficients in MFI crystals obtained at T = 300 K
using molecular simulation techniques for various loadings. 42
Figure 3.9: Loading dependency of i-butane Maxwell-Stefan diffusion coefficient
determined using Kinetic Monte Carlo simulation and infra-red microscopy
experiments at T = 298 K. 44
Figure 3.10: Effect of i-butane loading on n-butane diffusion coefficient in a mixture of
butane isomers at T = 363 K. 46
Figure 3.11: Model predictions compared to experimental values (Agrawal et al. [31])
of (a) n-butane flux (b) separation factor. 51
Figure 3.12: Predicted separation performance of membranes with improved
performance for various feed temperatures. Values are shown for a 5-fold (Đ = Đ0/10),
10-fold (Đ = Đ0/5) and 50-fold (Đ = Đ0) improvement in diffusivity compared to the
value used to model experimentally observed permeance (Đ = Đ0/50) where Đ0 is the
diffusivity predicted by theory. (a) n-butane flux (b) separation factor. 54
Figure 3.13: Predicted separation performance of membranes with improved
performance for various feed partial pressure. Values are shown for a 5-fold (Đ =
Đ0/10), 10-fold (Đ = Đ0/5) and 50-fold (Đ = Đ0) improvement in diffusivity compared
to the value used to model experimentally observed permeance (Đ = Đ0/50) where Đ0
is the diffusivity predicted by theory. (a) n-butane flux (b) separation factor. 55
Figure 3.14: Predicted separation performance of membranes with improved
performance for various feed partial pressure. Values are shown for a 5-fold (Đ =
Đ0/10), 10-fold (Đ = Đ0/5) and 50-fold (Đ = Đ0) improvement in diffusivity compared
to the value used to model experimentally observed permeance (Đ = Đ0/50) where Đ0
is the diffusivity predicted by theory. (a) n-butane flux (b) separation factor. 56
Figure 3.15: Effect of sweep gas on permeation through membranes with improved
performance. Values are shown for a 5-fold (Đ = Đ0/10), 10-fold (Đ = Đ0/5) and 50-
fold (Đ = Đ0) improvement in diffusivity compared to the value used to model
experimentally observed permeance (Đ = Đ0/50) where Đ0 is the diffusivity predicted
by theory. (a) n-butane flux (b) separation factor. 57
Figure 3.16: Cross-section of various geometries (a) flow in a circular tube (b) flow in
a concentric annulus, and (c) flow on the outer surface of tube bundles. 59
Figure 3.17: Effect of concentration polarization on permeation through membranes
with improved performance. Values are shown for a 5-fold (Đ = Đ0/10), 10-fold (Đ =
Đ0/5) and 50-fold (Đ = Đ0) improvement in diffusivity compared to the value used to 60
xi
model experimentally observed permeance (Đ = Đ0/50) where Đ0 is the diffusivity
predicted by theory. (a) n-butane flux (b) separation factor.
Figure 3.18: Schematic of (a) a tubular membrane, (b) a single stage membrane unit,
(c) a two stage membrane unit, and (d) a series hybrid membrane distillation unit for
butane isomer separation. 64
Figure 3.19: (a) The membrane area required for a hybrid membrane distillation unit
calculated with a 10-fold improvement in diffusivity (Đ = Đ0/5) compared to the value
used to model experimentally observed permeance (Đ = Đ0/50) where Đ0 is the
diffusivity predicted by theory. For reference, the area required for a two-stage
membrane unit is ~2,500 m2. (b) The corresponding reboiler and condenser duties for
the hybrid membrane distillation unit. For reference, the reference reboiler and
condensed duty for current distillation technique is 10.72 MW and 11.09 MW
respectively. 66
Figure 3.20: NPV savings projection of a series hybrid membrane-distillation system
over current distillation technique for a fixed (a) membrane cost = $ 5000/m2, and (b)
stage cut (φ) = 0.4, calculated with a 10-fold improvement in diffusivity (Đ = Đ0/5)
compared to the value used to model experimentally observed permeance (Đ = Đ0/50)
where Đ0 is the diffusivity predicted by theory. (MM$ = 106 $) 67
Figure 4.1: (a) Adsorption isotherm as function of ethanol partial pressure (lower axis)
obtained using CB-GEMC (Configurational-Bias Monte Carlo - Gibbs Ensemble)
simulations and fitted using Real Adsorption Solution Theory for water-ethanol mixture
in all-silica MFI zeolite at T = 323 K. The corresponding ethanol wt. % in solution-
phase is labelled on the upper axis. The standard error of the mean for the simulation
data is smaller than the symbol size. (b) Maxwell-Stefan diffusion coefficients for
water-ethanol mixture obtained using molecular dynamics simulations and fitted as a
function of total fractional loading in all-silica MFI zeolite at T = 323 K. 74
Figure 4.2: Diffusion coefficient of (a) ethanol and (b) water in MFI zeolite at low
concentration/infinite dilution obtained by various molecular simulations, microscopic
and macroscopic experimental techniques. 75
Figure 4.3: Maxwell-Stefan diffusion coefficients for water-ethanol mixture in MFI
zeolite obtained using molecular dynamics simulations for various ethanol mole
fraction (0.75, 0.85 and 0.92) and total loadings (1, 2, 5 and 10 molecules/UC) in the
adsorbed phase at T = 323 K. 76
Figure 4.4: (a) Steady-state ethanol permeance and (b) selectivity of ethanol over water
obtained in this study for various feed concentrations at 50 °C and permeate pressure
of 100 Pa using the real adsorption solution theory and the Maxwell-Stefan formulation
for an all-silica MFI membrane (1.5 μm thick zeolite layer and 3 mm thick support)
pervaporation process, and compared to experimental values obtained in [26]. (c)
Steady-state ethanol permeance and (d) selectivity obtained using a 120-fold reduction
in diffusivity and including the effects of silanol defects compared to experimental
studies in the literature. 78
xii
Figure 4.5: Temperature dependence of (a) steady-state ethanol flux and (b) selectivity
of ethanol over water in MFI membranes for a 3-7 wt. % ethanol feed. 80
Figure 4.6: Simulation results for selectivity of ethanol over water in MFI membrane
permeation obtained using the model at 50 °C and using a reduced-selectivity model
for 120 °C compared to the experimental results obtained by Weyd et al. [207]. 81
Figure 4.7: Conceptual process flow diagram of base-case distillation for bioethanol
enrichment based on the NREL report [256]. 83
Figure 4.8: A 3-stages ejector system in series for evacuating the leaked air for a 10,000
m2 membrane module operating at a permeate pressure of 1 kPa. 86
Figure 4.9: (a) Ethanol purity obtained and (b) membrane area required for bioethanol
enrichment of low ethanol concentration feed (5 wt. %) obtained from the fermenter
using hydrophobic MFI zeolite membranes for a permeate pressure of 1 kPa and 5 kPa.
The corresponding purity for the beer column is also shown. 88
Figure 4.10: Simulation results for the separation performance of hydrophobic MFI
zeolite membrane (1.5 μm thick zeolite layer and 3 mm thick support) for an aqueous
feed at a low ethanol concentration of ~ 5 wt. % from fermenter. Feed temperature of
50 °C and a permeate pressure of (a) 1 kPa and (b) 5 kPa. The corresponding purities
for defect-free membranes are also shown. 88
Figure 4.11: Conceptual process flow diagram of bioethanol enrichment using defect-
free hydrophobic MFI zeolite membrane at low ethanol concentration feed (5 wt. %)
obtained from the fermenter followed by the distillation (rectification) column. The
membrane area required is 59,000 m2 for a permeate pressure of 5 kPa and 44,000 m2
for a permeate pressure of 1 kPa. 90
Figure 4.12: (a) Ethanol purity obtained and (b) membrane area required for bioethanol
enrichment of intermediate ethanol concentration feed (37 wt. %) obtained as the beer
column product using hydrophobic MFI zeolite membranes for a permeate pressure of
1 kPa and 5 kPa. The corresponding purity for the rectification column is also shown. 92
Figure 4.13: Simulation results for the separation performance of hydrophobic MFI
zeolite membrane (1.5 μm thick zeolite layer and 3 mm thick support) for aqueous feed
at an intermediate ethanol concentration of ~ 37 wt. % from beer column. Feed
temperature of 50 °C and a permeate pressure of (a) 1 kPa and (b) 5 kPa. The
corresponding purities for defect-free membranes are also shown. 92
Figure 4.14: Conceptual process flow diagram of bioethanol enrichment using defect-
free hydrophobic MFI zeolite membranes (M301) at intermediate ethanol concentration
feed (37 wt. %) obtained as the beer column side draw. The recycle stream from
molecular sieves is also fed to defect-free hydrophobic MFI zeolite membranes (M302).
The membrane area required is 21,000 m2 for M301 and 3,500 m2 for M302. 94
xiii
Figure 4.15: Simulation results for the separation performance of hydrophilic NaA
zeolite membrane for vaporized feed at an intermediate ethanol concentration of (a) ~
37 wt. % from beer column and (b) ~ 72 wt. % from molecular sieve recycle at 120 °C
and a permeate pressure of 10 kPa. 95
Figure 4.16: Conceptual process flow diagram of bioethanol enrichment using
hydrophilic NaA zeolite membranes (M401) at intermediate ethanol concentration feed
(37 wt. %) obtained as the beer column side draw. The recycle stream from molecular
sieves is also fed to hydrophilic NaA zeolite membranes (M402). The membrane area
required is 3,000 m2 for M401 and 300 m2 for M402. 97
Figure 4.17: Conceptual process flow diagram of bioethanol enrichment using defect-
free hydrophobic MFI zeolite membranes (M501) at intermediate ethanol concentration
feed (37 wt. %) obtained as the beer column side draw. The ethanol-enriched permeate
from M501 and the recycle stream from molecular sieves is fed to hydrophilic NaA
zeolite membranes (M502). The membrane area required is 8,000 m2 for M501 and
1,000 m2 for M502. 99
Figure 4.18: 20-year projection of Net Present Value (NPV) profits for a zeolite
membrane separation process for bioethanol enrichment of intermediate ethanol
concentration feed obtained at 37 wt. % from beer column using a combination of
hydrophobic and hydrophilic membranes over the distillation process based on the
NREL report [256]. Results shown for a membrane lifetime of 5 years, discount rate of
10 % and a membrane cost of $100-1,000/m2. 101
Figure 5.1: Schematic of (a) a conventional distillation column, and (b) a heat-
integrated vapor recompression distillation column for propane-propylene separation
(C3 splitter). 106
Figure 5.2: (a) Propylene purity obtained, and (b) membrane area required for
increasing recovery obtained using a single-stage membrane model for 70.0 mol %
propylene feed. 111
Figure 5.3: Membrane area required and capacity increment for propylene-propane
separation obtained by membrane-distillation hybrid over distillation column shown for
several membrane selectivity values. 112
Figure 5.4: Operational and capital expenses and savings for propylene-propane
separation by membrane-distillation hybrid over heat-integrated distillation column for
a membrane exhibiting a selectivity of (a) 50, (b) 100 and (b) 200. Results are shown
against the heat-integrated fraction which represents the amount of energy provided by
heat-integration. 114
Figure 5.5: (a) Schematic of membrane retrofitting in a reactor purge stream. The
original reactor configuration is shown with solid lines and the membrane retrofitting
part is shown with dashed lines. (b) Propylene purity against recovery obtained using a
single-stage membrane model for 80.0 mol % propylene feed at several values of
selectivity. (c) Propylene purity against selectivity obtained using a single-stage 116
xiv
membrane model for 90.0 % recovery shown for several feed compositions. (d)
Membrane area required for 80 mol % propylene feed at a total flowrate of 2.6 mol/s.
For a recovery of 90 %, this would correspond to 5 million lb propylene annually.
Figure 5.6: Net present value of profits for 90 % propylene recovery from a reactor
purge stream considering reactor pressure of 30 bar, annual propylene recovery of 5
million lb, and membrane permeance and selectivity of 100 GPU and 5, respectively. 117
1
Chapter 1: Introduction
The ability to separate a chemical mixture into its individual components is essential in
the chemical industry. Presently, most separations are accomplished using distillation.
Although distillation is a well-established technology due to its high flexibility and low
operational risk, it is energy-intensive with a thermodynamic efficiency of ~10% [1]. A
U.S. Department of Energy report states that > 40,000 distillation units are in operation in
the U.S., and consume much more energy than all other separation processes combined [1].
Alternatively, membrane separation is an energy efficient process and has a great potential
to either replace or supplement the existing distillation columns, and thus reduce energy
use and associated pollutant emissions.
Currently, polymeric membranes are dominant in the membrane industry. However,
zeolites (a class of inorganic crystalline materials) offer significant advantages over
polymers because of their excellent mechanical, thermal and chemical stability. In addition,
a uniform pore structure with a pore size ranging from 3 Å to 10 Å makes zeolites even
more effective for a wide variety of separations. However, despite significant investments
in research and development on zeolite membranes, only limited industrial implementation
has occurred [2]. A U.S. Department of Energy report (2005) suggested the development
of (i) defect-free thin films and (ii) predictive membrane performance models as the key
areas of future research [3]. In recent years, although significant progress has been made
in preparation and characterization of zeolite membranes, rigorous models which can
predict the membrane performance in industrial settings are still lacking.
The permeation through a zeolite membrane is a complex process and is usually
represented in terms of permeance and selectivity [4,5]. Permeance (ease of mobility) is
the rate of flow per unit area per unit driving force while selectivity (ability to separate) is
2
the ratio of permeance of the two species being separated. A zeolite membrane consists of
a thin zeolite film over a porous support. Molecular transport should be governed by the
selective zeolite film, where permeance and selectivity depend on the adsorption (adhesion
of a molecule on the membrane surface) and diffusion (movement of a molecule from a
region of high concentration to low concentration) properties of the mixture components.
However, other resistances to transport (i.e. from the porous support and/or the boundary
layer) can also affect performance. Though the support layer has larger pores, it is relatively
thicker and may provide a comparable resistance. Furthermore, formation of a boundary
layer in the fluid adjacent to the membrane surface also deteriorates the performance. The
presence of defects formed during synthesis also affects the permeance and selectivity.
Zeolite membranes have shown good separation at laboratory scale for various
applications such as bioethanol enrichment, hydrogen recovery, natural gas purification,
butane isomer separation, xylene isomer separation, etc. Currently, zeolite membranes are
implemented in industry only for solvent dehydration applications but the recent progress
should pave the way for the industrial implementation for other applications [2].
Mathematical and process modeling plays an important role in the implementation and
evaluation of any new technology or application. However, no rigorous models exists for
zeolite membranes, which set the aim of this PhD research, i.e., to develop such enabling
tools that can assess the potential of zeolite membranes in industry. The specific objectives
are to (i) design and develop a detailed mathematical model of a zeolite membrane
separation process for accurate performance prediction under wide range of operating
conditions, and (ii) develop and optimize a conceptual process design approach and
perform a techno-economic evaluation for several significant application specific
flowsheets.
3
Chapter 2 focuses on developing a framework for membrane modeling. First, a
fundamental understanding of transport phenomena underlying the zeolite membrane
operation is developed, and models that can quantitatively describe these phenomena are
reviewed. Permeation through zeolite film is described through adsorption-diffusion
phenomenon; both single-component and mixtures are considered. Further, several non-
idealities and their effect on modeling is also considered. In addition to the adsorption and
diffusion based transport through zeolite layer, factors such as mass transfer through the
porous support, the use of a sweep gas, concentration polarization phenomenon and
presence of defects are also discussed. The adsorption-diffusion model (including external
resistances) is then integrated with the process-scale governing equations to assess the
industrial potential of zeolite membranes; both the stand alone and hybrid membrane-
distillation processes are considered. This chapter is adapted from N. Rangnekar, N. Mittal,
et al., Chem. Soc. Rev. 44 (2015) 7128–7154.
Chapter 3 focuses on the application of the model for butane isomer separation. The
application was selected because the availability of both (i) molecular level transport
properties and (ii) industrial scale distillation data allows for a rigorous mathematical
description of membrane performance and its detailed comparison with the current
industrial practice. Moreover, butanes offer a great opportunity for implementation of
novel separation technologies since they are used as a fuel and as a feedstock to make
plastics and their global market is growing at an annual rate of 2.46% [6]. A key issue
addressed in this chapter is that the adsorption and diffusion parameters shall be carefully
reviewed and selected. While adsorption properties determined using different
measurement techniques are in good agreement, the diffusivities can vary up to three orders
of magnitude based on how these coefficients are determined [7]. The detailed analysis on
adsorption and diffusion studies combined with external resistances not only improves the
4
understanding of discrepancies between the results obtained by experiments and modeling,
but also determines the scope of improvement in the current state-of-the-art membranes.
Finally, a techno-economic analysis using a process-scale model is also performed to
generate a set of performance targets in term of the permeance and the membrane cost.
This chapter is adapted from Mittal et al., J. Memb. Sci. 520 (2016) 434–449.
Chapter 4 focuses on the application for bioethanol enrichment, and discusses the role
of hydrophilic and hydrophobic zeolite membranes. This extends the scope of modeling to
bio-refineries related application. An important issue addressed, here, is the presence of
non-idealities and defects which leads to failure of ideal models for determining the
mixture adsorption and diffusion properties. Thus, atomistic-level simulations are carried
out to obtain a consistent set of mixture adsorption and diffusion properties incorporating
the effects of hydrogen bonding. The results obtained from membrane modeling are further
incorporated in design studies illustrating how the atomistic-level properties can be used
in process-level simulation. Another key issue addressed here is that membrane separation
is not necessarily energy-efficient. For applications including pervaporation (as for most
of the bio-refinery related applications) where the feed is liquid while the permeate is
vaporized, the energy for this vaporization should be supplied and can make the process
energy-intensive. Both the above-mentioned issues are incorporated in modeling ethanol-
water separation. Further, several conceptual designs are considered and a techno-
economic analysis is performed to determine the optimum combination of distillation and
membrane separation. This chapter is adapted from Mittal et al., J. Memb. Sci. 540 (2017)
464–476.
Chapter 5 focuses on comparing the membrane performance with heat-integrated
distillation, and is illustrated for propylene-propane separation. While conventional
distillation is usually-intensive, heat-integration within the column can significantly reduce
5
the energy consumption. If these energy savings can be realized in practice, there is little
room left for membrane technology [8]. However, such designs are not routinely employed
due to operational and control challenges [9]. Instead heat-integration can be implemented
through other parts of the plant generating extra amount of low-grade heat, such as, quench
water. Therefore, a range of possible scenaria for the level of heat integration is examined
with thermally non-integrated and fully-integrated distillation columns as the upper and
lower boundaries of energy requirement. The debottlenecking of existing distillation
columns, i.e., implementing membranes in hybrid configuration with existing distillation
column to increase the overall capacity, is also considered. This chapter is adapted from X.
Ma, P. Kumar, N. Mittal, et al. which is currently submitted for publication.
6
Chapter 2: Zeolite membrane modeling review
and advancements
2.1 Introduction
Zeolite membranes offer an attractive alternative to conventional energy intensive
separation processes [10–14]. Their chemical and thermal stability, and well-defined pore
structure with pore sizes ranging from 0.3-1.0 nm allow for high-selectivity separations at
a wide range of operating conditions. Although zeolite membranes have shown remarkable
progress at laboratory scale [2,15–22] and promising results have been obtained for various
industrially relevant applications such as alcohol dehydration [15,23–26], butane isomer
separation [20,27–31], xylene isomer separation [28–31] and natural gas purification [32–
35] , only hydrophilic membranes used in the dehydration of industrial solvents have been
commercialized to date [2,13]. To explore the commercialization potential of zeolite
membranes, rigorous models and process designs which can predict the currently achieved
performance and set targets for membrane cost and performance improvements are
essential. These rather complicated models should be further validated by comparison with
experiments and included in the process models that describe permeation through
membranes at a wide range of operating conditions as encountered by membranes in
industrial use.
A schematic of the membrane structure in a typical laboratory setting is shown in
Figure 2.1a. The membrane structure consists of a zeolite layer on a porous support. The
feed stream is passed across the retentate side facing the zeolite film, and the permeating
species are collected by flowing a sweep gas across the permeate side. Compartments on
both sides of the membrane i.e., the retentate side and the permeate side are usually well-
7
mixed in a lab experiment. In the following sections, the transport mechanism and model
development for permeation through zeolite membrane is described.
Figure 2.1: Schematic of (a) a zeolite membrane in a typical laboratory setting. (b) a tubular
zeolite membrane at a process scale.
2.2 Transport model for zeolite layer
To determine the permeation through zeolite layer, a fundamental understanding of
transport phenomena underlying the membrane operation, and models that can
quantitatively describe these phenomena, are necessary. When the size of the molecules
permeating through the zeolite pores is comparable to the pore diameter, which is often the
case for selective separation, molecules permeate at a regime commonly known as
intracrystalline or configurational diffusion. Permeation in this regime is a complex process
that depends on both the adsorption and diffusion properties of the permeating species in
the mixture [16,23,36–41]. The adsorption and diffusion properties at this microscopic
level are obtained using experimental and simulation techniques, fitted to adsorption and
diffusion models, and then finally used in continuum models to determine the flux through
the zeolite membranes. While most modeling studies employ simple ideal theories based
8
on single-component adsorption and diffusion properties [42–47], the intermolecular
interactions can be far from ideal and may lead to the failure of these theories [48–54].
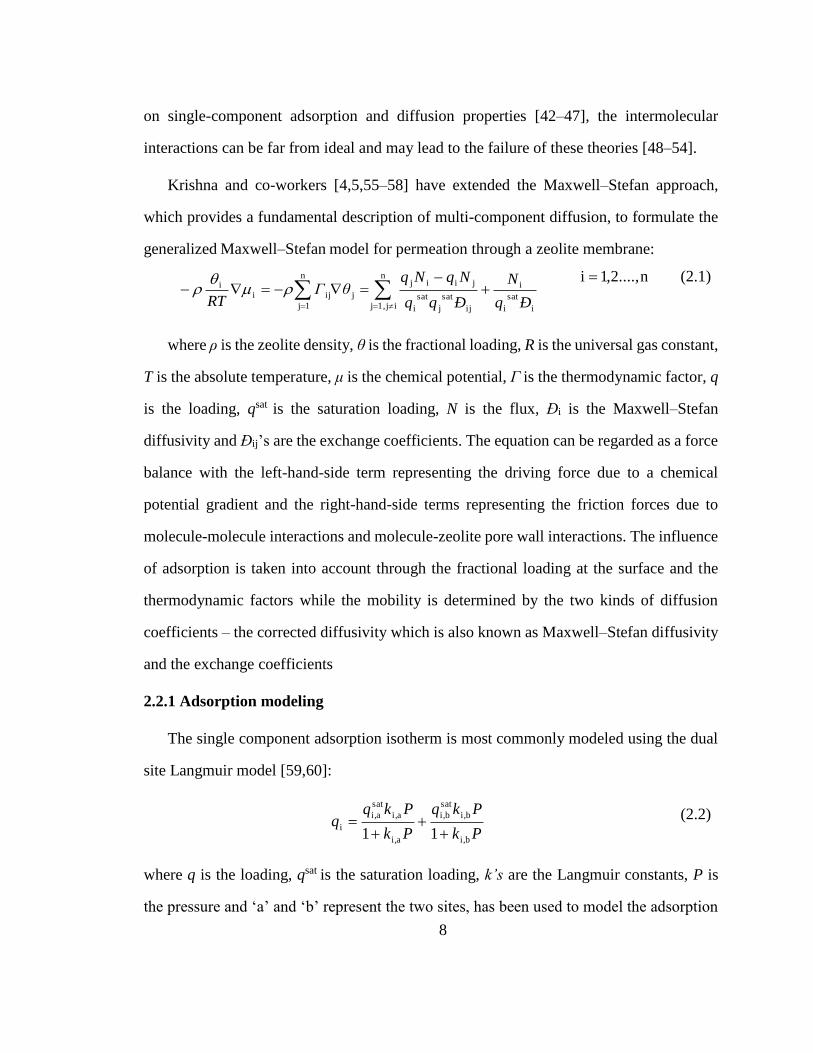
Krishna and co-workers [4,5,55–58] have extended the Maxwell–Stefan approach,
which provides a fundamental description of multi-component diffusion, to formulate the
generalized Maxwell–Stefan model for permeation through a zeolite membrane:
where ρ is the zeolite density, θ is the fractional loading, R is the universal gas constant,
T is the absolute temperature, μ is the chemical potential, Γ is the thermodynamic factor, q
is the loading, qsat is the saturation loading, N is the flux, Đi is the Maxwell–Stefan
diffusivity and Đij’s are the exchange coefficients. The equation can be regarded as a force
balance with the left-hand-side term representing the driving force due to a chemical
potential gradient and the right-hand-side terms representing the friction forces due to
molecule-molecule interactions and molecule-zeolite pore wall interactions. The influence
of adsorption is taken into account through the fractional loading at the surface and the
thermodynamic factors while the mobility is determined by the two kinds of diffusion
coefficients – the corrected diffusivity which is also known as Maxwell–Stefan diffusivity
and the exchange coefficients
2.2.1 Adsorption modeling
The single component adsorption isotherm is most commonly modeled using the dual
site Langmuir model [59,60]:
where q is the loading, qsat is the saturation loading, k’s are the Langmuir constants, P is
the pressure and ‘a’ and ‘b’ represent the two sites, has been used to model the adsorption
i
sat
i
in
ij1,j ij
sat
j
sat
i
jiijn
1j
jijii
Ðq
N
Ðqq
NqNqθΓ
RT
n....,2,1i (2.1)
Pk
Pkq
Pk
Pkqq
bi,
bi,
sat
bi,
ai,
ai,
sat
ai,
i11
(2.2)
9
isotherm. Other forms of the isotherm e.g. Toth, Langmuir–Sip, Langmuir–Freundlich.
have also been used [50,61]. The single component adsorption are well studied as they can
be measured with good accuracy and thus can be validated experimentally. However multi-
component adsorption experiments are challenging, and is discussed next.
The multi-component adsorption is usually determined by models based on the
information gained by single-component isotherm. However, these results are difficult to
validate experimentally, and thus are usually validated by molecular simulations. Various
models have been suggested for multi-component adsorption. The mixture isotherm can be
predicted, from the single component isotherm, by implementing appropriate mixture rules
based on dual-site Langmuir isotherm [62]
where q is the loading, qsat is the saturation loading, k’s are the Langmuir constants, P is
the pressure, and ‘A’ and ‘B’ represent the two sites and ‘1’ and ‘2’ represents the two
components, has been used to model the adsorption isotherm. However, the use of mixture
rules is only moderately successful and a thermodynamically consistent model, known as
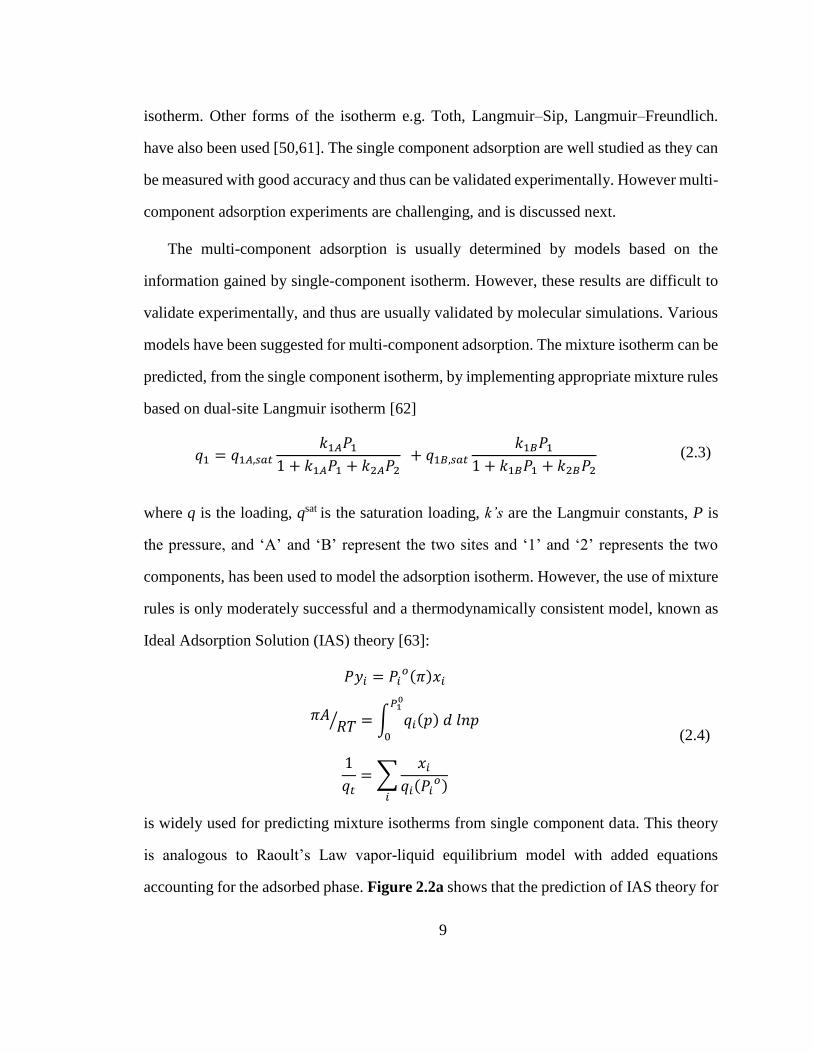
Ideal Adsorption Solution (IAS) theory [63]:
is widely used for predicting mixture isotherms from single component data. This theory
is analogous to Raoult’s Law vapor-liquid equilibrium model with added equations
accounting for the adsorbed phase. Figure 2.2a shows that the prediction of IAS theory for
𝑞1 = 𝑞1𝐴,𝑠𝑎𝑡
𝑘1𝐴𝑃1
1 + 𝑘1𝐴𝑃1 + 𝑘2𝐴𝑃2 + 𝑞1𝐵,𝑠𝑎𝑡
𝑘1𝐵𝑃1
1 + 𝑘1𝐵𝑃1 + 𝑘2𝐵𝑃2
(2.3)
𝑃𝑦𝑖 = 𝑃𝑖𝑜(𝜋)𝑥𝑖
𝜋𝐴𝑅𝑇⁄ = ∫ 𝑞𝑖(𝑝) 𝑑 𝑙𝑛𝑝
𝑃10
0
1
𝑞𝑡= ∑
𝑥𝑖
𝑞𝑖(𝑃𝑖𝑜)
𝑖
(2.4)
10
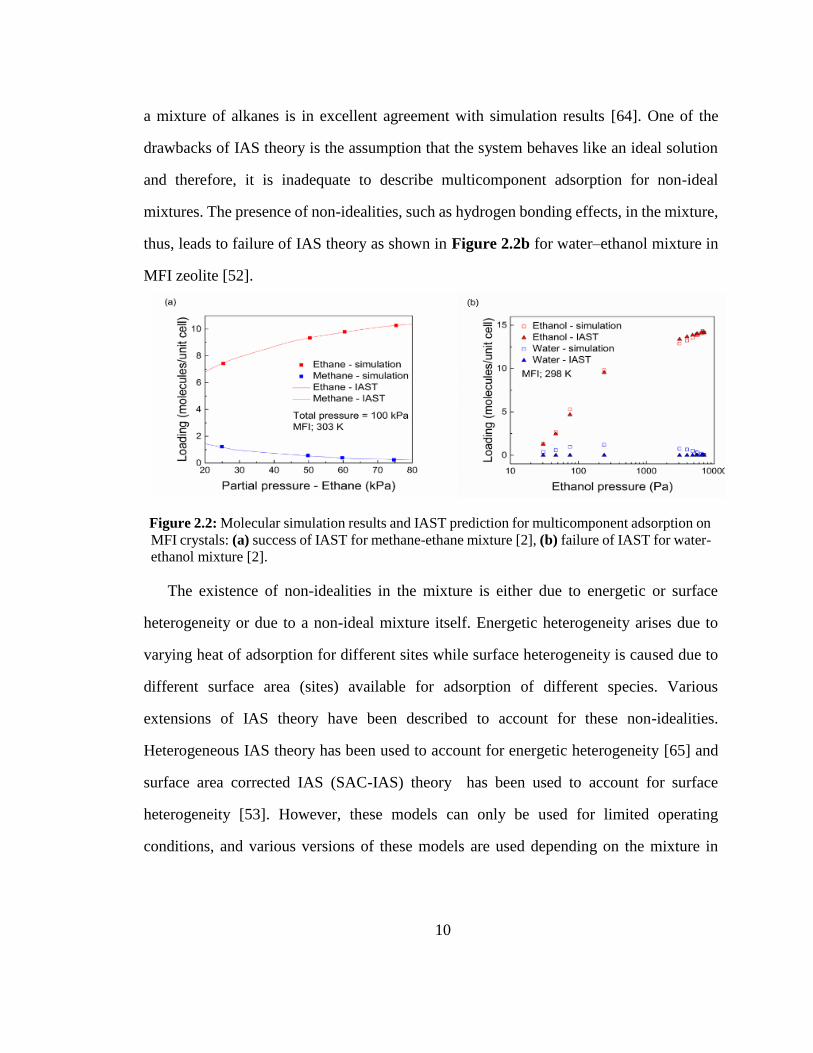
a mixture of alkanes is in excellent agreement with simulation results [64]. One of the
drawbacks of IAS theory is the assumption that the system behaves like an ideal solution
and therefore, it is inadequate to describe multicomponent adsorption for non-ideal
mixtures. The presence of non-idealities, such as hydrogen bonding effects, in the mixture,
thus, leads to failure of IAS theory as shown in Figure 2.2b for water–ethanol mixture in
MFI zeolite [52].
Figure 2.2: Molecular simulation results and IAST prediction for multicomponent adsorption on
MFI crystals: (a) success of IAST for methane-ethane mixture [2], (b) failure of IAST for water-
ethanol mixture [2].
The existence of non-idealities in the mixture is either due to energetic or surface
heterogeneity or due to a non-ideal mixture itself. Energetic heterogeneity arises due to
varying heat of adsorption for different sites while surface heterogeneity is caused due to
different surface area (sites) available for adsorption of different species. Various
extensions of IAS theory have been described to account for these non-idealities.
Heterogeneous IAS theory has been used to account for energetic heterogeneity [65] and
surface area corrected IAS (SAC-IAS) theory has been used to account for surface
heterogeneity [53]. However, these models can only be used for limited operating
conditions, and various versions of these models are used depending on the mixture in
11
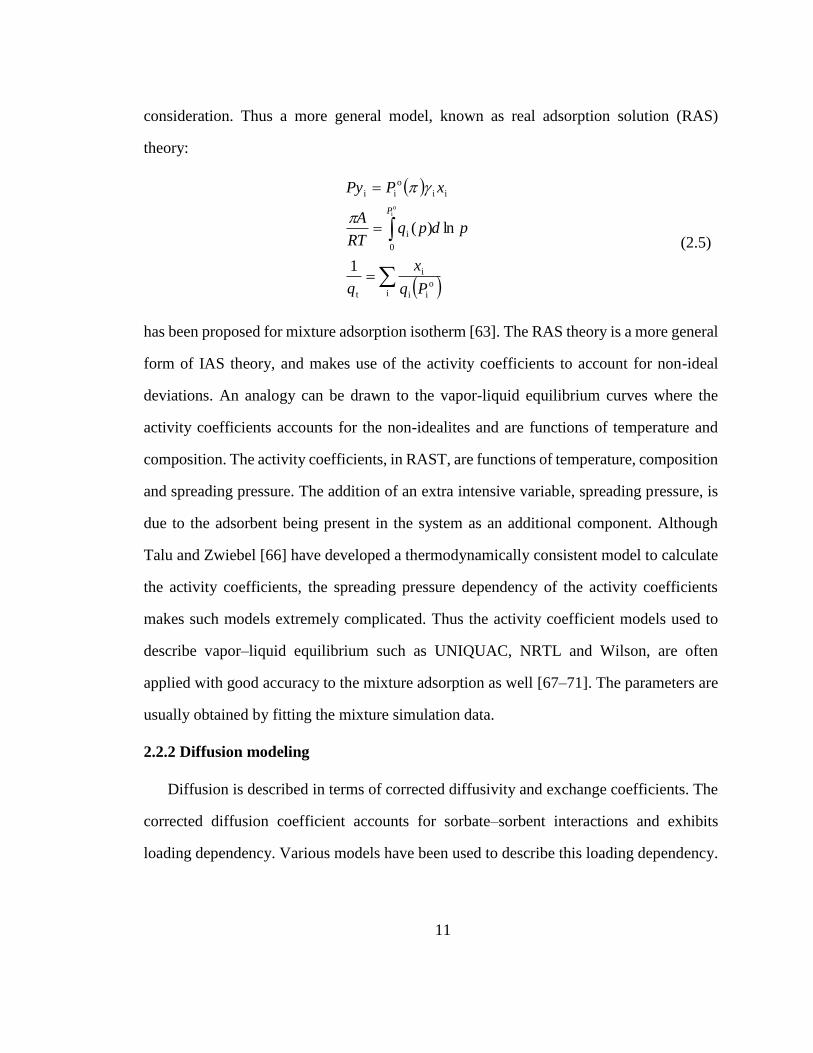
consideration. Thus a more general model, known as real adsorption solution (RAS)
theory:
has been proposed for mixture adsorption isotherm [63]. The RAS theory is a more general
form of IAS theory, and makes use of the activity coefficients to account for non-ideal
deviations. An analogy can be drawn to the vapor-liquid equilibrium curves where the
activity coefficients accounts for the non-idealites and are functions of temperature and
composition. The activity coefficients, in RAST, are functions of temperature, composition
and spreading pressure. The addition of an extra intensive variable, spreading pressure, is
due to the adsorbent being present in the system as an additional component. Although
Talu and Zwiebel [66] have developed a thermodynamically consistent model to calculate
the activity coefficients, the spreading pressure dependency of the activity coefficients
makes such models extremely complicated. Thus the activity coefficient models used to
describe vapor–liquid equilibrium such as UNIQUAC, NRTL and Wilson, are often
applied with good accuracy to the mixture adsorption as well [67–71]. The parameters are
usually obtained by fitting the mixture simulation data.
2.2.2 Diffusion modeling
Diffusion is described in terms of corrected diffusivity and exchange coefficients. The
corrected diffusion coefficient accounts for sorbate–sorbent interactions and exhibits
loading dependency. Various models have been used to describe this loading dependency.
io
ii
i
t
0
i
ii
o
ii
1
ln)(
oi
Pq
x
q
pdpqRT
A
xPPy
P
(2.5)
12
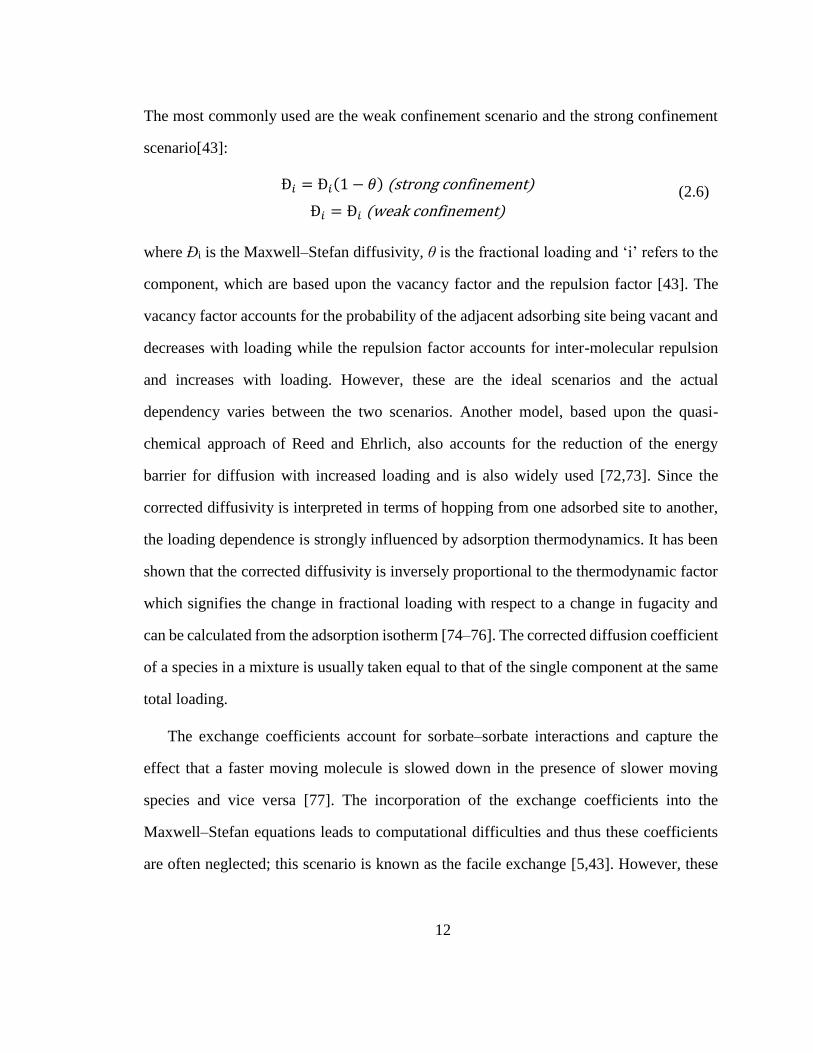
The most commonly used are the weak confinement scenario and the strong confinement
scenario[43]:
where Đi is the Maxwell–Stefan diffusivity, θ is the fractional loading and ‘i’ refers to the
component, which are based upon the vacancy factor and the repulsion factor [43]. The
vacancy factor accounts for the probability of the adjacent adsorbing site being vacant and
decreases with loading while the repulsion factor accounts for inter-molecular repulsion
and increases with loading. However, these are the ideal scenarios and the actual
dependency varies between the two scenarios. Another model, based upon the quasi-
chemical approach of Reed and Ehrlich, also accounts for the reduction of the energy
barrier for diffusion with increased loading and is also widely used [72,73]. Since the
corrected diffusivity is interpreted in terms of hopping from one adsorbed site to another,
the loading dependence is strongly influenced by adsorption thermodynamics. It has been
shown that the corrected diffusivity is inversely proportional to the thermodynamic factor
which signifies the change in fractional loading with respect to a change in fugacity and
can be calculated from the adsorption isotherm [74–76]. The corrected diffusion coefficient
of a species in a mixture is usually taken equal to that of the single component at the same
total loading.
The exchange coefficients account for sorbate–sorbate interactions and capture the
effect that a faster moving molecule is slowed down in the presence of slower moving
species and vice versa [77]. The incorporation of the exchange coefficients into the
Maxwell–Stefan equations leads to computational difficulties and thus these coefficients
are often neglected; this scenario is known as the facile exchange [5,43]. However, these
Đ𝑖 = Đ𝑖(1 − 𝜃) (strong confinement)
Đ𝑖 = Đ𝑖 (weak confinement)
(2.6)
13
effects have been shown to be significant and various models have been proposed for their
incorporation [51]. The two most commonly used models are, (i) Vignes correlation:
where Đi is the Maxwell–Stefan diffusivity, q is the loading and ‘i’ refers to the component,
for species with similar loading and (ii) the correlation developed by Sholl [43]:
where Đi is the Maxwell–Stefan diffusivity, θ is the fractional loading, q is the loading and
‘i’ refers to the component for species with variable loading. Since the exchange
coefficients capture the sorbate–sorbate interactions, it has also been found that there is a
dependence of the exchange coefficients on the corresponding fluid phase diffusivity; the
proportionality factor depends upon the degree of confinement and the correlation effect
increases with the degree of confinement [78]. The factor is often linearly dependent upon
the degree of confinement, however, other expressions such as Darken-type interpolation
and Vignes-type interpolation have also been proposed [78].
Although several have models have been developed and used to describe the diffusion
in zeolites, there exists scenarios where the Maxwell–Stefan model has failed to provide
quantitative agreement with the experimental results. One of the examples is the xylene
isomer separation using MFI zeolite membranes. The diffusion characteristics of p-xylene
and o-xylene in MFI crystals have been extensively studied [79–81]. Though the
permeance of p-xylene has been observed to be of the same magnitude, the Maxwell–
Stefan model predicts much higher o-xylene permeance as compared to the experiments.
Although this discrepancy is widely recognized, the reason behind this phenomenon is not
developed. The discrepancy may be attributed to surface resistances in zeolite crystals or
Đ𝑖𝑗 = Đ𝑖
𝑞𝑖𝑞𝑖+𝑞𝑗 Đ𝑗
𝑞𝑗
𝑞𝑖+𝑞𝑗 (2.7)
𝜃𝑗,𝑠𝑎𝑡Đ𝑖𝑗 = (𝜃𝑗,𝑠𝑎𝑡Đ𝑖)𝑞𝑖
𝑞𝑖+𝑞𝑗(𝜃𝑖,𝑠𝑎𝑡Đ𝑗)
𝑞𝑗
𝑞𝑖+𝑞𝑗
(2.8)
14
to the changes in crystal structure on adsorption of p-xylene [82]. It can also be due to the
fact that the diffusion coefficient used in the Maxwell–Stefan equations was measured for
a flexible zeolite crystal while an intergrown supported membrane is constrained by a
support and does not permit flexibility, as in the case of a free crystal.
Another phenomenon where the Maxwell–Stefan approach fails is the intersection
blocking [83]. It is usually observed when branched or cyclic hydrocarbons are present in
the mixture along with linear hydrocarbons in MFI. The branched hydrocarbon
preferentially adsorbs at the intersection of MFI membranes which causes blocking of the
pore and severely reduces the diffusivity of the normal alkane [60]. In general, the tardy
species slows down the fast moving species and the effects are captured by the exchange
coefficients but this effect is more severe and can cause the diffusivity of n-alkane to reduce
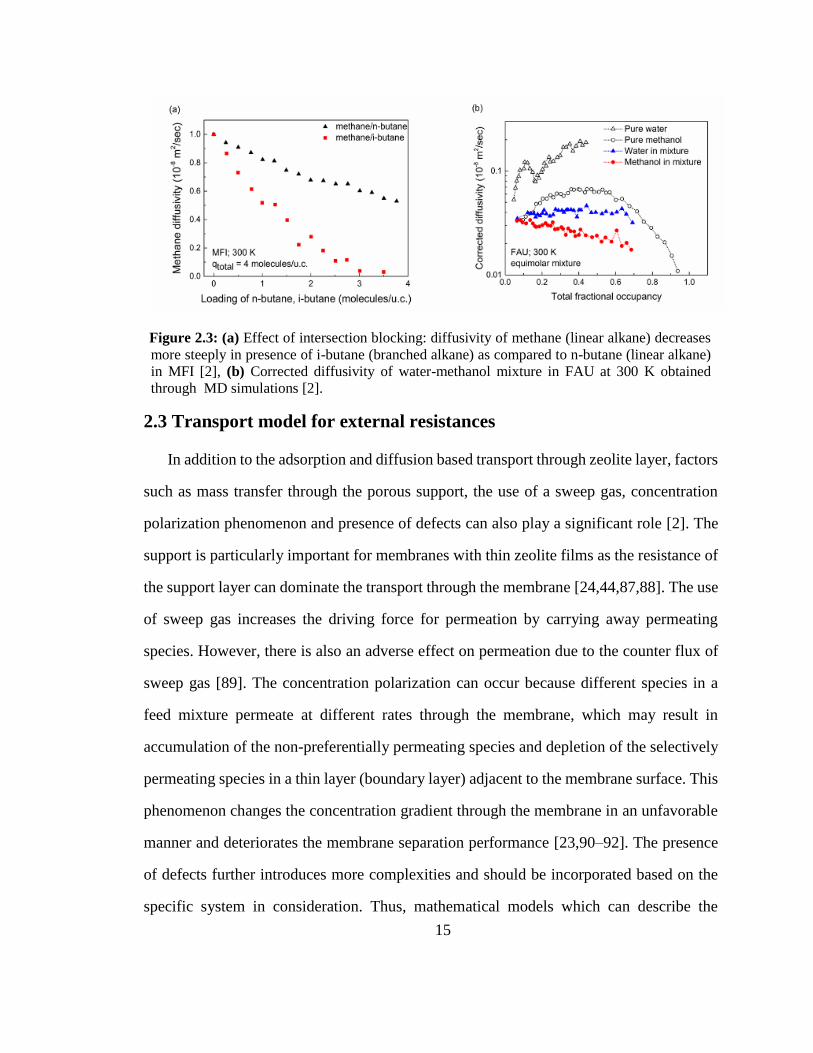
nearly to zero. The effect of intersection blocking for methane in the presence of i-butane
is shown in Figure 2.3a. The reduction in diffusivity is more severe as compared to the
methane–n-butane mixture, which does not have intersection blocking [83]. The corrected
diffusivities for water-methanol mixture are also decreased due to the presence of hydrogen
bonding (Figure 2.3b). Thus, using the single component data to predict the separation
performance often leads to higher predicted flux and higher separation factors than
experimentally feasible [84–86]. Further, the loading dependency shall be studied and
modeled for specific mixture in consideration.
15
Figure 2.3: (a) Effect of intersection blocking: diffusivity of methane (linear alkane) decreases
more steeply in presence of i-butane (branched alkane) as compared to n-butane (linear alkane)
in MFI [2], (b) Corrected diffusivity of water-methanol mixture in FAU at 300 K obtained
through MD simulations [2].
2.3 Transport model for external resistances
In addition to the adsorption and diffusion based transport through zeolite layer, factors
such as mass transfer through the porous support, the use of a sweep gas, concentration
polarization phenomenon and presence of defects can also play a significant role [2]. The
support is particularly important for membranes with thin zeolite films as the resistance of
the support layer can dominate the transport through the membrane [24,44,87,88]. The use
of sweep gas increases the driving force for permeation by carrying away permeating
species. However, there is also an adverse effect on permeation due to the counter flux of
sweep gas [89]. The concentration polarization can occur because different species in a
feed mixture permeate at different rates through the membrane, which may result in
accumulation of the non-preferentially permeating species and depletion of the selectively
permeating species in a thin layer (boundary layer) adjacent to the membrane surface. This
phenomenon changes the concentration gradient through the membrane in an unfavorable
manner and deteriorates the membrane separation performance [23,90–92]. The presence
of defects further introduces more complexities and should be incorporated based on the
specific system in consideration. Thus, mathematical models which can describe the
16
support layer, permeation of sweep gas, concentration polarization and defects should also
be incorporated in the design of zeolite membrane systems.
2.3.1 Model for the support
The zeolite membranes are grown on a porous support. The support layer is usually
neglected in most of the modeling studies. However, it has been shown that the support
can play a significant role especially in thin or high-flux membranes [44,88]. The
significant mass transfer resistance in the support adversely affects the separation
performance of MFI and FAU membranes for ethanol/water separation [35]. The effect is
more prominent for strongly adsorbing species as shown for H2/CO2 separation where the
pressure drop for CO2 over the support was quite large and influenced the separation
performance [93]. Thus, flux and selectivity for high flux membranes can be increased by
preparing less resistive supports. It is essential to incorporate transport resistance effects
due to the support layer in permeation models. The models proposed in the literature are
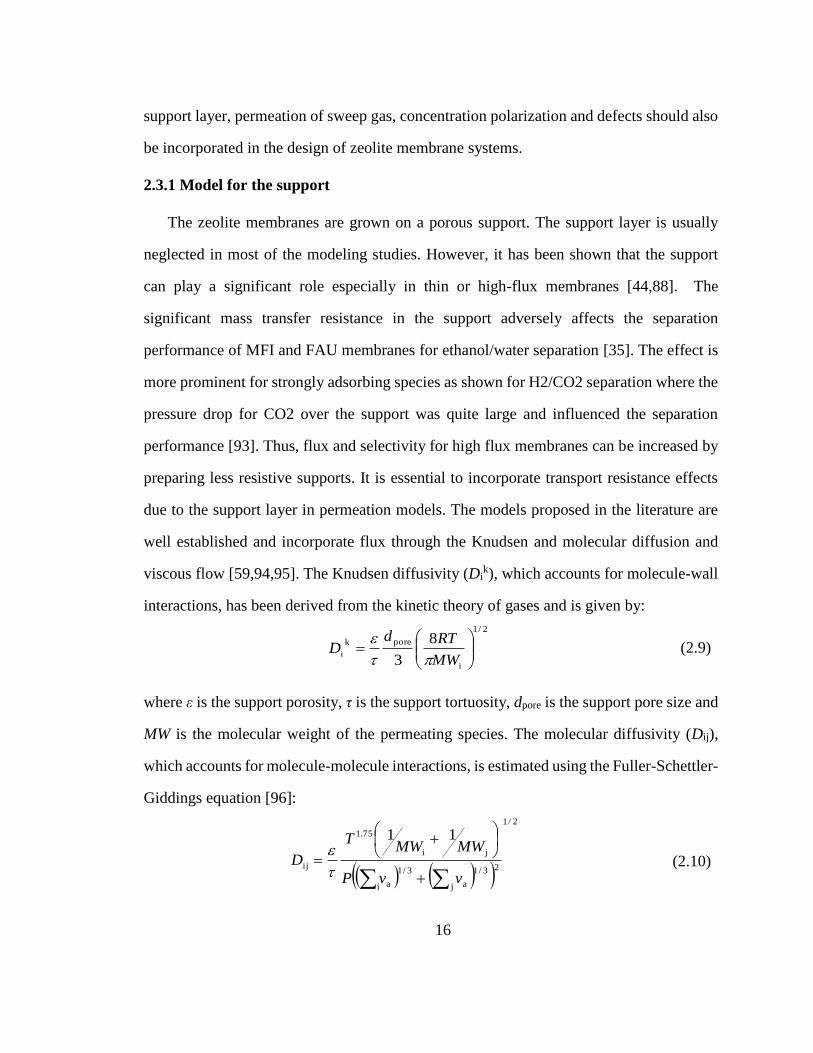
well established and incorporate flux through the Knudsen and molecular diffusion and
viscous flow [59,94,95]. The Knudsen diffusivity (Dik), which accounts for molecule-wall
interactions, has been derived from the kinetic theory of gases and is given by:
2/1
i
porek
i
8
3
MW
RTdD
(2.9)
where ε is the support porosity, τ is the support tortuosity, dpore is the support pore size and
MW is the molecular weight of the permeating species. The molecular diffusivity (Dij),
which accounts for molecule-molecule interactions, is estimated using the Fuller-Schettler-
Giddings equation [96]:
2/1
23/1
j a
3/1
i a
ji
75.1
ij
11
vvP
MWMWT
D
(2.10)
17
where P is the total pressure and va is the atomic volume. The partial pressure gradient due
to these interactions is additive and is given by:
n
ij1,j ij
jiij
k
i
ii1
D
NxNx
D
N
dz
dp
RT n....,2,1i (2.11)
In addition to Knudsen and molecular diffusion, a finite total pressure gradient across the
support also gives rise to viscous flux:
dz
dP
RT
pN
iiv,
32
2
pored
n....,2,1i (2.12)
where μ is the mixture viscosity. The total flux is obtained by the summation of the viscous
flux and the flux obtained in Eq. 4.
To solve the coupled partial differential equations for the zeolite and the support layer,
boundary conditions are required at the retentate side, the permeate side, and also at the
zeolite-support interface. In the absence of any external resistance (the effects of external
resistance are discussed in the next section), the loading at the feed side is calculated
assuming equilibrium between feed partial pressure and loading at the zeolite layer. At the
zeolite-support interface, the boundary conditions are obtained by assuming that no
accumulation occurs at the interface i.e. the flux of a component leaving the zeolite layer
is equal to the flux entering the support layer. Equilibrium is also assumed between the
loading at the zeolite layer and the partial pressure in the support layer at the interface. At
the permeate side, the total pressure is usually fixed and known, and the mole fractions are
calculated iteratively from the steady state flux of the components:
i
i
ii
N
Nx (2.13)
18
2.3.2 Model for the sweep gas
Thus, the effects of the sweep gas are twofold. While it increases the driving force by
carrying away the permeating species and reducing their partial pressure on the permeate
side, it also introduces a counter flux (against the permeating direction) that can have an
adverse effect on permeation [89]. The use of sweep gas has been shown to improve the
separation performance for methane/ethane separation. However, a higher pressure of
helium on the permeate side increases its counter flux and thus decreases the permeance of
ethane [89]. This counter flux affects the permeation only through the support layer
because permeation of adsorbed species through the zeolite layer is not affected by non-
adsorbing sweep gas. Thus, for a fixed total pressure on both sides (the retentate side and
the permeate side) of the membrane, the use of sweep gas decreases the resistance through
the zeolite layer by increasing the driving force, and increases the resistance through the
support layer by introducing a counter-flux. Usually, the increase in driving force
dominates the effect due to counter-flow, and membranes operated with a sweep gas result
in higher flux and separation factor as compared to the membranes operated without sweep.
However, this improvement by the introduction of a sweep is effective only if the transport
in the membrane is governed by the zeolite layer.
The effects due to the use of sweep gas (helium is considered here) are also
incorporated into the model. Since, helium has been shown to be non-adsorbing on MFI
zeolites [73] and that its density inside the zeolite is lower than that in the gas phase, its
permeation through the zeolite layer is modeled using Knudsen diffusion and viscous flow.
The effective pore diameter is calculated by subtracting the diameter of the helium atom
from the zeolite pore size. As steady-state permeation of adsorbed species through the
zeolite layer has been shown to be unaffected by non-adsorbed species [97], it is assumed
that helium permeates only through the pores unoccupied by the adsorbed species. As a
19
result, the helium flux through the zeolite layer is further reduced by a factor equal to
fractional vacancy, given by (1-∑θi). Similar to other components, permeation of sweep
gas through the support is modeled considering contributions from Knudsen and molecular
diffusion, and viscous flow.
2.3.3 Model for the concentration polarization
The concentration polarization (Figure 2.4a) increases the concentration of the non-
preferentially permeating species and decreases the concentration of the selectively
permeating species at the membrane surface as compared to that in the bulk feed. In most
of the modeling studies, this change in concentration is neglected and the loading at the
zeolite layer is assumed to be in equilibrium with the bulk feed concentration. However,
concentration polarization can significantly affect the separation performance and
appropriate models that can describe this behavior are essential [92,98]. It has been shown
that the CO2/CH4 selectivity increased by 180% and CO2 flux by 80% when measures
were taken to reduce the external boundary layer resistance for a SAPO-34 membrane [92],
as shown in Figure 2.4b. Various models have been proposed in the literature to include
its effect by introducing a mass transfer coefficient, [93,99,100] or solving the full
concentration profile in the boundary layer [101,102]. In other studies, a simple resistance-
in-series model is used to describe the effects of concentration polarization, however this
approach applies only to the preferentially permeating component and does not account for
accumulation of non-preferentially permeating species.
20
Figure 2.4: (a) Schematic of concentration polarization for permeation through a zeolite
membrane, (b) Effect of concentration polarization: CO2 flux through a SAPO-34 membrane for
an equimolar mixture of CO2/CH4 at 295 K [2].
As solving for the velocity and concentration profile in the boundary layer is
challenging, an alternative approach based on mass transport equations is used in this
research [103]. In this approach, the effect of concentration polarization is determined
through a parameter, known as concentration polarization index, which is defined as the
ratio of mole fraction of the preferentially permeating component in the bulk feed to that
at the membrane surface. This index determines the severity of the concentration
polarization and is strengthened with increase in membrane enrichment and/or membrane
permeability, or with decrease in the external mass transfer coefficient (in the boundary
layer). An expression to calculate the concentration polarization index has been modeled
using this approach [103] and given by;
where α is the enrichment factor, v is the molar average velocity through the membrane
which represents the membrane permeability, k is the external mass transfer coefficient of
the more permeable component and ‘f’, ‘s’ and ‘p’ denote the bulk feed, membrane surface
and permeate, respectively. While membrane permeability and enrichment are intrinsic
s
p
f
s ;/exp1
1
X
X
kvX
X
(2.14)
21
properties of the membranes, the mass transfer coefficient depends on the module geometry
and flow conditions, and is generally represented in terms of the Sherwood number (Sh)
[104,105].
2.3.4 Model for the defects
Another common assumption in modeling zeolite membranes is that they are defect
free. However, it has been illustrated that the defects can significantly affect the separation
performance in H2/CO2 separation, [93] xylene isomer separation [106], etc. It has also
been shown that defects can be induced and shrunk or expanded during adsorption and
affect the permeation [82]. Permporometry, flux of molecules larger than zeolite pores and
the ratio of single gas permeance, and other methods have been used to characterize defects
[16,107–109]. These effects have been incorporated in some of the modeling studies by
determining the permeation through the defects as a combination of Knudsen diffusion and
Poiseuille flow [110,111]. A general pore network model has also been developed to
account for the flux through intercrystalline pores [112]. However, the defects majorly
depends upon the method of preparation of the membranes and the results can vary widely
across the various experiments. Thus, the defects are usually incorporated by modifying
the equations based on the system in consideration.
2.4 Process model for zeolite membranes
In the model developed above to describe the permeation at lab-scale, the retentate and
the permeate compartments are assumed to be well-mixed. Such designs assume that the
operating conditions do not change along the module length, resulting in fixed permeance
and selectivity. However, simulation of a membrane process requires the use of models
that account for changes in operating conditions along the membrane length. Thus, the
detailed mathematical model for permeation through zeolite membrane is integrated with
22
process models to develop a process-scale model of the zeolite membrane, and described
next.
2.4.1 Stand-alone membrane process
A tubular membrane design (single tube cartridge or tubes packed together in small
bundle) is considered, and a schematic of a single circular tube with feed on the shell side
is shown in Figure 2.1b. The feed can flow on either side, depending upon the position of
the zeolite layer.
A plug flow model is used on the retentate and the permeate sides. The governing mass
balance equations for each component are as follows:
where the +ve sign refers to the retentate side while the -sign refers to the permeate side, F
is the flow rate along the membrane, J is the flux through the membrane, r is the external
radius of the tube and N is the total number of tubes in a bundle. As it may be difficult to
maintain turbulence in sub-cm radius tubes, only laminar flow is considered, and the
pressure drop on the retentate side along the membrane length is modeled using the Hagen-
Poiseuille equation:
where P refers to the total pressure [105]. The physical properties, i.e. mixture density (ρ),
and viscosity (µ) are obtained using Soave-Redlich-Kwong (SRK) method [113] and
SuperTRAPP method [114], respectively, and are incorporated into gPROMS [115] as a
Multiflash file by using the physical properties foreign object tool. The flux through the
membrane is obtained using the detailed Maxwell-Stefan model developed in the previous
ii π2 rNJ
dx
dF
(2.15)
Nr
F
dx
dP4π
8 (2.16)
23
sections. Accordingly, the partial pressure (p) on both the retentate and the permeate side
across the membrane are obtained as follows:
PF
Fp
j j
ii
(2.17)
This complete model, i.e., the flow model along the membrane length combined with the
Maxwell-Stefan model for membrane transport is solved using gPROMS [115].
2.4.2 Hybrid membrane/distillation process
A membrane process can also be used in combination with other separation techniques,
such as, distillation. The resulting hybrid membrane-distillation which exploits the
advantages of both processes while minimizing the negative aspects, has shown promising
potential. Various studies have shown that the hybrid membrane/distillation process is
energy efficient and economically beneficial for mixtures which are otherwise impossible
or difficult to separate using conventional distillation [116–119]. Such mixtures are
characterized by either formation of an azeotrope (ethanol-water), or the presence of
tangent pitch (water-acetic acid), or low relative volatilities (olefin-paraffin) [119]. The
most common hybrid configurations containing a single distillation column and a single
membrane process are shown in the Figure 2.5 [117,119].
In the top hybrid (Figure 2.5a) and bottom hybrid (Figure 2.5b) configurations,
distillation is used as a pretreatment step while the final separation is carried out by
membrane separation. Such configurations are better suited for mixtures having a tangent
pitch or forming an azeotrope. Moreover, the membrane should have a high separation
factor to achieve the purity target. In series hybrid (Figure 2.5c) and parallel hybrid
(Figure 2.5d) configurations, membrane separation is used as a pretreatment step followed
by distillation to achieve the final product specifications. They are generally used for
mixtures with low relative volatility and/or when membranes cannot provide high purity
24
separations. In a series configuration, the feed composition to the membrane unit is fixed,
while in a parallel configuration it can be varied depending upon the stage of side stream
extraction from the distillation column. However, it has been shown that the side draw
stage in a parallel configuration is usually located near the feed stage where the distillation
is least effective [148,152-155], which effectively makes it similar to the series
configuration. Sometimes, a vapor feed is preferred over a liquid feed for the membrane
separation to eliminate the heavy impurities which otherwise may clog the membrane
pores. In those cases, if the original feed is liquid then a parallel configuration with a vapor
side draw can be used. In this research, only the series configuration (Figure 2.5c) is
considered which is also expected to be easier to retrofit and control as compared to the
parallel configuration.
As the governing equations for the membrane unit and the distillation unit can be solved
sequentially in a series configuration, the membrane unit is simulated in gPROMS while
the distillation unit is simulated in Aspen Plus. The permeate stream from the membrane
is compressed to match the column pressure.. The location of the two feed streams to the
distillation column (retentate and permeate streams from the membrane unit) is optimized
for a fixed membrane stage-cut (φ) to minimize the reboiler duty, where the membrane
stage cut (φ) is defined as the ratio of n-butane flow rate in the permeate stream to that in
the feed.
25
Figure 2.5: Schematic of hybrid membrane-distillation systems consisting of a single distillation
unit and a single membrane unit. (a) top-hybrid configuration, (b) bottom-hybrid configuration,
(c) series hybrid configuration, and (d) parallel hybrid configuration.
2.5 Concluding remarks
The permeation through a zeolite membrane is a complex interplay of adsorption and
diffusion properties of permeating components. Further, the non-idealities in both the
adsorption and diffusion phenomenon, such as co-adsorption due to hydrogen bonding and
intersection blocking, respectively, can introduce more complexities. In addition to the
adsorption and diffusion based transport through zeolite layer, factors such as mass transfer
through the porous support, the use of a sweep gas, concentration polarization phenomenon
26
and presence of defects should also be included. The models used in the literature are
usually based on only ideal adsorption-diffusion through the zeolite layer. The effects of
non-idealities and external resistances are usually neglected. This results in discrepancy
between the results obtained from the model and the experiments. Here, the membrane
model is developed considering all the above mentioned transport phenomenon and further
integrated with process-scale model for both stand-alone membrane processes and hybrid
membrane-distillation processes. This first-of-its-kind modeling approach does not only
improve the understanding of zeolite membrane processes but is also significant from an
engineering perspective as it can be used as a template to rigorously design and optimize
membrane systems.
27
Chapter 3: Butane isomer separation using hybrid
membrane-distillation
3.1 Introduction
Butanes offer a great opportunity for implementation of zeolite membrane technology.
While n-butane is primarily used in liquefied petroleum gas (LPG) as a cooking and heating
fuel and in petrochemical industry as a feedstock for producing ethylene and butadiene, the
major application of i-butane is in refineries where it is used as a blending agent mixed in
gasoline. LPG accounts for the biggest share of butane application consisting 66% whereas
petrochemical and refineries accounts for 17% and 15% respectively. Their global market
is growing at an annual rate of 2.46% in terms of demand and at a CAGR of 8.9% in terms
of revenue [6]. Currently, the industrial separation of butane isomers is accomplished using
distillation, and due to the close boiling-point of the components, it is considered as one of
the most energy-intensive distillation separations.
Zeolite membrane separation has also been proposed as a possible solution for butane
isomer separation as n-butane is both the preferentially adsorbing and the preferentially
diffusing component resulting in synergetic separation [120].
3.2 Adsorption modeling
3.2.1 Single component adsorption parameters
The single component adsorption properties of butane isomers in MFI zeolites have
been widely studied [60,121–132]. Adsorption isotherms and the heats of adsorption have
been determined by various experimental, including adsorption calorimetry [121] ,
gravimetric analysis [122,123] and tapered element oscillating microbalance [124,125]
experiments, and molecular simulations using configurational-bias Monte Carlo methods
28
[60,127–129,132] and were found to be in good agreement with one another. Volumetric
adsorption experiments have also been performed on silicalite-1 pellets for n-butane [126].
The results from these techniques are in agreement to one another, and isotherms for n-
butane and i-butane at T ~ 300 K are shown in Figure 3.1a and 3.1b respectively.
Figure 3.1: Single component adsorption isotherms for (a) n-butane (b) i-butane on MFI crystals
measured and simulated using various techniques in the range T = 300 K - 308 K.
: Adsorption calorimetry 300 K Stach et al. [121],: Gravimetric 303 K Richards and Rees
[122], : Gravimetric 308 K Sun et al. [123], : TEOM 303 K Zhu et al. [124], : Volumetric
300 K Abdul-Rehman et al. [126], : Molecular simulation 300 K Vlugt et al. [60], : Dual site
Langmuir fit 300 K Zhu et al. [124]. For volumetric method [11], silicalite-1 pellets were used
and the amount of adsorbent is corrected for the binder weight assuming that no adsorption takes
place on the binder.
The adsorption has been described in terms of a volume filling process with two
different types of sites – channels and intersections, and thus the dual-site Langmuir
isotherm;
where q is the loading, qsat is the saturation loading, k’s are the Langmuir constants, P is
the pressure and ‘a’ and ‘b’ represent the two sites, has been used to model the adsorption
Pk
Pkq
Pk
Pkqq
bi,
bi,
sat
bi,
ai,
ai,
sat
ai,
i11
(3.1)
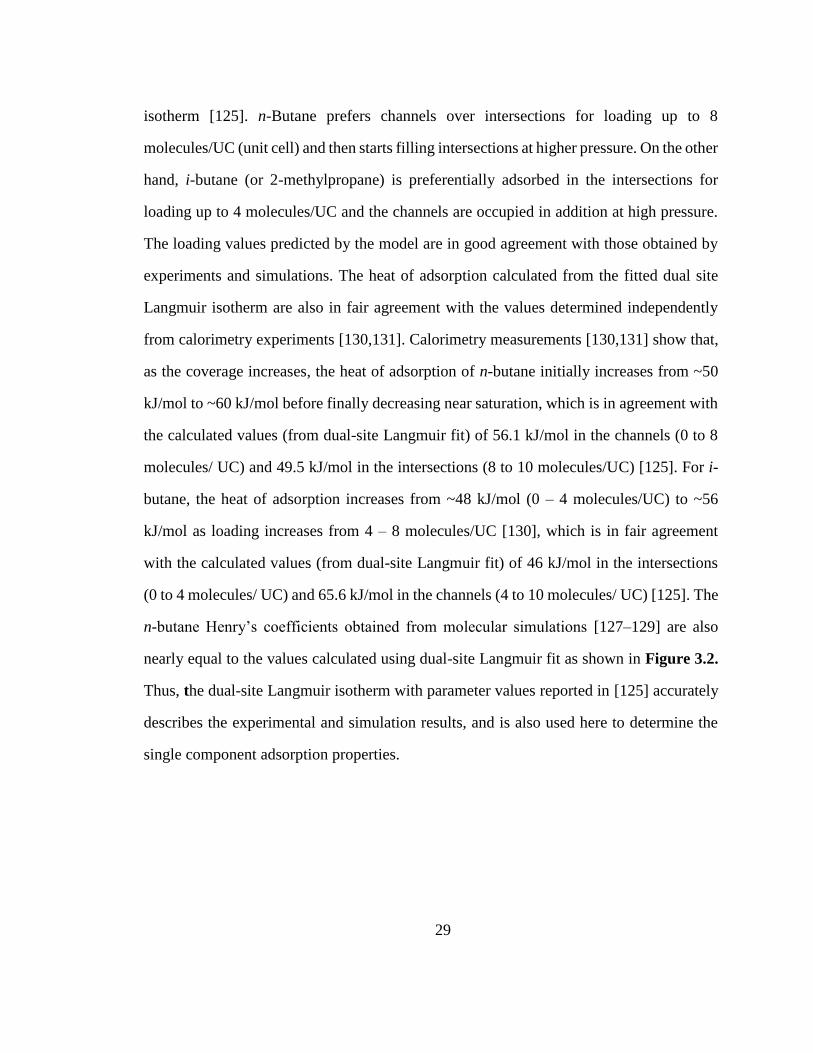
29
isotherm [125]. n-Butane prefers channels over intersections for loading up to 8
molecules/UC (unit cell) and then starts filling intersections at higher pressure. On the other
hand, i-butane (or 2-methylpropane) is preferentially adsorbed in the intersections for
loading up to 4 molecules/UC and the channels are occupied in addition at high pressure.
The loading values predicted by the model are in good agreement with those obtained by
experiments and simulations. The heat of adsorption calculated from the fitted dual site
Langmuir isotherm are also in fair agreement with the values determined independently
from calorimetry experiments [130,131]. Calorimetry measurements [130,131] show that,
as the coverage increases, the heat of adsorption of n-butane initially increases from ~50
kJ/mol to ~60 kJ/mol before finally decreasing near saturation, which is in agreement with
the calculated values (from dual-site Langmuir fit) of 56.1 kJ/mol in the channels (0 to 8
molecules/ UC) and 49.5 kJ/mol in the intersections (8 to 10 molecules/UC) [125]. For i-
butane, the heat of adsorption increases from ~48 kJ/mol (0 – 4 molecules/UC) to ~56
kJ/mol as loading increases from 4 – 8 molecules/UC [130], which is in fair agreement
with the calculated values (from dual-site Langmuir fit) of 46 kJ/mol in the intersections
(0 to 4 molecules/ UC) and 65.6 kJ/mol in the channels (4 to 10 molecules/ UC) [125]. The
n-butane Henry’s coefficients obtained from molecular simulations [127–129] are also
nearly equal to the values calculated using dual-site Langmuir fit as shown in Figure 3.2.
Thus, the dual-site Langmuir isotherm with parameter values reported in [125] accurately
describes the experimental and simulation results, and is also used here to determine the
single component adsorption properties.
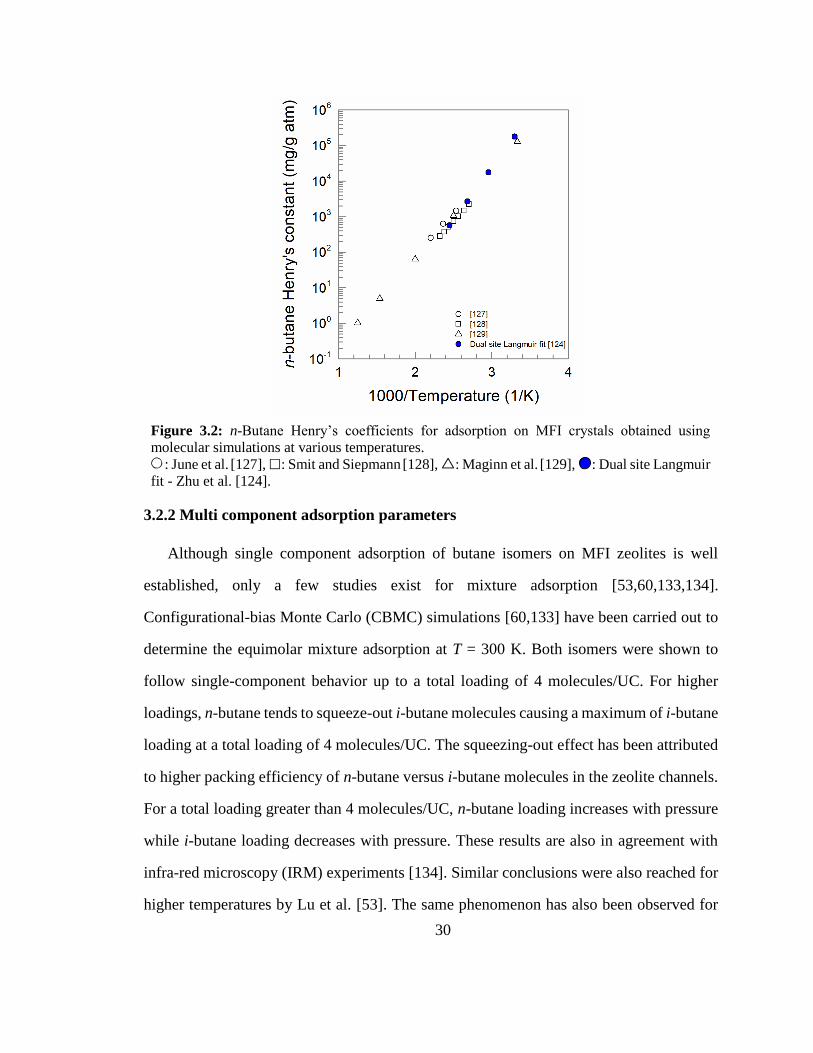
30
Figure 3.2: n-Butane Henry’s coefficients for adsorption on MFI crystals obtained using
molecular simulations at various temperatures.
: June et al. [127], : Smit and Siepmann [128], : Maginn et al. [129], : Dual site Langmuir
fit - Zhu et al. [124].
3.2.2 Multi component adsorption parameters
Although single component adsorption of butane isomers on MFI zeolites is well
established, only a few studies exist for mixture adsorption [53,60,133,134].
Configurational-bias Monte Carlo (CBMC) simulations [60,133] have been carried out to
determine the equimolar mixture adsorption at T = 300 K. Both isomers were shown to
follow single-component behavior up to a total loading of 4 molecules/UC. For higher
loadings, n-butane tends to squeeze-out i-butane molecules causing a maximum of i-butane
loading at a total loading of 4 molecules/UC. The squeezing-out effect has been attributed
to higher packing efficiency of n-butane versus i-butane molecules in the zeolite channels.
For a total loading greater than 4 molecules/UC, n-butane loading increases with pressure
while i-butane loading decreases with pressure. These results are also in agreement with
infra-red microscopy (IRM) experiments [134]. Similar conclusions were also reached for
higher temperatures by Lu et al. [53]. The same phenomenon has also been observed for
31
hexane isomers (n-hexane/2-methyl-pentane), i.e., linear isomer occupies both channels
and intersections while the branched isomer is located preferentially at intersections
[120,133]. At high pressure (total loading greater than 4 molecules/UC), the adsorption of
the linear isomer is favored by squeezing out the branched isomer. This leads to high
selectivity of the linear isomer making MFI type of zeolite an attractive choice for these
isomer separations.
The squeezing-out effect also introduces non-idealities in the mixture and leads to
failure of the Ideal Adsorption Solution Theory (IAST), which is widely used in predicting
mixture isotherms. To model the mixture adsorption isotherm, Vlugt et al. [60] suggested
two different mixture rules based on extended Langmuir multi-component isotherms. The
first mixture rule has been shown to underpredict n-butane loading and overpredict i-butane
loading, while the other mixture rule overpredicts n-butane loading and underpredicts i-
butane loading. A combination of mixture rule 1 and mixture rule 2 was thus employed to
predict the values obtained by molecular simulation at T = 300 K. The drawback of this
model is that it is not thermodynamically consistent and fails to predict the simulation
results at higher temperature. Lu et al. [53] proposed a surface area corrected IAST (SAC-
IAST) to account for the different area/sites available for n-butane (channels and
intersections) and i-butane (intersections) mixture adsorption. They introduced a vapor
mole-fraction dependent parameter to fit the deviation from IAST. The drawback of this
model is that there is no capability to account for the changes in deviations with changing
total pressure. As stated earlier, deviations are small at low pressure when both molecules
adsorb independently as compared to high pressure where the non-idealities start to play
an important role. Moreover, this model can only be used when mixture adsorption data is
available for various mole fractions. Here, a Real Adsorption Solution Theory (RAST) is
used to model the mixture isotherm. The activity coefficients based on the Wilson equation
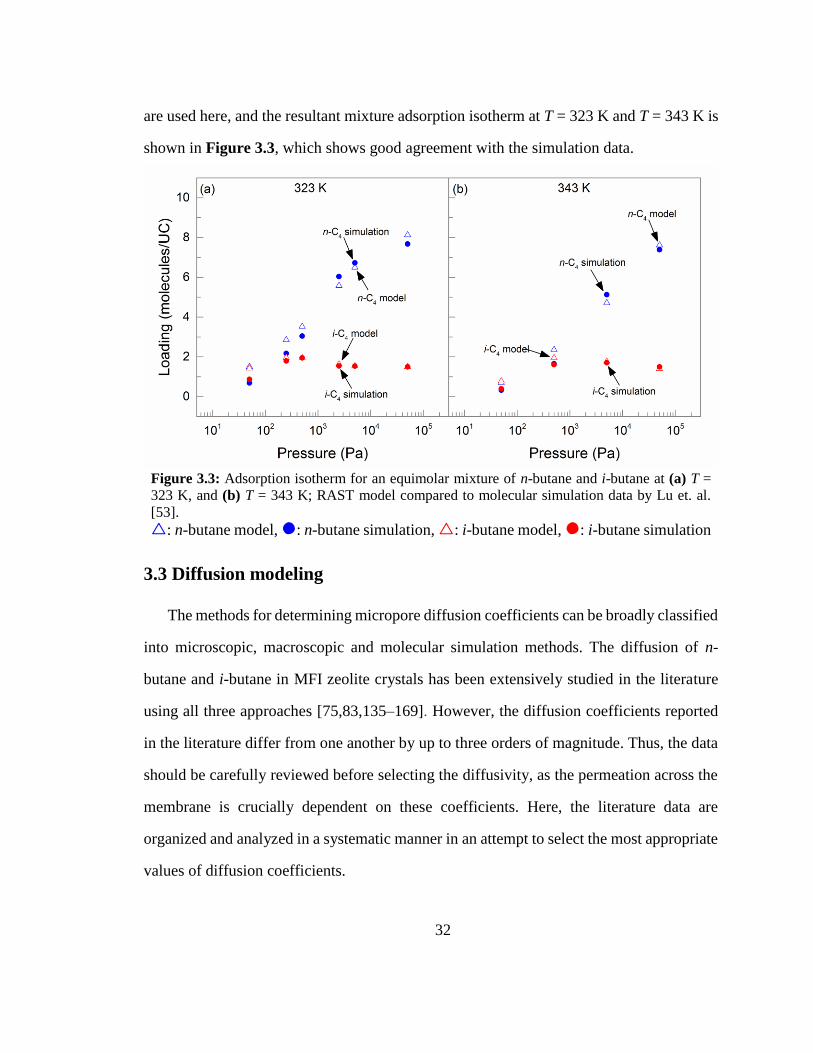
32
are used here, and the resultant mixture adsorption isotherm at T = 323 K and T = 343 K is
shown in Figure 3.3, which shows good agreement with the simulation data.
Figure 3.3: Adsorption isotherm for an equimolar mixture of n-butane and i-butane at (a) T =
323 K, and (b) T = 343 K; RAST model compared to molecular simulation data by Lu et. al.
[53].
: n-butane model, : n-butane simulation, : i-butane model, : i-butane simulation
3.3 Diffusion modeling
The methods for determining micropore diffusion coefficients can be broadly classified
into microscopic, macroscopic and molecular simulation methods. The diffusion of n-
butane and i-butane in MFI zeolite crystals has been extensively studied in the literature
using all three approaches [75,83,135–169]. However, the diffusion coefficients reported
in the literature differ from one another by up to three orders of magnitude. Thus, the data
should be carefully reviewed before selecting the diffusivity, as the permeation across the
membrane is crucially dependent on these coefficients. Here, the literature data are
organized and analyzed in a systematic manner in an attempt to select the most appropriate
values of diffusion coefficients.
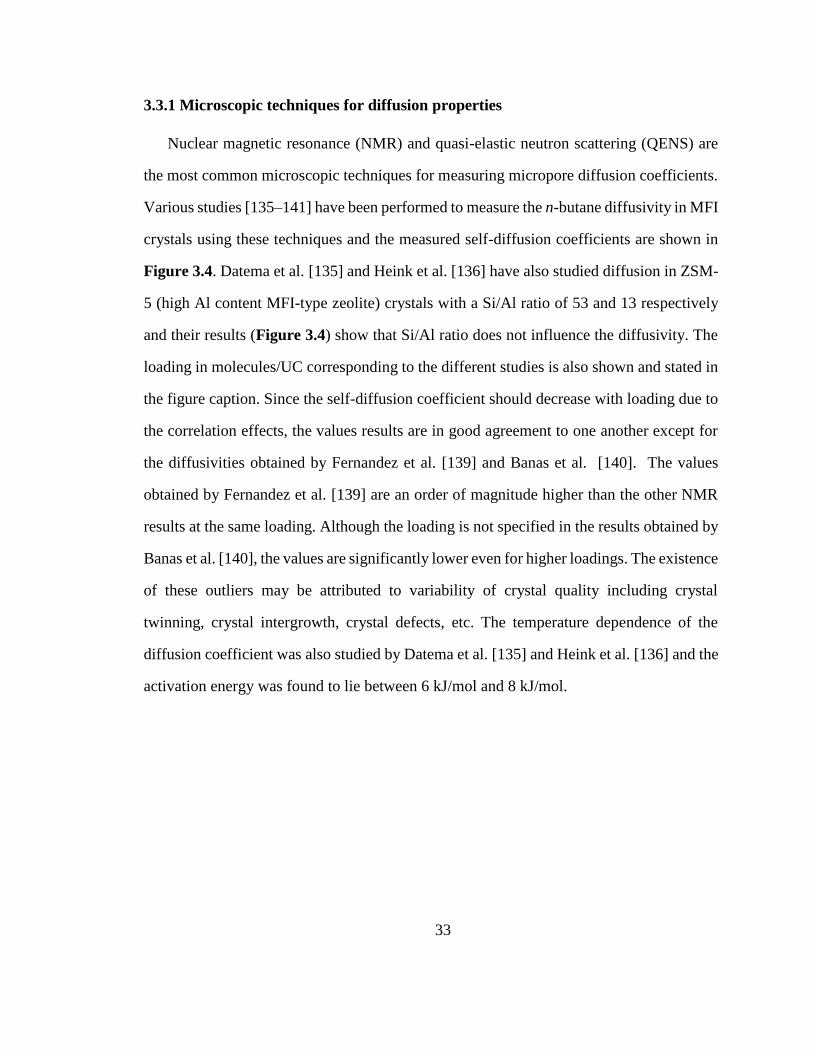
33
3.3.1 Microscopic techniques for diffusion properties
Nuclear magnetic resonance (NMR) and quasi-elastic neutron scattering (QENS) are
the most common microscopic techniques for measuring micropore diffusion coefficients.
Various studies [135–141] have been performed to measure the n-butane diffusivity in MFI
crystals using these techniques and the measured self-diffusion coefficients are shown in
Figure 3.4. Datema et al. [135] and Heink et al. [136] have also studied diffusion in ZSM-
5 (high Al content MFI-type zeolite) crystals with a Si/Al ratio of 53 and 13 respectively
and their results (Figure 3.4) show that Si/Al ratio does not influence the diffusivity. The
loading in molecules/UC corresponding to the different studies is also shown and stated in
the figure caption. Since the self-diffusion coefficient should decrease with loading due to
the correlation effects, the values results are in good agreement to one another except for
the diffusivities obtained by Fernandez et al. [139] and Banas et al. [140]. The values
obtained by Fernandez et al. [139] are an order of magnitude higher than the other NMR
results at the same loading. Although the loading is not specified in the results obtained by
Banas et al. [140], the values are significantly lower even for higher loadings. The existence
of these outliers may be attributed to variability of crystal quality including crystal
twinning, crystal intergrowth, crystal defects, etc. The temperature dependence of the
diffusion coefficient was also studied by Datema et al. [135] and Heink et al. [136] and the
activation energy was found to lie between 6 kJ/mol and 8 kJ/mol.
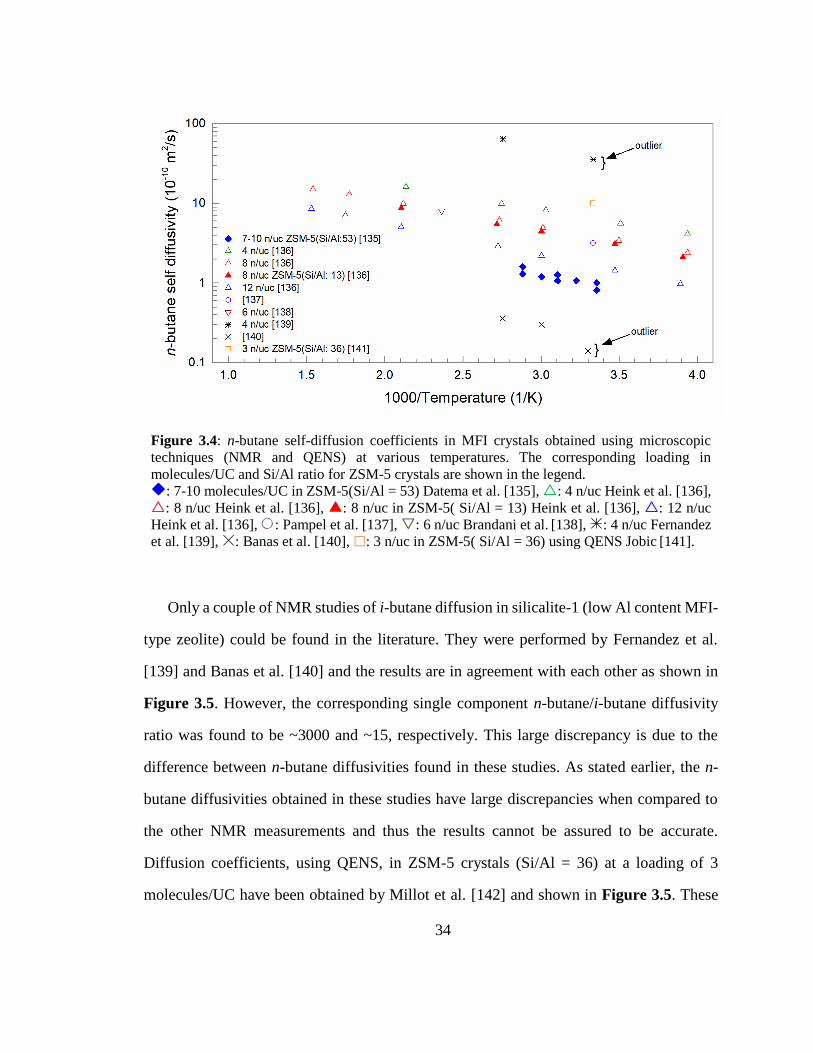
34
Only a couple of NMR studies of i-butane diffusion in silicalite-1 (low Al content MFI-
type zeolite) could be found in the literature. They were performed by Fernandez et al.
[139] and Banas et al. [140] and the results are in agreement with each other as shown in
Figure 3.5. However, the corresponding single component n-butane/i-butane diffusivity
ratio was found to be ~3000 and ~15, respectively. This large discrepancy is due to the
difference between n-butane diffusivities found in these studies. As stated earlier, the n-
butane diffusivities obtained in these studies have large discrepancies when compared to
the other NMR measurements and thus the results cannot be assured to be accurate.
Diffusion coefficients, using QENS, in ZSM-5 crystals (Si/Al = 36) at a loading of 3
molecules/UC have been obtained by Millot et al. [142] and shown in Figure 3.5. These
Figure 3.4: n-butane self-diffusion coefficients in MFI crystals obtained using microscopic
techniques (NMR and QENS) at various temperatures. The corresponding loading in
molecules/UC and Si/Al ratio for ZSM-5 crystals are shown in the legend.
: 7-10 molecules/UC in ZSM-5(Si/Al = 53) Datema et al. [135], : 4 n/uc Heink et al. [136],
: 8 n/uc Heink et al. [136], : 8 n/uc in ZSM-5( Si/Al = 13) Heink et al. [136], : 12 n/uc
Heink et al. [136], : Pampel et al. [137], : 6 n/uc Brandani et al. [138], : 4 n/uc Fernandez
et al. [139], : Banas et al. [140], : 3 n/uc in ZSM-5( Si/Al = 36) using QENS Jobic [141].
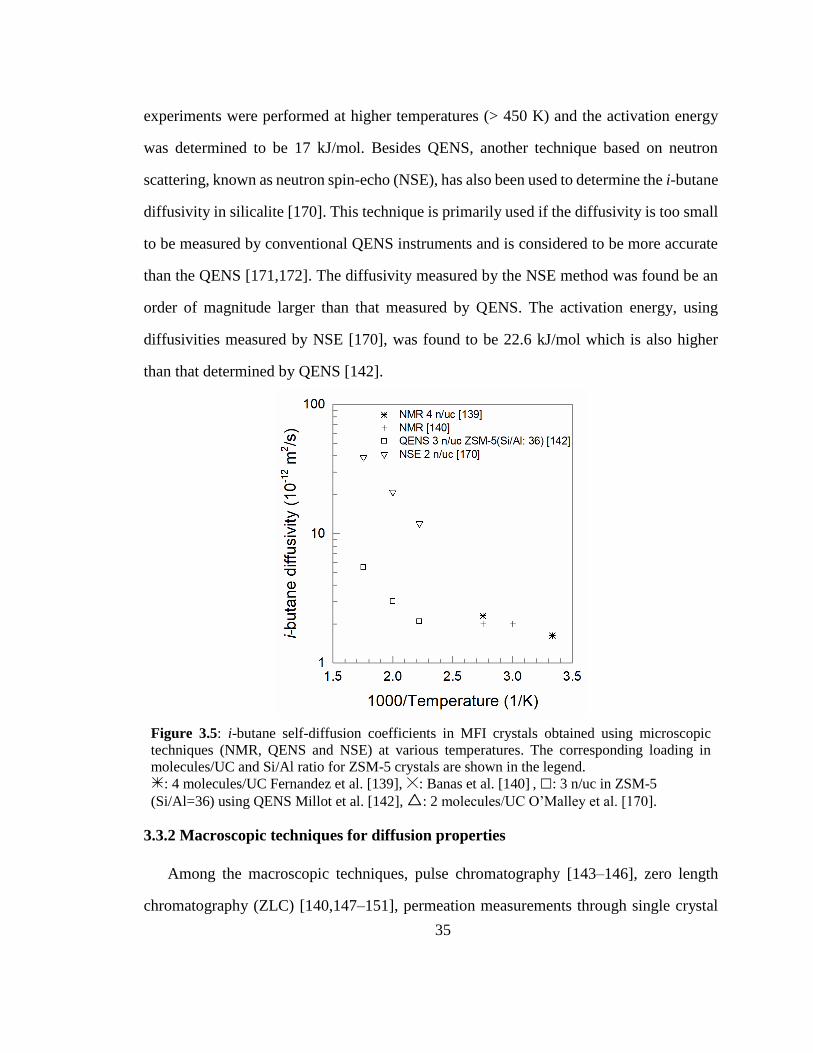
35
experiments were performed at higher temperatures (> 450 K) and the activation energy
was determined to be 17 kJ/mol. Besides QENS, another technique based on neutron
scattering, known as neutron spin-echo (NSE), has also been used to determine the i-butane
diffusivity in silicalite [170]. This technique is primarily used if the diffusivity is too small
to be measured by conventional QENS instruments and is considered to be more accurate
than the QENS [171,172]. The diffusivity measured by the NSE method was found be an
order of magnitude larger than that measured by QENS. The activation energy, using
diffusivities measured by NSE [170], was found to be 22.6 kJ/mol which is also higher
than that determined by QENS [142].
Figure 3.5: i-butane self-diffusion coefficients in MFI crystals obtained using microscopic
techniques (NMR, QENS and NSE) at various temperatures. The corresponding loading in
molecules/UC and Si/Al ratio for ZSM-5 crystals are shown in the legend.
: 4 molecules/UC Fernandez et al. [139], : Banas et al. [140] , : 3 n/uc in ZSM-5
(Si/Al=36) using QENS Millot et al. [142], : 2 molecules/UC O’Malley et al. [170].
3.3.2 Macroscopic techniques for diffusion properties
Among the macroscopic techniques, pulse chromatography [143–146], zero length
chromatography (ZLC) [140,147–151], permeation measurements through single crystal
36
membrane (SCM) [152–155], interference microscopy [156–159] and frequency response
(FR) [160,168] methods have been widely studied for calculating butane diffusivity in MFI
crystals. The macroscopic techniques usually determine the corrected diffusivity or Fick’s
diffusivity while microscopic techniques provide the self-diffusivity. However, the values
from different techniques can be compared at zero loading as all three kinds of diffusivities
(self, corrected and Fick’s) are equal at zero loading. Moreover, Fick’s (D) and corrected
diffusivities (Đ) are related as (Đ = D/Γ), where the thermodynamic factor (Γ = d ln p / d
ln θ) can be determined from the adsorption isotherm.
Figure 3.6: n-butane corrected diffusivity in MFI crystals obtained at infinite dilution using
macroscopic techniques (CPC and ZLC) for various temperatures. Values obtained using NMR
and molecular simulations are also shown for comparison.
: MD simulation Runnebaum and Maginn [164], : NMR Heink et al. [136], : CPC 26 µm
crystal Hufton and Danner [144], : ZLC 70 µm Hufton and Ruthven [147], : ZLC 27 µm
Hufton and Ruthven [147], : ZLC 22 µm Jiang and Eic [149], : ZLC 7 µm in ZSM-5 Jiang
and Eic [149].
Hufton and Danner [144] carried out concentration pulse chromatography (CPC)
experiments at infinite dilution using silicalite-1 crystals. The n-butane diffusion
coefficients (Figure 3.6) were found to be at least an order of magnitude lower as compared
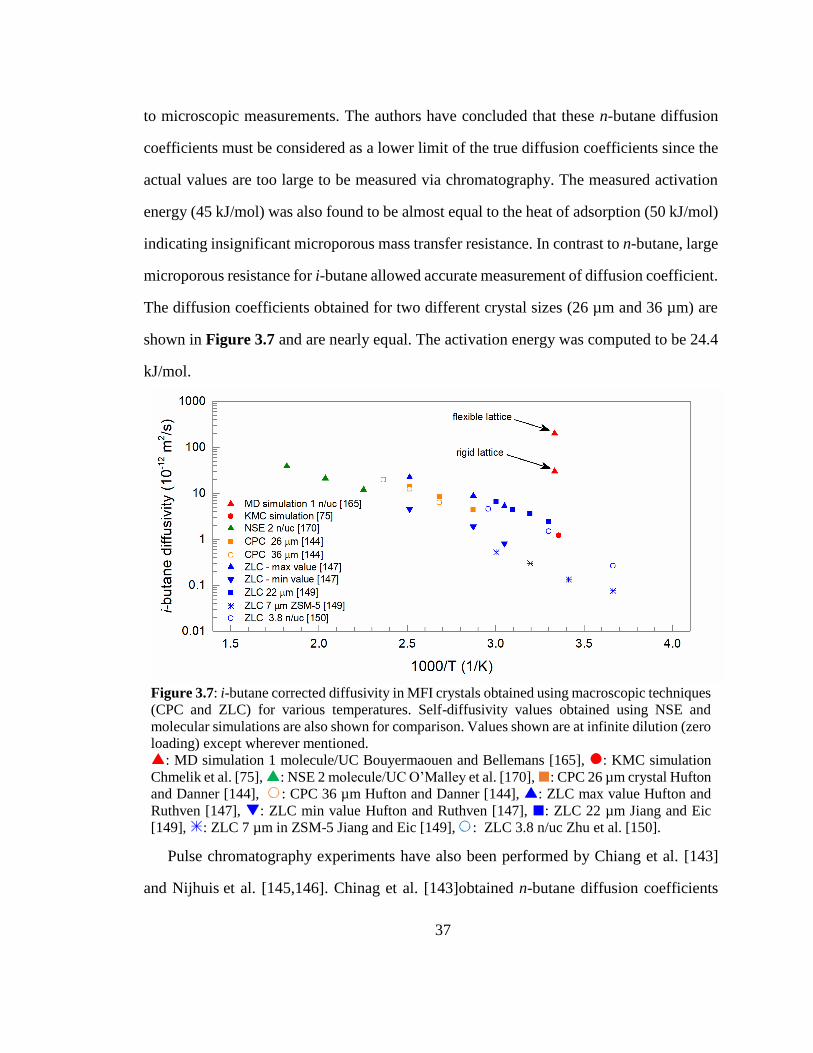
37
to microscopic measurements. The authors have concluded that these n-butane diffusion
coefficients must be considered as a lower limit of the true diffusion coefficients since the
actual values are too large to be measured via chromatography. The measured activation
energy (45 kJ/mol) was also found to be almost equal to the heat of adsorption (50 kJ/mol)
indicating insignificant microporous mass transfer resistance. In contrast to n-butane, large
microporous resistance for i-butane allowed accurate measurement of diffusion coefficient.
The diffusion coefficients obtained for two different crystal sizes (26 µm and 36 µm) are
shown in Figure 3.7 and are nearly equal. The activation energy was computed to be 24.4
kJ/mol.
Figure 3.7: i-butane corrected diffusivity in MFI crystals obtained using macroscopic techniques
(CPC and ZLC) for various temperatures. Self-diffusivity values obtained using NSE and
molecular simulations are also shown for comparison. Values shown are at infinite dilution (zero
loading) except wherever mentioned.
: MD simulation 1 molecule/UC Bouyermaouen and Bellemans [165], : KMC simulation
Chmelik et al. [75], : NSE 2 molecule/UC O’Malley et al. [170], : CPC 26 µm crystal Hufton
and Danner [144], : CPC 36 µm Hufton and Danner [144], : ZLC max value Hufton and
Ruthven [147], : ZLC min value Hufton and Ruthven [147], : ZLC 22 µm Jiang and Eic
[149], : ZLC 7 µm in ZSM-5 Jiang and Eic [149], : ZLC 3.8 n/uc Zhu et al. [150].
Pulse chromatography experiments have also been performed by Chiang et al. [143]
and Nijhuis et al. [145,146]. Chinag et al. [143]obtained n-butane diffusion coefficients
38
which are 3 orders of magnitude lower than other chromatography or macroscopic
techniques. Moreover, n-butane and i-butane diffusion coefficients were found to be
similar. This discrepancy is attributed to the small silicalite-1 crystals (R ~ 1 µm) used in
their study which provide negligible microporous resistance and thus transport in these
crystals is dominated by external resistances. Nijhuis et al. [145,146] applied a transient
pulse-response technique to determine the diffusion coefficient at high temperatures. They
obtained the pre-exponential factor of diffusivity and the activation energy by fitting the
experimental data. Though these diffusion parameters are in good agreement with values
obtained from microscopic techniques, their fitted value of diffusion coefficient is an order
of magnitude higher than their experimental value (10-10 m2/s) at 400 K. The experimental
activation energy is also much higher than the fitted value of 7.3 kJ/mol in the range of 400
K – 450 K. For i-butane, only the fitted results have been reported and the diffusion
coefficients and activation energy (28.9 kJ/mol) are in agreement to the results obtained by
Hufton and Danner [144].
Hufton and Ruthven [147] have studied diffusion in silicalite-1 crystals using ZLC
technique. To this end, a dimensionless parameter ‘L’ is used to determine whether the
process is equilibrium controlled (L > 10) or diffusion controlled (L < 1). For n-butane, the
L values calculated were found to lie between 1 and 4 which are smaller than those required
for diffusion-controlled process. Furthermore, the activation energy (41.6 kJ/mol) was
found to be similar to the heat of adsorption (50 kJ/mol). The diffusion coefficients
measured using different sized crystals (shown in Figure 3.6) shows that the diffusivity
increases with crystal size indicating that the external resistance also plays a substantial
role. The authors have concluded that the permeation of n-butane is too fast to be measured
using the ZLC method, and the calculated diffusion coefficient must be taken as a lower
limit of the true diffusion coefficient. For i-butane, diffusivities in silicalite-1 crystals
39
yielded L > 50 indicating significant micropore resistance. The diffusivities were obtained
for different crystal sizes using short-time and long-time methods. Since the individual data
points lie close to each other and are not clearly distinguishable in the original figure, only
the highest and lowest values of diffusivities are shown in Figure 3.7; the average values
are in agreement to the values obtained using CPC experiments. The activation energy of
23.1 kcal/mol is also similar.
Jiang and Eic and co-workers [148,149] have studied butane isomer permeation in both
silicalite-1 crystal and ZSM-5 crystals using ZLC techniques. For both isomers,
diffusivities in silicalite-1 crystals were found to be higher than ZSM-5 crystals (Figure
3.6 for n-butane and Figure 3.7 for i-butane) and contradicts the NMR results for n-butane
where the Si/Al ratio does not influence the diffusivity. However, L values for n-butane in
these ZLC experiments [149] were found to be < 5 which indicates that the transport may
be equilibrium controlled rather than diffusion controlled. Another possible reason for the
discrepancy in diffusivity might be the difference in the crystal size (R = 22 µm silicalite-
1 crystals and R = 7 µm for ZSM-5 crystals) as Hufton and Danner [144] also found this
discrepancy in CPC measurements where the transport was governed by the external
resistance. For i-butane, L ~ 10 for silicalite-1 crystals (R = 22 µm) and ~ 5 for ZSM-5
crystals (R = 7 µm). The diffusivities obtained with silicalite-1 crystals are nearly equal to
those obtained using CPC, while values for ZSM-5 are 5 to 10-fold lower. Thus the
discrepancy for ZSM-5 crystals can be attributed to their small size which have low
microporous resistance and results in inaccurate measurement of the diffusion coefficient.
Moreover, Zhu et al. [150] have also mentioned that the sorbate concentration in these
ZSM-5 crystals, which was maintained at 0.025 vol%, corresponds to a loading of 0.26
molecules/UC and 2.95 molecules/UC at 333 K and 273 K, respectively. At these
conditions, the adsorption isotherm lies outside the Henry’s regime and contradicts the
40
assumption used in the ZLC technique. Furthermore, the diffusivity also decreases at finite
loading, which should also be taken into account as all the other values have been reported
at infinite dilution.
Zhu et al. [150], investigated the diffusivities of i-butane at finite loading in silicalite-
1 using the ZLC technique. They modified the ZLC modeling approach to include the effect
of non-linear adsorption equilibrium to calculate the average corrected diffusivities over
the finite loading in the sample. The results for 3.84 molecules/UC are shown in Figure
3.7. The values are in agreement to the other values but it must be noted that they are
average values over a finite loading while the other results are shown for infinitely diluted
loading.
Diffusion coefficients of n-butane in silicalite-1 have also been measured using
permeation across a single crystal membrane. Hayhusrt et al. [152] and Shah et al. [153]
used the time-lag technique to determine the average Fick’s diffusivity. Sun et al. [155]
used the transient mass response method to determine the average corrected diffusivity,
while Talu et al. [154] used steady-state permeation measurements to determine the
average corrected diffusivity in z-direction. Among other macroscopic experiments, Shen
and Rees [160] and Shen et al. [168] used frequency response methods and Moller et al.
[161] used sorption uptake curves to determine the n-butane diffusivity in MFI crystals.
The values obtained in the above mentioned experiments are comparable to the values
obtained by other macroscopic techniques (CPC and ZLC) but are at least an order of
magnitude smaller than the values obtained by microscopic techniques, again indicating
the inadequacy of macroscopic methods to determine n-butane diffusivity in MFI.
Other macroscopic techniques that have been employed to measure i-butane diffusivity
in MFI crystals include permeation through single crystal membrane [153] and application
of interference microscopy along with sorption/desorption concentration profile
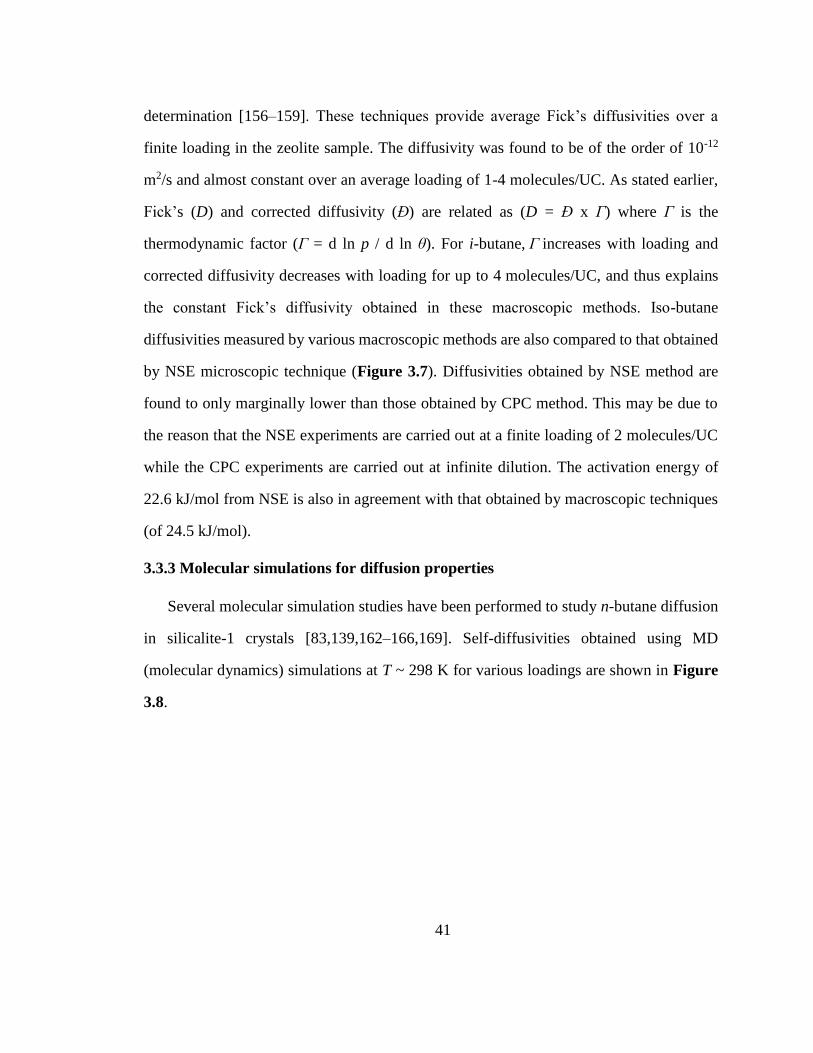
41
determination [156–159]. These techniques provide average Fick’s diffusivities over a
finite loading in the zeolite sample. The diffusivity was found to be of the order of 10-12
m2/s and almost constant over an average loading of 1-4 molecules/UC. As stated earlier,
Fick’s (D) and corrected diffusivity (Đ) are related as (D = Đ x Γ) where Γ is the
thermodynamic factor (Γ = d ln p / d ln θ). For i-butane, Γ increases with loading and
corrected diffusivity decreases with loading for up to 4 molecules/UC, and thus explains
the constant Fick’s diffusivity obtained in these macroscopic methods. Iso-butane
diffusivities measured by various macroscopic methods are also compared to that obtained
by NSE microscopic technique (Figure 3.7). Diffusivities obtained by NSE method are
found to only marginally lower than those obtained by CPC method. This may be due to
the reason that the NSE experiments are carried out at a finite loading of 2 molecules/UC
while the CPC experiments are carried out at infinite dilution. The activation energy of
22.6 kJ/mol from NSE is also in agreement with that obtained by macroscopic techniques
(of 24.5 kJ/mol).
3.3.3 Molecular simulations for diffusion properties
Several molecular simulation studies have been performed to study n-butane diffusion
in silicalite-1 crystals [83,139,162–166,169]. Self-diffusivities obtained using MD
(molecular dynamics) simulations at T ~ 298 K for various loadings are shown in Figure
3.8.
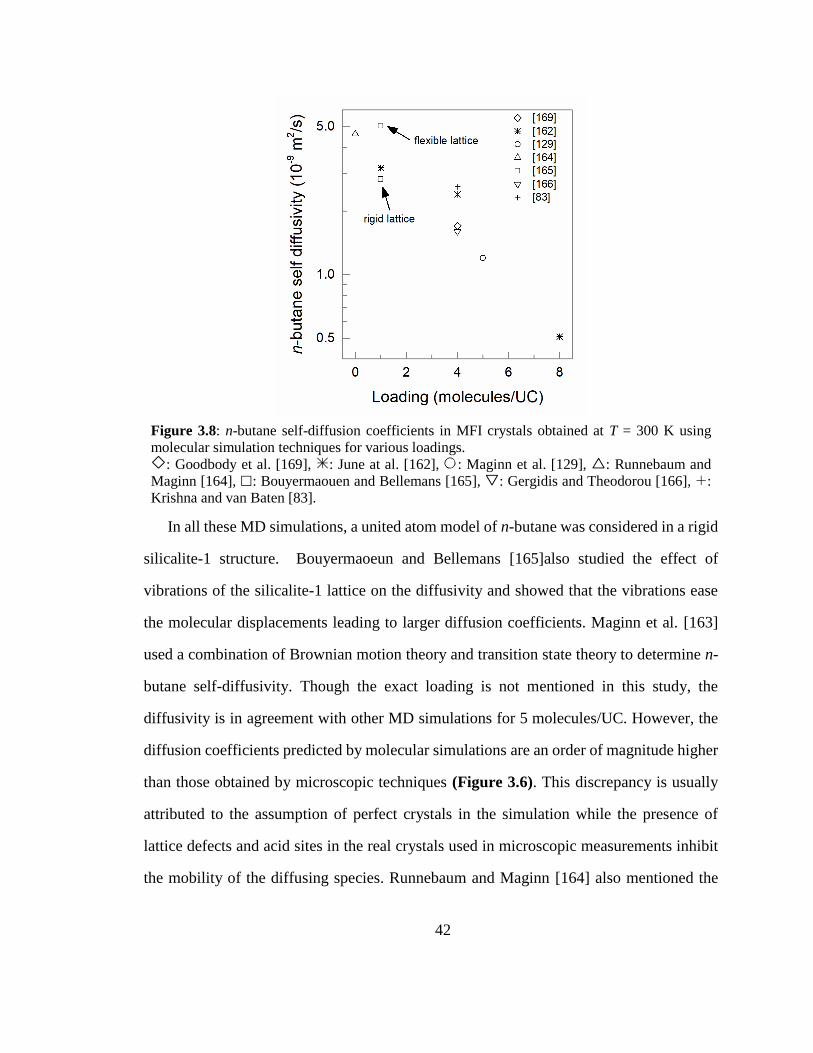
42
Figure 3.8: n-butane self-diffusion coefficients in MFI crystals obtained at T = 300 K using
molecular simulation techniques for various loadings.
: Goodbody et al. [169], : June at al. [162], : Maginn et al. [129], : Runnebaum and
Maginn [164], : Bouyermaouen and Bellemans [165], : Gergidis and Theodorou [166], :
Krishna and van Baten [83].
In all these MD simulations, a united atom model of n-butane was considered in a rigid
silicalite-1 structure. Bouyermaoeun and Bellemans [165]also studied the effect of
vibrations of the silicalite-1 lattice on the diffusivity and showed that the vibrations ease
the molecular displacements leading to larger diffusion coefficients. Maginn et al. [163]
used a combination of Brownian motion theory and transition state theory to determine n-
butane self-diffusivity. Though the exact loading is not mentioned in this study, the
diffusivity is in agreement with other MD simulations for 5 molecules/UC. However, the
diffusion coefficients predicted by molecular simulations are an order of magnitude higher
than those obtained by microscopic techniques (Figure 3.6). This discrepancy is usually
attributed to the assumption of perfect crystals in the simulation while the presence of
lattice defects and acid sites in the real crystals used in microscopic measurements inhibit
the mobility of the diffusing species. Runnebaum and Maginn [164] also mentioned the
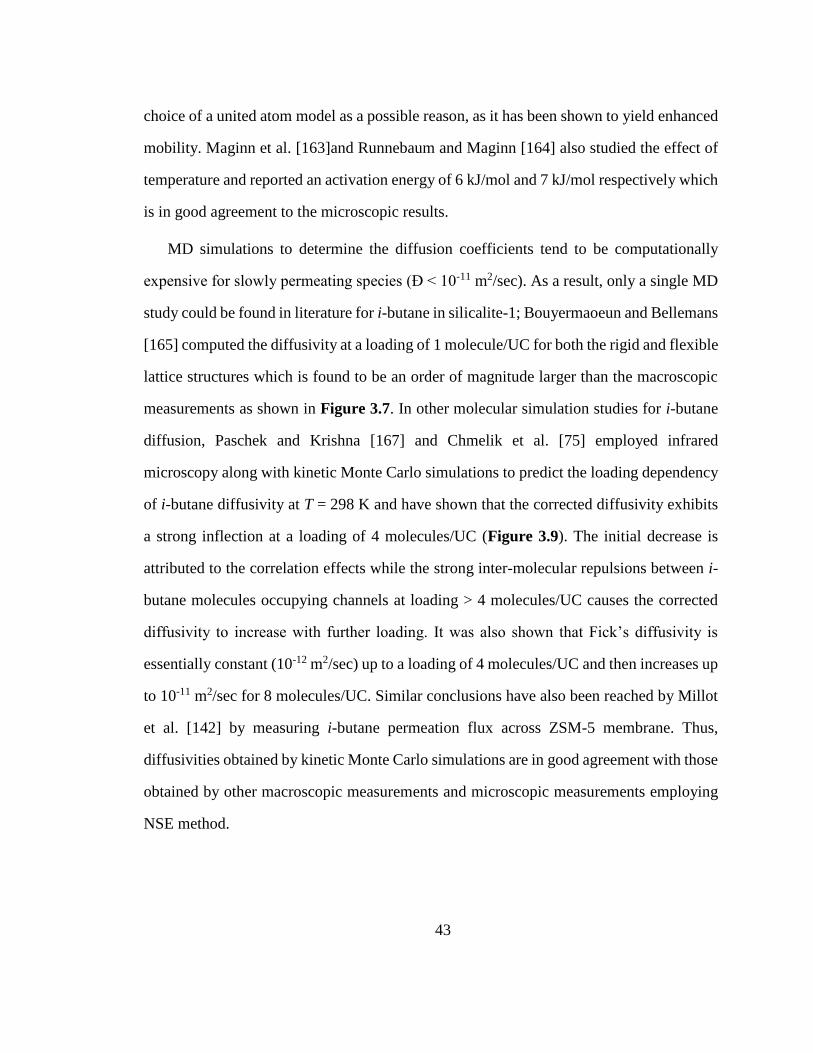
43
choice of a united atom model as a possible reason, as it has been shown to yield enhanced
mobility. Maginn et al. [163]and Runnebaum and Maginn [164] also studied the effect of
temperature and reported an activation energy of 6 kJ/mol and 7 kJ/mol respectively which
is in good agreement to the microscopic results.
MD simulations to determine the diffusion coefficients tend to be computationally
expensive for slowly permeating species (Đ < 10-11 m2/sec). As a result, only a single MD
study could be found in literature for i-butane in silicalite-1; Bouyermaoeun and Bellemans
[165] computed the diffusivity at a loading of 1 molecule/UC for both the rigid and flexible
lattice structures which is found to be an order of magnitude larger than the macroscopic
measurements as shown in Figure 3.7. In other molecular simulation studies for i-butane
diffusion, Paschek and Krishna [167] and Chmelik et al. [75] employed infrared
microscopy along with kinetic Monte Carlo simulations to predict the loading dependency
of i-butane diffusivity at T = 298 K and have shown that the corrected diffusivity exhibits
a strong inflection at a loading of 4 molecules/UC (Figure 3.9). The initial decrease is
attributed to the correlation effects while the strong inter-molecular repulsions between i-
butane molecules occupying channels at loading > 4 molecules/UC causes the corrected
diffusivity to increase with further loading. It was also shown that Fick’s diffusivity is
essentially constant (10-12 m2/sec) up to a loading of 4 molecules/UC and then increases up
to 10-11 m2/sec for 8 molecules/UC. Similar conclusions have also been reached by Millot
et al. [142] by measuring i-butane permeation flux across ZSM-5 membrane. Thus,
diffusivities obtained by kinetic Monte Carlo simulations are in good agreement with those
obtained by other macroscopic measurements and microscopic measurements employing
NSE method.
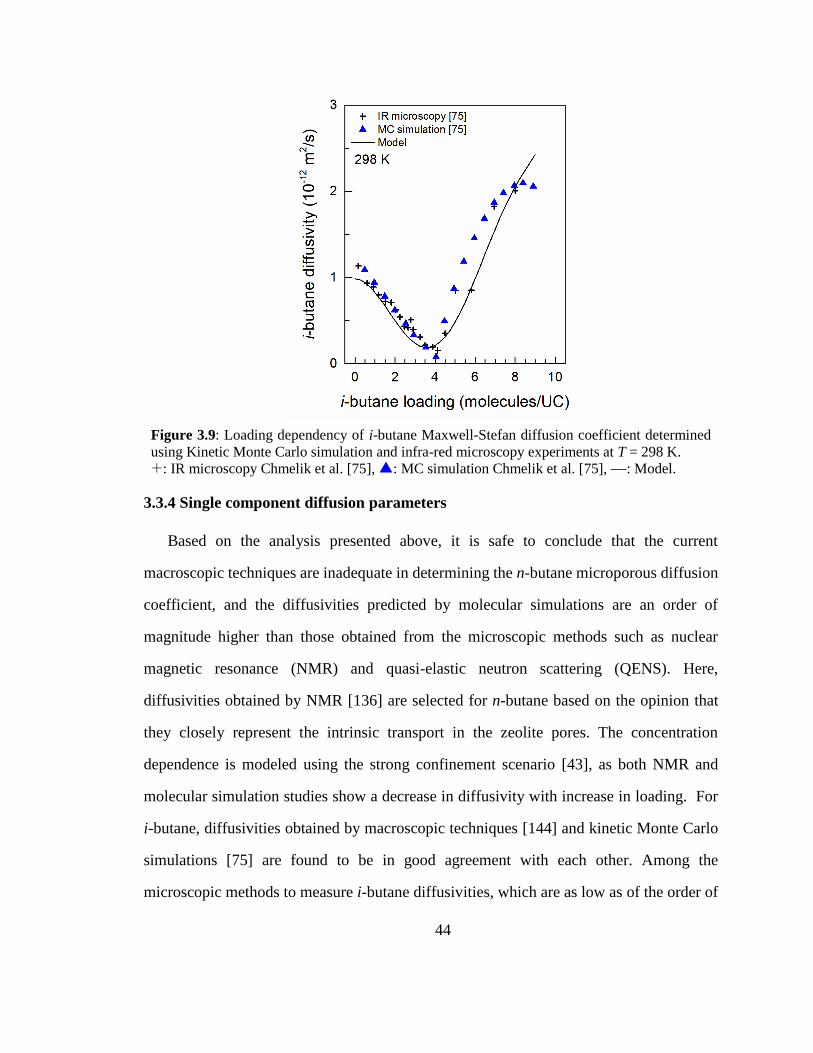
44
Figure 3.9: Loading dependency of i-butane Maxwell-Stefan diffusion coefficient determined
using Kinetic Monte Carlo simulation and infra-red microscopy experiments at T = 298 K.
: IR microscopy Chmelik et al. [75], : MC simulation Chmelik et al. [75], : Model.
3.3.4 Single component diffusion parameters
Based on the analysis presented above, it is safe to conclude that the current
macroscopic techniques are inadequate in determining the n-butane microporous diffusion
coefficient, and the diffusivities predicted by molecular simulations are an order of
magnitude higher than those obtained from the microscopic methods such as nuclear
magnetic resonance (NMR) and quasi-elastic neutron scattering (QENS). Here,
diffusivities obtained by NMR [136] are selected for n-butane based on the opinion that
they closely represent the intrinsic transport in the zeolite pores. The concentration
dependence is modeled using the strong confinement scenario [43], as both NMR and
molecular simulation studies show a decrease in diffusivity with increase in loading. For
i-butane, diffusivities obtained by macroscopic techniques [144] and kinetic Monte Carlo
simulations [75] are found to be in good agreement with each other. Among the
microscopic methods to measure i-butane diffusivities, which are as low as of the order of
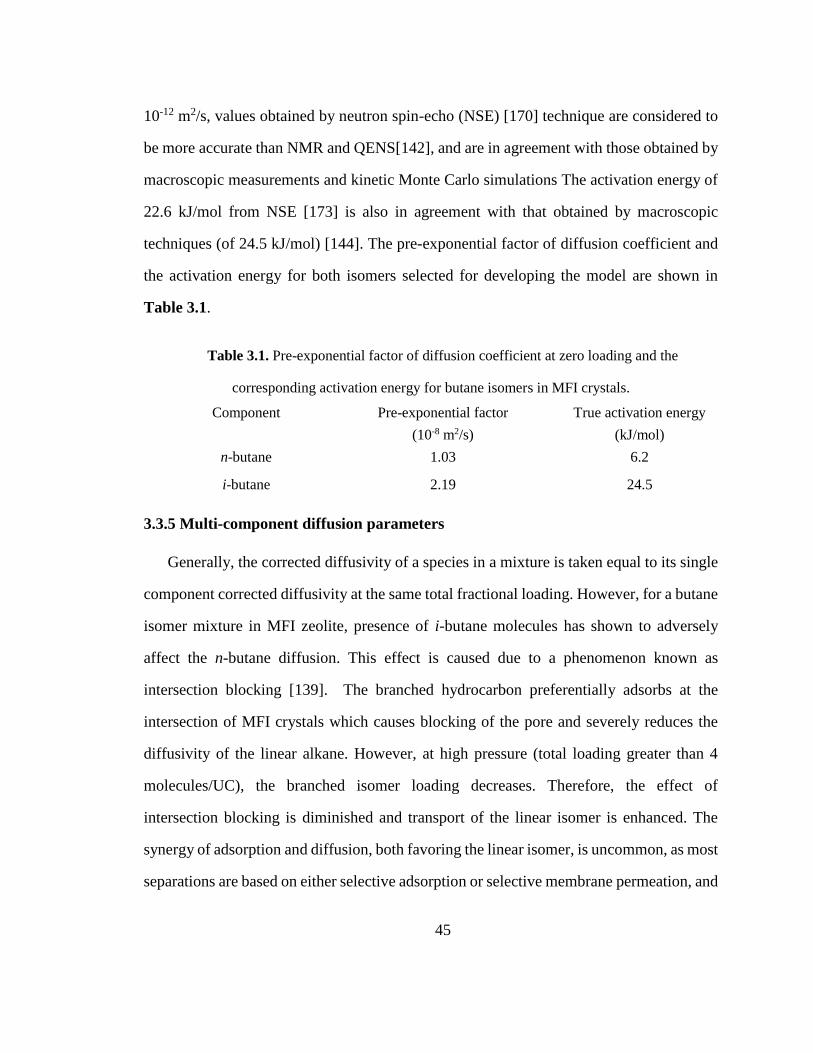
45
10-12 m2/s, values obtained by neutron spin-echo (NSE) [170] technique are considered to
be more accurate than NMR and QENS[142], and are in agreement with those obtained by
macroscopic measurements and kinetic Monte Carlo simulations The activation energy of
22.6 kJ/mol from NSE [173] is also in agreement with that obtained by macroscopic
techniques (of 24.5 kJ/mol) [144]. The pre-exponential factor of diffusion coefficient and
the activation energy for both isomers selected for developing the model are shown in
Table 3.1.
Table 3.1. Pre-exponential factor of diffusion coefficient at zero loading and the
corresponding activation energy for butane isomers in MFI crystals.
Component Pre-exponential factor
(10-8 m2/s)
True activation energy
(kJ/mol)
n-butane 1.03 6.2
i-butane 2.19 24.5
3.3.5 Multi-component diffusion parameters
Generally, the corrected diffusivity of a species in a mixture is taken equal to its single
component corrected diffusivity at the same total fractional loading. However, for a butane
isomer mixture in MFI zeolite, presence of i-butane molecules has shown to adversely
affect the n-butane diffusion. This effect is caused due to a phenomenon known as
intersection blocking [139]. The branched hydrocarbon preferentially adsorbs at the
intersection of MFI crystals which causes blocking of the pore and severely reduces the
diffusivity of the linear alkane. However, at high pressure (total loading greater than 4
molecules/UC), the branched isomer loading decreases. Therefore, the effect of
intersection blocking is diminished and transport of the linear isomer is enhanced. The
synergy of adsorption and diffusion, both favoring the linear isomer, is uncommon, as most
separations are based on either selective adsorption or selective membrane permeation, and
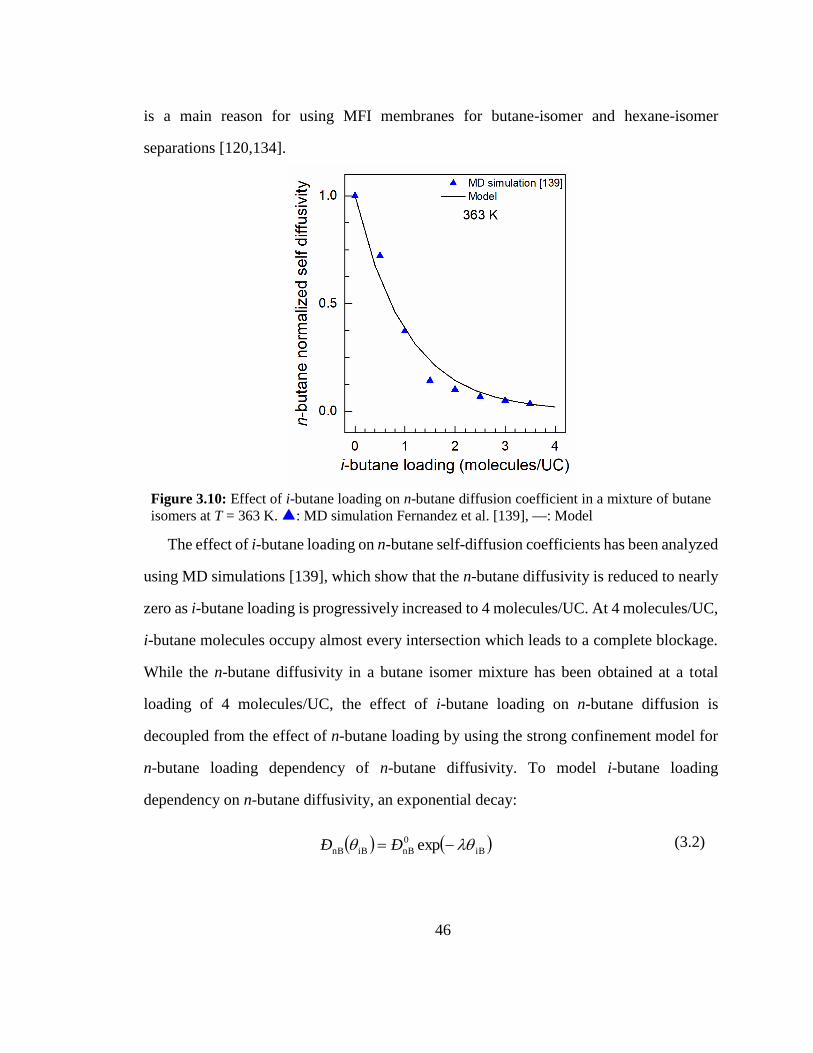
46
is a main reason for using MFI membranes for butane-isomer and hexane-isomer
separations [120,134].
Figure 3.10: Effect of i-butane loading on n-butane diffusion coefficient in a mixture of butane
isomers at T = 363 K. : MD simulation Fernandez et al. [139], : Model
The effect of i-butane loading on n-butane self-diffusion coefficients has been analyzed
using MD simulations [139], which show that the n-butane diffusivity is reduced to nearly
zero as i-butane loading is progressively increased to 4 molecules/UC. At 4 molecules/UC,
i-butane molecules occupy almost every intersection which leads to a complete blockage.
While the n-butane diffusivity in a butane isomer mixture has been obtained at a total
loading of 4 molecules/UC, the effect of i-butane loading on n-butane diffusion is
decoupled from the effect of n-butane loading by using the strong confinement model for
n-butane loading dependency of n-butane diffusivity. To model i-butane loading
dependency on n-butane diffusivity, an exponential decay:
iB
0
nBiBnB exp ÐÐ (3.2)
47
where ĐonB is the single component n-butane diffusivity and θiB is the i-butane fractional
loading, is used to model the simulation data and is shown in Figure 3.10.
The exchange coefficients (Đij) are modeled using the Vignes correlation [55]. The
improved correlation in [36] also reduces to the Vignes correlation for butane isomer
mixture as the saturation loadings of both isomers are the same.
3.3.6 Discrepancy between diffusion properties in crystals and membranes
In addition to the microscopic, macroscopic and molecular simulation methods
employed to obtain the diffusivities in MFI crystals, single component n-butane corrected
diffusivity has also been determined from permeation measurements through MFI
membranes made up of intergrown crystals.
Kapteijn, Mouleijn and co-workers [174–177] have carried out steady state n-butane
permeation experiments through a 40 µm thick membrane on a stainless steel support. To
obtain the diffusivity from these measurements, adsorption was modeled using a single-
site Langmuir isotherm and the effects of the support were incorporated using support
porosity. Kapteijn et al. [174] found that the corrected diffusivity was an order of
magnitude smaller than the values obtained by NMR measurements. The reported
activation energy of 30 kJ/mol is also considerably higher than the 8 kJ/mol obtained from
NMR measurements. Bakker et al. [175] later used the detailed molecular diffusion theory
to model permeation through the support layer but the diffusivity values were still found
to be lower. Van de Graaf et al. [176] also found similar results and concluded that the
permeation through a membrane is fundamentally different than diffusion in a crystal. The
higher activation energy, as compared to the values obtained using microscopic techniques,
was attributed to higher energy barrier due to the randomly intergrown crystals. The
reported activation energy values may also be larger because these values are determined
at different finite loadings while the activation energy from NMR measurements was
48
calculated at zero loading. After incorporating the loading dependency of diffusivity, the
activation energy (at zero loading) from permeation experiments is calculated to be 9
kJ/mol, which is nearly equal to that obtained in MFI zeolite crystals using NMR
measurements. Bakker et al. [177], by carrying out the permeation experiments with i-
octane, also stated that these membranes contained non-zeolitic pores, which are larger
than the zeolite pores and result in larger flux and thus overestimation of the diffusivity.
Moreover, SEM images of the membranes [176] show that the crystals are loosely
intergrown and thus the effective thickness of the membrane should be even less than the
visual thickness of ~40 µm. For a given flux, a higher than actual thickness also results in
overestimation of the diffusivity. This implies that the actual diffusivity through the
membranes could be even lower than the values obtained from the steady state permeation
experiments and therefore, their differences from the values obtained by NMR could be
even more pronounced.
Burgraaf and co-workers [178–180] have studied n-butane permeation through 3 µm
thick membranes supported on 2 mm thick alumina support. The permeation data were
analyzed using single-site Langmuir isotherm, and support porosity to account for support
effects. The diffusivity values were found to be two orders of magnitude lower than those
obtained by NMR measurements.
Noble, Falconer and co-workers [44,181,182] have developed a method to obtain
adsorption and diffusion properties by measuring permeation through the membranes.
Transient permeation measurements were used to calculate adsorption parameters and
membrane thickness. These parameters were further used to determine the diffusion
parameters using steady state permeation measurements. A single-site Langmuir isotherm
was used for the adsorption and the support was modeled using molecular diffusion. The
membrane thickness was stated to be 220 µm and the n-butane diffusion coefficients were
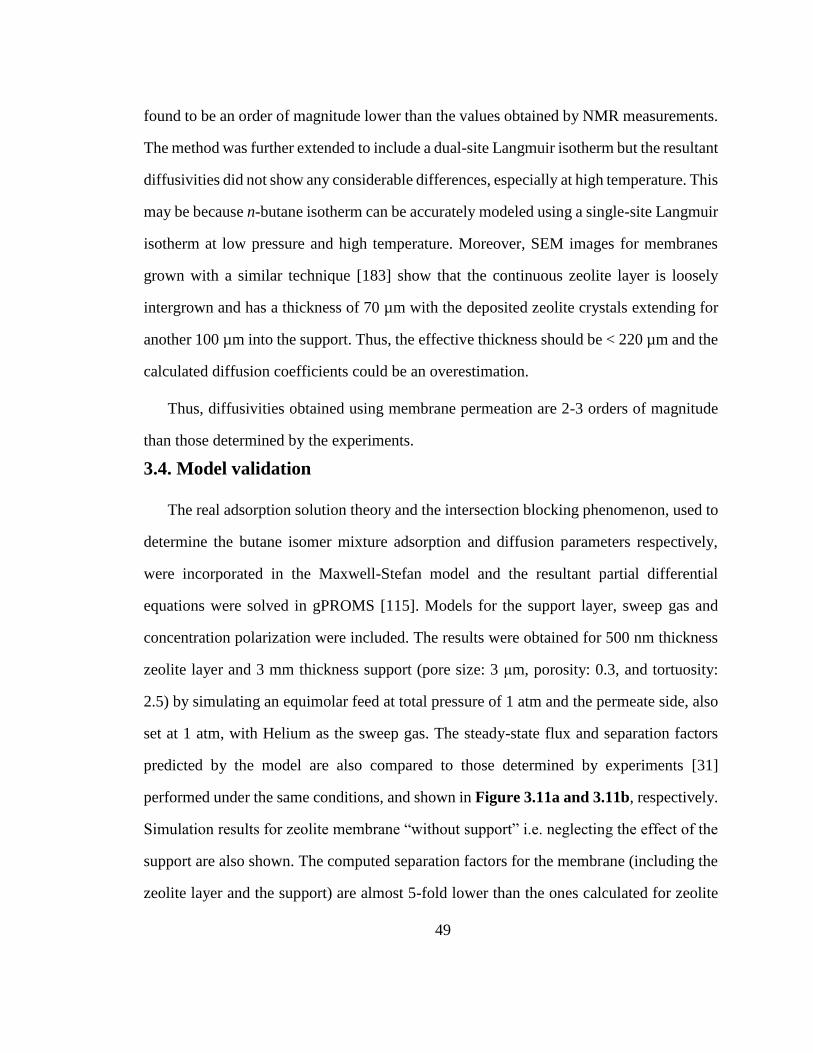
49
found to be an order of magnitude lower than the values obtained by NMR measurements.
The method was further extended to include a dual-site Langmuir isotherm but the resultant
diffusivities did not show any considerable differences, especially at high temperature. This
may be because n-butane isotherm can be accurately modeled using a single-site Langmuir
isotherm at low pressure and high temperature. Moreover, SEM images for membranes
grown with a similar technique [183] show that the continuous zeolite layer is loosely
intergrown and has a thickness of 70 µm with the deposited zeolite crystals extending for
another 100 µm into the support. Thus, the effective thickness should be < 220 µm and the
calculated diffusion coefficients could be an overestimation.
Thus, diffusivities obtained using membrane permeation are 2-3 orders of magnitude
than those determined by the experiments.
3.4. Model validation
The real adsorption solution theory and the intersection blocking phenomenon, used to
determine the butane isomer mixture adsorption and diffusion parameters respectively,
were incorporated in the Maxwell-Stefan model and the resultant partial differential
equations were solved in gPROMS [115]. Models for the support layer, sweep gas and
concentration polarization were included. The results were obtained for 500 nm thickness
zeolite layer and 3 mm thickness support (pore size: 3 μm, porosity: 0.3, and tortuosity:
2.5) by simulating an equimolar feed at total pressure of 1 atm and the permeate side, also
set at 1 atm, with Helium as the sweep gas. The steady-state flux and separation factors
predicted by the model are also compared to those determined by experiments [31]
performed under the same conditions, and shown in Figure 3.11a and 3.11b, respectively.
Simulation results for zeolite membrane “without support” i.e. neglecting the effect of the
support are also shown. The computed separation factors for the membrane (including the
zeolite layer and the support) are almost 5-fold lower than the ones calculated for zeolite
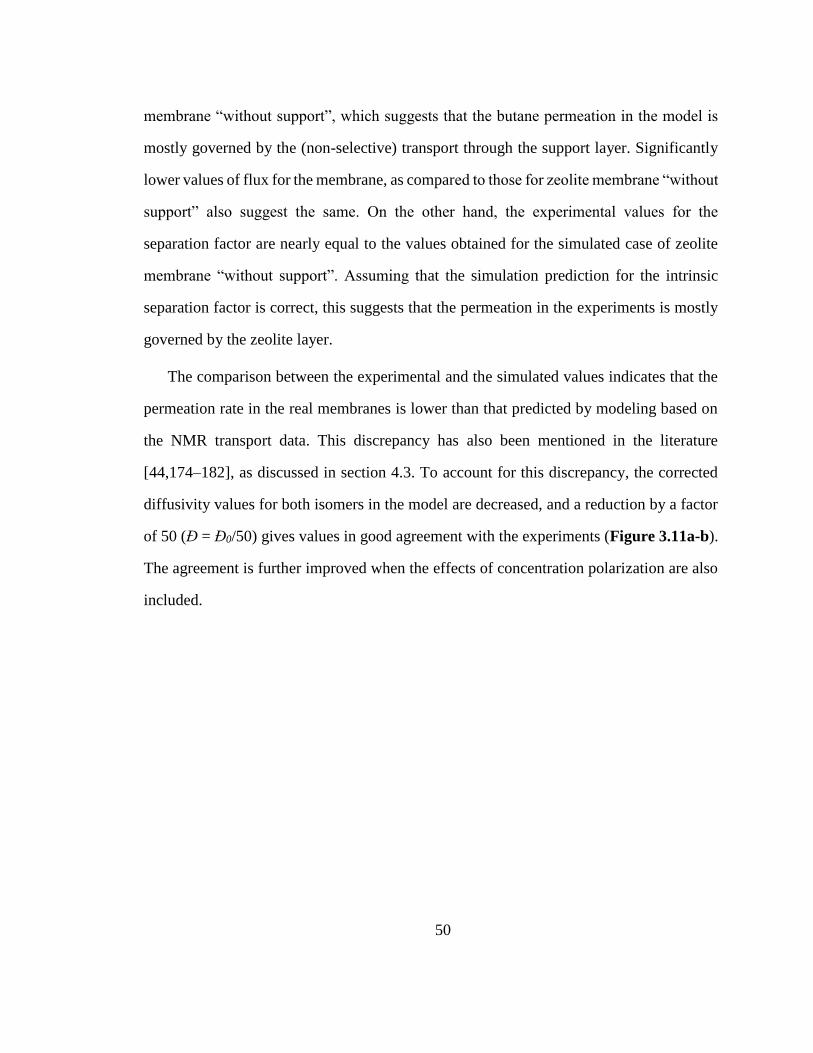
50
membrane “without support”, which suggests that the butane permeation in the model is
mostly governed by the (non-selective) transport through the support layer. Significantly
lower values of flux for the membrane, as compared to those for zeolite membrane “without
support” also suggest the same. On the other hand, the experimental values for the
separation factor are nearly equal to the values obtained for the simulated case of zeolite
membrane “without support”. Assuming that the simulation prediction for the intrinsic
separation factor is correct, this suggests that the permeation in the experiments is mostly
governed by the zeolite layer.
The comparison between the experimental and the simulated values indicates that the
permeation rate in the real membranes is lower than that predicted by modeling based on
the NMR transport data. This discrepancy has also been mentioned in the literature
[44,174–182], as discussed in section 4.3. To account for this discrepancy, the corrected
diffusivity values for both isomers in the model are decreased, and a reduction by a factor
of 50 (Đ = Đ0/50) gives values in good agreement with the experiments (Figure 3.11a-b).
The agreement is further improved when the effects of concentration polarization are also
included.
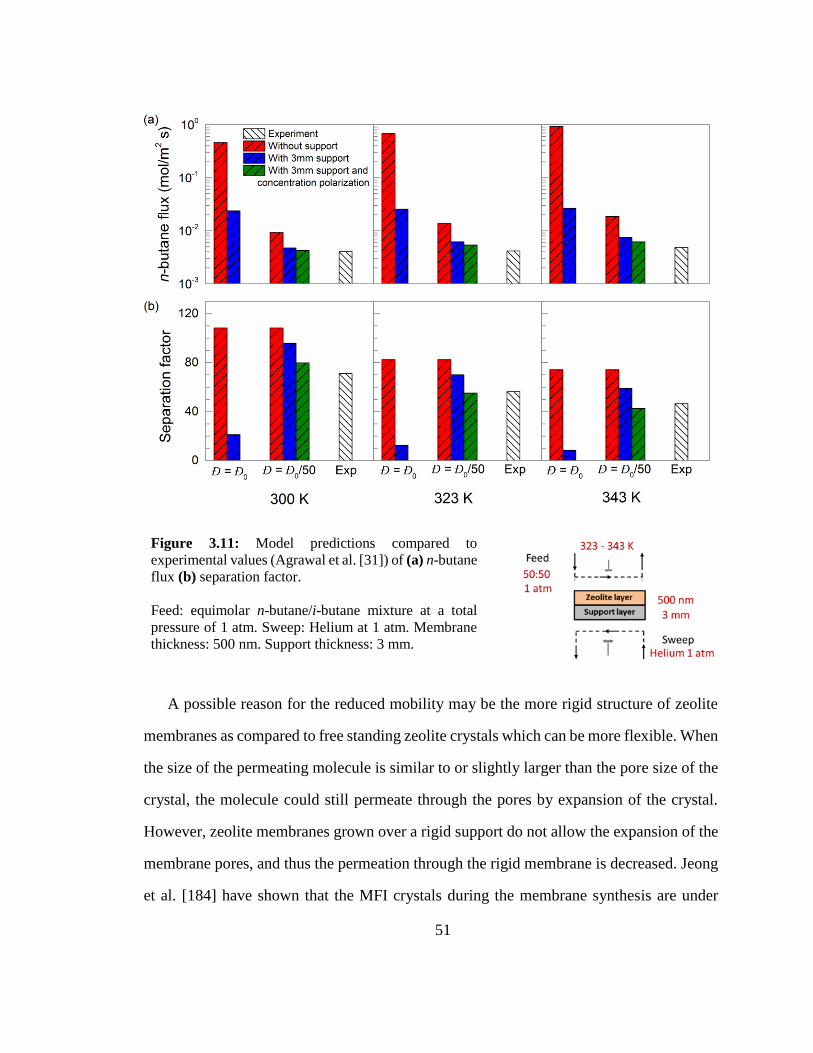
51
Figure 3.11: Model predictions compared to
experimental values (Agrawal et al. [31]) of (a) n-butane
flux (b) separation factor.
Feed: equimolar n-butane/i-butane mixture at a total
pressure of 1 atm. Sweep: Helium at 1 atm. Membrane
thickness: 500 nm. Support thickness: 3 mm.
A possible reason for the reduced mobility may be the more rigid structure of zeolite
membranes as compared to free standing zeolite crystals which can be more flexible. When
the size of the permeating molecule is similar to or slightly larger than the pore size of the
crystal, the molecule could still permeate through the pores by expansion of the crystal.
However, zeolite membranes grown over a rigid support do not allow the expansion of the
membrane pores, and thus the permeation through the rigid membrane is decreased. Jeong
et al. [184] have shown that the MFI crystals during the membrane synthesis are under
52
compressive stress and thus differ from the crystals in MFI powder. They have shown that
the crystals in c-oriented membranes are contracted along the a-axis and b-axis (in-plane)
and elongated along the c-axis (out-of-plane). Rangnekar et al. [185] have also observed a
similar phenomenon with nanosheets. Although other explanations, like pore blockage for
a large fraction of the membrane pores could also be responsible for this discrepancy, a
reduction in the value of the diffusion coefficients used in the model is adapted here as a
reasonable approach. In what follows, the model is further used to analyze the scope of
improvement and a process level model is developed and simulated to determine the
economic feasibility of membrane separation processes for butane isomer mixtures.
3.5 Scope of improvement
As the diffusivity of butane isomers in the current real (experimentally available) MFI
membranes is predicted to be 50-fold lower than the diffusivity values realized in free-
standing MFI crystals, there is a considerable scope of improvement in the separation of
butane isomers using MFI membranes. Three different cases for improvement in the
current values of diffusion coefficients in membranes are analyzed – improvement by a
factor of 5 (Đ = Đ0/10), 10 (Đ = Đ0/5) and 50 (Đ = Đ0); where Đ0 refers to the diffusion
coefficient in free-standing MFI crystals, which is the largest theoretically achievable
value. This 5 to 50-fold improvement could be realized by improving the membrane
microstructure to reduce strain in zeolite films and increase the diffusivity in the membrane
by up to 50-fold. In practice, the flux increase could be equivalently achieved, by further
decreasing the membrane thickness. If pore blocking is responsible for the discrepancy,
then its elimination or the corresponding membrane thickness reduction will be required to
improve flux.
As the permeance across the membrane increases, the relative contribution of the
resistances due to support layer, sweep gas and concentration polarization increases. Thus,
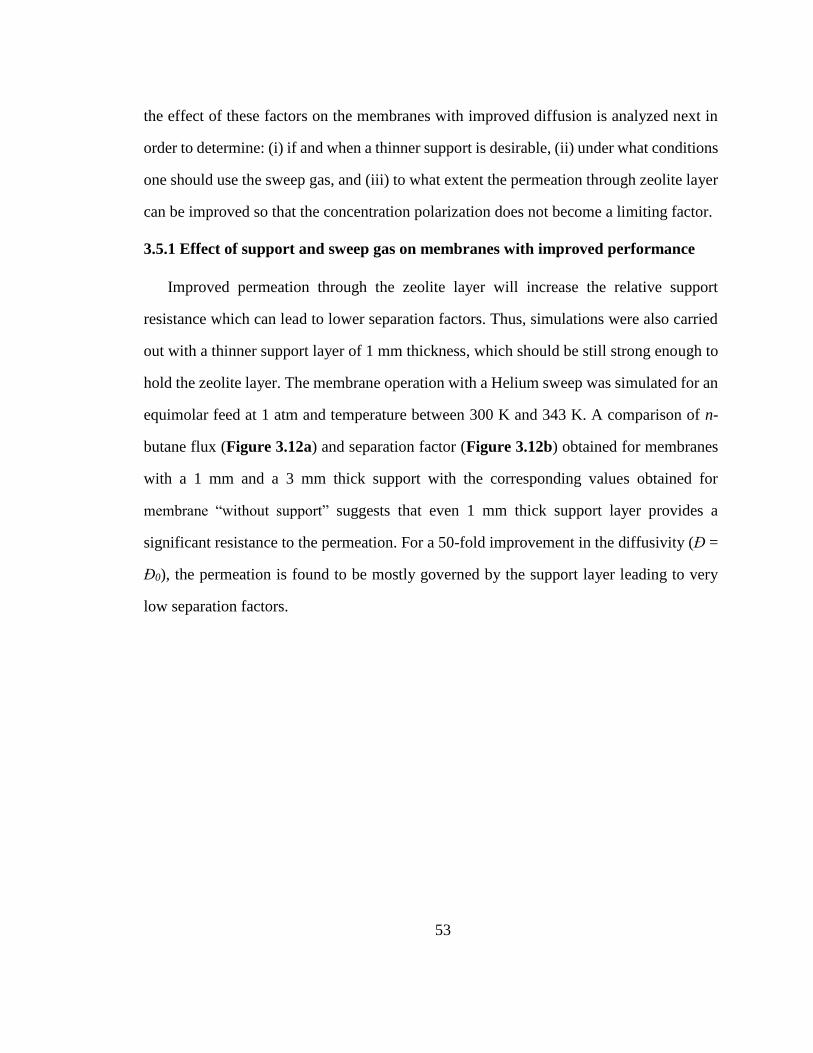
53
the effect of these factors on the membranes with improved diffusion is analyzed next in
order to determine: (i) if and when a thinner support is desirable, (ii) under what conditions
one should use the sweep gas, and (iii) to what extent the permeation through zeolite layer
can be improved so that the concentration polarization does not become a limiting factor.
3.5.1 Effect of support and sweep gas on membranes with improved performance
Improved permeation through the zeolite layer will increase the relative support
resistance which can lead to lower separation factors. Thus, simulations were also carried
out with a thinner support layer of 1 mm thickness, which should be still strong enough to
hold the zeolite layer. The membrane operation with a Helium sweep was simulated for an
equimolar feed at 1 atm and temperature between 300 K and 343 K. A comparison of n-
butane flux (Figure 3.12a) and separation factor (Figure 3.12b) obtained for membranes
with a 1 mm and a 3 mm thick support with the corresponding values obtained for
membrane “without support” suggests that even 1 mm thick support layer provides a
significant resistance to the permeation. For a 50-fold improvement in the diffusivity (Đ =
Đ0), the permeation is found to be mostly governed by the support layer leading to very
low separation factors.
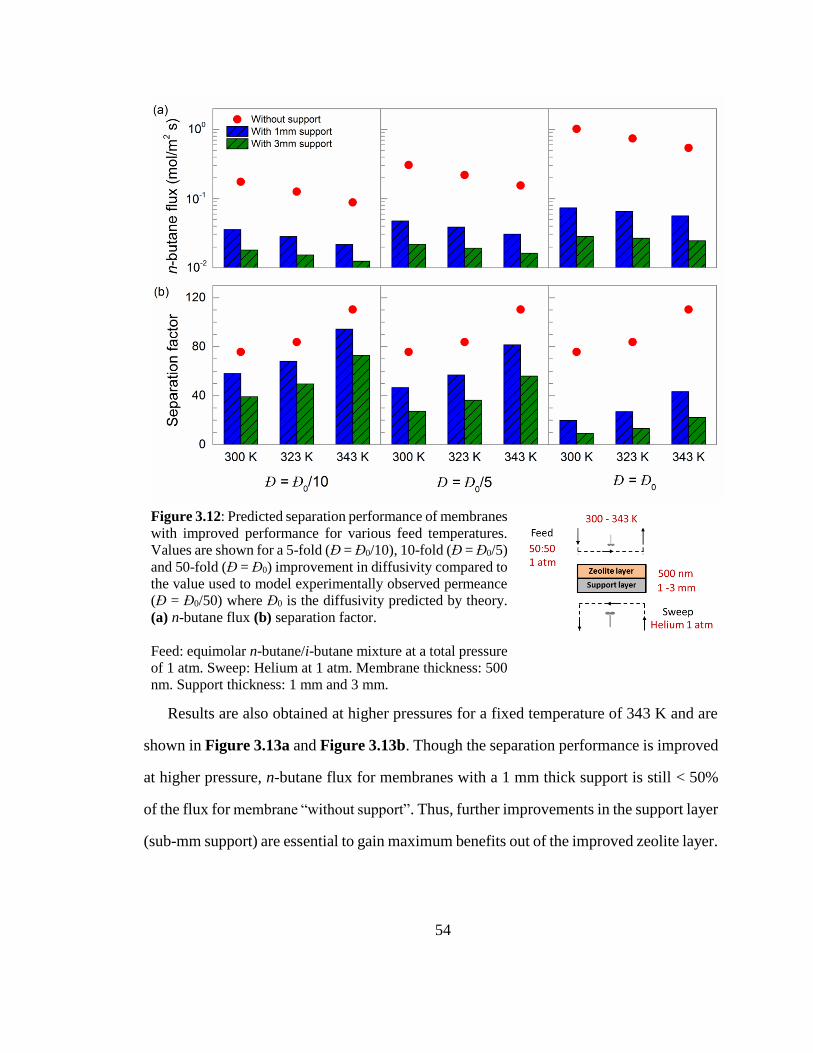
54
Figure 3.12: Predicted separation performance of membranes
with improved performance for various feed temperatures.
Values are shown for a 5-fold (Đ = Đ0/10), 10-fold (Đ = Đ0/5)
and 50-fold (Đ = Đ0) improvement in diffusivity compared to
the value used to model experimentally observed permeance
(Đ = Đ0/50) where Đ0 is the diffusivity predicted by theory.
(a) n-butane flux (b) separation factor.
Feed: equimolar n-butane/i-butane mixture at a total pressure
of 1 atm. Sweep: Helium at 1 atm. Membrane thickness: 500
nm. Support thickness: 1 mm and 3 mm.
Results are also obtained at higher pressures for a fixed temperature of 343 K and are
shown in Figure 3.13a and Figure 3.13b. Though the separation performance is improved
at higher pressure, n-butane flux for membranes with a 1 mm thick support is still < 50%
of the flux for membrane “without support”. Thus, further improvements in the support layer
(sub-mm support) are essential to gain maximum benefits out of the improved zeolite layer.
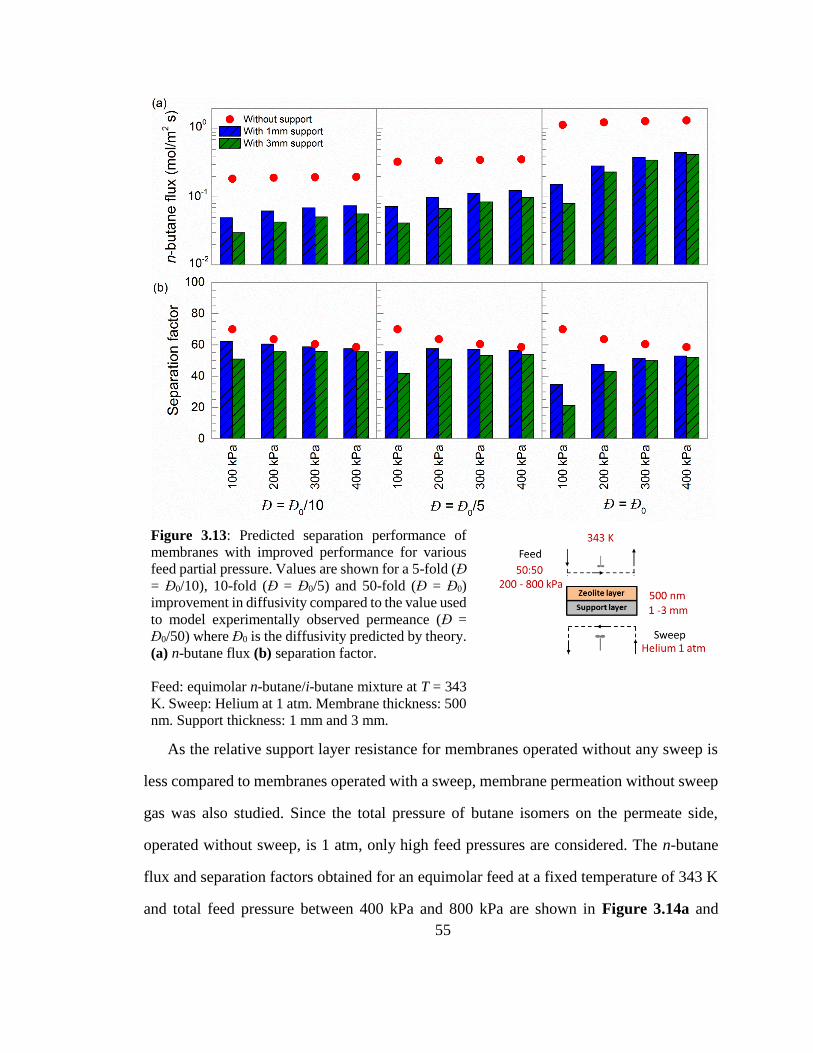
55
Figure 3.13: Predicted separation performance of
membranes with improved performance for various
feed partial pressure. Values are shown for a 5-fold (Đ
= Đ0/10), 10-fold (Đ = Đ0/5) and 50-fold (Đ = Đ0)
improvement in diffusivity compared to the value used
to model experimentally observed permeance (Đ =
Đ0/50) where Đ0 is the diffusivity predicted by theory.
(a) n-butane flux (b) separation factor.
Feed: equimolar n-butane/i-butane mixture at T = 343
K. Sweep: Helium at 1 atm. Membrane thickness: 500
nm. Support thickness: 1 mm and 3 mm.
As the relative support layer resistance for membranes operated without any sweep is
less compared to membranes operated with a sweep, membrane permeation without sweep
gas was also studied. Since the total pressure of butane isomers on the permeate side,
operated without sweep, is 1 atm, only high feed pressures are considered. The n-butane
flux and separation factors obtained for an equimolar feed at a fixed temperature of 343 K
and total feed pressure between 400 kPa and 800 kPa are shown in Figure 3.14a and
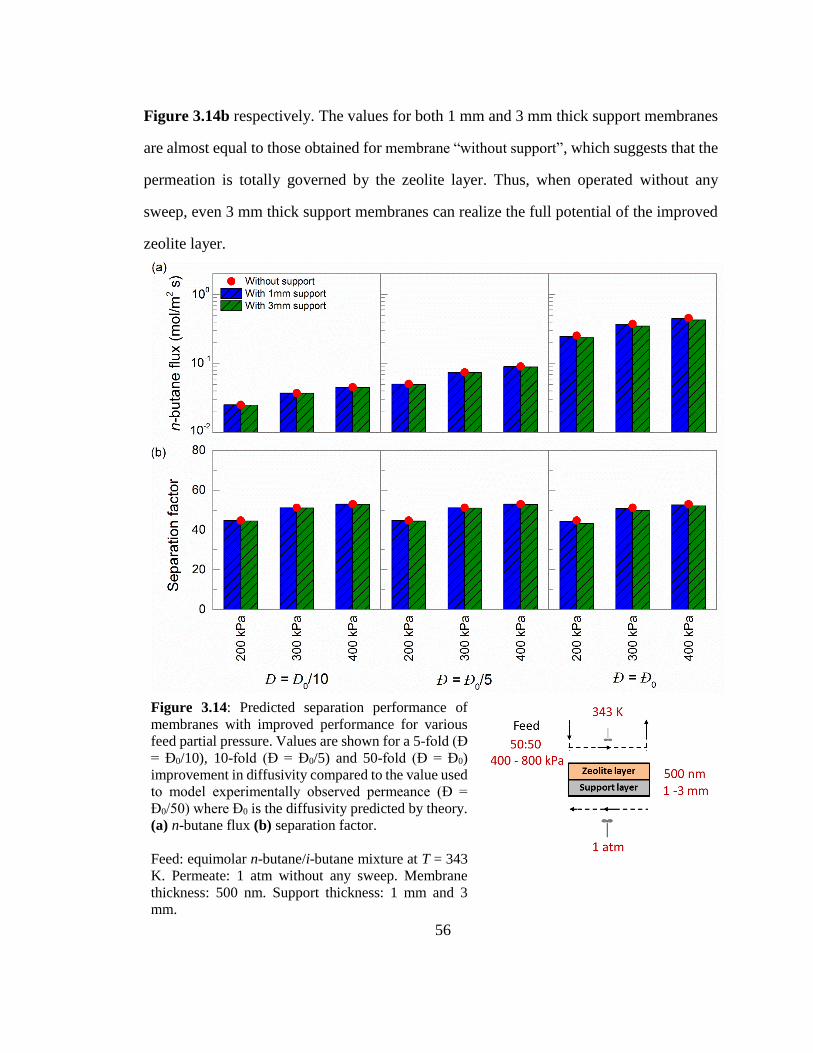
56
Figure 3.14b respectively. The values for both 1 mm and 3 mm thick support membranes
are almost equal to those obtained for membrane “without support”, which suggests that the
permeation is totally governed by the zeolite layer. Thus, when operated without any
sweep, even 3 mm thick support membranes can realize the full potential of the improved
zeolite layer.
Figure 3.14: Predicted separation performance of
membranes with improved performance for various
feed partial pressure. Values are shown for a 5-fold (Đ
= Đ0/10), 10-fold (Đ = Đ0/5) and 50-fold (Đ = Đ0)
improvement in diffusivity compared to the value used
to model experimentally observed permeance (Đ =
Đ0/50) where Đ0 is the diffusivity predicted by theory.
(a) n-butane flux (b) separation factor.
Feed: equimolar n-butane/i-butane mixture at T = 343
K. Permeate: 1 atm without any sweep. Membrane
thickness: 500 nm. Support thickness: 1 mm and 3
mm.
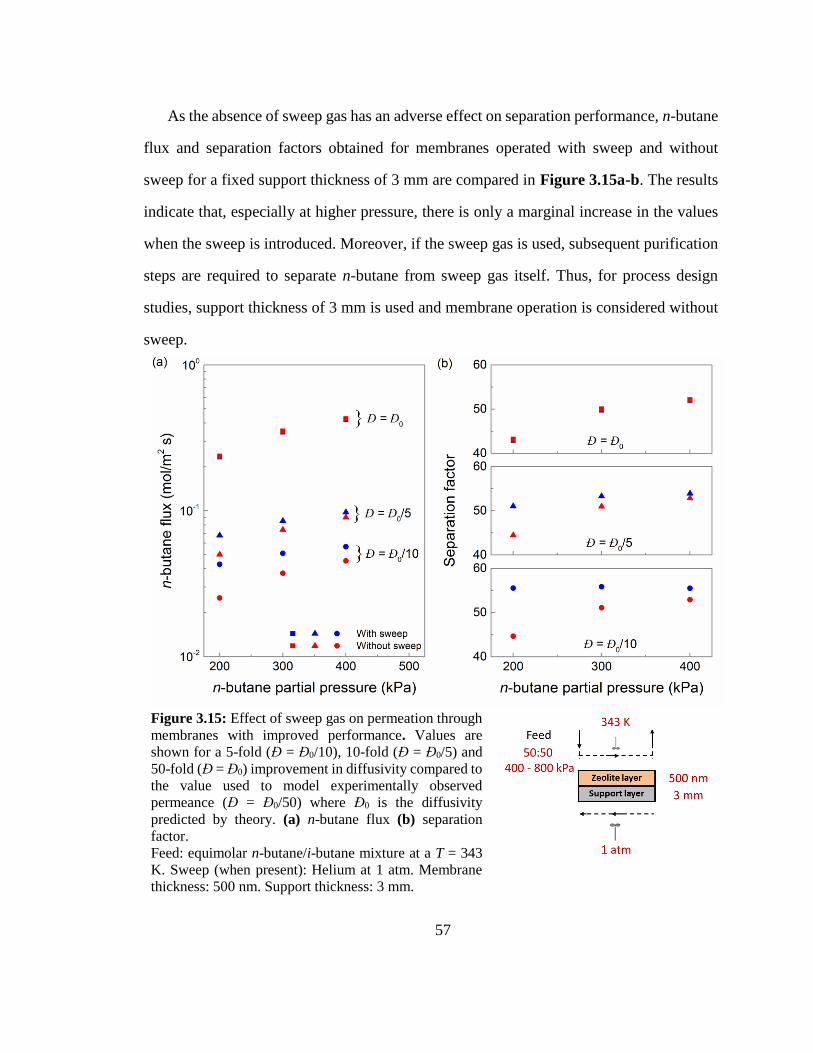
57
As the absence of sweep gas has an adverse effect on separation performance, n-butane
flux and separation factors obtained for membranes operated with sweep and without
sweep for a fixed support thickness of 3 mm are compared in Figure 3.15a-b. The results
indicate that, especially at higher pressure, there is only a marginal increase in the values
when the sweep is introduced. Moreover, if the sweep gas is used, subsequent purification
steps are required to separate n-butane from sweep gas itself. Thus, for process design
studies, support thickness of 3 mm is used and membrane operation is considered without
sweep.
Figure 3.15: Effect of sweep gas on permeation through
membranes with improved performance. Values are
shown for a 5-fold (Đ = Đ0/10), 10-fold (Đ = Đ0/5) and
50-fold (Đ = Đ0) improvement in diffusivity compared to
the value used to model experimentally observed
permeance (Đ = Đ0/50) where Đ0 is the diffusivity
predicted by theory. (a) n-butane flux (b) separation
factor.
Feed: equimolar n-butane/i-butane mixture at a T = 343
K. Sweep (when present): Helium at 1 atm. Membrane
thickness: 500 nm. Support thickness: 3 mm.
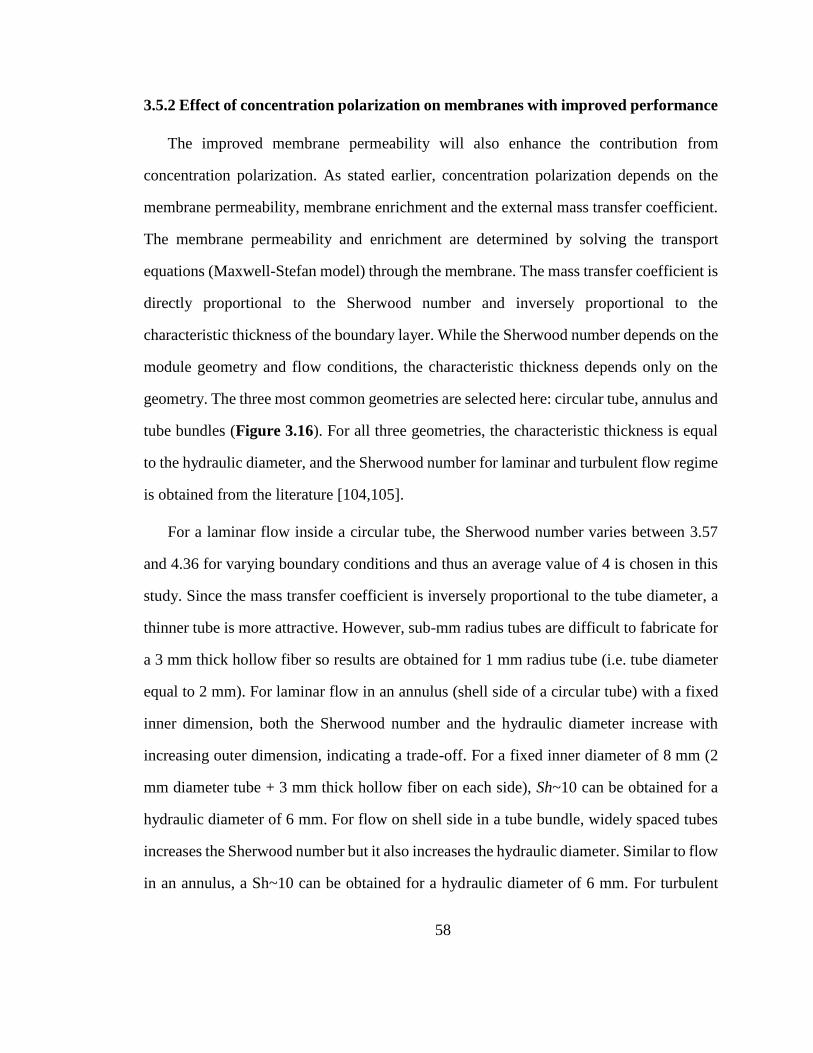
58
3.5.2 Effect of concentration polarization on membranes with improved performance
The improved membrane permeability will also enhance the contribution from
concentration polarization. As stated earlier, concentration polarization depends on the
membrane permeability, membrane enrichment and the external mass transfer coefficient.
The membrane permeability and enrichment are determined by solving the transport
equations (Maxwell-Stefan model) through the membrane. The mass transfer coefficient is
directly proportional to the Sherwood number and inversely proportional to the
characteristic thickness of the boundary layer. While the Sherwood number depends on the
module geometry and flow conditions, the characteristic thickness depends only on the
geometry. The three most common geometries are selected here: circular tube, annulus and
tube bundles (Figure 3.16). For all three geometries, the characteristic thickness is equal
to the hydraulic diameter, and the Sherwood number for laminar and turbulent flow regime
is obtained from the literature [104,105].
For a laminar flow inside a circular tube, the Sherwood number varies between 3.57
and 4.36 for varying boundary conditions and thus an average value of 4 is chosen in this
study. Since the mass transfer coefficient is inversely proportional to the tube diameter, a
thinner tube is more attractive. However, sub-mm radius tubes are difficult to fabricate for
a 3 mm thick hollow fiber so results are obtained for 1 mm radius tube (i.e. tube diameter
equal to 2 mm). For laminar flow in an annulus (shell side of a circular tube) with a fixed
inner dimension, both the Sherwood number and the hydraulic diameter increase with
increasing outer dimension, indicating a trade-off. For a fixed inner diameter of 8 mm (2
mm diameter tube + 3 mm thick hollow fiber on each side), Sh~10 can be obtained for a
hydraulic diameter of 6 mm. For flow on shell side in a tube bundle, widely spaced tubes
increases the Sherwood number but it also increases the hydraulic diameter. Similar to flow
in an annulus, a Sh~10 can be obtained for a hydraulic diameter of 6 mm. For turbulent
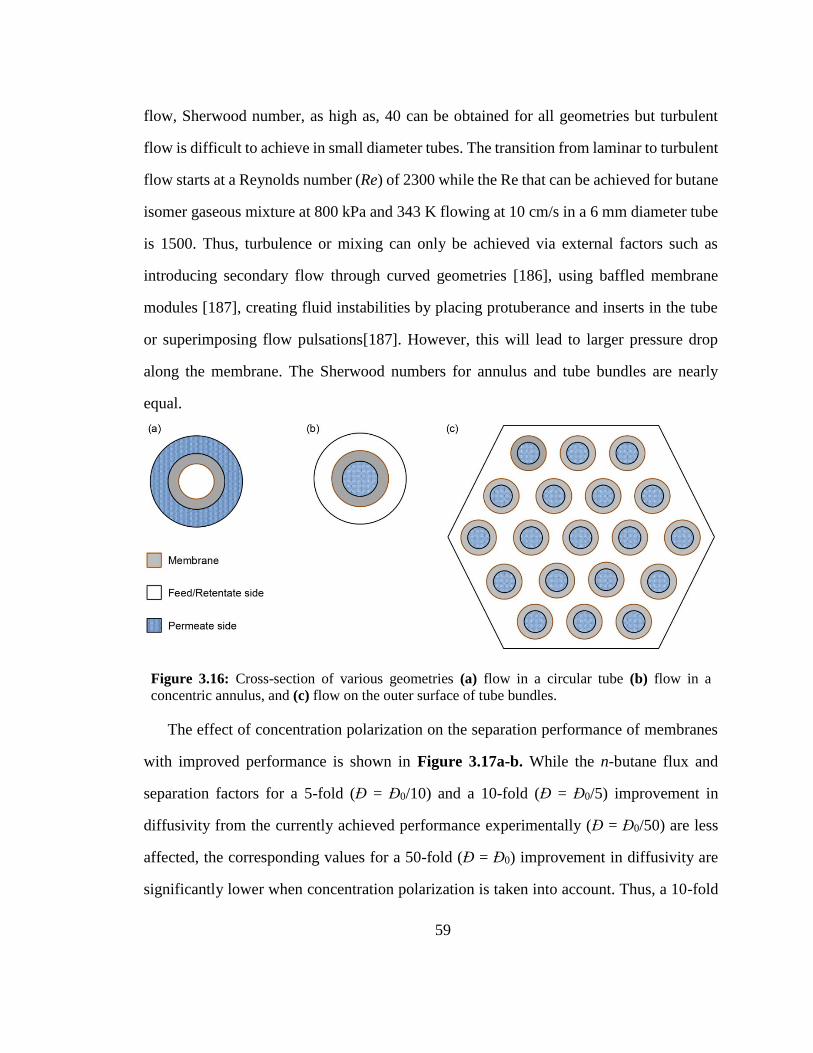
59
flow, Sherwood number, as high as, 40 can be obtained for all geometries but turbulent
flow is difficult to achieve in small diameter tubes. The transition from laminar to turbulent
flow starts at a Reynolds number (Re) of 2300 while the Re that can be achieved for butane
isomer gaseous mixture at 800 kPa and 343 K flowing at 10 cm/s in a 6 mm diameter tube
is 1500. Thus, turbulence or mixing can only be achieved via external factors such as
introducing secondary flow through curved geometries [186], using baffled membrane
modules [187], creating fluid instabilities by placing protuberance and inserts in the tube
or superimposing flow pulsations[187]. However, this will lead to larger pressure drop
along the membrane. The Sherwood numbers for annulus and tube bundles are nearly
equal.
Figure 3.16: Cross-section of various geometries (a) flow in a circular tube (b) flow in a
concentric annulus, and (c) flow on the outer surface of tube bundles.
The effect of concentration polarization on the separation performance of membranes
with improved performance is shown in Figure 3.17a-b. While the n-butane flux and
separation factors for a 5-fold (Đ = Đ0/10) and a 10-fold (Đ = Đ0/5) improvement in
diffusivity from the currently achieved performance experimentally (Đ = Đ0/50) are less
affected, the corresponding values for a 50-fold (Đ = Đ0) improvement in diffusivity are
significantly lower when concentration polarization is taken into account. Thus, a 10-fold
60
improvement in the diffusivity (with respect to the diffusivity that fits the currently
available experimental data) is a reasonable upper limit. Even if one achieves a higher
permeation by either improving transport (increasing diffusivity) in the zeolite layer or,
equivalently, by reducing membrane thickness, external resistances will start to dominate
and the performance will deteriorate accordingly.
Figure 3.17: Effect of concentration polarization on
permeation through membranes with improved
performance. Values are shown for a 5-fold (Đ =
Đ0/10), 10-fold (Đ = Đ0/5) and 50-fold (Đ = Đ0)
improvement in diffusivity compared to the value used
to model experimentally observed permeance (Đ =
Đ0/50) where Đ0 is the diffusivity predicted by theory.
(a) n-butane flux (b) separation factor.
Feed: equimolar n-butane/i-butane mixture at a T
= 343 K. Membrane thickness: 500 nm. Support
thickness: 3 mm.
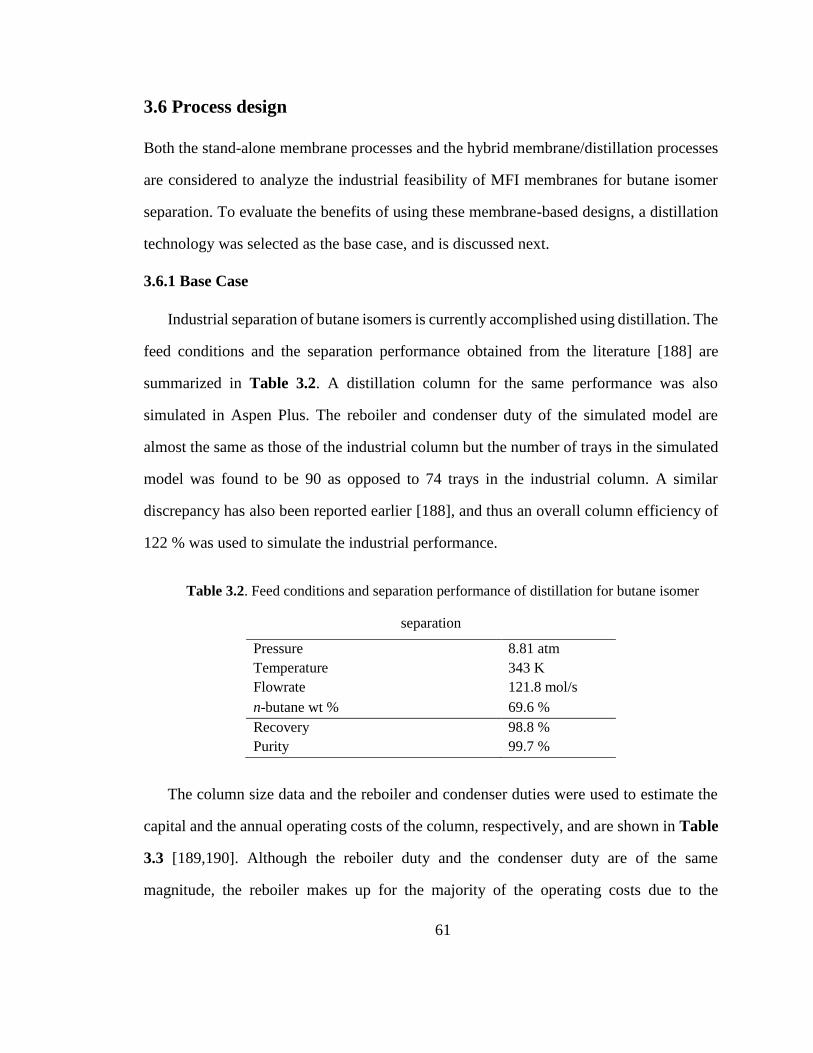
61
3.6 Process design
Both the stand-alone membrane processes and the hybrid membrane/distillation processes
are considered to analyze the industrial feasibility of MFI membranes for butane isomer
separation. To evaluate the benefits of using these membrane-based designs, a distillation
technology was selected as the base case, and is discussed next.
3.6.1 Base Case
Industrial separation of butane isomers is currently accomplished using distillation. The
feed conditions and the separation performance obtained from the literature [188] are
summarized in Table 3.2. A distillation column for the same performance was also
simulated in Aspen Plus. The reboiler and condenser duty of the simulated model are
almost the same as those of the industrial column but the number of trays in the simulated
model was found to be 90 as opposed to 74 trays in the industrial column. A similar
discrepancy has also been reported earlier [188], and thus an overall column efficiency of
122 % was used to simulate the industrial performance.
Table 3.2. Feed conditions and separation performance of distillation for butane isomer
separation
Pressure 8.81 atm
Temperature 343 K
Flowrate 121.8 mol/s
n-butane wt % 69.6 %
Recovery 98.8 %
Purity 99.7 %
The column size data and the reboiler and condenser duties were used to estimate the
capital and the annual operating costs of the column, respectively, and are shown in Table
3.3 [189,190]. Although the reboiler duty and the condenser duty are of the same
magnitude, the reboiler makes up for the majority of the operating costs due to the
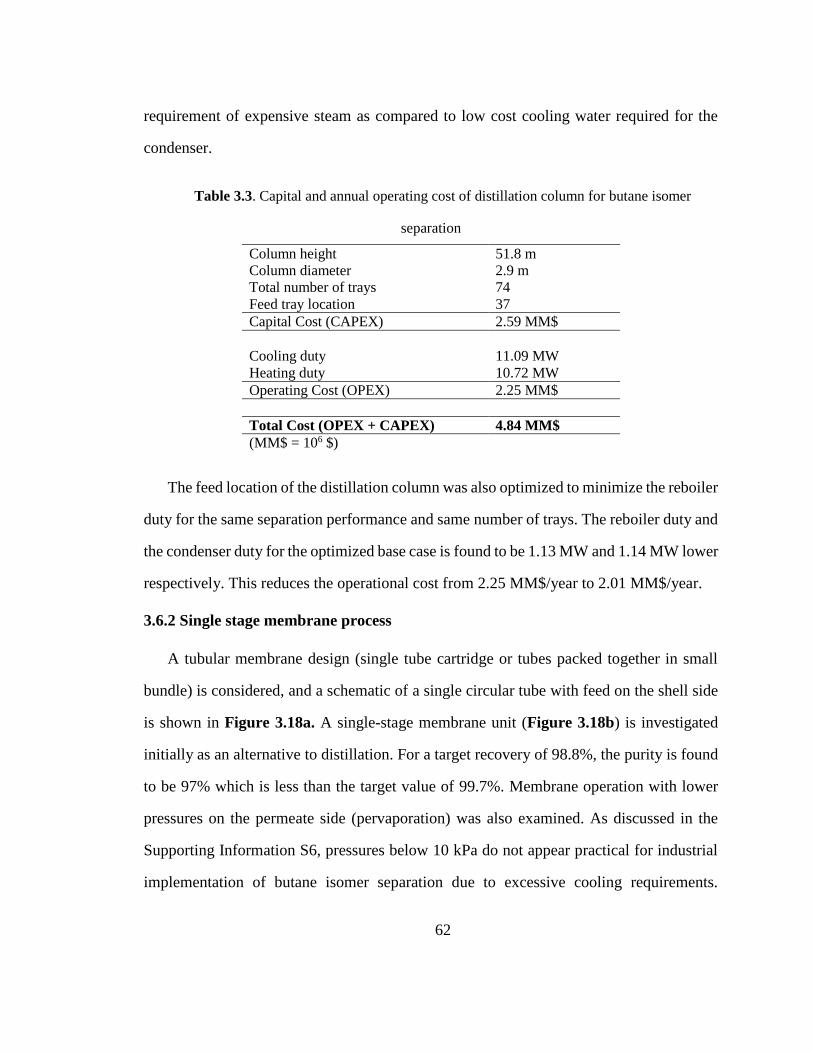
62
requirement of expensive steam as compared to low cost cooling water required for the
condenser.
Table 3.3. Capital and annual operating cost of distillation column for butane isomer
separation
Column height 51.8 m
Column diameter 2.9 m
Total number of trays 74
Feed tray location 37
Capital Cost (CAPEX) 2.59 MM$
Cooling duty 11.09 MW
Heating duty 10.72 MW
Operating Cost (OPEX) 2.25 MM$
Total Cost (OPEX + CAPEX) 4.84 MM$
(MM$ = 106 $)
The feed location of the distillation column was also optimized to minimize the reboiler
duty for the same separation performance and same number of trays. The reboiler duty and
the condenser duty for the optimized base case is found to be 1.13 MW and 1.14 MW lower
respectively. This reduces the operational cost from 2.25 MM$/year to 2.01 MM$/year.
3.6.2 Single stage membrane process
A tubular membrane design (single tube cartridge or tubes packed together in small
bundle) is considered, and a schematic of a single circular tube with feed on the shell side
is shown in Figure 3.18a. A single-stage membrane unit (Figure 3.18b) is investigated
initially as an alternative to distillation. For a target recovery of 98.8%, the purity is found
to be 97% which is less than the target value of 99.7%. Membrane operation with lower
pressures on the permeate side (pervaporation) was also examined. As discussed in the
Supporting Information S6, pressures below 10 kPa do not appear practical for industrial
implementation of butane isomer separation due to excessive cooling requirements.
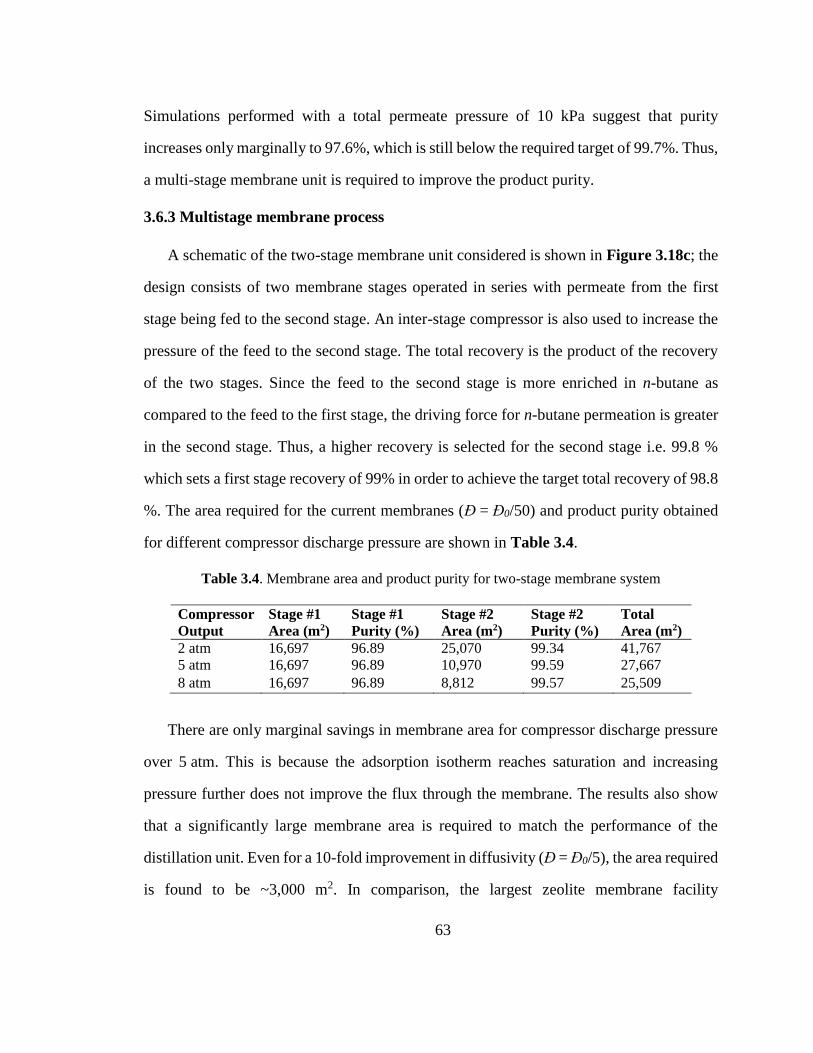
63
Simulations performed with a total permeate pressure of 10 kPa suggest that purity
increases only marginally to 97.6%, which is still below the required target of 99.7%. Thus,
a multi-stage membrane unit is required to improve the product purity.
3.6.3 Multistage membrane process
A schematic of the two-stage membrane unit considered is shown in Figure 3.18c; the
design consists of two membrane stages operated in series with permeate from the first
stage being fed to the second stage. An inter-stage compressor is also used to increase the
pressure of the feed to the second stage. The total recovery is the product of the recovery
of the two stages. Since the feed to the second stage is more enriched in n-butane as
compared to the feed to the first stage, the driving force for n-butane permeation is greater
in the second stage. Thus, a higher recovery is selected for the second stage i.e. 99.8 %
which sets a first stage recovery of 99% in order to achieve the target total recovery of 98.8
%. The area required for the current membranes (Đ = Đ0/50) and product purity obtained
for different compressor discharge pressure are shown in Table 3.4.
Table 3.4. Membrane area and product purity for two-stage membrane system
Compressor
Output
Stage #1
Area (m2)
Stage #1
Purity (%)
Stage #2
Area (m2)
Stage #2
Purity (%)
Total
Area (m2)
2 atm 16,697 96.89 25,070 99.34 41,767
5 atm 16,697 96.89 10,970 99.59 27,667
8 atm 16,697 96.89 8,812 99.57 25,509
There are only marginal savings in membrane area for compressor discharge pressure
over 5 atm. This is because the adsorption isotherm reaches saturation and increasing
pressure further does not improve the flux through the membrane. The results also show
that a significantly large membrane area is required to match the performance of the
distillation unit. Even for a 10-fold improvement in diffusivity (Đ = Đ0/5), the area required
is found to be ~3,000 m2. In comparison, the largest zeolite membrane facility
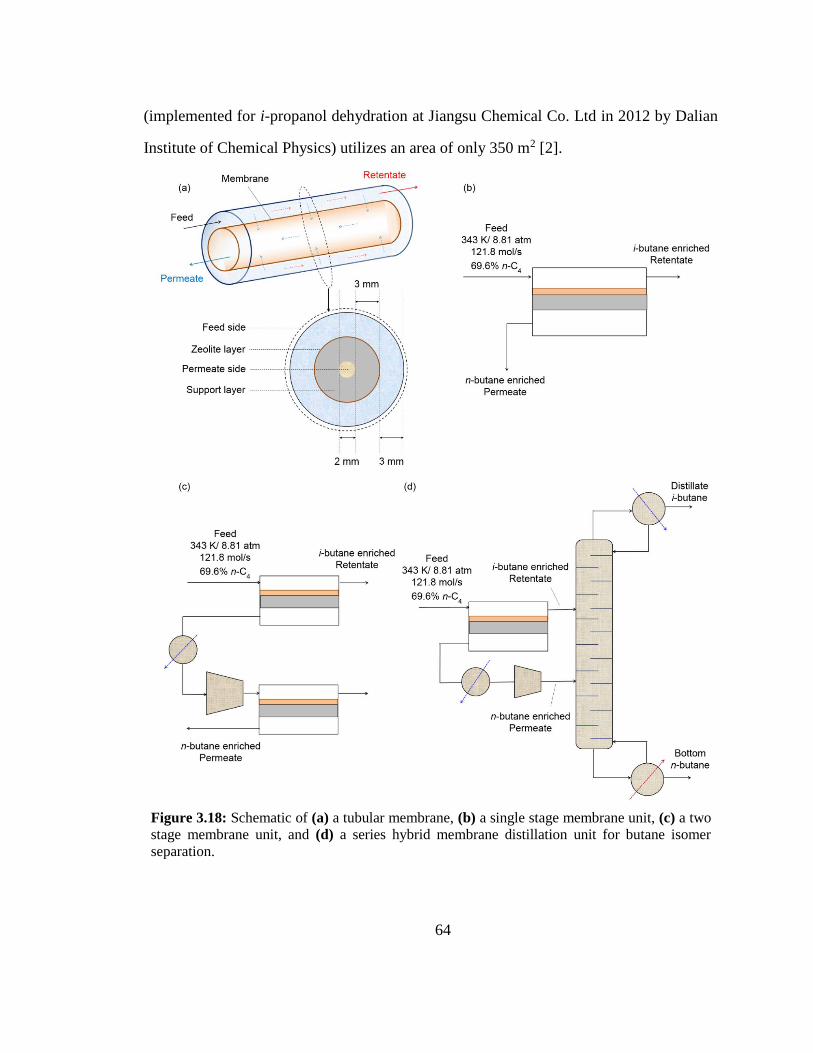
64
(implemented for i-propanol dehydration at Jiangsu Chemical Co. Ltd in 2012 by Dalian
Institute of Chemical Physics) utilizes an area of only 350 m2 [2].
Figure 3.18: Schematic of (a) a tubular membrane, (b) a single stage membrane unit, (c) a two
stage membrane unit, and (d) a series hybrid membrane distillation unit for butane isomer
separation.
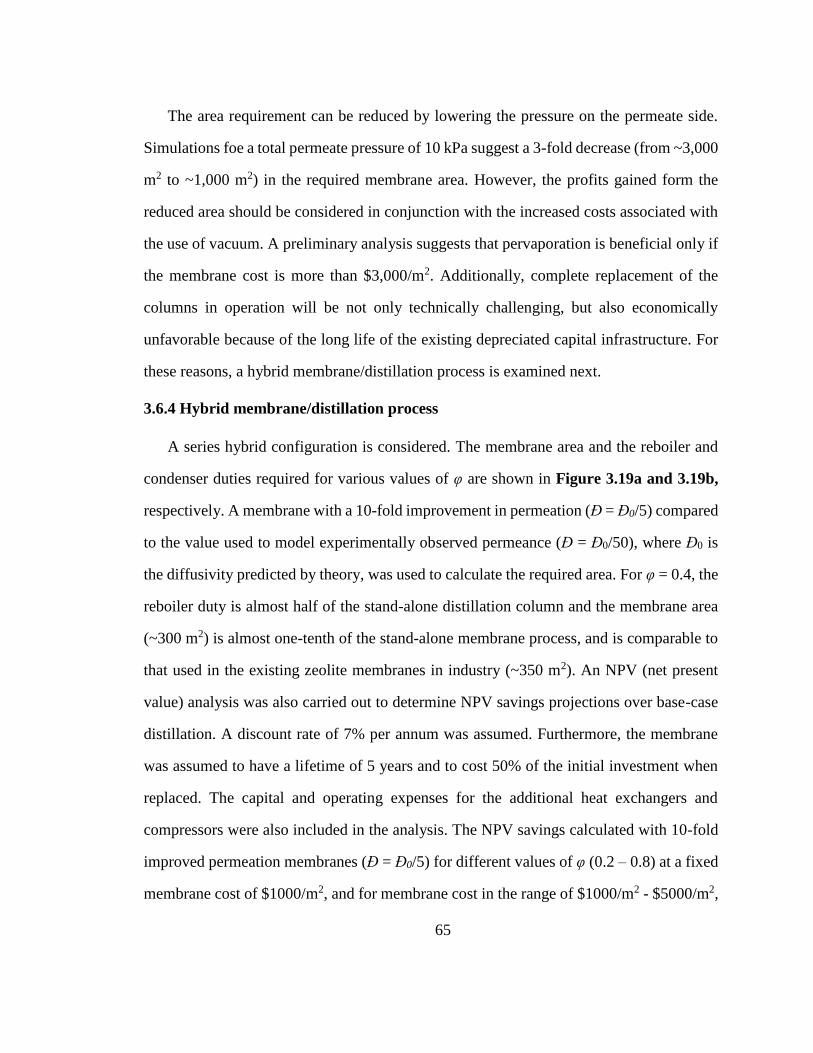
65
The area requirement can be reduced by lowering the pressure on the permeate side.
Simulations foe a total permeate pressure of 10 kPa suggest a 3-fold decrease (from ~3,000
m2 to ~1,000 m2) in the required membrane area. However, the profits gained form the
reduced area should be considered in conjunction with the increased costs associated with
the use of vacuum. A preliminary analysis suggests that pervaporation is beneficial only if
the membrane cost is more than $3,000/m2. Additionally, complete replacement of the
columns in operation will be not only technically challenging, but also economically
unfavorable because of the long life of the existing depreciated capital infrastructure. For
these reasons, a hybrid membrane/distillation process is examined next.
3.6.4 Hybrid membrane/distillation process
A series hybrid configuration is considered. The membrane area and the reboiler and
condenser duties required for various values of φ are shown in Figure 3.19a and 3.19b,
respectively. A membrane with a 10-fold improvement in permeation (Đ = Đ0/5) compared
to the value used to model experimentally observed permeance (Đ = Đ0/50), where Đ0 is
the diffusivity predicted by theory, was used to calculate the required area. For φ = 0.4, the
reboiler duty is almost half of the stand-alone distillation column and the membrane area
(~300 m2) is almost one-tenth of the stand-alone membrane process, and is comparable to
that used in the existing zeolite membranes in industry (~350 m2). An NPV (net present
value) analysis was also carried out to determine NPV savings projections over base-case
distillation. A discount rate of 7% per annum was assumed. Furthermore, the membrane
was assumed to have a lifetime of 5 years and to cost 50% of the initial investment when
replaced. The capital and operating expenses for the additional heat exchangers and
compressors were also included in the analysis. The NPV savings calculated with 10-fold
improved permeation membranes (Đ = Đ0/5) for different values of φ (0.2 – 0.8) at a fixed
membrane cost of $1000/m2, and for membrane cost in the range of $1000/m2 - $5000/m2,
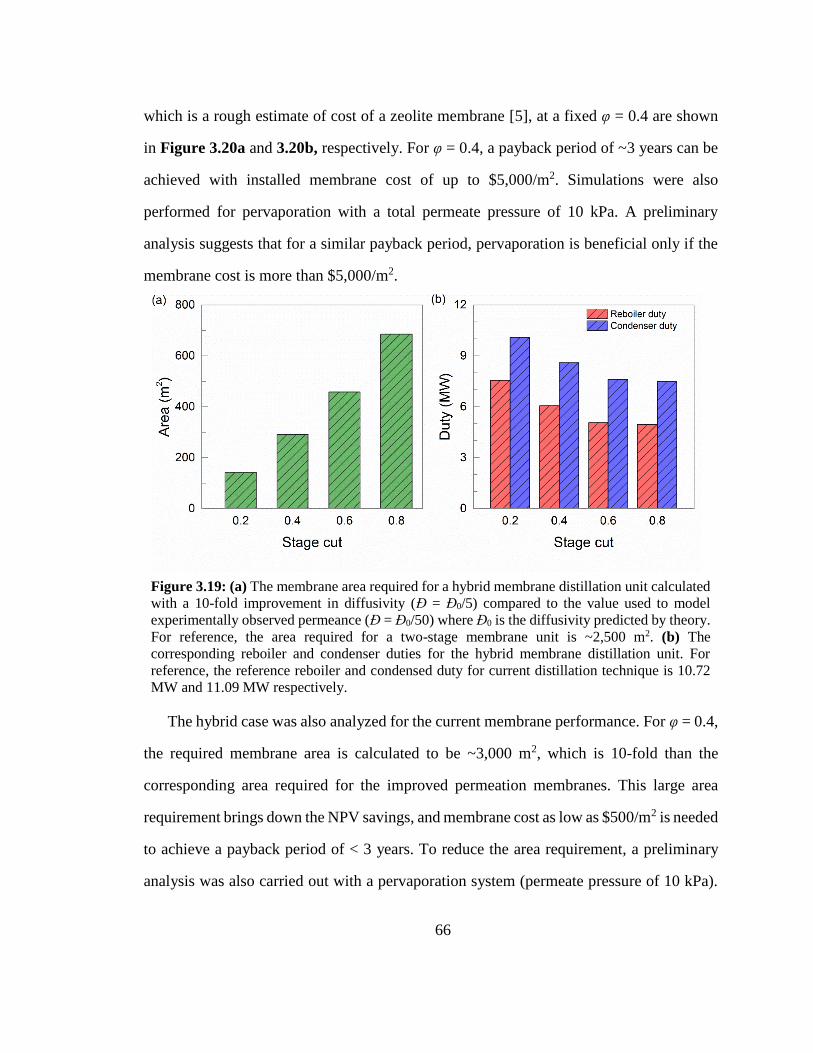
66
which is a rough estimate of cost of a zeolite membrane [5], at a fixed φ = 0.4 are shown
in Figure 3.20a and 3.20b, respectively. For φ = 0.4, a payback period of ~3 years can be
achieved with installed membrane cost of up to $5,000/m2. Simulations were also
performed for pervaporation with a total permeate pressure of 10 kPa. A preliminary
analysis suggests that for a similar payback period, pervaporation is beneficial only if the
membrane cost is more than $5,000/m2.
Figure 3.19: (a) The membrane area required for a hybrid membrane distillation unit calculated
with a 10-fold improvement in diffusivity (Đ = Đ0/5) compared to the value used to model
experimentally observed permeance (Đ = Đ0/50) where Đ0 is the diffusivity predicted by theory.
For reference, the area required for a two-stage membrane unit is ~2,500 m2. (b) The
corresponding reboiler and condenser duties for the hybrid membrane distillation unit. For
reference, the reference reboiler and condensed duty for current distillation technique is 10.72
MW and 11.09 MW respectively.
The hybrid case was also analyzed for the current membrane performance. For φ = 0.4,
the required membrane area is calculated to be ~3,000 m2, which is 10-fold than the
corresponding area required for the improved permeation membranes. This large area
requirement brings down the NPV savings, and membrane cost as low as $500/m2 is needed
to achieve a payback period of < 3 years. To reduce the area requirement, a preliminary
analysis was also carried out with a pervaporation system (permeate pressure of 10 kPa).
67
Although, pervaporation leads to a ~3 fold decrease (from ~3,000 m2 to ~1,000 m2) in the
required membrane area, it was found to be profitable only if the membrane cost is more
than $500/m2.
Figure 3.20: NPV savings projection of a series hybrid membrane-distillation system over
current distillation technique for a fixed (a) membrane cost = $ 5000/m2, and (b) stage cut (φ) =
0.4, calculated with a 10-fold improvement in diffusivity (Đ = Đ0/5) compared to the value used
to model experimentally observed permeance (Đ = Đ0/50) where Đ0 is the diffusivity predicted
by theory. (MM$ = 106 $)
The current membrane technology, thus, is not adequate for attractive performance in
butane isomers separation due to the requirement of large area and/or low cost. However,
a 10-fold improvement in permeation through these membranes brings down the required
membrane area comparable to that used in currently operating zeolite membrane plants [2].
Accordingly, the incurred cost can be as high as $5,000/m2 which is also a reasonable
estimate of the cost of zeolite membranes [13]. This 10-fold improvement in permeation
which can be achieved by either improving membrane microstructure and/or by reducing
membrane thickness makes these membranes very attractive from an industrial
perspective.
68
3.7 Conclusion
A detailed adsorption-diffusion model of a zeolite membrane process was developed
and applied for butane isomer separation. The effects of the support layer, sweep gas and
concentration polarization were also included. The comparison of steady state flux and
separation factors predicted by the model with the experimentally determined quantities
suggests a discrepancy between diffusion in zeolite membranes and diffusion in zeolite
crystals. We found that in order to obtain the experimentally observed permeance and
separation factor by simulation, we have to decrease the butane diffusivity in MFI crystals
by a factor of 50 (Đ = Đ0/50). The scope of improvement in the performance of current
membranes was explored by 5-fold (Đ = Đ0/10), 10-fold (Đ = Đ0/5) and 50-fold (Đ = Đ0)
improvement in diffusivity observed in current membranes (Đ = Đ0/50). The results
indicate that for up to a 10-fold improvement in diffusivity through the membrane, gains
in membrane performance can be attained; for larger diffusivities, concentration
polarization effects become significant and further improvement in membrane
performance is not possible. We envision that this 10-fold improvement in diffusivity (Đ
= Đ0/5) can be achieved by reducing pore blockages in the intergrown membranes or,
equivalently, its effect on performance can be achieved by reducing the membrane
thickness from the currently achieved ~500 nm to 50 nm or less.
Process simulations based on the detailed model for permeation through the membrane
combined with a plug flow model along the length of the membrane, were also performed.
Promising design options were determined to carry out butane isomer separation at
industrial scale and compared to the current distillation technique. A single-stage
membrane process was found to be inadequate as the purity is ~2% lower as compared to
the one achieved by distillation. A two stage membrane process, although matches the
distillation performance, requires prohibitively large membrane area. Moreover, replacing
69
distillation completely by membranes does not leverage the existing capital infrastructure.
Therefore, a hybrid membrane-distillation process, which exploits the advantages of both
processes was examined and found to be energy efficient and economically attractive. A
series hybrid process, which is expected to be easy to retrofit and control, was proposed
for this separation. With a 10-fold improvement in permeance as compared to that in
current state-of-the-art ceramic supported MFI membranes, payback period of 3 years can
be achieved with installed membrane cost of up to $5,000/m2. Alternatively, the same
payback period can be achieved by the current technology if manufacturing improvements
bring the membrane cost down to $500/m2.
70
Chapter 4: Bioethanol enrichment using
hydrophilic and hydrophobic membranes
4.1 Introduction
Ethanol, derived from lignocellulosic biomass, is considered a promising renewable
fuel [191–193]. The biochemical conversion of biomass to fuel-grade ethanol (99.5 wt. %)
requires several steps, namely, pretreatment, hydrolysis, fermentation and dehydration
[194,195]. Among these steps, the dehydration consumes more than half of the energy and
contributes correspondingly to the operating cost of the entire process, thereby reducing
the environmental and economic benefits of bioethanol as a fuel [196–198]. Thus, various
energy-efficient separation alternatives have been developed for sustainable production of
bioethanol [199–201].
Zeolite membrane separation has also been proposed as a possible solution [202–204].
Hydrophilic zeolite membranes (e.g., zeolite NaA membranes) have been developed and
commercialized for dehydrating streams near the azeotropic concentration [205,206]. On
the other hand, hydrophobic zeolite membranes (e.g., all-silica MFI membranes), which
have a greater affinity towards ethanol, have been considered for the enrichment of dilute
ethanol feed [18,26,207]. To date, only hydrophilic zeolite membranes have been
implemented in industry for obtaining fuel-grade ethanol from mixtures near the azeotropic
concentration [13]. The primary reason for commercialization of hydrophilic membranes
is their higher flux (~ 10-fold) and separation factor (~ 100-fold) compared to those
obtained for hydrophobic membranes [23]. The higher flux is attributed to the selective
permeation of faster-moving water molecules in hydrophilic membranes as compared to
the selective permeation of slower moving ethanol molecules in hydrophobic membranes.
The lower separation factor for hydrophobic membranes is attributed to the unavoidable
71
water co-adsorption due to hydrogen-bonding effects (i.e., water is brought in by adsorbed
ethanol molecules) [52,208] and due to favorable interaction of water molecules with
hydrophilic silanol defects [109,209].
4.2 Model for hydrophilic zeolite membrane
It has been shown that the hydrophilic zeolite membranes can be modeled using ideal
theories and, thus, permeation can be characterized by almost constant permeance as
observed both at lab-scale and industrial-scale experiments for a large range of operating
conditions [210,211]. The hydrophilic membrane is operated in vapor permeation mode
and is modeled using a constant permeance model:
where J is the flux through the membrane, p is the partial pressure, П is the permeance and
‘ret’ and ‘perm’ denote the retentate and the permeate side, respectively.
As the hydrophilic membranes are currently used over azeotropic concentration, most
of the experimental data is available at a feed concentration of 10 wt. % water. At 75 °C
and 10 wt. % water, commercial hydrophilic membranes have exhibited a flux of 5-10
kg/m2-hr (permeance of 4.5-9 x 10⁻⁶ mol/m2-sec) with separation factor > 10,000
(selectivity of ~ 11,700) [14,206]. In other lab-scale experimental studies, while the
permeance has been shown to be almost constant with increasing water content, the
selectivity increased with the water content in the feed [210]. Usually, the hydrophilic
membranes are operated in vapor permeation mode with feed at high temperature and
pressure. Under these conditions, the commercial NaA zeolite membranes from Bussan
Nanotech Research Institute Inc. (Japan) have exhibited a flux of 20 kg/m2-hr (permeance
of 2.54 x 10⁻⁶ mol/m2-sec) at 130 °C and total pressure of 550 kPa for 10 wt. % water [212].
permiretii ppJ ,,i (4.1)
72
Thus, hydrophilic membranes are modeled using a constant water permeance of 2.5 x 10⁻⁶
mol/m2-sec and a selectivity of 10,000.
4.3 Model for hydrophobic zeolite membrane
However, due to the presence of strong intermolecular hydrogen-bonding interactions
and defects, and the resulting highly non-ideal adsorption and diffusion behavior in
hydrophobic membranes, the use of ideal theories based on single-component adsorption
and diffusion leads to over-estimation of their separation capability [52,208].
Here, atomistic-level simulations are carried out to obtain a consistent set of mixture
adsorption and diffusion properties incorporating the effects of hydrogen bonding.
Furthermore, real adsorption solution theory [69] and the Maxwell-Stefan formulation with
non-zero correlation effects [43] are used to model the non-ideal interactions and determine
permeation through the membrane. The support layer is also included in the model. The
effects due to the hydrophilic defects are included using an empirical relation for enhanced
water adsorption.
4.4 Molecular simulation methods
The molecular simulations were performed in collaboration with Dr. Peng Bai in
Siepmann Research Group in Chemistry at the University of Minnesota.
Ethanol, water, and the sorbate-zeolite interactions are described by the TraPPE-UA
[213], TIP4P [214], and TraPPE-zeo [215] force-fields, respectively. This choice of
molecular models has been shown to predict both the adsorption and diffusion properties
in good agreement with available experimental data [52,208,215].
The solution-phase adsorption of water, ethanol, and their mixtures was calculated
using configurational-bias Monte Carlo simulations [216–218] in the NPT-version of the
Gibbs ensemble [219]. These simulations used a periodic box containing 12 unit cells of
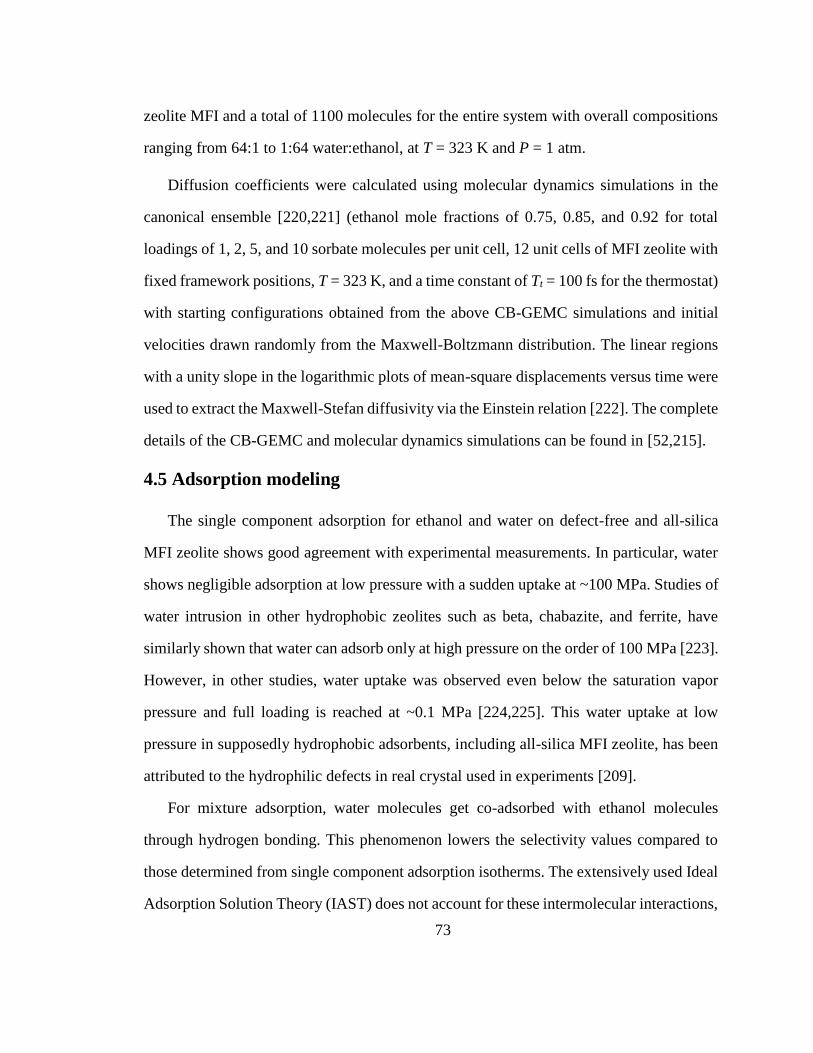
73
zeolite MFI and a total of 1100 molecules for the entire system with overall compositions
ranging from 64:1 to 1:64 water:ethanol, at T = 323 K and P = 1 atm.
Diffusion coefficients were calculated using molecular dynamics simulations in the
canonical ensemble [220,221] (ethanol mole fractions of 0.75, 0.85, and 0.92 for total
loadings of 1, 2, 5, and 10 sorbate molecules per unit cell, 12 unit cells of MFI zeolite with
fixed framework positions, T = 323 K, and a time constant of Tt = 100 fs for the thermostat)
with starting configurations obtained from the above CB-GEMC simulations and initial
velocities drawn randomly from the Maxwell-Boltzmann distribution. The linear regions
with a unity slope in the logarithmic plots of mean-square displacements versus time were
used to extract the Maxwell-Stefan diffusivity via the Einstein relation [222]. The complete
details of the CB-GEMC and molecular dynamics simulations can be found in [52,215].
4.5 Adsorption modeling
The single component adsorption for ethanol and water on defect-free and all-silica
MFI zeolite shows good agreement with experimental measurements. In particular, water
shows negligible adsorption at low pressure with a sudden uptake at ~100 MPa. Studies of
water intrusion in other hydrophobic zeolites such as beta, chabazite, and ferrite, have
similarly shown that water can adsorb only at high pressure on the order of 100 MPa [223].
However, in other studies, water uptake was observed even below the saturation vapor
pressure and full loading is reached at ~0.1 MPa [224,225]. This water uptake at low
pressure in supposedly hydrophobic adsorbents, including all-silica MFI zeolite, has been
attributed to the hydrophilic defects in real crystal used in experiments [209].
For mixture adsorption, water molecules get co-adsorbed with ethanol molecules
through hydrogen bonding. This phenomenon lowers the selectivity values compared to
those determined from single component adsorption isotherms. The extensively used Ideal
Adsorption Solution Theory (IAST) does not account for these intermolecular interactions,
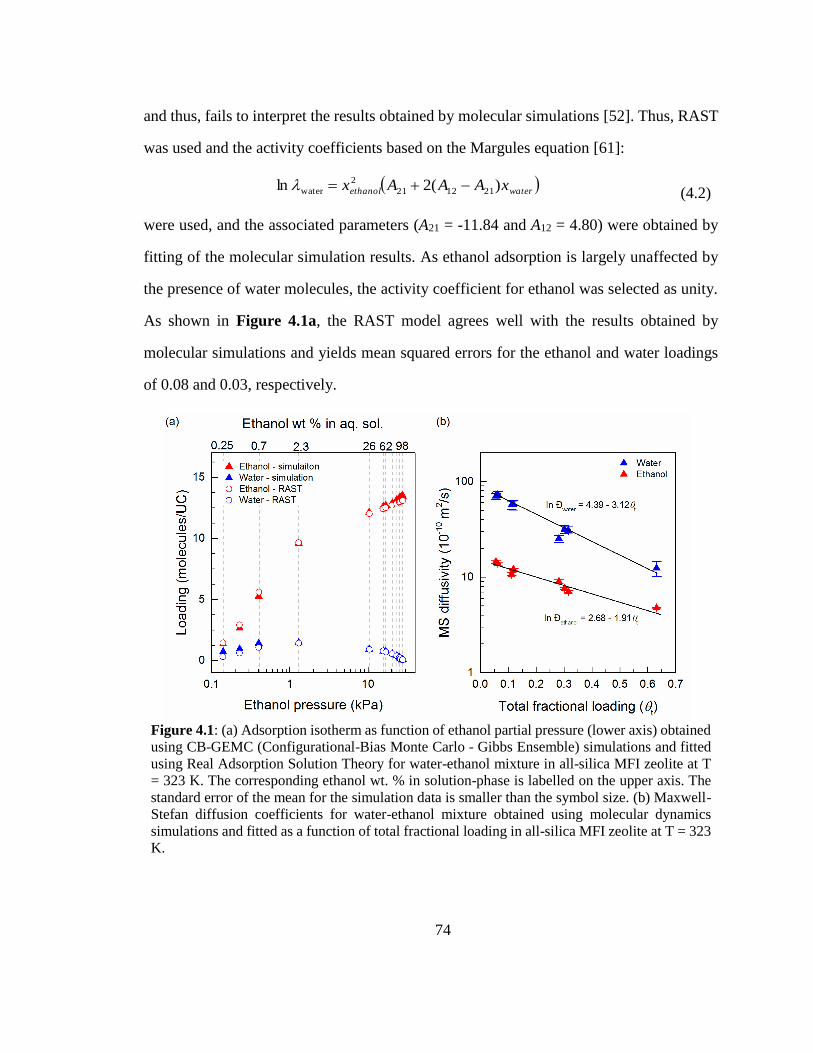
74
and thus, fails to interpret the results obtained by molecular simulations [52]. Thus, RAST
was used and the activity coefficients based on the Margules equation [61]:
waterethanol xAAAx )(2ln 211221
2
water (4.2)
were used, and the associated parameters (A21 = -11.84 and A12 = 4.80) were obtained by
fitting of the molecular simulation results. As ethanol adsorption is largely unaffected by
the presence of water molecules, the activity coefficient for ethanol was selected as unity.
As shown in Figure 4.1a, the RAST model agrees well with the results obtained by
molecular simulations and yields mean squared errors for the ethanol and water loadings
of 0.08 and 0.03, respectively.
Figure 4.1: (a) Adsorption isotherm as function of ethanol partial pressure (lower axis) obtained
using CB-GEMC (Configurational-Bias Monte Carlo - Gibbs Ensemble) simulations and fitted
using Real Adsorption Solution Theory for water-ethanol mixture in all-silica MFI zeolite at T
= 323 K. The corresponding ethanol wt. % in solution-phase is labelled on the upper axis. The
standard error of the mean for the simulation data is smaller than the symbol size. (b) Maxwell-
Stefan diffusion coefficients for water-ethanol mixture obtained using molecular dynamics
simulations and fitted as a function of total fractional loading in all-silica MFI zeolite at T = 323
K.
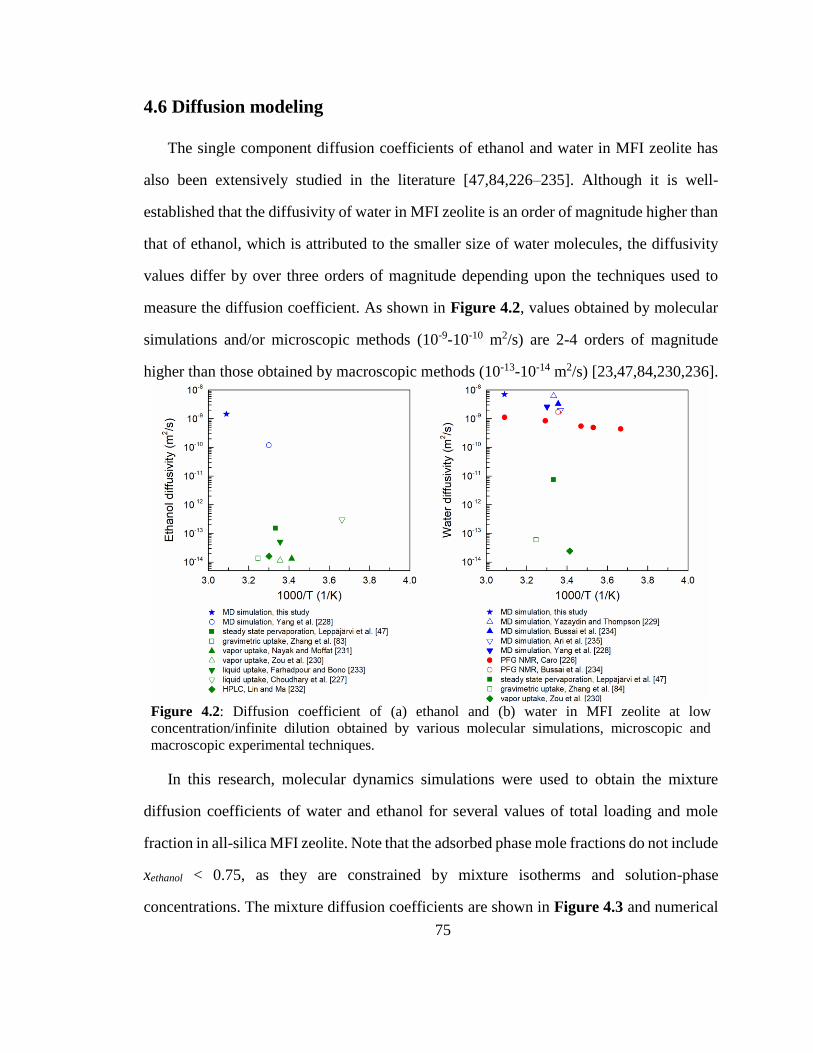
75
4.6 Diffusion modeling
The single component diffusion coefficients of ethanol and water in MFI zeolite has
also been extensively studied in the literature [47,84,226–235]. Although it is well-
established that the diffusivity of water in MFI zeolite is an order of magnitude higher than
that of ethanol, which is attributed to the smaller size of water molecules, the diffusivity
values differ by over three orders of magnitude depending upon the techniques used to
measure the diffusion coefficient. As shown in Figure 4.2, values obtained by molecular
simulations and/or microscopic methods (10-9-10-10 m2/s) are 2-4 orders of magnitude
higher than those obtained by macroscopic methods (10-13-10-14 m2/s) [23,47,84,230,236].
Figure 4.2: Diffusion coefficient of (a) ethanol and (b) water in MFI zeolite at low
concentration/infinite dilution obtained by various molecular simulations, microscopic and
macroscopic experimental techniques.
In this research, molecular dynamics simulations were used to obtain the mixture
diffusion coefficients of water and ethanol for several values of total loading and mole
fraction in all-silica MFI zeolite. Note that the adsorbed phase mole fractions do not include
xethanol < 0.75, as they are constrained by mixture isotherms and solution-phase
concentrations. The mixture diffusion coefficients are shown in Figure 4.3 and numerical
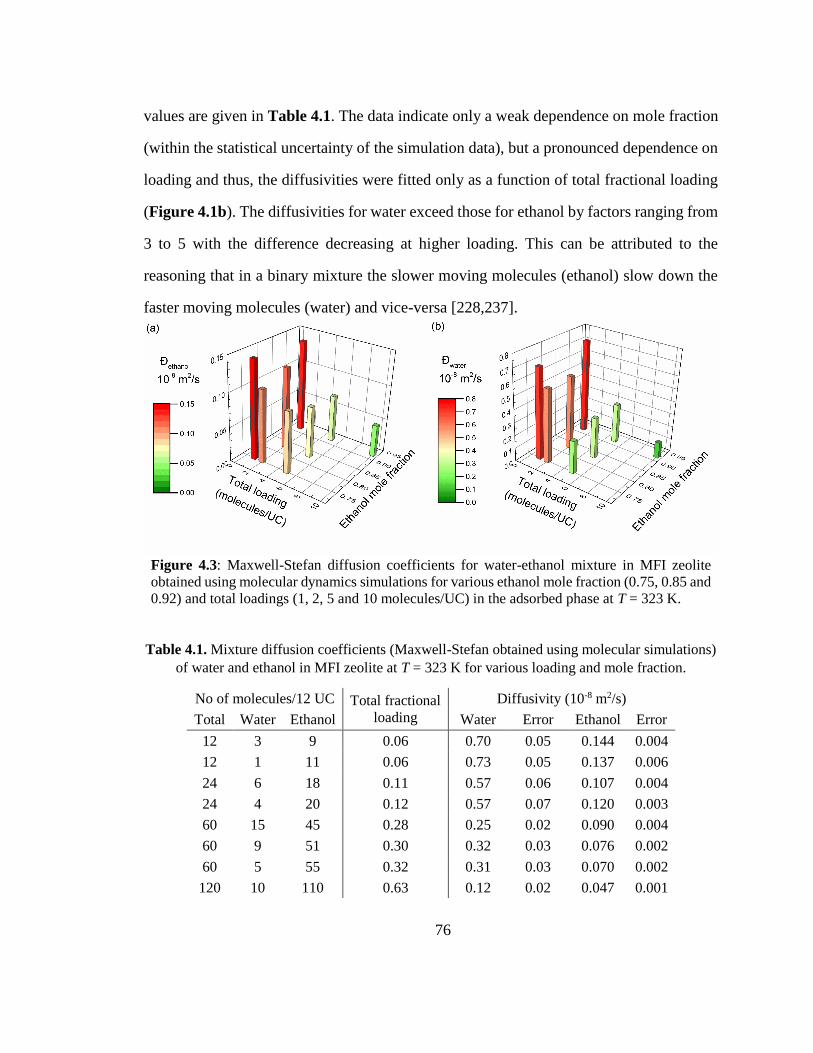
76
values are given in Table 4.1. The data indicate only a weak dependence on mole fraction
(within the statistical uncertainty of the simulation data), but a pronounced dependence on
loading and thus, the diffusivities were fitted only as a function of total fractional loading
(Figure 4.1b). The diffusivities for water exceed those for ethanol by factors ranging from
3 to 5 with the difference decreasing at higher loading. This can be attributed to the
reasoning that in a binary mixture the slower moving molecules (ethanol) slow down the
faster moving molecules (water) and vice-versa [228,237].
Figure 4.3: Maxwell-Stefan diffusion coefficients for water-ethanol mixture in MFI zeolite
obtained using molecular dynamics simulations for various ethanol mole fraction (0.75, 0.85 and
0.92) and total loadings (1, 2, 5 and 10 molecules/UC) in the adsorbed phase at T = 323 K.
Table 4.1. Mixture diffusion coefficients (Maxwell-Stefan obtained using molecular simulations)
of water and ethanol in MFI zeolite at T = 323 K for various loading and mole fraction.
No of molecules/12 UC Total fractional
loading
Diffusivity (10-8 m2/s)
Total Water Ethanol Water Error Ethanol Error
12 3 9 0.06 0.70 0.05 0.144 0.004
12 1 11 0.06 0.73 0.05 0.137 0.006
24 6 18 0.11 0.57 0.06 0.107 0.004
24 4 20 0.12 0.57 0.07 0.120 0.003
60 15 45 0.28 0.25 0.02 0.090 0.004
60 9 51 0.30 0.32 0.03 0.076 0.002
60 5 55 0.32 0.31 0.03 0.070 0.002
120 10 110 0.63 0.12 0.02 0.047 0.001
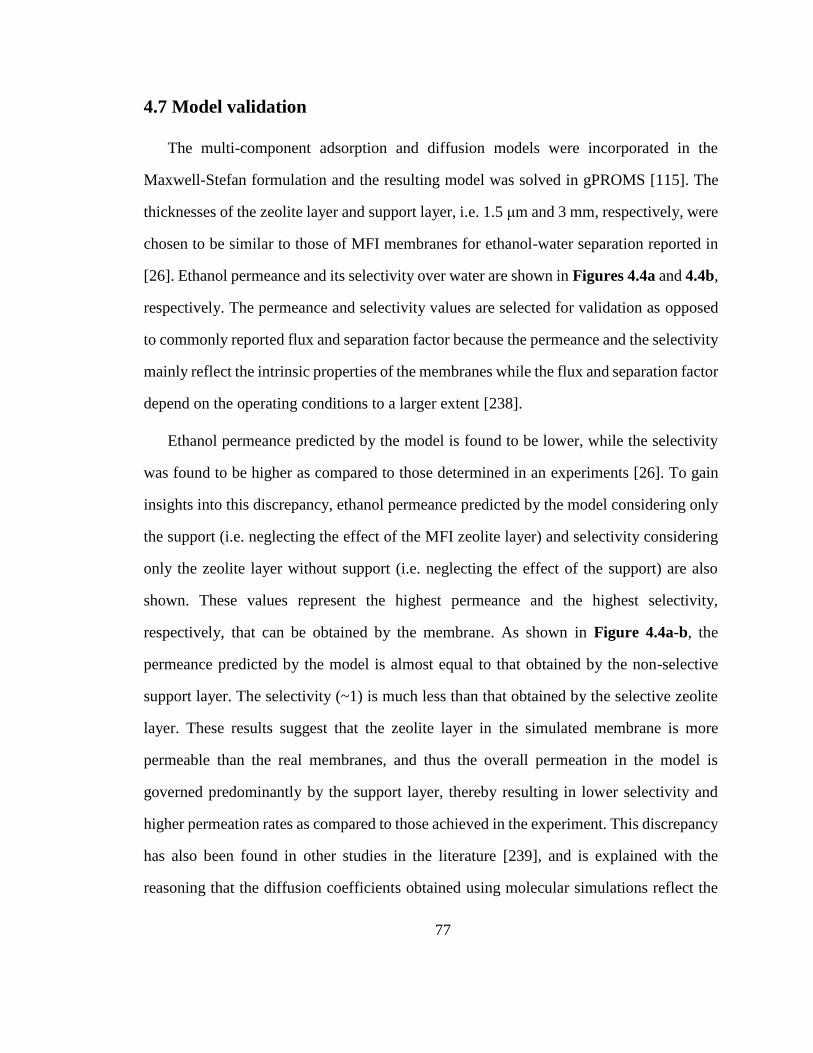
77
4.7 Model validation
The multi-component adsorption and diffusion models were incorporated in the
Maxwell-Stefan formulation and the resulting model was solved in gPROMS [115]. The
thicknesses of the zeolite layer and support layer, i.e. 1.5 μm and 3 mm, respectively, were
chosen to be similar to those of MFI membranes for ethanol-water separation reported in
[26]. Ethanol permeance and its selectivity over water are shown in Figures 4.4a and 4.4b,
respectively. The permeance and selectivity values are selected for validation as opposed
to commonly reported flux and separation factor because the permeance and the selectivity
mainly reflect the intrinsic properties of the membranes while the flux and separation factor
depend on the operating conditions to a larger extent [238].
Ethanol permeance predicted by the model is found to be lower, while the selectivity
was found to be higher as compared to those determined in an experiments [26]. To gain
insights into this discrepancy, ethanol permeance predicted by the model considering only
the support (i.e. neglecting the effect of the MFI zeolite layer) and selectivity considering
only the zeolite layer without support (i.e. neglecting the effect of the support) are also
shown. These values represent the highest permeance and the highest selectivity,
respectively, that can be obtained by the membrane. As shown in Figure 4.4a-b, the
permeance predicted by the model is almost equal to that obtained by the non-selective
support layer. The selectivity (~1) is much less than that obtained by the selective zeolite
layer. These results suggest that the zeolite layer in the simulated membrane is more
permeable than the real membranes, and thus the overall permeation in the model is
governed predominantly by the support layer, thereby resulting in lower selectivity and
higher permeation rates as compared to those achieved in the experiment. This discrepancy
has also been found in other studies in the literature [239], and is explained with the
reasoning that the diffusion coefficients obtained using molecular simulations reflect the
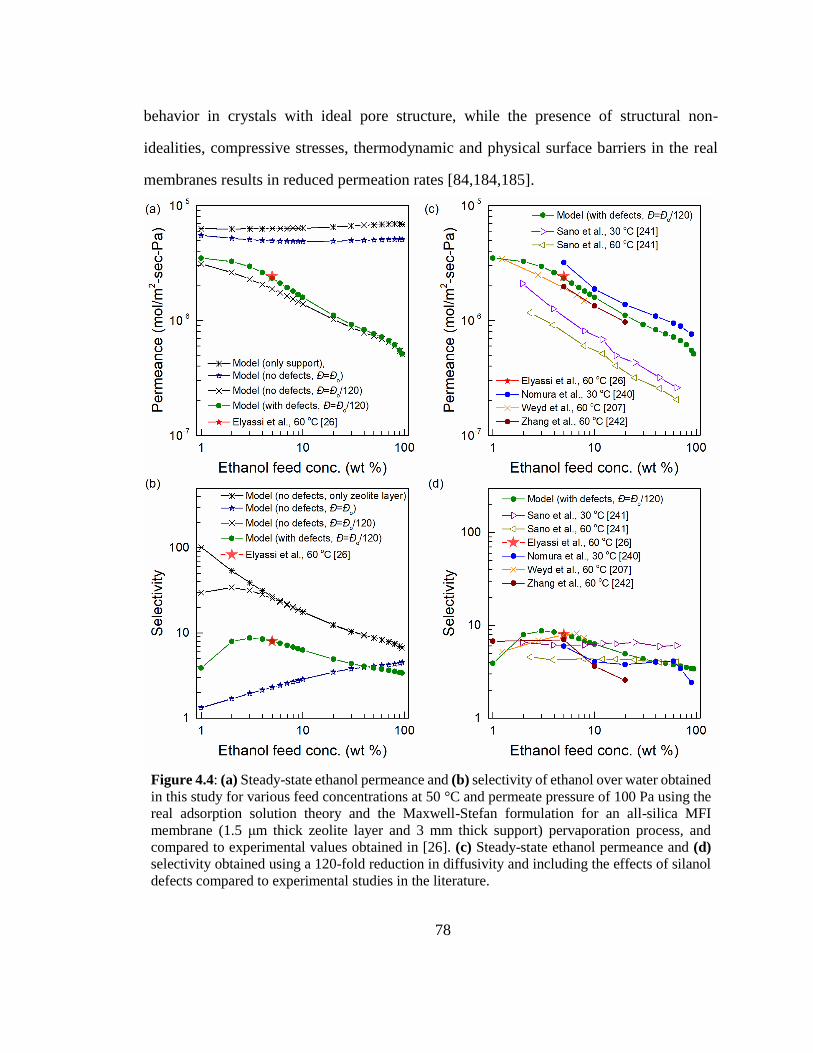
78
behavior in crystals with ideal pore structure, while the presence of structural non-
idealities, compressive stresses, thermodynamic and physical surface barriers in the real
membranes results in reduced permeation rates [84,184,185].
Figure 4.4: (a) Steady-state ethanol permeance and (b) selectivity of ethanol over water obtained
in this study for various feed concentrations at 50 °C and permeate pressure of 100 Pa using the
real adsorption solution theory and the Maxwell-Stefan formulation for an all-silica MFI
membrane (1.5 μm thick zeolite layer and 3 mm thick support) pervaporation process, and
compared to experimental values obtained in [26]. (c) Steady-state ethanol permeance and (d)
selectivity obtained using a 120-fold reduction in diffusivity and including the effects of silanol
defects compared to experimental studies in the literature.
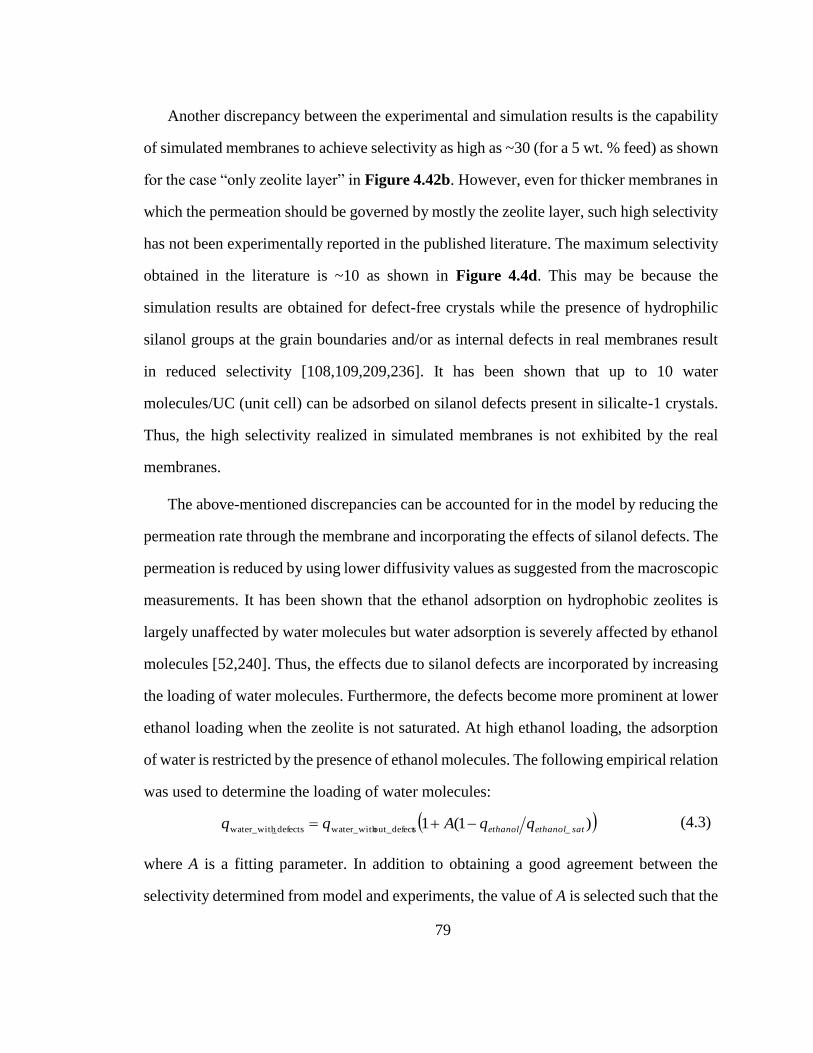
79
Another discrepancy between the experimental and simulation results is the capability
of simulated membranes to achieve selectivity as high as ~30 (for a 5 wt. % feed) as shown
for the case “only zeolite layer” in Figure 4.42b. However, even for thicker membranes in
which the permeation should be governed by mostly the zeolite layer, such high selectivity
has not been experimentally reported in the published literature. The maximum selectivity
obtained in the literature is ~10 as shown in Figure 4.4d. This may be because the
simulation results are obtained for defect-free crystals while the presence of hydrophilic
silanol groups at the grain boundaries and/or as internal defects in real membranes result
in reduced selectivity [108,109,209,236]. It has been shown that up to 10 water
molecules/UC (unit cell) can be adsorbed on silanol defects present in silicalte-1 crystals.
Thus, the high selectivity realized in simulated membranes is not exhibited by the real
membranes.
The above-mentioned discrepancies can be accounted for in the model by reducing the
permeation rate through the membrane and incorporating the effects of silanol defects. The
permeation is reduced by using lower diffusivity values as suggested from the macroscopic
measurements. It has been shown that the ethanol adsorption on hydrophobic zeolites is
largely unaffected by water molecules but water adsorption is severely affected by ethanol
molecules [52,240]. Thus, the effects due to silanol defects are incorporated by increasing
the loading of water molecules. Furthermore, the defects become more prominent at lower
ethanol loading when the zeolite is not saturated. At high ethanol loading, the adsorption
of water is restricted by the presence of ethanol molecules. The following empirical relation
was used to determine the loading of water molecules:
where A is a fitting parameter. In addition to obtaining a good agreement between the
selectivity determined from model and experiments, the value of A is selected such that the
)1(1 _sout_defectwater_with_defectswater_with satethanolethanol qqAqq (4.3)
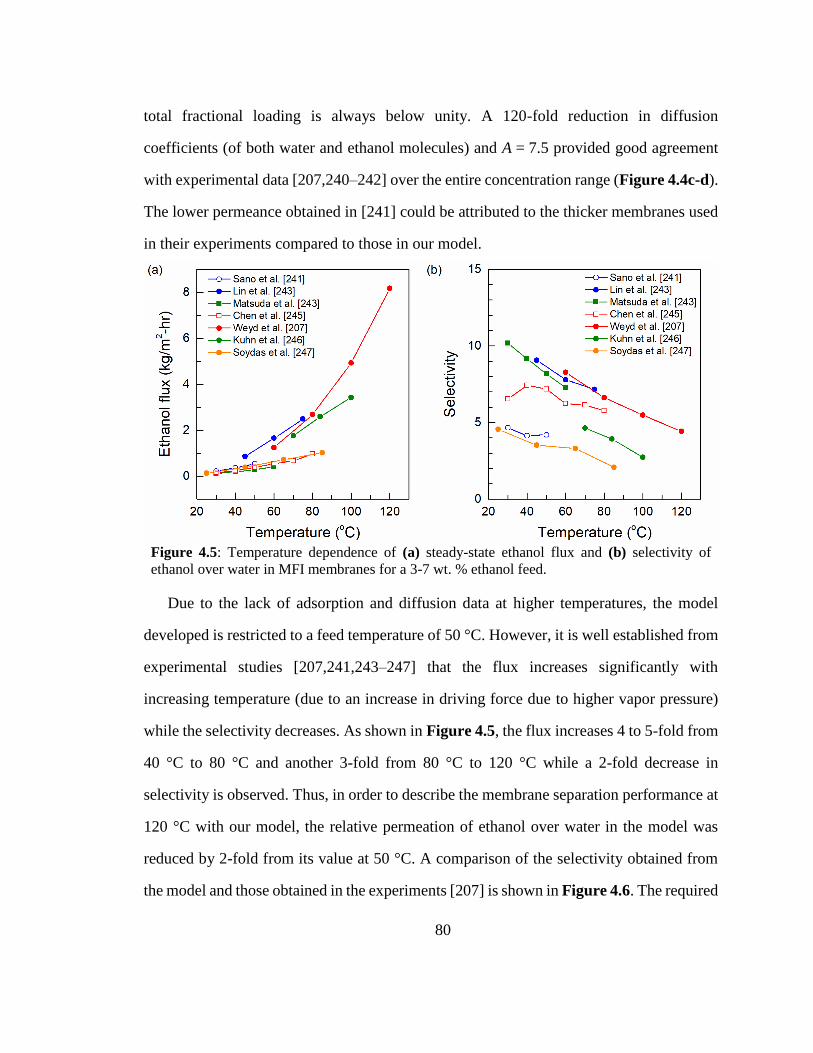
80
total fractional loading is always below unity. A 120-fold reduction in diffusion
coefficients (of both water and ethanol molecules) and A = 7.5 provided good agreement
with experimental data [207,240–242] over the entire concentration range (Figure 4.4c-d).
The lower permeance obtained in [241] could be attributed to the thicker membranes used
in their experiments compared to those in our model.
Figure 4.5: Temperature dependence of (a) steady-state ethanol flux and (b) selectivity of
ethanol over water in MFI membranes for a 3-7 wt. % ethanol feed.
Due to the lack of adsorption and diffusion data at higher temperatures, the model
developed is restricted to a feed temperature of 50 °C. However, it is well established from
experimental studies [207,241,243–247] that the flux increases significantly with
increasing temperature (due to an increase in driving force due to higher vapor pressure)
while the selectivity decreases. As shown in Figure 4.5, the flux increases 4 to 5-fold from
40 °C to 80 °C and another 3-fold from 80 °C to 120 °C while a 2-fold decrease in
selectivity is observed. Thus, in order to describe the membrane separation performance at
120 °C with our model, the relative permeation of ethanol over water in the model was
reduced by 2-fold from its value at 50 °C. A comparison of the selectivity obtained from
the model and those obtained in the experiments [207] is shown in Figure 4.6. The required
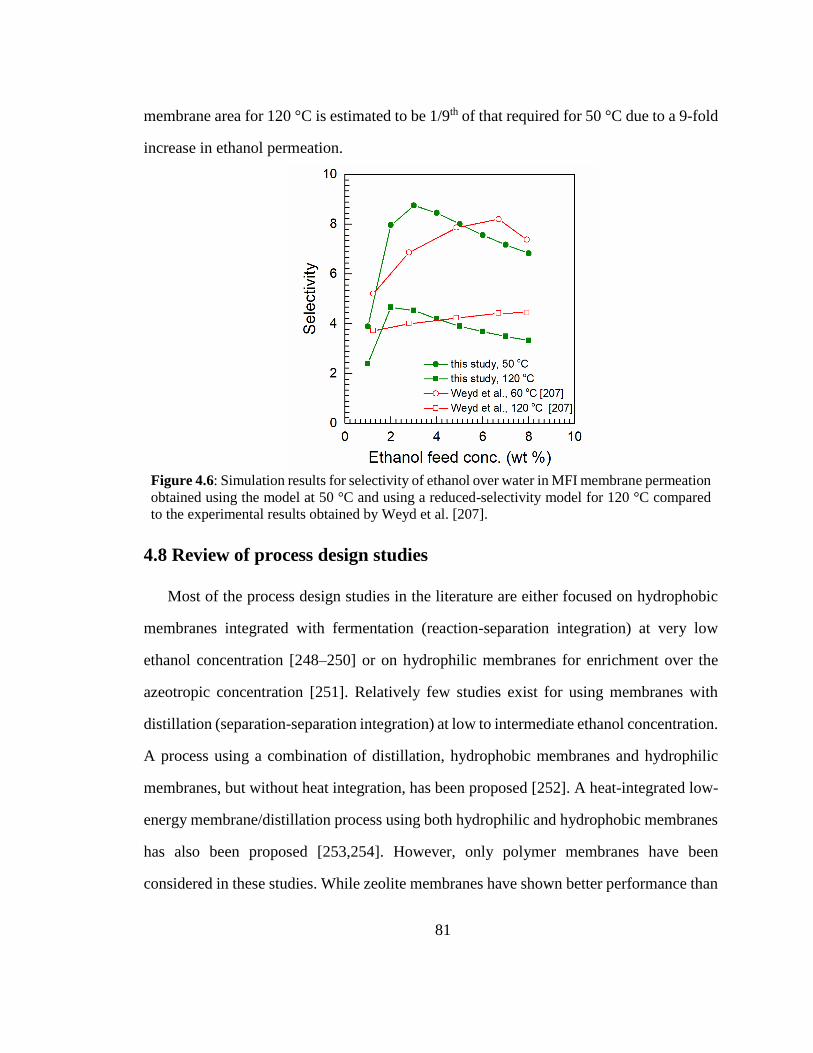
81
membrane area for 120 °C is estimated to be 1/9th of that required for 50 °C due to a 9-fold
increase in ethanol permeation.
Figure 4.6: Simulation results for selectivity of ethanol over water in MFI membrane permeation
obtained using the model at 50 °C and using a reduced-selectivity model for 120 °C compared
to the experimental results obtained by Weyd et al. [207].
4.8 Review of process design studies
Most of the process design studies in the literature are either focused on hydrophobic
membranes integrated with fermentation (reaction-separation integration) at very low
ethanol concentration [248–250] or on hydrophilic membranes for enrichment over the
azeotropic concentration [251]. Relatively few studies exist for using membranes with
distillation (separation-separation integration) at low to intermediate ethanol concentration.
A process using a combination of distillation, hydrophobic membranes and hydrophilic
membranes, but without heat integration, has been proposed [252]. A heat-integrated low-
energy membrane/distillation process using both hydrophilic and hydrophobic membranes
has also been proposed [253,254]. However, only polymer membranes have been
considered in these studies. While zeolite membranes have shown better performance than
82
polymer membranes, the high cost and the lack of large-scale production capability are
some of their major challenges [2,253]. However, the continuing commercialization of
hydrophilic zeolite membranes [13] and the improvements in separation performance of
hydrophobic zeolite membranes may overcome these limitations and enable
commercialization of hydrophobic membranes as well. With this motivation, the process
model developed for zeolite membrane separation is further used in designing heat
integrated flowsheets for bioethanol enrichment, considering both hydrophobic and
hydrophilic membranes. Thus, this research provides a comprehensive assessment of
zeolite membrane separation for bioethanol enrichment, from atomistic-level simulation to
process-scale design. Although beyond the scope of this research, the membrane model
developed can be used for other bio refinery applications [255].
4.9 Base-case distillation for ethanol enrichment
The separation process for recovering fuel-grade ethanol from the fermentation broth
has been published by the National Renewable Energy Laboratory (NREL) [256]. The
fermentation broth product, also known as beer, contains 5.5 wt. % ethanol and is enriched
up to near azeotropic composition (93 wt. %) by a sequence of two distillation columns
(beer column and rectification column). This is followed by molecular sieves adsorption
process to achieve fuel-grade ethanol of 99.5 wt. %. The process flow diagram is shown in
Figure 4.7.
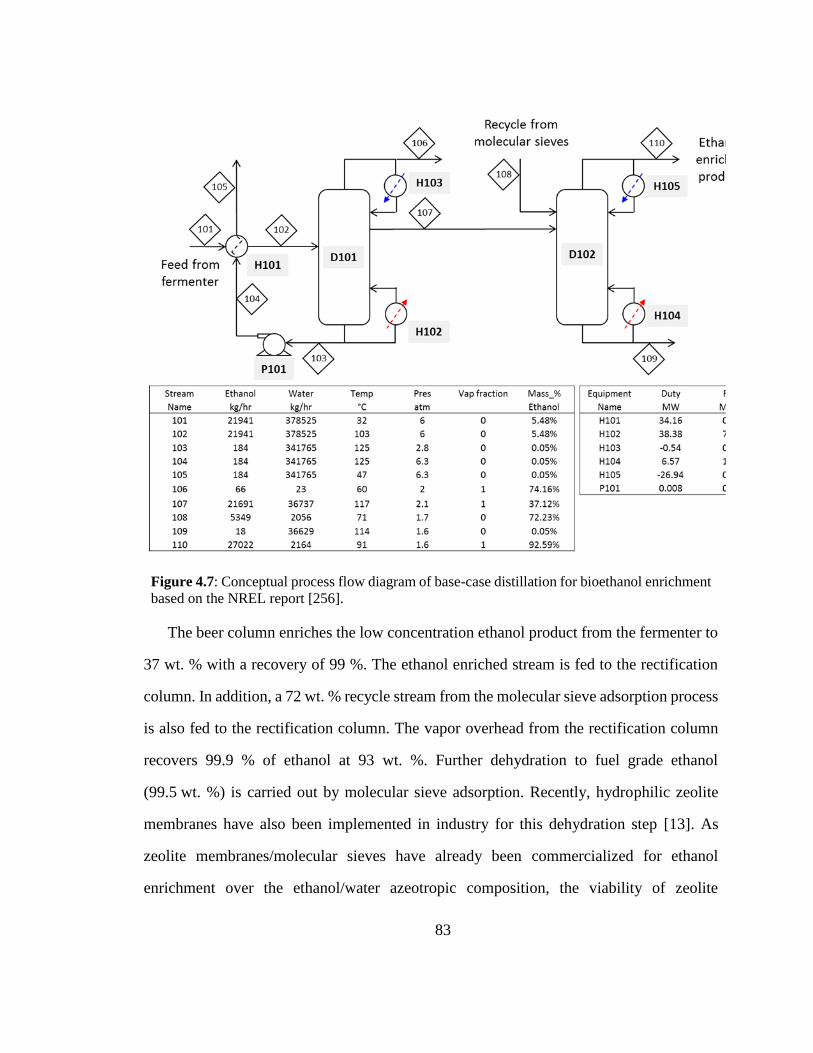
83
Figure 4.7: Conceptual process flow diagram of base-case distillation for bioethanol enrichment
based on the NREL report [256].
The beer column enriches the low concentration ethanol product from the fermenter to
37 wt. % with a recovery of 99 %. The ethanol enriched stream is fed to the rectification
column. In addition, a 72 wt. % recycle stream from the molecular sieve adsorption process
is also fed to the rectification column. The vapor overhead from the rectification column
recovers 99.9 % of ethanol at 93 wt. %. Further dehydration to fuel grade ethanol
(99.5 wt. %) is carried out by molecular sieve adsorption. Recently, hydrophilic zeolite
membranes have also been implemented in industry for this dehydration step [13]. As
zeolite membranes/molecular sieves have already been commercialized for ethanol
enrichment over the ethanol/water azeotropic composition, the viability of zeolite
84
membranes only for separation to achieve the azeotropic composition is examined in this
study. The total heating and cooling duties required for distillation separation are 45 MW
and 27.5 MW, respectively. As heating and cooling duties require different amount of fuel
per unit of energy, the corresponding fuel-equivalent energy is also calculated. The fuel-
equivalent energy for heating duty (steam) is estimated considering a boiler efficiency of
90 % so that 1 MJ of steam energy requires 1.11 MJ fuel-equivalent energy. The minimum
energy cost associated with cooling is estimated using an expression obtained from the
Carnot cycle:
where Eelec is the electric power required for a unit of cooling power (Ecooling) at a
temperature of Tcooling. Furthermore, the fuel-equivalent energy for cooling duty is
estimated considering a compressor efficiency of 90%, ambient temperature of 300 K and
3 MW-fuel equivalents for 1 MW of electrical power. The corresponding fuel-equivalent
energy is determined to be 8.29 MJ-fuel/kg-ethanol. As the process also includes the
additional energy associated with the recycle stream from the molecular sieves, the
corrected energy is calculated to be 7.67 MJ-fuel/kg-ethanol for concentration up to
azeotropic composition. For reference, the heat of combustion of ethanol is 30 MJ/kg [201].
In the next sections, the separation performance of both the hydrophobic and hydrophilic
zeolite membranes is analyzed and evaluated against the distillation process.
4.10 Application of zeolite membranes at low ethanol concentration
As the fermentation product contains ~ 5 wt. % ethanol, only ethanol-selective
hydrophobic MFI membranes are examined.
The membrane process can be operated either in an end-of-pipe mode or a slip-stream
mode. In the end-of-pipe process, the alcohol is recovered after the fermentation has
cooling
coolingambient
T
TTEE
coolingelec (4.4)
85
reached completion while in a slip-stream process, alcohol recovery and fermentation are
carried out simultaneously. Although the slip-stream process reduces product inhibition
and improves fermenter productivity, additional preconditioning such as degassing,
heating and solids removal is necessary before ethanol recovery. Furthermore, the effect of
broth components on the membrane fouling and on the thermodynamics and transport of
water-ethanol mixture through the membrane should be included. Other considerations in
integrating the pervaporation with the fermentation system have been reviewed by Vane et
al. [203]. Fermenter modeling and its response to continuous removal of ethanol is beyond
the scope of this study and, thus, zeolite membrane separation with only end-of-pipe
recovery mode is considered.
Another design parameter is the feed temperature. Fermentation is usually carried out
below 30 °C as higher temperatures can be lethal to the micro-organism [201].
Temperatures larger than 60 °C also cause enzyme deactivation. Recovery at near
fermenter temperature allows recycling of micro-organism and enzymes, thus increasing
fermenter productivity. It also eliminates the need for heating and the associated heat
transfer equipment. However, for pervaporation, the driving force due to the saturated
vapor pressure on the feed side increases with temperature leading to higher flux at elevated
temperatures, but with a decrease in selectivity. For instance, for a 5 wt. % mixture, ethanol
partial vapor pressure is 0.9 kPa at 30 °C, 2.7 kPa at 50 °C and 10.4 kPa at 80 °C, as
determined using the non-random two-liquid (NRTL) vapor-liquid equilibrium. As ethanol
partial pressure on the permeate side should be lower than that on the feed side, the
permeate should be immediately condensed so that the total pressure on the permeate side
is equal to the corresponding vapor pressure of the condensed permeate. Thus, another
advantage associated with high-temperature pervaporation is that the permeate can be
maintained at near room temperature without the need of expensive cooling, e.g.,
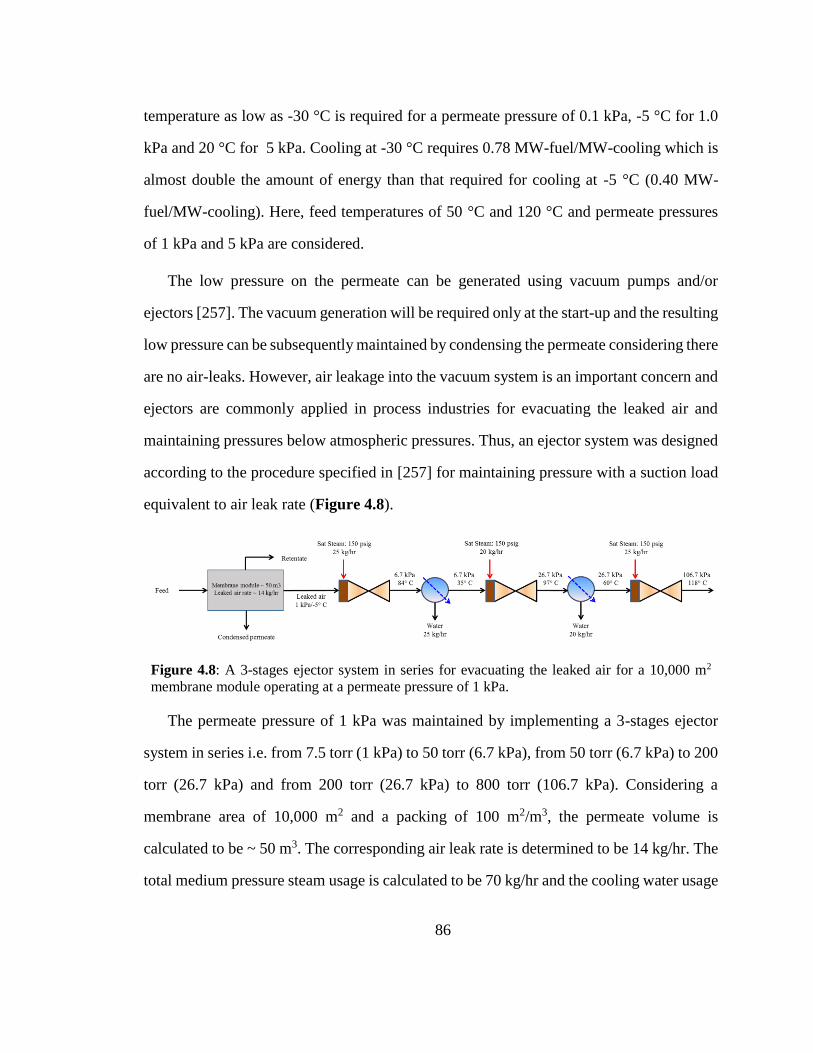
86
temperature as low as -30 °C is required for a permeate pressure of 0.1 kPa, -5 °C for 1.0
kPa and 20 °C for 5 kPa. Cooling at -30 °C requires 0.78 MW-fuel/MW-cooling which is
almost double the amount of energy than that required for cooling at -5 °C (0.40 MW-
fuel/MW-cooling). Here, feed temperatures of 50 °C and 120 °C and permeate pressures
of 1 kPa and 5 kPa are considered.
The low pressure on the permeate can be generated using vacuum pumps and/or
ejectors [257]. The vacuum generation will be required only at the start-up and the resulting
low pressure can be subsequently maintained by condensing the permeate considering there
are no air-leaks. However, air leakage into the vacuum system is an important concern and
ejectors are commonly applied in process industries for evacuating the leaked air and
maintaining pressures below atmospheric pressures. Thus, an ejector system was designed
according to the procedure specified in [257] for maintaining pressure with a suction load
equivalent to air leak rate (Figure 4.8).
Figure 4.8: A 3-stages ejector system in series for evacuating the leaked air for a 10,000 m2
membrane module operating at a permeate pressure of 1 kPa.
The permeate pressure of 1 kPa was maintained by implementing a 3-stages ejector
system in series i.e. from 7.5 torr (1 kPa) to 50 torr (6.7 kPa), from 50 torr (6.7 kPa) to 200
torr (26.7 kPa) and from 200 torr (26.7 kPa) to 800 torr (106.7 kPa). Considering a
membrane area of 10,000 m2 and a packing of 100 m2/m3, the permeate volume is
calculated to be ~ 50 m3. The corresponding air leak rate is determined to be 14 kg/hr. The
total medium pressure steam usage is calculated to be 70 kg/hr and the cooling water usage
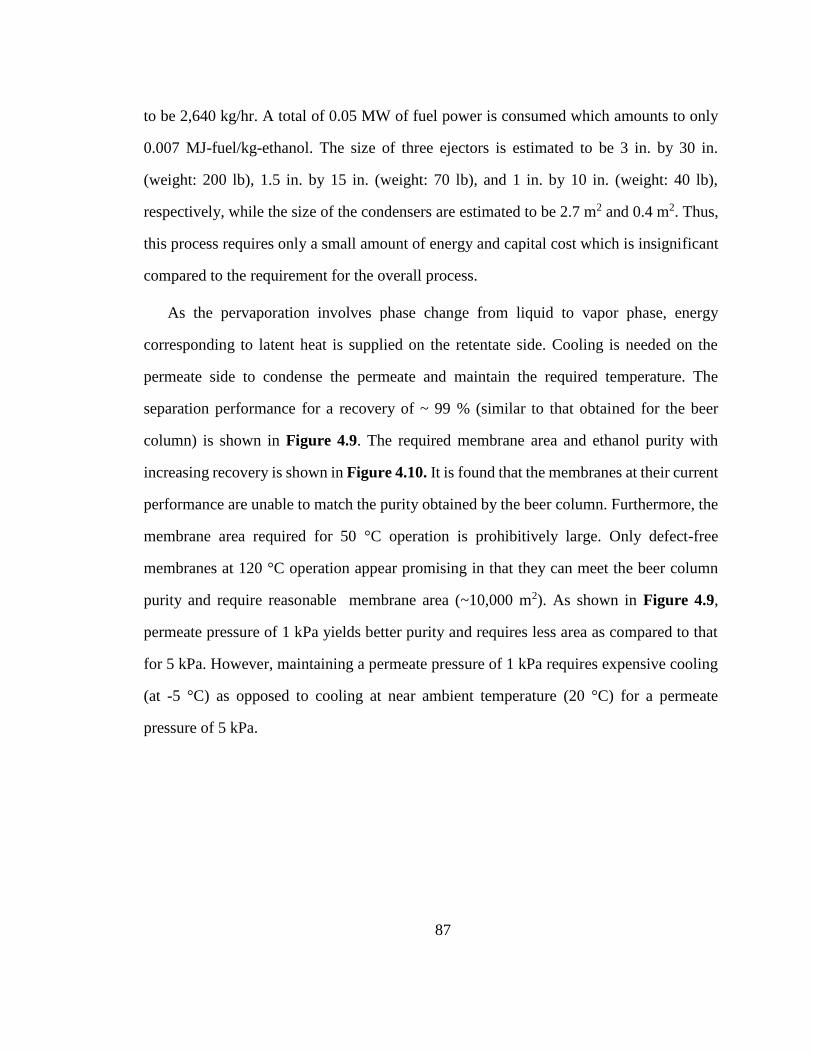
87
to be 2,640 kg/hr. A total of 0.05 MW of fuel power is consumed which amounts to only
0.007 MJ-fuel/kg-ethanol. The size of three ejectors is estimated to be 3 in. by 30 in.
(weight: 200 lb), 1.5 in. by 15 in. (weight: 70 lb), and 1 in. by 10 in. (weight: 40 lb),
respectively, while the size of the condensers are estimated to be 2.7 m2 and 0.4 m2. Thus,
this process requires only a small amount of energy and capital cost which is insignificant
compared to the requirement for the overall process. [31-37]
As the pervaporation involves phase change from liquid to vapor phase, energy
corresponding to latent heat is supplied on the retentate side. Cooling is needed on the
permeate side to condense the permeate and maintain the required temperature. The
separation performance for a recovery of ~ 99 % (similar to that obtained for the beer
column) is shown in Figure 4.9. The required membrane area and ethanol purity with
increasing recovery is shown in Figure 4.10. It is found that the membranes at their current
performance are unable to match the purity obtained by the beer column. Furthermore, the
membrane area required for 50 °C operation is prohibitively large. Only defect-free
membranes at 120 °C operation appear promising in that they can meet the beer column
purity and require reasonable membrane area (~10,000 m2). As shown in Figure 4.9,
permeate pressure of 1 kPa yields better purity and requires less area as compared to that
for 5 kPa. However, maintaining a permeate pressure of 1 kPa requires expensive cooling
(at -5 °C) as opposed to cooling at near ambient temperature (20 °C) for a permeate
pressure of 5 kPa.
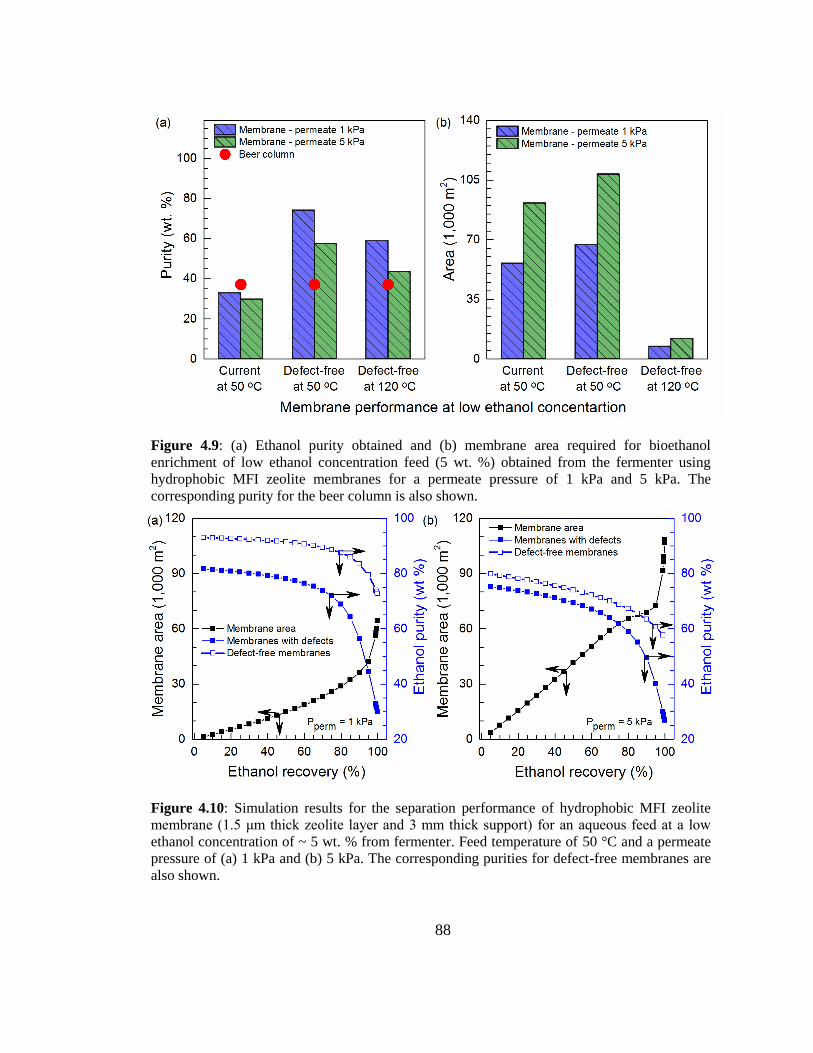
88
Figure 4.9: (a) Ethanol purity obtained and (b) membrane area required for bioethanol
enrichment of low ethanol concentration feed (5 wt. %) obtained from the fermenter using
hydrophobic MFI zeolite membranes for a permeate pressure of 1 kPa and 5 kPa. The
corresponding purity for the beer column is also shown.
Figure 4.10: Simulation results for the separation performance of hydrophobic MFI zeolite
membrane (1.5 μm thick zeolite layer and 3 mm thick support) for an aqueous feed at a low
ethanol concentration of ~ 5 wt. % from fermenter. Feed temperature of 50 °C and a permeate
pressure of (a) 1 kPa and (b) 5 kPa. The corresponding purities for defect-free membranes are
also shown.
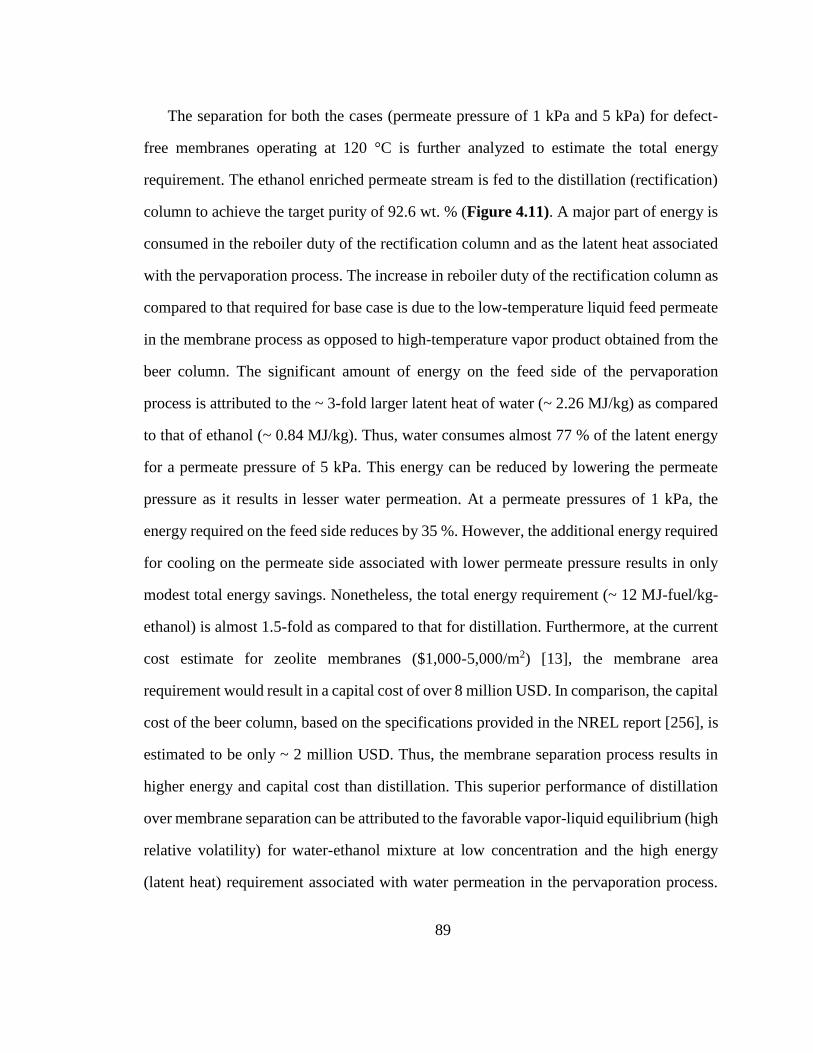
89
The separation for both the cases (permeate pressure of 1 kPa and 5 kPa) for defect-
free membranes operating at 120 °C is further analyzed to estimate the total energy
requirement. The ethanol enriched permeate stream is fed to the distillation (rectification)
column to achieve the target purity of 92.6 wt. % (Figure 4.11). A major part of energy is
consumed in the reboiler duty of the rectification column and as the latent heat associated
with the pervaporation process. The increase in reboiler duty of the rectification column as
compared to that required for base case is due to the low-temperature liquid feed permeate
in the membrane process as opposed to high-temperature vapor product obtained from the
beer column. The significant amount of energy on the feed side of the pervaporation
process is attributed to the ~ 3-fold larger latent heat of water (~ 2.26 MJ/kg) as compared
to that of ethanol (~ 0.84 MJ/kg). Thus, water consumes almost 77 % of the latent energy
for a permeate pressure of 5 kPa. This energy can be reduced by lowering the permeate
pressure as it results in lesser water permeation. At a permeate pressures of 1 kPa, the
energy required on the feed side reduces by 35 %. However, the additional energy required
for cooling on the permeate side associated with lower permeate pressure results in only
modest total energy savings. Nonetheless, the total energy requirement (~ 12 MJ-fuel/kg-
ethanol) is almost 1.5-fold as compared to that for distillation. Furthermore, at the current
cost estimate for zeolite membranes ($1,000-5,000/m2) [13], the membrane area
requirement would result in a capital cost of over 8 million USD. In comparison, the capital
cost of the beer column, based on the specifications provided in the NREL report [256], is
estimated to be only ~ 2 million USD. Thus, the membrane separation process results in
higher energy and capital cost than distillation. This superior performance of distillation
over membrane separation can be attributed to the favorable vapor-liquid equilibrium (high
relative volatility) for water-ethanol mixture at low concentration and the high energy
(latent heat) requirement associated with water permeation in the pervaporation process.
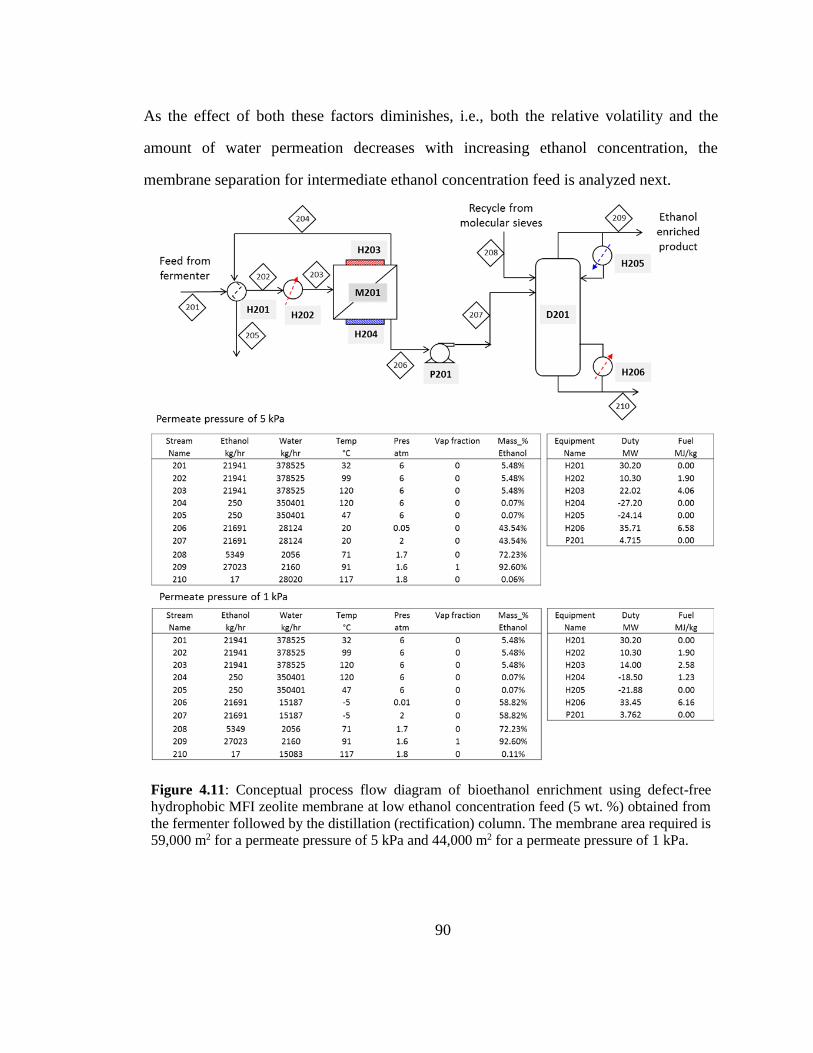
90
As the effect of both these factors diminishes, i.e., both the relative volatility and the
amount of water permeation decreases with increasing ethanol concentration, the
membrane separation for intermediate ethanol concentration feed is analyzed next.
Figure 4.11: Conceptual process flow diagram of bioethanol enrichment using defect-free
hydrophobic MFI zeolite membrane at low ethanol concentration feed (5 wt. %) obtained from
the fermenter followed by the distillation (rectification) column. The membrane area required is
59,000 m2 for a permeate pressure of 5 kPa and 44,000 m2 for a permeate pressure of 1 kPa.
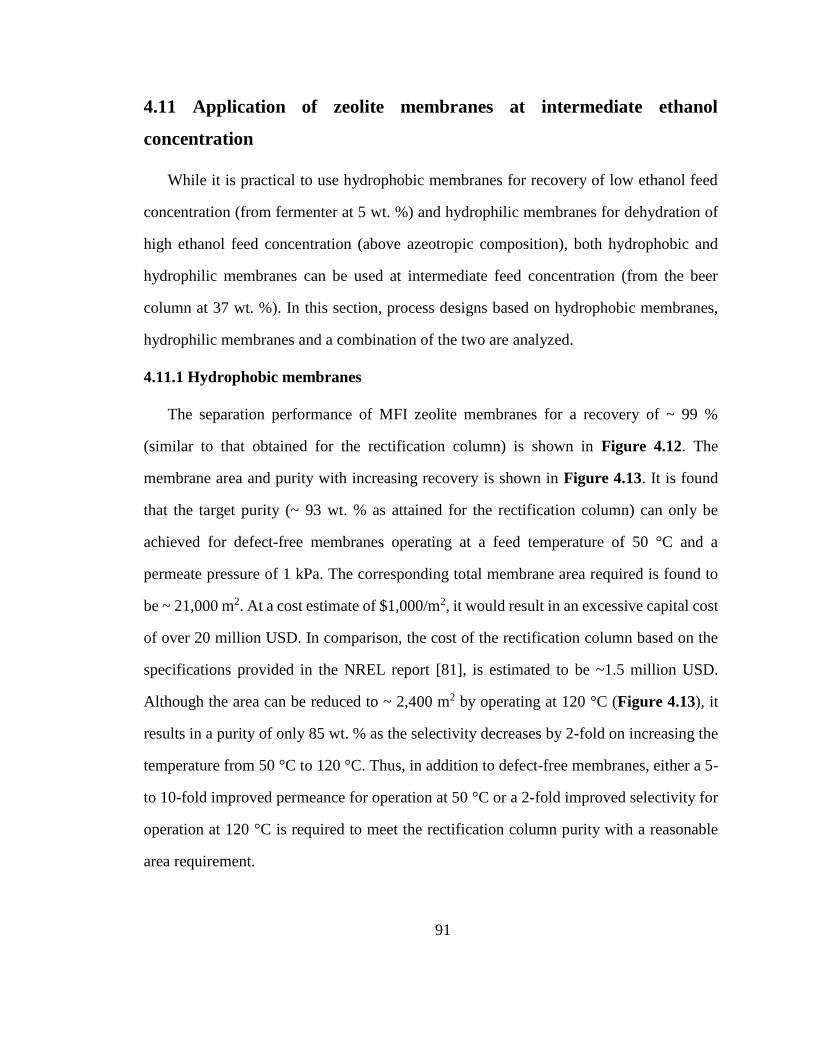
91
4.11 Application of zeolite membranes at intermediate ethanol
concentration
While it is practical to use hydrophobic membranes for recovery of low ethanol feed
concentration (from fermenter at 5 wt. %) and hydrophilic membranes for dehydration of
high ethanol feed concentration (above azeotropic composition), both hydrophobic and
hydrophilic membranes can be used at intermediate feed concentration (from the beer
column at 37 wt. %). In this section, process designs based on hydrophobic membranes,
hydrophilic membranes and a combination of the two are analyzed.
4.11.1 Hydrophobic membranes
The separation performance of MFI zeolite membranes for a recovery of ~ 99 %
(similar to that obtained for the rectification column) is shown in Figure 4.12. The
membrane area and purity with increasing recovery is shown in Figure 4.13. It is found
that the target purity (~ 93 wt. % as attained for the rectification column) can only be
achieved for defect-free membranes operating at a feed temperature of 50 °C and a
permeate pressure of 1 kPa. The corresponding total membrane area required is found to
be ~ 21,000 m2. At a cost estimate of $1,000/m2, it would result in an excessive capital cost
of over 20 million USD. In comparison, the cost of the rectification column based on the
specifications provided in the NREL report [81], is estimated to be ~1.5 million USD.
Although the area can be reduced to ~ 2,400 m2 by operating at 120 °C (Figure 4.13), it
results in a purity of only 85 wt. % as the selectivity decreases by 2-fold on increasing the
temperature from 50 °C to 120 °C. Thus, in addition to defect-free membranes, either a 5-
to 10-fold improved permeance for operation at 50 °C or a 2-fold improved selectivity for
operation at 120 °C is required to meet the rectification column purity with a reasonable
area requirement.
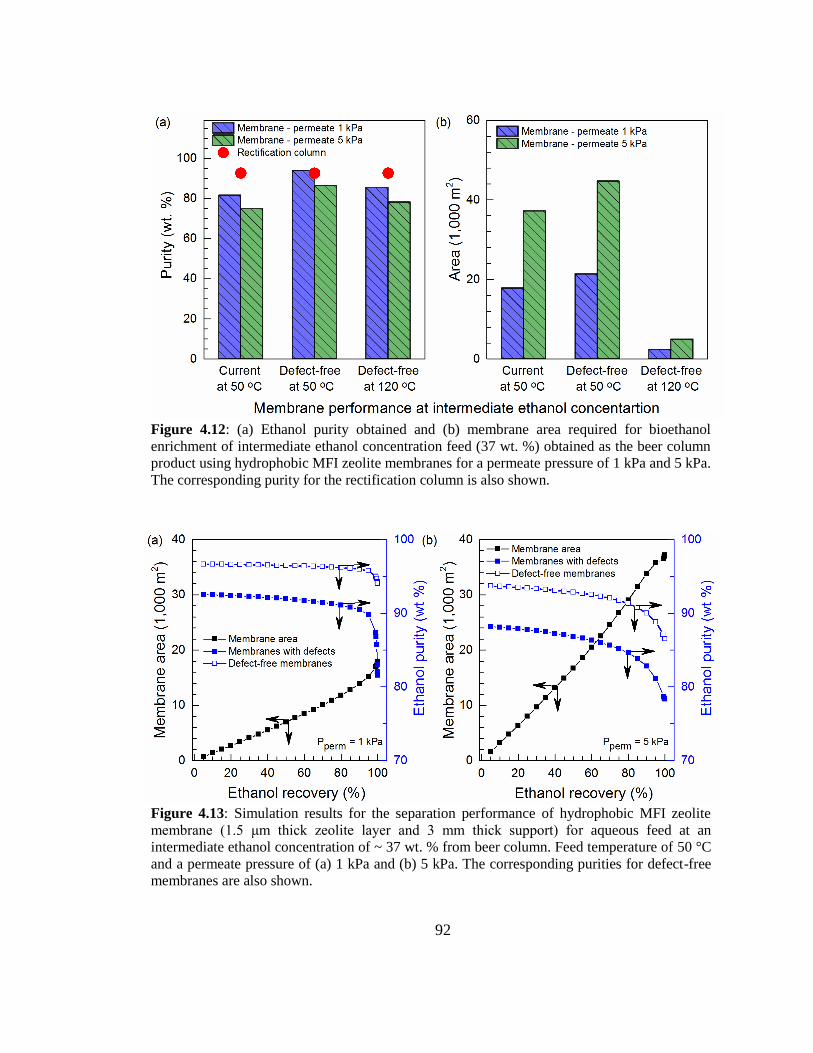
92
Figure 4.12: (a) Ethanol purity obtained and (b) membrane area required for bioethanol
enrichment of intermediate ethanol concentration feed (37 wt. %) obtained as the beer column
product using hydrophobic MFI zeolite membranes for a permeate pressure of 1 kPa and 5 kPa.
The corresponding purity for the rectification column is also shown.
Figure 4.13: Simulation results for the separation performance of hydrophobic MFI zeolite
membrane (1.5 μm thick zeolite layer and 3 mm thick support) for aqueous feed at an
intermediate ethanol concentration of ~ 37 wt. % from beer column. Feed temperature of 50 °C
and a permeate pressure of (a) 1 kPa and (b) 5 kPa. The corresponding purities for defect-free
membranes are also shown.
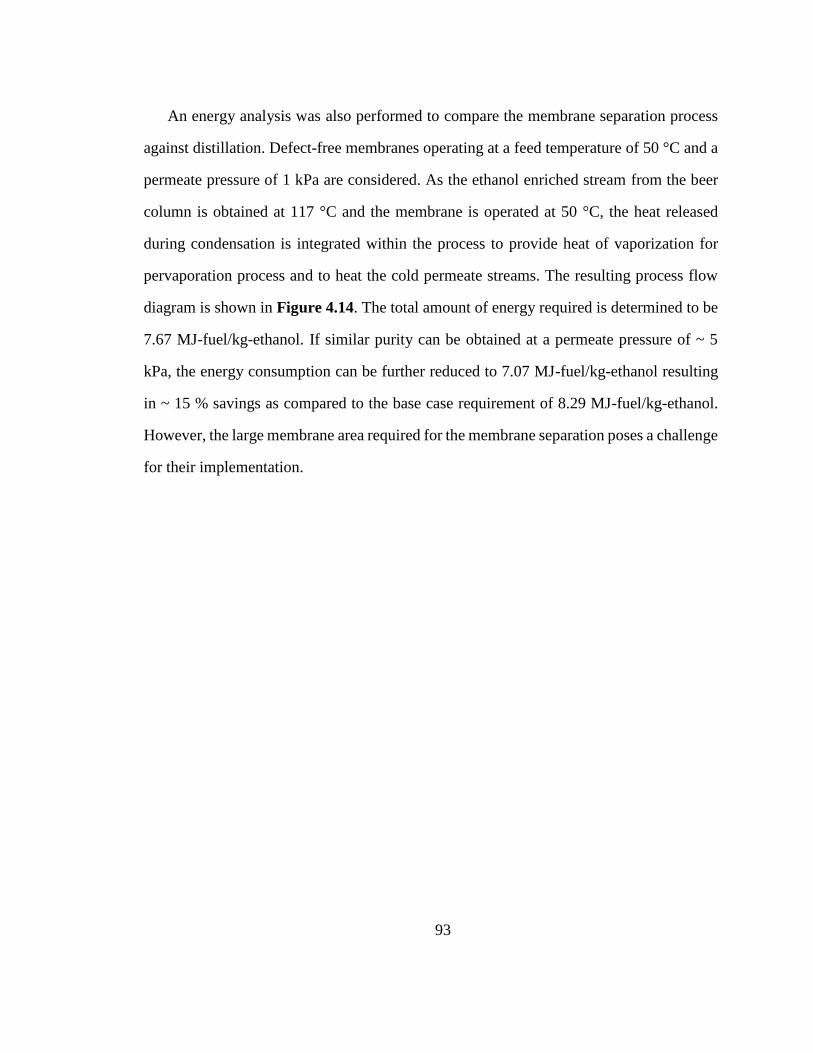
93
An energy analysis was also performed to compare the membrane separation process
against distillation. Defect-free membranes operating at a feed temperature of 50 °C and a
permeate pressure of 1 kPa are considered. As the ethanol enriched stream from the beer
column is obtained at 117 °C and the membrane is operated at 50 °C, the heat released
during condensation is integrated within the process to provide heat of vaporization for
pervaporation process and to heat the cold permeate streams. The resulting process flow
diagram is shown in Figure 4.14. The total amount of energy required is determined to be
7.67 MJ-fuel/kg-ethanol. If similar purity can be obtained at a permeate pressure of ~ 5
kPa, the energy consumption can be further reduced to 7.07 MJ-fuel/kg-ethanol resulting
in ~ 15 % savings as compared to the base case requirement of 8.29 MJ-fuel/kg-ethanol.
However, the large membrane area required for the membrane separation poses a challenge
for their implementation.
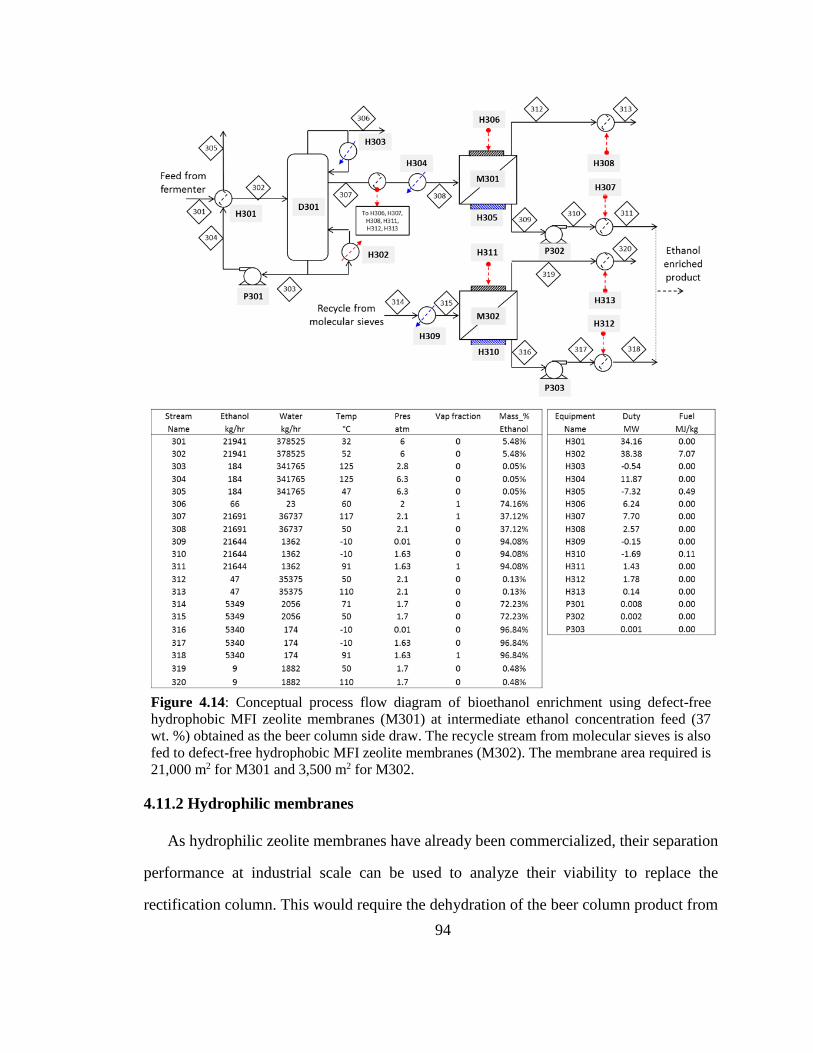
94
4.11.2 Hydrophilic membranes
As hydrophilic zeolite membranes have already been commercialized, their separation
performance at industrial scale can be used to analyze their viability to replace the
rectification column. This would require the dehydration of the beer column product from
Figure 4.14: Conceptual process flow diagram of bioethanol enrichment using defect-free
hydrophobic MFI zeolite membranes (M301) at intermediate ethanol concentration feed (37
wt. %) obtained as the beer column side draw. The recycle stream from molecular sieves is also
fed to defect-free hydrophobic MFI zeolite membranes (M302). The membrane area required is
21,000 m2 for M301 and 3,500 m2 for M302.
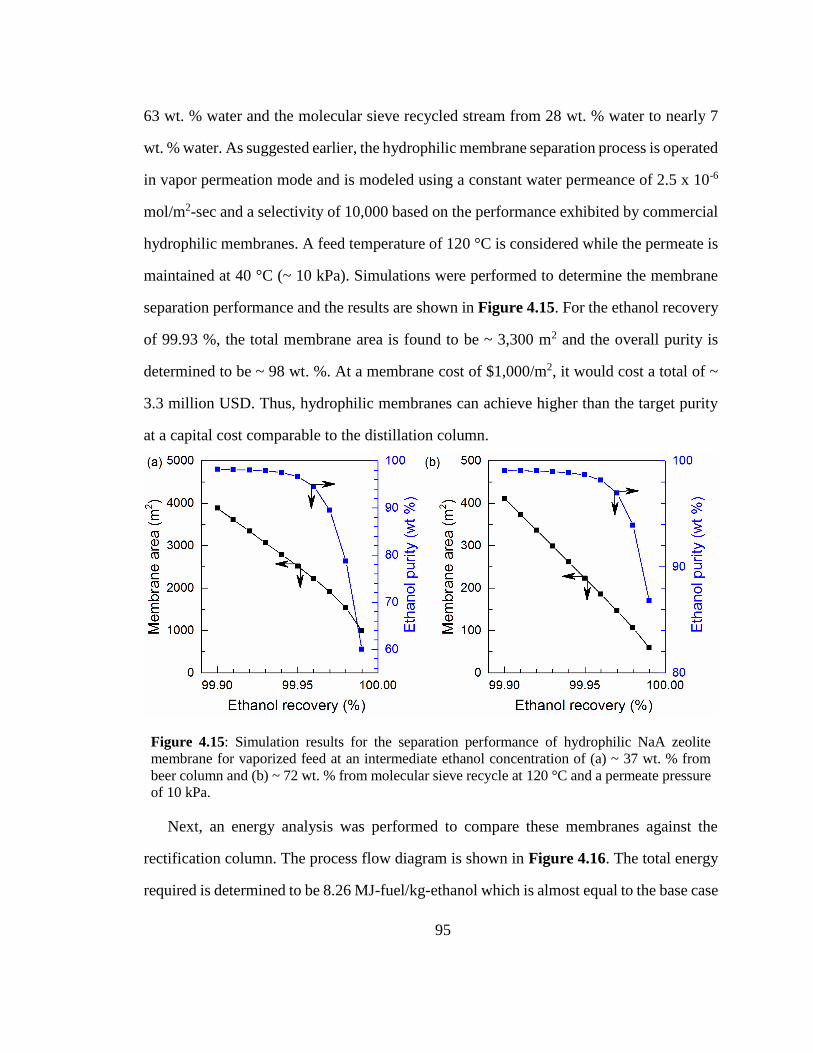
95
63 wt. % water and the molecular sieve recycled stream from 28 wt. % water to nearly 7
wt. % water. As suggested earlier, the hydrophilic membrane separation process is operated
in vapor permeation mode and is modeled using a constant water permeance of 2.5 x 10⁻⁶
mol/m2-sec and a selectivity of 10,000 based on the performance exhibited by commercial
hydrophilic membranes. A feed temperature of 120 °C is considered while the permeate is
maintained at 40 °C (~ 10 kPa). Simulations were performed to determine the membrane
separation performance and the results are shown in Figure 4.15. For the ethanol recovery
of 99.93 %, the total membrane area is found to be ~ 3,300 m2 and the overall purity is
determined to be ~ 98 wt. %. At a membrane cost of $1,000/m2, it would cost a total of ~
3.3 million USD. Thus, hydrophilic membranes can achieve higher than the target purity
at a capital cost comparable to the distillation column.
Figure 4.15: Simulation results for the separation performance of hydrophilic NaA zeolite
membrane for vaporized feed at an intermediate ethanol concentration of (a) ~ 37 wt. % from
beer column and (b) ~ 72 wt. % from molecular sieve recycle at 120 °C and a permeate pressure
of 10 kPa.
Next, an energy analysis was performed to compare these membranes against the
rectification column. The process flow diagram is shown in Figure 4.16. The total energy
required is determined to be 8.26 MJ-fuel/kg-ethanol which is almost equal to the base case
96
distillation process. The higher energy requirement for hydrophilic membrane separation
is due to ~ 3-fold higher energy (latent heat of water ~ 2.26 MJ/kg) consumed during water
permeation than required for ethanol permeation (latent heat of water ~ 0.84 MJ/kg) for
hydrophobic membranes. Considering that almost pure components are obtained in
permeate, hydrophilic membranes would be effective for ethanol feed concentration only
above 72 wt. %. Alternatively, it can be argued that as the molar latent heat of vaporization
for water and ethanol is almost equal (~ 40 MJ/mol), hydrophilic membranes should be
more practical for a solution with > 50 mol % (~ 72 wt. %) of ethanol. As the feed (from
the beer column) is only 37 wt. % (~ 20 mol %), separation using hydrophilic membranes
leads to higher energy consumption than hydrophobic membranes and no energy savings
can be realized by replacing the rectification column with hydrophilic membranes.
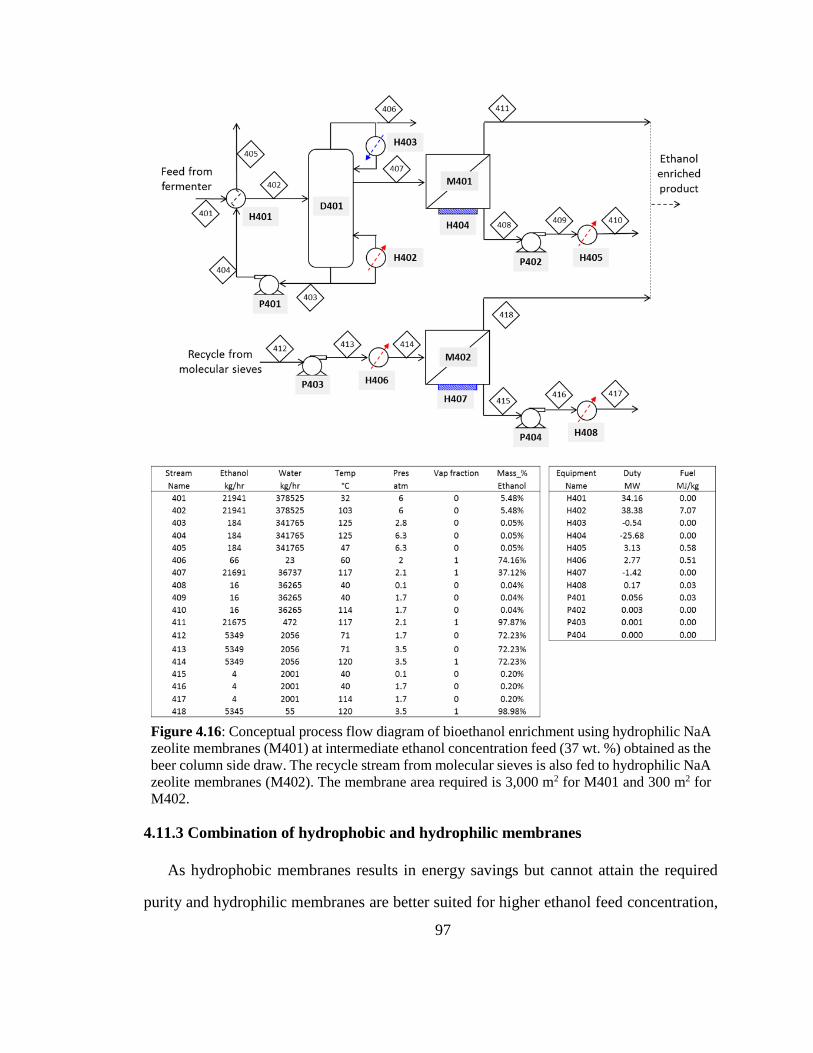
97
4.11.3 Combination of hydrophobic and hydrophilic membranes
As hydrophobic membranes results in energy savings but cannot attain the required
purity and hydrophilic membranes are better suited for higher ethanol feed concentration,
Figure 4.16: Conceptual process flow diagram of bioethanol enrichment using hydrophilic NaA
zeolite membranes (M401) at intermediate ethanol concentration feed (37 wt. %) obtained as the
beer column side draw. The recycle stream from molecular sieves is also fed to hydrophilic NaA
zeolite membranes (M402). The membrane area required is 3,000 m2 for M401 and 300 m2 for
M402.
98
thus, hydrophobic membrane separation followed by hydrophilic membrane separation is
also considered. The corresponding process flow diagram is shown in Figure 4.17. As the
hydrophobic membrane separation is carried out as pervaporation, the saturated vapor
product from the beer column (at 117 °C) is condensed and the membrane separation is
carried out at 100 °C. The heat released during condensation is used to provide heat of
vaporization for pervaporation process and to heat the cold permeate streams. The permeate
stream from the hydrophobic pervaporation separation is further enriched by hydrophilic
membrane separation. As hydrophilic membranes show better performance during vapor
permeation separation, the permeate from the hydrophobic membrane separation and the
recycle stream from molecular sieves were mixed together and vaporized to 100 °C before
feeding to the hydrophilic membrane unit. Ethanol recoveries of 99.95 % and 99.98 % were
set for hydrophobic and hydrophilic membrane separation, respectively, to achieve a total
recovery of 99.93 %.
A final purity of 93.2 wt. % is achieved for the combined process with the total
membrane area requirement of ~ 9,000 m2 (hydrophobic membrane area of ~ 8,000 m2 and
hydrophilic membrane area of ~ 1,000 m2). The total amount of energy required is
calculated to be 7.07 MJ-fuel/kg-ethanol. This results in a total energy savings of ~ 15 %
as compared to the base case requirement of 8.29 MJ-fuel/kg-ethanol. In what follows, a
techno-economic analysis is carried out to determine the target cost of zeolite membranes
for their economic viability.
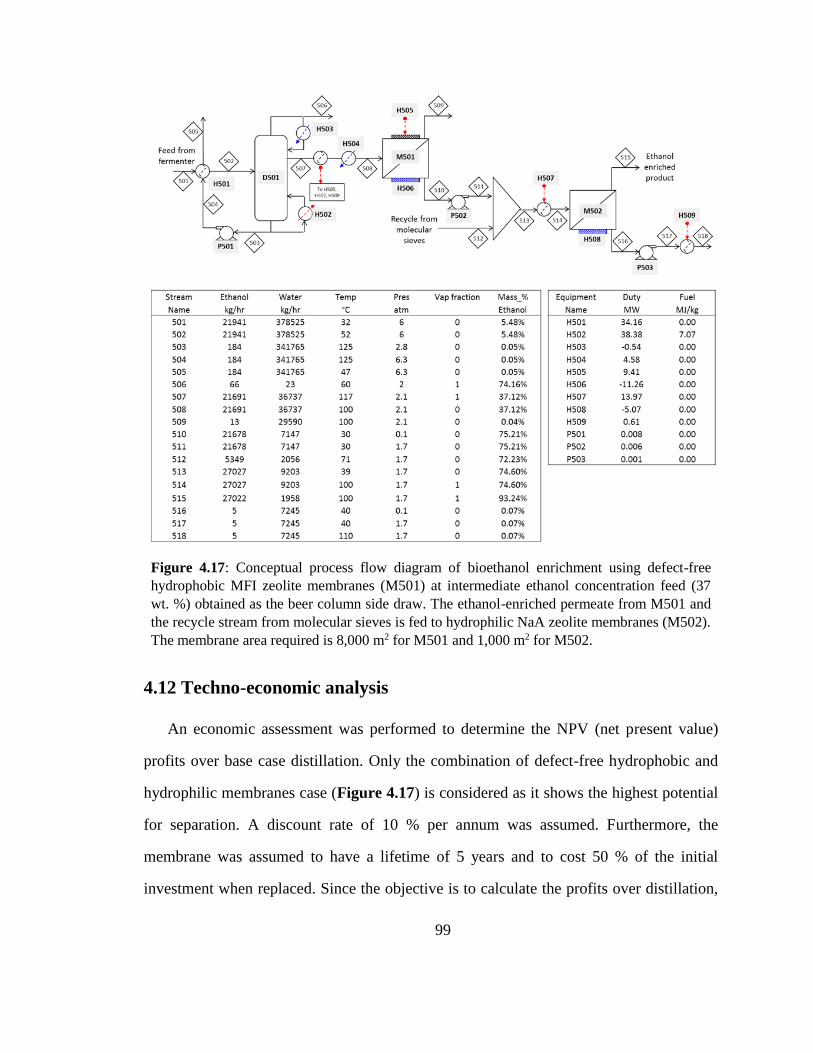
99
Figure 4.17: Conceptual process flow diagram of bioethanol enrichment using defect-free
hydrophobic MFI zeolite membranes (M501) at intermediate ethanol concentration feed (37
wt. %) obtained as the beer column side draw. The ethanol-enriched permeate from M501 and
the recycle stream from molecular sieves is fed to hydrophilic NaA zeolite membranes (M502).
The membrane area required is 8,000 m2 for M501 and 1,000 m2 for M502.
4.12 Techno-economic analysis
An economic assessment was performed to determine the NPV (net present value)
profits over base case distillation. Only the combination of defect-free hydrophobic and
hydrophilic membranes case (Figure 4.17) is considered as it shows the highest potential
for separation. A discount rate of 10 % per annum was assumed. Furthermore, the
membrane was assumed to have a lifetime of 5 years and to cost 50 % of the initial
investment when replaced. Since the objective is to calculate the profits over distillation,
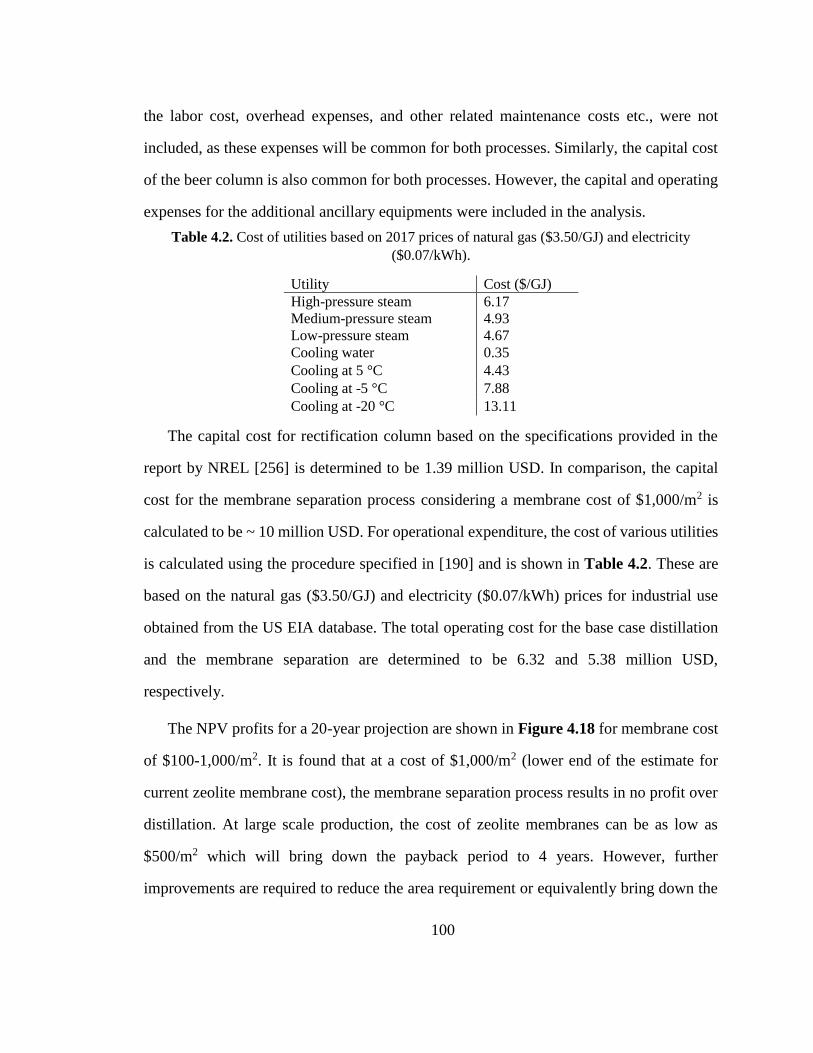
100
the labor cost, overhead expenses, and other related maintenance costs etc., were not
included, as these expenses will be common for both processes. Similarly, the capital cost
of the beer column is also common for both processes. However, the capital and operating
expenses for the additional ancillary equipments were included in the analysis.
Table 4.2. Cost of utilities based on 2017 prices of natural gas ($3.50/GJ) and electricity
($0.07/kWh).
Utility Cost ($/GJ)
High-pressure steam 6.17
Medium-pressure steam 4.93
Low-pressure steam 4.67
Cooling water 0.35
Cooling at 5 °C 4.43
Cooling at -5 °C 7.88
Cooling at -20 °C 13.11
The capital cost for rectification column based on the specifications provided in the
report by NREL [256] is determined to be 1.39 million USD. In comparison, the capital
cost for the membrane separation process considering a membrane cost of $1,000/m2 is
calculated to be ~ 10 million USD. For operational expenditure, the cost of various utilities
is calculated using the procedure specified in [190] and is shown in Table 4.2. These are
based on the natural gas ($3.50/GJ) and electricity ($0.07/kWh) prices for industrial use
obtained from the US EIA database. The total operating cost for the base case distillation
and the membrane separation are determined to be 6.32 and 5.38 million USD,
respectively.
The NPV profits for a 20-year projection are shown in Figure 4.18 for membrane cost
of $100-1,000/m2. It is found that at a cost of $1,000/m2 (lower end of the estimate for
current zeolite membrane cost), the membrane separation process results in no profit over
distillation. At large scale production, the cost of zeolite membranes can be as low as
$500/m2 which will bring down the payback period to 4 years. However, further
improvements are required to reduce the area requirement or equivalently bring down the
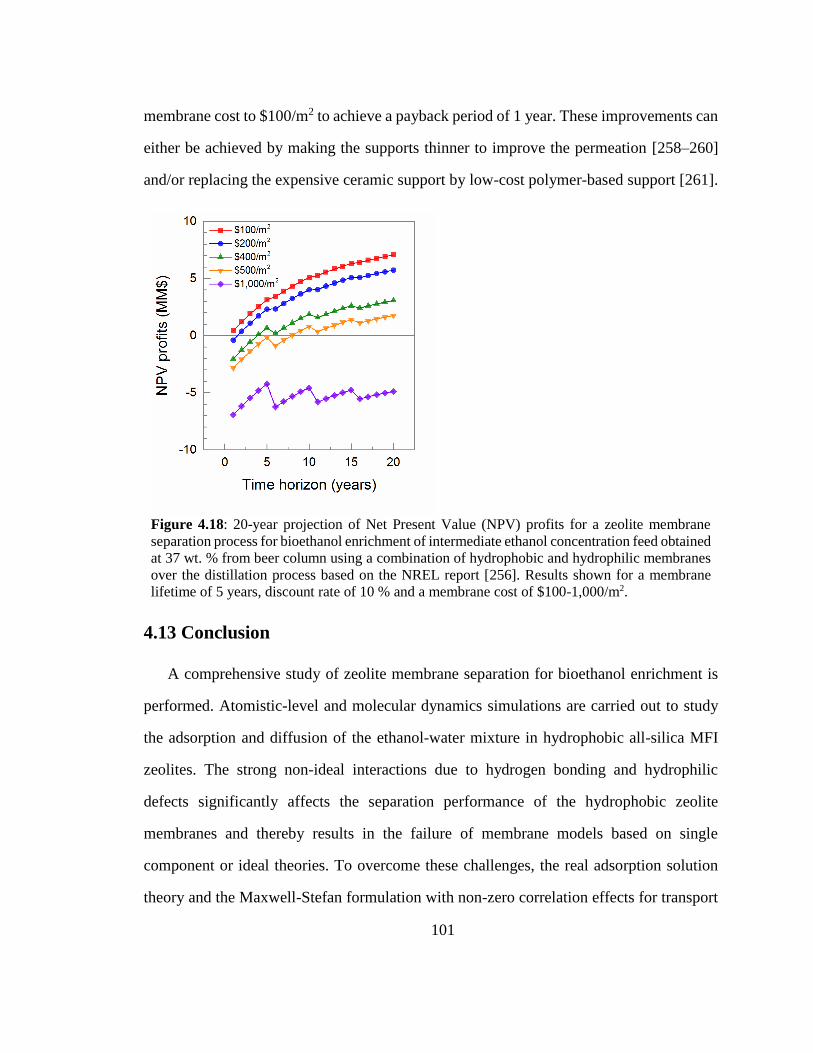
101
membrane cost to $100/m2 to achieve a payback period of 1 year. These improvements can
either be achieved by making the supports thinner to improve the permeation [258–260]
and/or replacing the expensive ceramic support by low-cost polymer-based support [261].
Figure 4.18: 20-year projection of Net Present Value (NPV) profits for a zeolite membrane
separation process for bioethanol enrichment of intermediate ethanol concentration feed obtained
at 37 wt. % from beer column using a combination of hydrophobic and hydrophilic membranes
over the distillation process based on the NREL report [256]. Results shown for a membrane
lifetime of 5 years, discount rate of 10 % and a membrane cost of $100-1,000/m2.
4.13 Conclusion
A comprehensive study of zeolite membrane separation for bioethanol enrichment is
performed. Atomistic-level and molecular dynamics simulations are carried out to study
the adsorption and diffusion of the ethanol-water mixture in hydrophobic all-silica MFI
zeolites. The strong non-ideal interactions due to hydrogen bonding and hydrophilic
defects significantly affects the separation performance of the hydrophobic zeolite
membranes and thereby results in the failure of membrane models based on single
component or ideal theories. To overcome these challenges, the real adsorption solution
theory and the Maxwell-Stefan formulation with non-zero correlation effects for transport
102
were used to describe the permeation through zeolite membranes. The higher steady state
permeance values predicted by the model than those determined in experiments suggest
the presence of structural non-idealities, compressive stresses, and surface barriers in the
real membranes and results in reduced permeation rates. Furthermore, real membranes
show lower selectivity which is attributed to the presence of hydrophilic silanol defects.
Hence, the diffusion coefficients in the model were reduced by a factor of 120 and the
hydrophilic defects were accounted by enhanced water adsorption to obtain an
experimentally validated model. For hydrophilic NaA zeolite membranes, the separation
performance at industrial scale was used to determine the permeance and the selectivity.
Conceptual process design studies were also performed to study the energetic and
economic viability of zeolite membranes over distillation separation. It is found that defect-
free membranes are required to achieve similar performance as distillation. At low ethanol
concentration, both the high relative volatility of ethanol over water and the significant
energy requirement associated with latent heat for the pervaporation process favor
distillation over membrane separation. At intermediate ethanol concentration, it is found
that hydrophobic zeolite membranes have potential for energy savings but a 2-fold
improvement in selectivity is required to meet distillation purity. Hydrophilic zeolite
membranes can achieve higher purity than distillation but consume almost similar energy
as that required for distillation. Thus, a combination of hydrophobic and hydrophilic
membrane separation is considered which can achieve the required purity with 15 % energy
savings over distillation. The techno-economic analysis suggests that ~ 10-fold
improvements in permeation or equivalent cost reductions are required for economic
viability of this scheme.
103
Chapter 5: Debottlenecking heat-integrated
propylene-propane distillation separation using
membranes
5.1 Introduction
Olefins, such as ethylene and propylene, are one of the largest feedstocks of chemical
industry, and precursors to several important polymers and organic chemicals including
polyethylene, polypropylene, ethylene oxide, isopropyl alcohol, etc. This is also
recognized from their (ethylene and propylene) combined global annual production
capacity which exceeds 200 million tonnes, and is expected to increase at a growth rate of
~4% [262,263]. Most of these olefins are obtained by cracking from light hydrocarbons
including ethane and propane [264]. As a part of their production process, olefin/paraffin
separation is required and is traditionally accomplished using distillation. Due to similar
boiling points (or low relative volatility), distillation results in a capital and energy
intensive separation. The separation is performed under high pressure (> 10 bar) and
requires cryogenic conditions (-30 °C) for ethane/ethylene separation (C2 splitter) [265],
and over 200 trays for propylene/propane separation (C3 splitter) [266].
Membrane separation is one of the several alternate processes [267–271] proposed for
this separation. As replacement of distillation column is not feasible at the current
membrane separation performance, hybrid membrane-distillation has been proposed for
near-future application, and has been extensively studied for olefin/paraffin separation in
the literature [262,272]. A selectivity of ~20 is considered effective for both
ethane/ethylene [265,273] and propylene/propane separation [274–277], and has been
shown to achieve 20-30% energy or total cost savings. It is also expected that the
104
improvement in separation performance of membranes over time can eventually lead to the
replacement of C2 and C3 splitter [262,272].
In all of above mentioned hybrid membrane-distillation studies, a conventional
distillation column is selected as the base case. On the other hand, heat-integrated columns
have also been evaluated for energy savings in separation using distillation [8,278,279].
Both external and internal heat integrated columns have been considered. In external heat
integration, the vapor from the top tray is compressed to an extent such that the increase in
temperature allows heat-exchange with the condenser before entering as a reflux stream.
In internal heat integrated columns, similar heat exchange can also take place between the
trays in stripping and rectification section of the column. It has been shown that an external
heat integrated consumes ~6-fold lesser energy when compared to conventional column
for propylene/propane separation [8,278]. Further, an internal heat integrated column only
achieves marginal or no energy savings over an external heat integrated column for
propylene/propane separation. Nonetheless, the heat integration offers potential savings
[279].
Although membranes have shown potential in hybrid configuration with conventional
distillation column, no studies exist to evaluate their performance compared to heat-
integrated distillation column. In this research, the scope of membranes for
propylene/propane separation is evaluated, and compared to both the conventional and
heat-integrated columns. Further, their application for propylene recovery from reactor
purge stream in the synthesis of products, such as polymers, cumene, isopropyl alcohol etc.
is also considered [272,280]. These purge streams are usually lost or flared which is
inefficient from both the energy and the environmental considerations. Although these
streams are small for distillation to be economical, implementation of membrane separation
proposes savings over a few million USD annually [272,280].
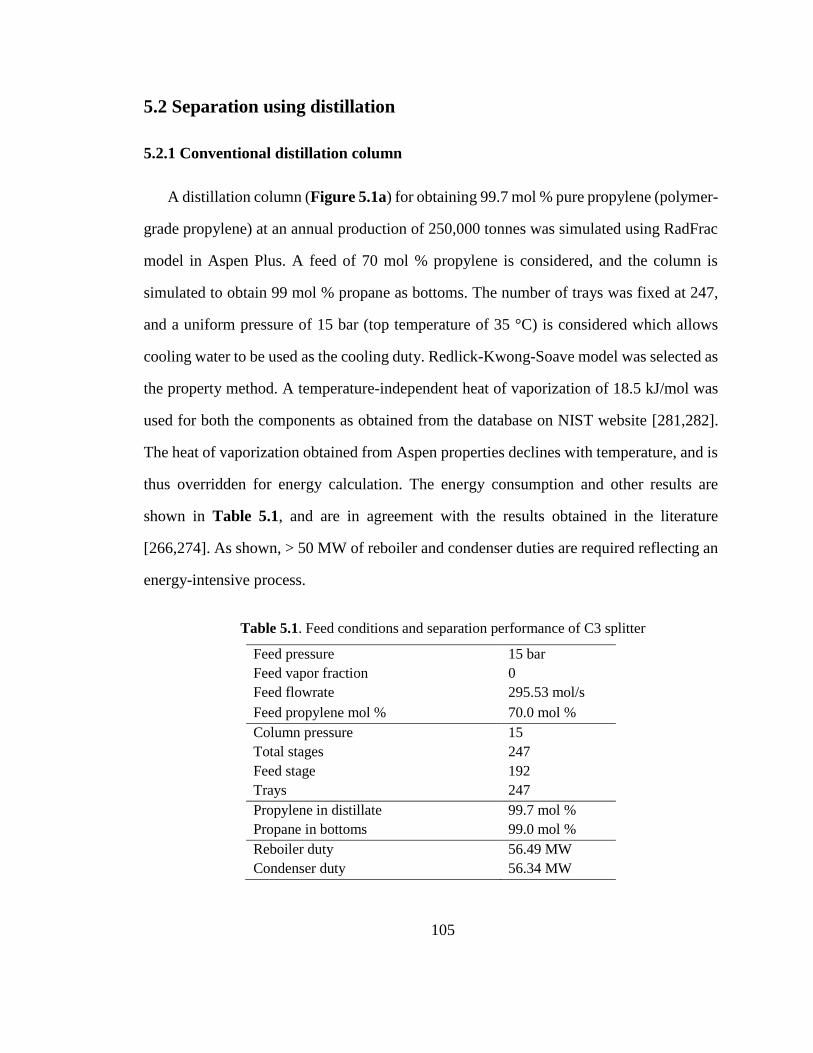
105
5.2 Separation using distillation
5.2.1 Conventional distillation column
A distillation column (Figure 5.1a) for obtaining 99.7 mol % pure propylene (polymer-
grade propylene) at an annual production of 250,000 tonnes was simulated using RadFrac
model in Aspen Plus. A feed of 70 mol % propylene is considered, and the column is
simulated to obtain 99 mol % propane as bottoms. The number of trays was fixed at 247,
and a uniform pressure of 15 bar (top temperature of 35 °C) is considered which allows
cooling water to be used as the cooling duty. Redlick-Kwong-Soave model was selected as
the property method. A temperature-independent heat of vaporization of 18.5 kJ/mol was
used for both the components as obtained from the database on NIST website [281,282].
The heat of vaporization obtained from Aspen properties declines with temperature, and is
thus overridden for energy calculation. The energy consumption and other results are
shown in Table 5.1, and are in agreement with the results obtained in the literature
[266,274]. As shown, > 50 MW of reboiler and condenser duties are required reflecting an
energy-intensive process.
Table 5.1. Feed conditions and separation performance of C3 splitter
Feed pressure 15 bar
Feed vapor fraction 0
Feed flowrate 295.53 mol/s
Feed propylene mol % 70.0 mol %
Column pressure 15
Total stages 247
Feed stage 192
Trays 247
Propylene in distillate 99.7 mol %
Propane in bottoms 99.0 mol %
Reboiler duty 56.49 MW
Condenser duty 56.34 MW
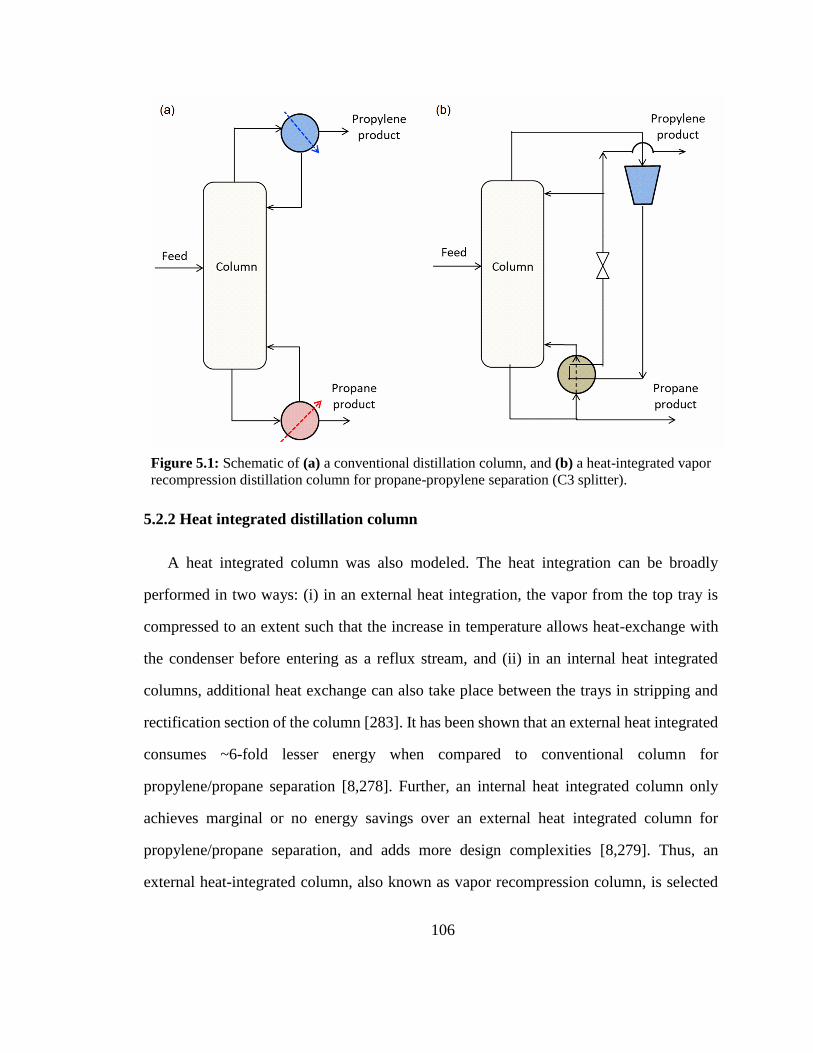
106
Figure 5.1: Schematic of (a) a conventional distillation column, and (b) a heat-integrated vapor
recompression distillation column for propane-propylene separation (C3 splitter).
5.2.2 Heat integrated distillation column
A heat integrated column was also modeled. The heat integration can be broadly
performed in two ways: (i) in an external heat integration, the vapor from the top tray is
compressed to an extent such that the increase in temperature allows heat-exchange with
the condenser before entering as a reflux stream, and (ii) in an internal heat integrated
columns, additional heat exchange can also take place between the trays in stripping and
rectification section of the column [283]. It has been shown that an external heat integrated
consumes ~6-fold lesser energy when compared to conventional column for
propylene/propane separation [8,278]. Further, an internal heat integrated column only
achieves marginal or no energy savings over an external heat integrated column for
propylene/propane separation, and adds more design complexities [8,279]. Thus, an
external heat-integrated column, also known as vapor recompression column, is selected

107
in this study (Figure 5.1b). In a conventional distillation column, the condenser
temperature is lower than the reboiler temperature and prohibits heat integration. In a vapor
recompression column, the vapor stream is compressed so that its temperature rises above
the bottom stream temperature, and enables heat integration between condenser and
reboiler. It should be noted that the lesser the difference in the boiling points of the
components, the lesser is the energy required for compression to enable heat-integration.
The energy requirement of a vapor recompression column operating at pressures of 12 and
15 bar with temperature difference (corresponding saturation temperature at higher
pressure – reboiler temperature) of 5 °C and 10 °C are calculated. The heat integrated
column under these conditions requires 2-3 MW of compressor energy as opposed to ~ 50
MW of thermal energy required for conventional column. The discrepancy between energy
consumption (20-fold lesser energy as opposed to 6-fold lesser energy in the literature
[8,278]) is due to our approach for using heat of vaporization values from NIST website as
opposed to using inherent values from Aspen database. Further, as compression work has
high exergy than thermal energy (fuel-equivalent energy for electricity is ~3-fold than that
for steam [200]), heat-integration achieves 85-90 % of energy savings.
5.2.3 Remarks on operation of conventional and heat-integrated columns
Distillation without heat integration is usually operated at high pressure (~15 bar) so
that cooling water can be utilized for condenser, and this configuration is commonly known
as high-pressure system [284]. The column design with heat integration is usually operated
at lower pressure (~ 12 bar) as relative volatility is improved at lower pressure, and results
in lower energy consumption. This external heat integrated configuration is commonly
known as heat pump system [284]. While heat-integration through heat-pump achieves
significant energy savings, such designs are challenging to operate and control due to
reduction in available degrees of freedom [9,285], and, thus, are not routinely implemented
108
in industry. Further, low-grade heat (such as, quench water) is usually readily available as
waste heat. Thus, high-pressure designs are more commonly used, and are usually heat-
integrated with other parts of the plant for providing reboiler heating duty [284]. Although
such designs may not be as energy-efficient as heat pump, they still result in energy savings
without the additional control and operating challenges.
5.3 Separation using membranes
Several membrane materials have been studied for olefin/paraffin separation. While
polymer membranes have been unable to achieve high selectivity [286–288], facilitated
transport membranes [289], carbon molecular sieves [290,291], and zeolites and metal-
organic framework membranes [292] have shown promising results.
5.3.1 Literature review
Facilitated transport membranes improve the olefin/paraffin selectivity by utilizing
carriers, usually silver ions, which act as complexing agent and reversibly react with olefin
molecules to improve their permeation over paraffin molecules [289]. These membranes
can be broadly classified into liquid membranes and membrane electrolytes. However,
liquid membranes suffers from the physical loss of facilitation carriers and thus cannot
sustain high pressure operations. Further, both the feed and sweep streams need to be
humidified with subsequent dehydration of product stream. Thus, dense membrane
electrolyte are preferred over liquid membranes. Major work on polymer electrolyte
membranes have been carried out by Sridhar and co-workers [293,294], Pinnau and co-
workers [295,296], and Kang and co-workers [297–300]. Although permeance > 10 GPU
and mixture selectivity > 100 has been achieved, Merkel et al. [301] have shown that
exposure to light and presence of common mixture impurities, such as acetylene, hydrogen
and hydrogen sulphide affects the carrier stability (reduces silver ion to silver particles)
109
and can reduce the selectivity by more than 10-fold within a period of 1 week. Although
treatment with hydrogen perodixde/ tetrafluoroboric acid was suggested for restoration of
these membranes, the process took a long time (~ 60 hours) for regeneration after hydrogen
reduction and was ineffective against hydrogen sulphide poisoning.
Carbon membranes or carbon molecular sieves (CMS) are prepared by pyrolysis of
polymer membranes at high temperature. Koros and co-workers [291,302,303] have
extensively studied CMS membranes for olefin/paraffin separation. While both Matrimid
and 6FDA/BPDA-DAM CMS membranes exhibited pure-gas selectivity (C3H6/C3H8) of >
20, polypropylene permeance of 18 GPU were obtained for 6FDA/BPDA-DAM CMS
membranes as compared to 1 GPU for Matrimid CMS membranes. In other studies,
Swaidan et al. [304] used polymer of intrinsic microposoristy, PIM-6FDA-OH, as a
precursor for CMS membranes, which exhibited a mixed gas C3H6/C3H8 selectivity of 24
at 2 bar. However, the selectivity dropped to 17 as the feed pressure was raised to 5 bar.
Ma et al. [290] studied the effect of substrates on the performance of CMS membranes and
found that the membranes prepared on gamma-alumina substrate performed better than the
ones prepared on alpha-alumina. They obtained a mixed gas-selectivity of 36 and
polypropylene permeance of 9 GPU for 6FDA-based CMS membranes on gamma-alumina
support. Researchers from Dow Chemicals [305] have used CMS as adsorbents for
Pressure Swing Adsorption (PSA) process and achieved 90 mol% propylene from a 25
mol% propylene feed exhibiting a separation factor of 27.
Recently, Ma et al. have prepared ZIF-8 membranes using a novel ligand-induced
permselectivation which shows promising and stable performance with high mixture
separation factor for propylene over propane, and the highest propylene flux reported
(larger than 45 and 10-2 mol m-2 s-1, respectively, at room temperature and 7 atm equimolar
110
feed). In this research, propane-propylene separation is analyzed at a process-scale
considering the performance achieved by these ZIF-8 membranes.
5.3.2 Membrane modeling
A counter-current membrane model with a constant permeance and selectivity, and a
plug flow for both the retentate and the permeate side is considered. A uniform pressure
was assumed on both the sides. The governing flow equations for each component are as
follows:
where the +ve sign refers to the retentate side while the -sign refers to the permeate side, F
is the flow rate along the membrane, J is the flux through the membrane, and r is the radius
of the tube. The flux through the membrane is given by:
where П refers to the permeance, p refers to the partial pressure, and sel refers to the
selectivity, while ‘ret’ and ‘perm’ denote the retentate and permeate side, respectively.
The transport through these membranes is an adsorption-diffusion phenomenon and the
selectivity values mentioned above for several kind of membranes are obtained at a feed
pressure of 2-5 bar and a permeate pressure of < 1 bar. Since adsorption isotherm achieves
saturation at high pressure, the driving force does not increase for feed pressure over the
saturation pressure. Further, the driving force becomes negligible if permeate pressure is
close to or higher than saturation, and the membrane becomes non-selective. In most of the
membrane modeling studies in the literature, a permeate pressure of 3-5 bar is considered.
Although this helps in reducing the energy enquired for permeate recompression to feed
ii π2 rJ
dx
dF (5.1)
jiji
permiretii
Sel
ppJ
,
,,i ;
(5.2)
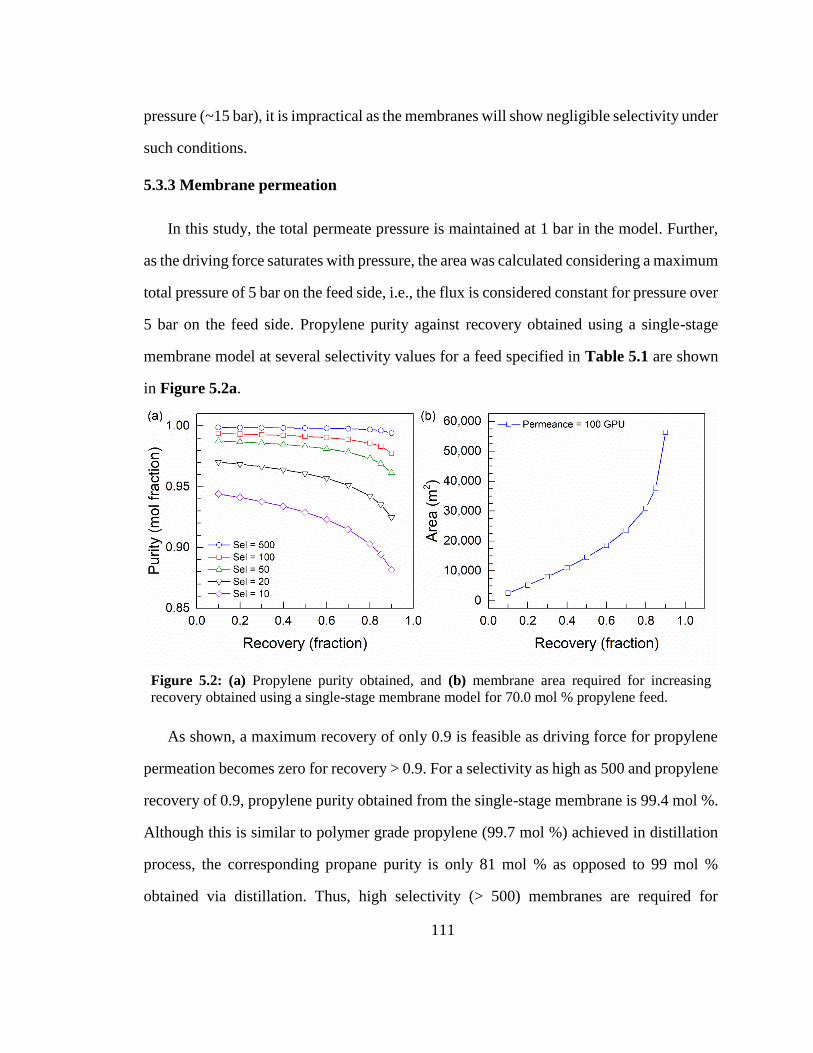
111
pressure (~15 bar), it is impractical as the membranes will show negligible selectivity under
such conditions.
5.3.3 Membrane permeation
In this study, the total permeate pressure is maintained at 1 bar in the model. Further,
as the driving force saturates with pressure, the area was calculated considering a maximum
total pressure of 5 bar on the feed side, i.e., the flux is considered constant for pressure over
5 bar on the feed side. Propylene purity against recovery obtained using a single-stage
membrane model at several selectivity values for a feed specified in Table 5.1 are shown
in Figure 5.2a.
Figure 5.2: (a) Propylene purity obtained, and (b) membrane area required for increasing
recovery obtained using a single-stage membrane model for 70.0 mol % propylene feed.
As shown, a maximum recovery of only 0.9 is feasible as driving force for propylene
permeation becomes zero for recovery > 0.9. For a selectivity as high as 500 and propylene
recovery of 0.9, propylene purity obtained from the single-stage membrane is 99.4 mol %.
Although this is similar to polymer grade propylene (99.7 mol %) achieved in distillation
process, the corresponding propane purity is only 81 mol % as opposed to 99 mol %
obtained via distillation. Thus, high selectivity (> 500) membranes are required for
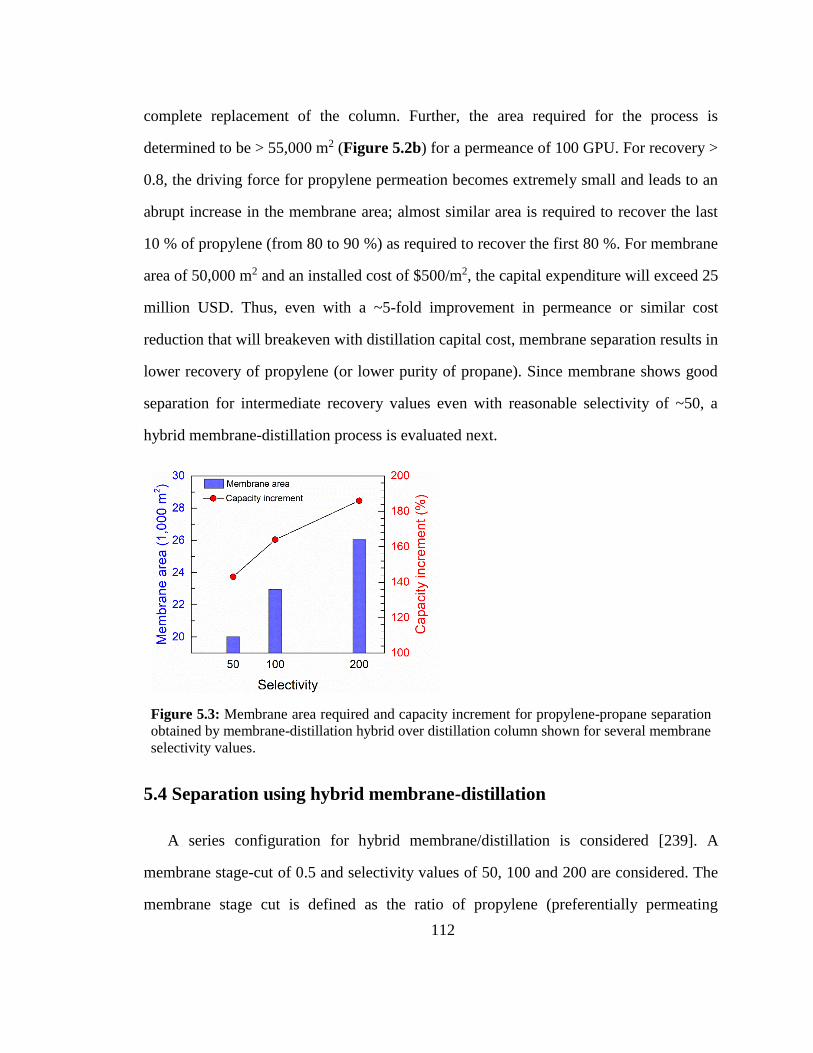
112
complete replacement of the column. Further, the area required for the process is
determined to be > 55,000 m2 (Figure 5.2b) for a permeance of 100 GPU. For recovery >
0.8, the driving force for propylene permeation becomes extremely small and leads to an
abrupt increase in the membrane area; almost similar area is required to recover the last
10 % of propylene (from 80 to 90 %) as required to recover the first 80 %. For membrane
area of 50,000 m2 and an installed cost of $500/m2, the capital expenditure will exceed 25
million USD. Thus, even with a ~5-fold improvement in permeance or similar cost
reduction that will breakeven with distillation capital cost, membrane separation results in
lower recovery of propylene (or lower purity of propane). Since membrane shows good
separation for intermediate recovery values even with reasonable selectivity of ~50, a
hybrid membrane-distillation process is evaluated next.
Figure 5.3: Membrane area required and capacity increment for propylene-propane separation
obtained by membrane-distillation hybrid over distillation column shown for several membrane
selectivity values.
5.4 Separation using hybrid membrane-distillation
A series configuration for hybrid membrane/distillation is considered [239]. A
membrane stage-cut of 0.5 and selectivity values of 50, 100 and 200 are considered. The
membrane stage cut is defined as the ratio of propylene (preferentially permeating
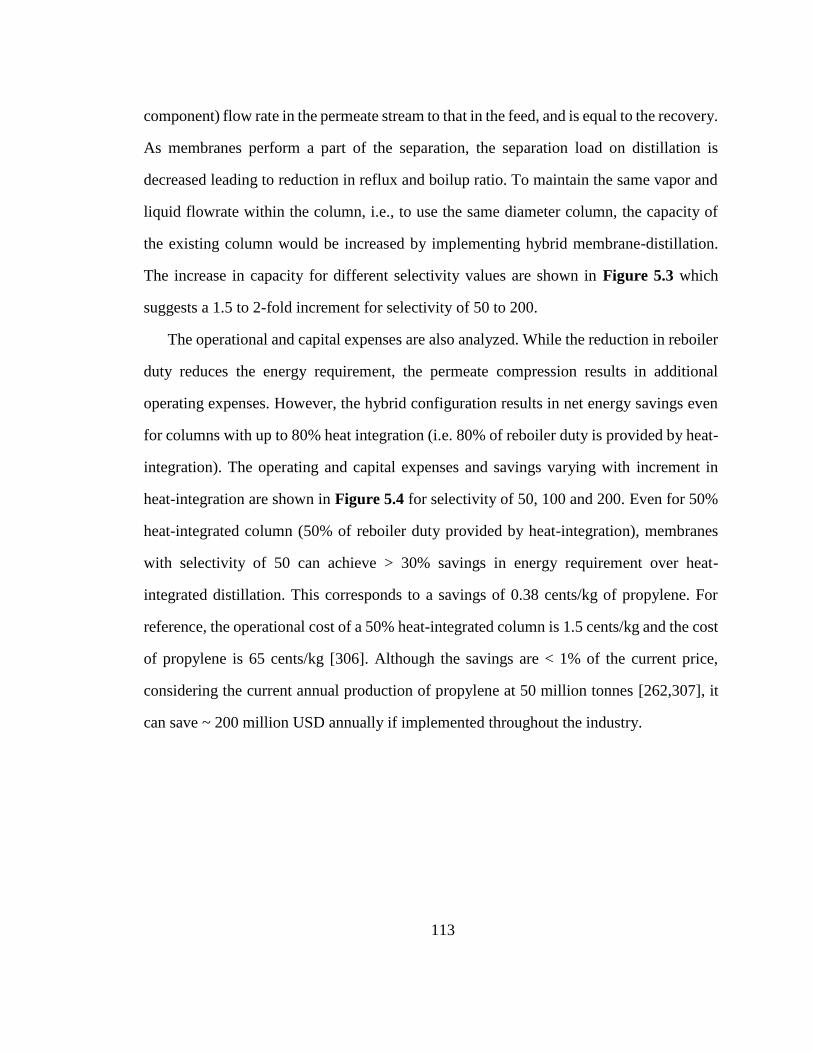
113
component) flow rate in the permeate stream to that in the feed, and is equal to the recovery.
As membranes perform a part of the separation, the separation load on distillation is
decreased leading to reduction in reflux and boilup ratio. To maintain the same vapor and
liquid flowrate within the column, i.e., to use the same diameter column, the capacity of
the existing column would be increased by implementing hybrid membrane-distillation.
The increase in capacity for different selectivity values are shown in Figure 5.3 which
suggests a 1.5 to 2-fold increment for selectivity of 50 to 200.
The operational and capital expenses are also analyzed. While the reduction in reboiler
duty reduces the energy requirement, the permeate compression results in additional
operating expenses. However, the hybrid configuration results in net energy savings even
for columns with up to 80% heat integration (i.e. 80% of reboiler duty is provided by heat-
integration). The operating and capital expenses and savings varying with increment in
heat-integration are shown in Figure 5.4 for selectivity of 50, 100 and 200. Even for 50%
heat-integrated column (50% of reboiler duty provided by heat-integration), membranes
with selectivity of 50 can achieve > 30% savings in energy requirement over heat-
integrated distillation. This corresponds to a savings of 0.38 cents/kg of propylene. For
reference, the operational cost of a 50% heat-integrated column is 1.5 cents/kg and the cost
of propylene is 65 cents/kg [306]. Although the savings are < 1% of the current price,
considering the current annual production of propylene at 50 million tonnes [262,307], it
can save ~ 200 million USD annually if implemented throughout the industry.
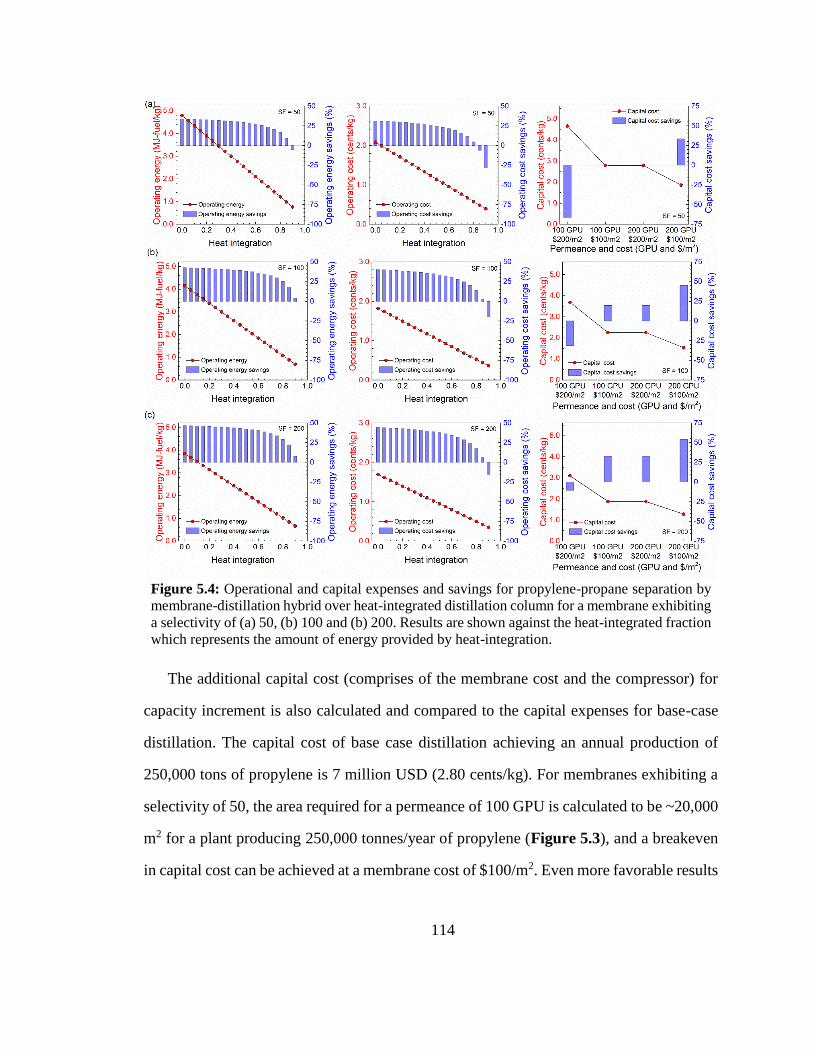
114
Figure 5.4: Operational and capital expenses and savings for propylene-propane separation by
membrane-distillation hybrid over heat-integrated distillation column for a membrane exhibiting
a selectivity of (a) 50, (b) 100 and (b) 200. Results are shown against the heat-integrated fraction
which represents the amount of energy provided by heat-integration.
The additional capital cost (comprises of the membrane cost and the compressor) for
capacity increment is also calculated and compared to the capital expenses for base-case
distillation. The capital cost of base case distillation achieving an annual production of
250,000 tons of propylene is 7 million USD (2.80 cents/kg). For membranes exhibiting a
selectivity of 50, the area required for a permeance of 100 GPU is calculated to be ~20,000
m2 for a plant producing 250,000 tonnes/year of propylene (Figure 5.3), and a breakeven
in capital cost can be achieved at a membrane cost of $100/m2. Even more favorable results
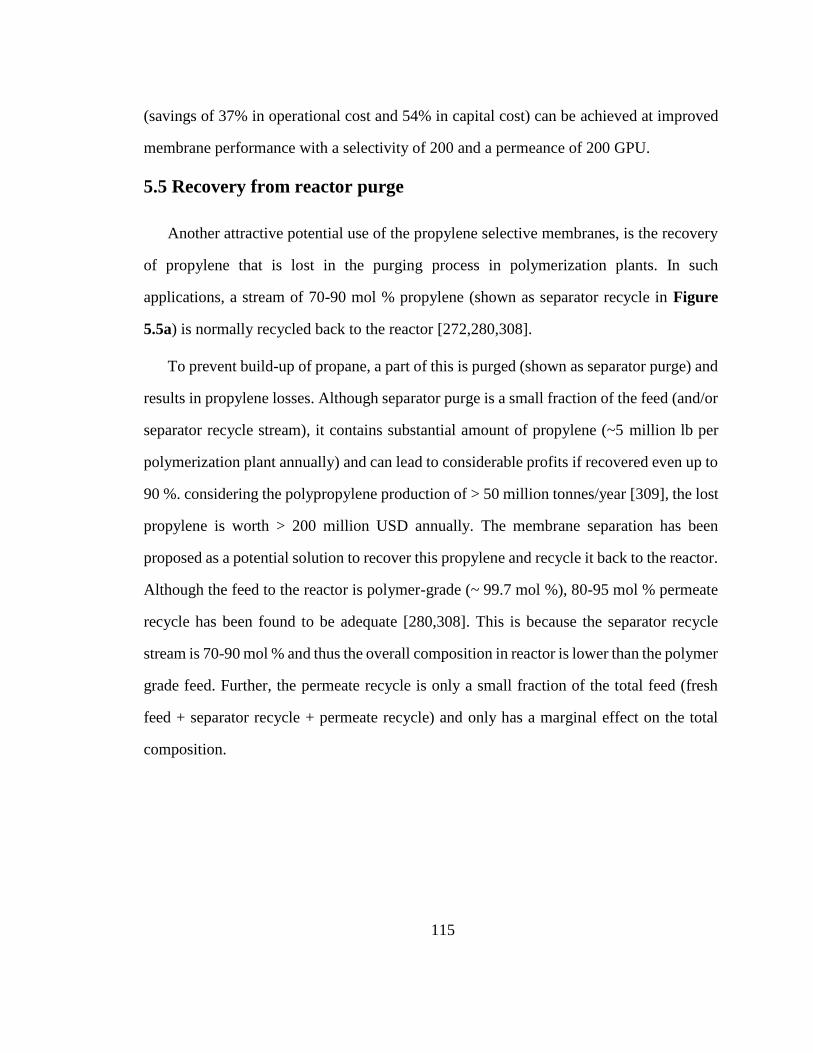
115
(savings of 37% in operational cost and 54% in capital cost) can be achieved at improved
membrane performance with a selectivity of 200 and a permeance of 200 GPU.
5.5 Recovery from reactor purge
Another attractive potential use of the propylene selective membranes, is the recovery
of propylene that is lost in the purging process in polymerization plants. In such
applications, a stream of 70-90 mol % propylene (shown as separator recycle in Figure
5.5a) is normally recycled back to the reactor [272,280,308].
To prevent build-up of propane, a part of this is purged (shown as separator purge) and
results in propylene losses. Although separator purge is a small fraction of the feed (and/or
separator recycle stream), it contains substantial amount of propylene (~5 million lb per
polymerization plant annually) and can lead to considerable profits if recovered even up to
90 %. considering the polypropylene production of > 50 million tonnes/year [309], the lost
propylene is worth > 200 million USD annually. The membrane separation has been
proposed as a potential solution to recover this propylene and recycle it back to the reactor.
Although the feed to the reactor is polymer-grade (~ 99.7 mol %), 80-95 mol % permeate
recycle has been found to be adequate [280,308]. This is because the separator recycle
stream is 70-90 mol % and thus the overall composition in reactor is lower than the polymer
grade feed. Further, the permeate recycle is only a small fraction of the total feed (fresh
feed + separator recycle + permeate recycle) and only has a marginal effect on the total
composition.
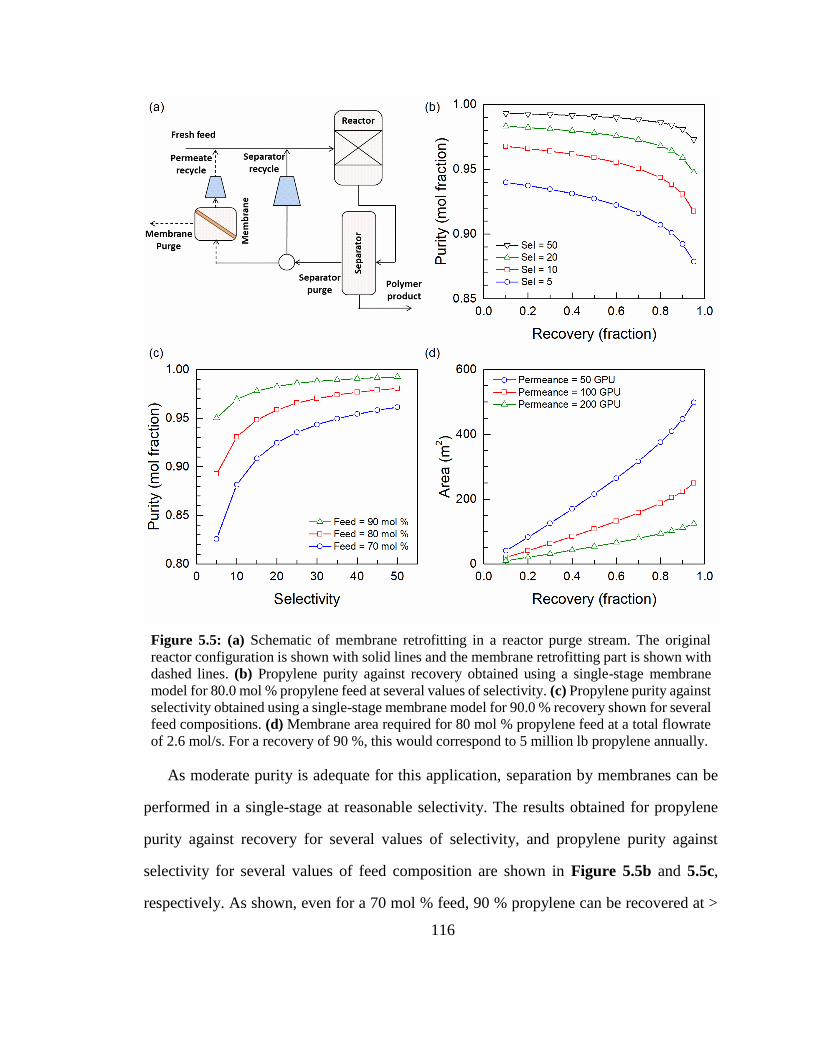
116
Figure 5.5: (a) Schematic of membrane retrofitting in a reactor purge stream. The original
reactor configuration is shown with solid lines and the membrane retrofitting part is shown with
dashed lines. (b) Propylene purity against recovery obtained using a single-stage membrane
model for 80.0 mol % propylene feed at several values of selectivity. (c) Propylene purity against
selectivity obtained using a single-stage membrane model for 90.0 % recovery shown for several
feed compositions. (d) Membrane area required for 80 mol % propylene feed at a total flowrate
of 2.6 mol/s. For a recovery of 90 %, this would correspond to 5 million lb propylene annually.
As moderate purity is adequate for this application, separation by membranes can be
performed in a single-stage at reasonable selectivity. The results obtained for propylene
purity against recovery for several values of selectivity, and propylene purity against
selectivity for several values of feed composition are shown in Figure 5.5b and 5.5c,
respectively. As shown, even for a 70 mol % feed, 90 % propylene can be recovered at >
117
80 mol % purity for selectivity as low as 5. The membrane area required for 80 mol %
propylene feed at 2.6 mol/s (equivalent to 5 million lb propylene annually at a recovery of
90 %) is shown in Figure 5.5d. As shown, for a permeance of 100 GPU, membrane area
of ~250 m2 will be required for a typical propylene polymerization reactor.
Figure 5.6: Net present value of profits for 90 % propylene recovery from a reactor purge stream
considering reactor pressure of 30 bar, annual propylene recovery of 5 million lb, and membrane
permeance and selectivity of 100 GPU and 5, respectively.
An economic analysis is also carried out to evaluate the profits associated with purge
stream recovery. As the reactor is operated at high pressure (5 – 30 bar) [310–312],
compression of the permeate stream will constitute majority of the operational cost. The
major capital cost will comprise the cost of the compressor and the membrane. This cost,
then, shall be compared to the value of recovered olefin to evaluate the scope of membranes
for this application. Considering a price of 20 cents/lb for propylene [306], the total annual
revenue for a recovery of 5 million lb propylene per year amounts to $ 1 million.
Correspondingly, three compressors of < 10 kW each are required for permeate
compression to 30 bar. Considering a cost of 7 cents/kWh of electrical energy [200], this
amounts to $17,000 in operational costs which is < 2% of the total revenue. The
corresponding total capital cost for compressor and membrane amounts to $30,000 and
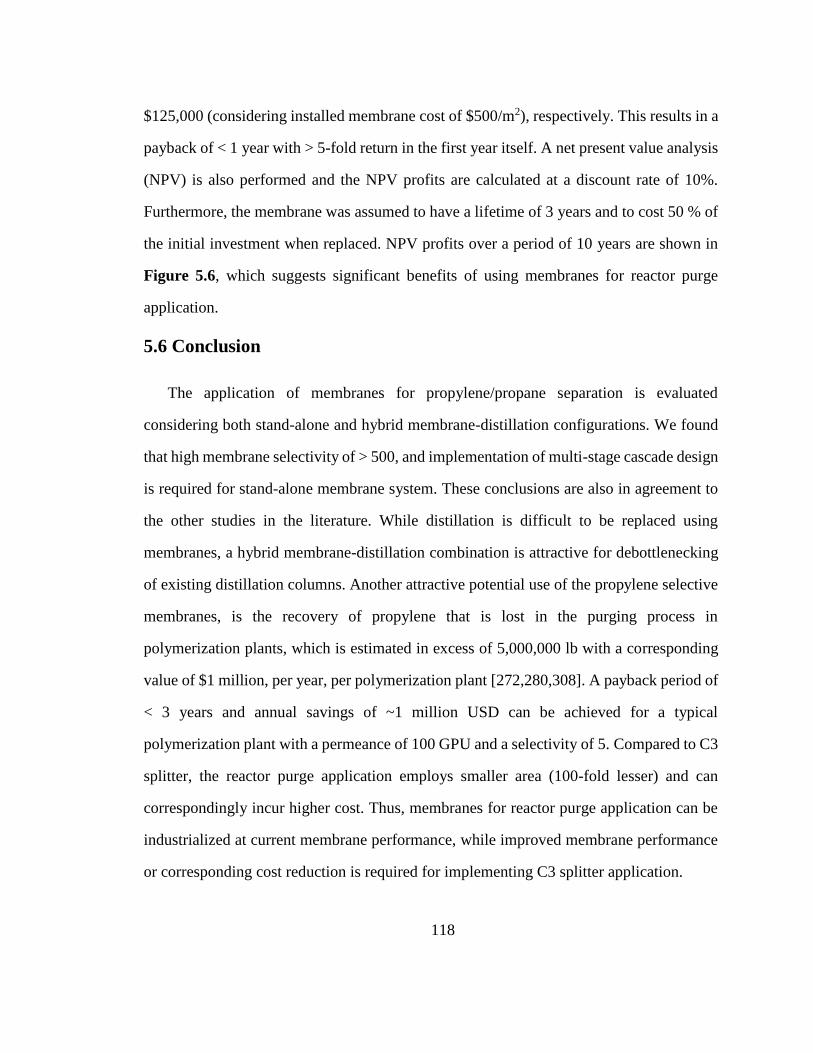
118
$125,000 (considering installed membrane cost of $500/m2), respectively. This results in a
payback of < 1 year with > 5-fold return in the first year itself. A net present value analysis
(NPV) is also performed and the NPV profits are calculated at a discount rate of 10%.
Furthermore, the membrane was assumed to have a lifetime of 3 years and to cost 50 % of
the initial investment when replaced. NPV profits over a period of 10 years are shown in
Figure 5.6, which suggests significant benefits of using membranes for reactor purge
application.
5.6 Conclusion
The application of membranes for propylene/propane separation is evaluated
considering both stand-alone and hybrid membrane-distillation configurations. We found
that high membrane selectivity of > 500, and implementation of multi-stage cascade design
is required for stand-alone membrane system. These conclusions are also in agreement to
the other studies in the literature. While distillation is difficult to be replaced using
membranes, a hybrid membrane-distillation combination is attractive for debottlenecking
of existing distillation columns. Another attractive potential use of the propylene selective
membranes, is the recovery of propylene that is lost in the purging process in
polymerization plants, which is estimated in excess of 5,000,000 lb with a corresponding
value of $1 million, per year, per polymerization plant [272,280,308]. A payback period of
< 3 years and annual savings of ~1 million USD can be achieved for a typical
polymerization plant with a permeance of 100 GPU and a selectivity of 5. Compared to C3
splitter, the reactor purge application employs smaller area (100-fold lesser) and can
correspondingly incur higher cost. Thus, membranes for reactor purge application can be
industrialized at current membrane performance, while improved membrane performance
or corresponding cost reduction is required for implementing C3 splitter application.
119
Chapter 6: Concluding remarks
The aim of this thesis is to develop a detailed mathematical model of a zeolite
membrane separation process and use this to perform conceptual process design studies
and techno-economic evaluation for several applications of interest, including butane
isomer separation, bioethanol enrichment, and propylene-propane separation. A
comprehensive model has been developed that not only predicts the separation
performance under wide range of operating conditions, but also determines the scope of
improvement in the current state-of-the-art membranes. In this model, permeation through
the zeolite membrane is described using molecular-level adsorption-diffusion properties
including resistances from external resistances. This is integrated with a process-level
model which results in complete description of membrane operation, both at the
microscopic and macroscopic level. This first-of-its-kind modeling approach can be used
as a template to rigorously design and optimize zeolite membrane systems, as illustrated
using several applications. The conclusion realized by applying the model for these
applications are discussed next.
For butane isomer application, a hybrid membrane-distillation process is found to be
energy efficient and economically attractive over stand-alone membrane separation. A 10-
fold improvement in diffusivity (Đ = Đ0/5) can be achieved by reducing pore blockages in
the intergrown membranes or, equivalently, its effect on performance can be achieved by
reducing the membrane thickness from the currently achieved ~500 nm to 50 nm or less.
With this 10-fold improvement in permeance as compared to that in current state-of-the-
art ceramic supported MFI membranes, payback period of 3 years can be achieved with
installed membrane cost of up to $5,000/m2. Alternatively, the same payback period can
be achieved by the current technology if manufacturing improvements bring the membrane
cost down to $500/m2.
120
For bioethanol enrichment, both hydrophilic and hydrophobic zeolite membranes have
been considered. It is found that hydrophobic zeolite membranes have potential for
significant energy savings but a 2-fold improvement in selectivity over that exhibited by
defect-free membranes is required to meet distillation purity. Hydrophilic zeolite
membranes can achieve higher purity than distillation but consume almost similar energy
as that required for distillation. Thus, a configuration that uses hydrophobic membranes
followed by hydrophilic membranes is considered which can achieve the required purity
with 10 % energy savings over distillation. The techno-economic analysis suggests that
defect-free membranes and ~ 10-fold improvements in permeation or equivalent cost
reductions are required for economic viability of this scheme. Considering these intensive
requirements, zeolite membranes offer only a marginal amount of savings and, thus, is not
a promising application for bioethanol enrichment.
ZEF-8 (Zeolitic Imidazolate Framework) membranes have been considered for
propylene-propane application. While distillation is difficult to be replaced using
membranes, a hybrid membrane-distillation is attractive for debottlenecking of existing
distillation columns. This can result in operational savings of ~ 200 million USD annually
if implemented throughout the industry but a cost of $100/m2 along with a membrane area
of 20,000 m2 is required to achieve a breakeven in the capital cost. Another attractive
potential use of the propylene selective membranes, is the recovery of propylene that is lost
in the purging process in polymerization plants. Compared to C3 splitter, the reactor purge
application employs smaller area (100-fold lesser) and can correspondingly incur higher
cost (up to $10,000/m2). Thus, membranes for reactor purge application can be
industrialized at current membrane performance, while improved membrane performance
or corresponding cost reduction is required for implementing C3 splitter application.
121
Bibliography
[1] Distillation Column Modeling Tools, Office of Industrial Technologies, Energy Efficiency
and Renewable Energy, U.S. Department of Energy, 2001.
[2] N. Rangnekar, N. Mittal, B. Elyassi, J. Caro, M. Tsapatsis, Zeolite membranes – a review
and comparison with MOFs, Chem. Soc. Rev. 44 (2015) 7128–7154.
doi:10.1039/C5CS00292C.
[3] Hybrid Separations/Distillation Technology Industrial Technologies Program, Office of
Energy Efficiency and Renewable Energy, U.S. Department of Energy, 2005.
[4] R. Krishna, L.J.P. van den Broeke, The Maxwell-Stefan description of mass transport across
zeolite membranes, Chem. Eng. J. Biochem. Eng. J. 57 (1995) 155–162. doi:10.1016/0923-
0467(94)02951-2.
[5] F. Kapteijn, J.A. Moulijn, R. Krishna, The generalized Maxwell-Stefan model for diffusion
in zeolites: Sorbate molecules with different saturation loadings, Chem. Eng. Sci. 55 (2000)
2923–2930. doi:10.1016/S0009-2509(99)00564-3.
[6] Butanes Market - Global Industry Size, Market Share, Trends, Analysis, and Forecasts 2010
– 2018, Transparency Market Research, 2011.
[7] J. Karger, D.M. Ruthven, D.N. Theodorou, Diffusion in nanoporous materials, John Wiley
& Sons, 2012.
[8] Ž. Olujić, L. Sun, A. de Rijke, P.J. Jansens, Conceptual design of an internally heat
integrated propylene-propane splitter, Energy. 31 (2006) 3083–3096.
doi:10.1016/j.energy.2006.03.030.
[9] S.S. Jogwar, P. Daoutidis, Dynamics and control of vapor recompression distillation, J.
Process Control. 19 (2009) 1737–1750. doi:10.1016/j.jprocont.2009.07.001.
[10] J. Caro, M. Noack, P. Kölsch, R. Schäfer, Zeolite membranes - state of their development
and perspective, Microporous Mesoporous Mater. 38 (2000) 3–24. doi:10.1016/S1387-
1811(99)00295-4.
[11] J. Caro, M. Noack, Zeolite membranes - Recent developments and progress, Microporous
Mesoporous Mater. 115 (2008) 215–233. doi:10.1016/j.micromeso.2008.03.008.
[12] M. Tsapatsis, Toward high-throughput zeolite membranes, Science. 334 (2011) 767–768.
doi:10.1126/science.1205957.
[13] J. Gascon, F. Kapteijn, B. Zornoza, V. Sebastián, C. Casado, J. Coronas, Practical approach
to zeolitic membranes and coatings: State of the art, opportunities, barriers, and future
perspectives, Chem. Mater. 24 (2012) 2829–2844. doi:10.1021/cm301435j.
[14] S.-L. Wee, C.-T. Tye, S. Bhatia, Membrane separation process—Pervaporation through
zeolite membrane, Sep. Purif. Technol. 63 (2008) 500–516.
doi:10.1016/J.SEPPUR.2008.07.010.
[15] Z. Lai, G. Bonilla, I. Diaz, J.G. Nery, K. Sujaoti, M.A. Amat, E. Kokkoli, O. Terasaki, R.W.
Thompson, M. Tsapatsis, D.G. Vlachos, Microstructural optimization of a zeolite
membrane for organic vapor separation, Science. 300 (2003) 456–460.
doi:10.1126/science.1082169.
[16] M. Yu, R.D. Noble, J.L. Falconer, Zeolite membranes: Microstructure characterization and
permeation mechanisms, Acc. Chem. Res. 44 (2011) 1196–1206. doi:10.1021/ar200083e.
122
[17] J.A. Stoeger, J. Choi, M. Tsapatsis, Rapid thermal processing and separation performance
of columnar MFI membranes on porous stainless steel tubes, Energy Environ. Sci. View. 4
(2011) 3479–3486. doi:10.1039/c1ee01700d.
[18] Y. Peng, H. Lu, Z. Wang, Y. Yan, Microstructural optimization of MFI-type zeolite
membranes for ethanol–water separation, J. Mater. Chem. A Mater. Energy Sustain. 2
(2014) 16093–16100. doi:10.1039/C4TA02837F.
[19] K. Varoon, X. Zhang, B. Elyassi, D.D. Brewer, M. Gettel, S. Kumar, J.A. Lee, S.
Maheshwari, A. Mittal, C.Y. Sung, M. Cococcioni, L.F. Francis, A. V. McCormick, K.A.
Mkhoyan, M. Tsapatsis, Dispersible exfoliated zeolite nanosheets and their application as a
selective membrane, Science. 334 (2011) 72–75. doi:10.1126/science.1208891.
[20] T.C.T. Pham, T.H. Nguyen, K.B. Yoon, Gel-free secondary growth of uniformly oriented
silica MFI zeolite films and application for xylene separation, Angew. Chemie - Int. Ed. 52
(2013) 8693–8698. doi:10.1002/anie.201301766.
[21] Y. Li, W. Yang, Microwave synthesis of zeolite membranes: A review, J. Memb. Sci. 316
(2008) 3–17. doi:10.1016/J.MEMSCI.2007.08.054.
[22] N. Kosinov, J. Gascon, F. Kapteijn, E.J.M. Hensen, Recent developments in zeolite
membranes for gas separation, J. Memb. Sci. 499 (2016) 65–79.
doi:10.1016/J.MEMSCI.2015.10.049.
[23] T.C. Bowen, R.D. Noble, J.L. Falconer, Fundamentals and applications of pervaporation
through zeolite membranes, J. Memb. Sci. 245 (2004) 1–33.
doi:10.1016/j.memsci.2004.06.059.
[24] D. Korelskiy, T. Lepp, H. Zhou, M. Grahn, J. Tanskanen, J. Hedlund, High flux MFI
membranes for pervaporation, J. Memb. Sci. 427 (2013) 381–389.
doi:10.1016/j.memsci.2012.10.016.
[25] B. Huang, Q. Liu, J. Caro, A. Huang, Iso-butanol dehydration by pervaporation using zeolite
LTA membranes prepared on 3-aminopropyltriethoxysilane-modified alumina tubes, J.
Memb. Sci. 455 (2014) 200–206. doi:10.1016/j.memsci.2013.12.075.
[26] B. Elyassi, M.Y. Jeon, M. Tsapatsis, K. Narasimharao, N.M.N. Sulaiman, S. Al-Thabaiti,
Ethanol/Water Mixture Pervaporation Performance of b-Oriented Silicalite-1 Membranes
Made by Gel-Free Secondary Growth Bahman, AIChE J. 62 (2016) 556. doi:10.1002/aic.
[27] R.D. Noble, J.L. Falconer, Separations of C4 and C6 Isomers in ZSM-5 Tubular
Membranes, Ind. Eng. Chem. Res. 37 (1998) 166–176. doi:10.1021/ie970462u.
[28] T. Matsufuji, N. Nishiyama, M. Matsukata, K. Ueyama, Separation of butane and xylene
isomers with MFI-type zeolitic membrane synthesized by a vapor-phase transport method,
J. Memb. Sci. 178 (2000) 25–34. doi:10.1016/S0376-7388(00)00462-2.
[29] S. Nair, Z. Lai, V. Nikolakis, G. Xomeritakis, G. Bonilla, M. Tsapatsis, Separation of close-
boiling hydrocarbon mixtures by MFI and FAU membranes made by secondary growth,
Microporous Mesoporous Mater. 48 (2001) 219-228. doi:10.1016/S1387-1811(01)00356-
0.
[30] T. Lee, J. Choi, M. Tsapatsis, On the performance of c-oriented MFI zeolite Membranes
treated by rapid thermal processing, J. Memb. Sci. 436 (2013) 79–89.
doi:10.1016/j.memsci.2013.02.028.
[31] K.V. Agrawal, B. Topuz, T.C.T. Pham, T.H. Nguyen, N. Sauer, N. Rangnekar, H. Zhang,
K. Narasimharao, S.N. Basahel, L.F. Francis, C.W. Macosko, S. Al-Thabaiti, M. Tsapatsis,
123
K.B. Yoon, Oriented MFI membranes by gel-less secondary growth of sub-100 nm MFI-
nanosheet seed layers, Adv. Mater. 27 (2015) 3243–3249. doi:10.1002/adma.201405893.
[32] M.A. Carreon, S. Li, J.L. Falconer, R.D. Noble, Alumina-Supported SAPO-34 Membranes
for CO2/CH4 Separation, J. Am. Chem. Soc. 130 (2008) 5412–5413. doi:10.1021/ja801294f.
[33] J.C. White, P.K. Dutta, K. Shqau, H. Verweij, Synthesis of Ultrathin Zeolite Y Membranes
and their Application for Separation of Carbon Dioxide and Nitrogen Gases, Langmuir. 26
(2010) 10287–10293. doi:10.1021/la100463j.
[34] T. Tomita, K. Nakayama, H. Sakai, Gas separation characteristics of DDR type zeolite
membrane, Microporous Mesoporous Mater. 68 (2004) 71–75.
doi:10.1016/J.MICROMESO.2003.11.016.
[35] H. Zhou, D. Korelskiy, E. Sjöberg, J. Hedlund, Ultrathin hydrophobic MFI membranes,
Microporous Mesoporous Mater. 192 (2014) 76–81.
doi:10.1016/J.MICROMESO.2013.09.017.
[36] R. Krishna, Describing the diffusion of guest molecules inside porous structures, J. Phys.
Chem. C. 113 (2009) 19756–19781. doi:10.1021/jp906879d.
[37] R. Krishna, Diffusion in porous crystalline materials, Chem. Soc. Rev. 41 (2012) 3099.
doi:10.1039/c2cs15284c.
[38] J. Xiao, J. Wei, Diffusion mechanism of hydrocarbons in zeolites—I. Theory, Chem. Eng.
Sci. 47 (1992) 1123–1141. doi:10.1016/0009-2509(92)80236-6.
[39] J. Xiao, J. Wei, Diffusion mechanism of hydrocarbons in zeolites—II. Analysis of
experimental observations, Chem. Eng. Sci. 47 (1992) 1143–1159. doi:10.1016/0009-
2509(92)80237-7.
[40] J. Coronas, J. Santamaría, Separations Using Zeolite Membranes, Sep. Purif. Methods. 28
(1999) 127–177. doi:10.1080/03602549909351646.
[41] D.S. Sholl, Understanding Macroscopic Diffusion of Adsorbed Molecules in Crystalline
Nanoporous Materials via Atomistic Simulations, (2006). doi:10.1021/AR0402199.
[42] J.M. Van De Graaf, F. Kapteijn, J.A. Moulijn, Modeling permeation of binary mixtures
through zeolite membranes, AIChE J. 45 (1999) 497–511. doi:10.1002/aic.690450307.
[43] A.I. Skoulidas, D.S. Sholl, R. Krishna, Correlation Effects in Diffusion of CH 4 /CF 4
Mixtures in MFI Zeolite. A Study Linking MD Simulations with the Maxwell−Stefan
Formulation, Langmuir. 19 (2003) 7977–7988. doi:10.1021/la034759a.
[44] T.Q. Gardner, J.L. Falconer, R.D. Noble, Transient permeation of butanes through ZSM-5
and ZSM-11 zeolite membranes, AIChE J. 50 (2004) 2816–2834. doi:10.1002/aic.10217.
[45] R. Krishna, J.M. van Baten, A simplified procedure for estimation of mixture permeances
from unary permeation data, J. Memb. Sci. 367 (2011) 204–210.
doi:10.1016/j.memsci.2010.10.055.
[46] Y.F. Yeong, A.Z. Abdullah, A.L. Ahmad, S. Bhatia, Process optimization studies of p-
xylene separation from binary xylene mixture over silicalite-1 membrane using response
surface methodology, J. Memb. Sci. 341 (2009) 96–108.
doi:10.1016/j.memsci.2009.05.042.
[47] T. Leppajarvi, I. Malinen, D. Korelskiy, J. Hedlund, J. Tanskanen, Maxwell-stefan
modeling of ethanol and water unary pervaporation through a high-silica MFI zeolite
membrane, Ind. Eng. Chem. Res. 53 (2014) 323–332. doi:10.1021/ie400814z.
124
[48] A.M. Tarditi, E.A. Lombardo, A.M. Avila, Xylene permeation transport through composite
Ba-ZSM-5/SS tubular membranes: Modeling the steady-state permeation, Ind. Eng. Chem.
Res. 47 (2008) 2377–2385. doi:10.1021/ie071296l.
[49] R. Krishna, J.M. van Baten, Highlighting pitfalls in the Maxwell-Stefan modeling of water-
alcohol mixture permeation across pervaporation membranes, J. Memb. Sci. 360 (2010)
476–482. doi:10.1016/j.memsci.2010.05.049.
[50] R. Krishna, J.M. Van Baten, Hydrogen bonding effects in adsorption of water-alcohol
mixtures in zeolites and the consequences for the characteristics of the Maxwell-Stefan
diffusivities, Langmuir. 26 (2010) 10854–10867. doi:10.1021/la100737c.
[51] R. Krishna, J.M. van Baten, Maxwell-Stefan modeling of slowing-down effects in mixed
gas permeation across porous membranes, J. Memb. Sci. 383 (2011) 289–300.
doi:10.1016/j.memsci.2011.08.067.
[52] P. Bai, M. Tsapatsis, J.I. Siepmann, Multicomponent adsorption of alcohols onto silicalite-
1 from aqueous solution: Isotherms, structural analysis, and assessment of ideal adsorbed
solution theory, Langmuir. 28 (2012) 15566–15576. doi:10.1021/la303247c.
[53] L. Lu, Y. Zhu, X. Wu, S. Wang, W. Cao, X. Lu, Adsorption of N-Butane/I-Butane in
Zeolites: Simulation and Theory Study, Sep. Sci. Technol. 49 (2014) 1215–1226.
doi:10.1080/01496395.2013.878848.
[54] S. Brandani, M. Jama, D.M. Ruthven, Counterdiffusion of p-Xylene/Benzene and p-
Xylene/o-Xylene in Silicalite Studied by the Zero-Length Column Technique, (2000).
doi:10.1021/IE990691B.
[55] R. Krishna, J.A. Wesselingh, The Maxwell-Stefan approach to mass transfer, Chem. Eng.
Sci. 52 (1997) 861–911.
[56] R. Krishna, R. Baur, Modelling issues in zeolite based separation processes, Sep. Purif.
Technol. 33 (2003) 213–254. doi:10.1016/S1383-5866(03)00008-X.
[57] R. Krishna, The Maxwell-Stefan description of mixture diffusion in nanoporous crystalline
materials, Microporous Mesoporous Mater. 185 (2014) 30–50.
doi:10.1016/j.micromeso.2013.10.026.
[58] F.J. Keil, R. Krishna, M.O. Coppens, Modeling of Diffusion in Zeolites, Rev. Chem. Eng.
16 (2000). doi:10.1515/REVCE.2000.16.2.71.
[59] A.I. Skoulidas, D.S. Sholl, Multiscale models of sweep gas and porous support effects on
zeolite membranes, AIChE J. 51 (2005) 867–877. doi:10.1002/aic.10335.
[60] T.J.H. Vlugt, R. Krishna, B. Smit, Molecular Simulations of Adsorption Isotherms for
Linear and Branched Alkanes and Their Mixtures in Silicalite, J. Phys. Chem. B. 103 (1999)
1102–1118. doi:10.1021/jp982736c.
[61] P.F. Lito, A.S. Santiago, S.P. Cardoso, B.R. Figueiredo, C.M. Silva, New expressions for
single and binary permeation through zeolite membranes for different isotherm models, J.
Memb. Sci. 367 (2011) 21–32. doi:10.1016/j.memsci.2010.10.034.
[62] R. Krishna, D. Paschek, Permeation of Hexane Isomeres Across ZSM--5 Zeolite
Membranes, Ind. Eng. Chem. Res. 39 (2000) 2618–2622.
[63] A.L. Myers, J.M. Prausnltz, Thermodynamics of mixed-gas adsorption, AIChE J. 11 (1965)
121–127. doi:10.1002/aic.690110125.
[64] R. Krishna, D. Paschek, Separation of hydrocarbon mixtures using zeolite membranes: a
125
modelling approach combining molecular simulations with the Maxwell-Stefan theory, Sep.
Purif. Technol. 21 (2000) 111–136. doi:10.1016/S1383-5866(00)00196-9.
[65] D.P. Valenzuela, A.L. Myers, O. Talu, I. Zwiebel, Adsorption of gas mixtures: Effect of
energetic heterogeneity, AIChE J. 34 (1988) 397–402. doi:10.1002/aic.690340306.
[66] O. Talu, I. Zwiebel, Spreading pressure dependent equation for adsorbate phase activity
coefficients, React. Polym. Ion Exch. Sorbents. 5 (1987) 81–91. doi:10.1016/0167-
6989(87)90168-1.
[67] E. Costa, J.L. Sotelo, G. Calleja, C. Marrón, Adsorption of binary and ternary hydrocarbon
gas mixtures on activated carbon: Experimental determination and theoretical prediction of
the ternary equilibrium data, AIChE J. 27 (1981) 5–12. doi:10.1002/aic.690270103.
[68] E. Costa, G. Calleja, C. Marron, A. Jimenez, J. Pau, Equilibrium Adsorption of Methane,
Ethane, Ethylene, and Propylene and Their Mixtures on Activated Carbon, J. Chem. Eng.
Data. 34 (1989) 156–160. doi:Doi 10.1021/Je00056a003.
[69] S. Sochard, N. Fernandes, J.-M. Reneaume, Modeling of Adsorption Isotherm of a Binary
Mixture with Real Adsorbed Solution Theory and Nonrandom Two-Liquid Model Sabine,
AIChE J. 56 (2010) 3109. doi:10.1002/aic.
[70] A. Erto, A. Lancia, D. Musmarra, A Real Adsorbed Solution Theory model for competitive
multicomponent liquid adsorption onto granular activated carbon, Microporous
Mesoporous Mater. 154 (2012) 45–50. doi:10.1016/j.micromeso.2011.10.041.
[71] M. Mofarahi, F. Gholipour, Gas adsorption separation of CO2/CH4 system using zeolite
5A, Microporous Mesoporous Mater. 200 (2014) 1–10.
doi:10.1016/j.micromeso.2014.08.022.
[72] R. Krishna, J.M. Van Baten, S. Calero, C. De Utrera, Incorporating the Loading Dependence
of the Maxwell - Stefan Diffusivity in the Modeling of CH4 and CO2 Permeation Across
Zeolite Membranes, Ind. Eng. Chem. Res. (2007) 2974–2986.
[73] R. Krishna, J.M. van Baten, Insights into diffusion of gases in zeolites gained from
molecular dynamics simulations, Microporous Mesoporous Mater. 109 (2008) 91–108.
doi:10.1016/j.micromeso.2007.04.036.
[74] R. Krishna, J.M. Van Baten, Linking the loading dependence of the Maxwell-Stefan
diffusivity of linear alkanes in zeolites with the thermodynamic correction factor, Chem.
Phys. Lett. 420 (2006) 545–549. doi:10.1016/j.cplett.2006.01.039.
[75] C. Chmelik, L. Heinke, J. Kärger, W. Schmidt, D.B. Shah, J.M. van Baten, R. Krishna,
Inflection in the loading dependence of the Maxwell-Stefan diffusivity of iso-butane in MFI
zeolite, Chem. Phys. Lett. 459 (2008) 141–145. doi:10.1016/j.cplett.2008.05.023.
[76] R. Krishna, J.M. van Baten, Influence of adsorption thermodynamics on guest diffusivities
in nanoporous crystalline materials, Phys. Chem. Chem. Phys. 15 (2013) 7994.
doi:10.1039/c3cp50449b.
[77] D.P. and, R. Krishna, Diffusion of Binary Mixtures in Zeolites: Kinetic Monte Carlo versus
Molecular Dynamics Simulations, (2000). doi:10.1021/LA000695H.
[78] R. Krishna, J.M. van Baten, Unified Maxwell-Stefan description of binary mixture diffusion
in micro- and meso-porous materials, Chem. Eng. Sci. 64 (2009) 3159–3178.
doi:10.1016/j.ces.2009.03.047.
[79] D.M. Ruthven, M. Eic, E. Richard, Diffusion of C8 aromatic hydrocarbons in silicalite,
Zeolites. 11 (1991) 647–653. doi:10.1016/S0144-2449(05)80166-6.
126
[80] S. Brandani, M. Jama, D. Ruthven, Diffusion, self-diffusion and counter-diffusion of
benzene and p-xylene in silicalite, Microporous Mesoporous Mater. 35–36 (2000) 283–300.
doi:10.1016/S1387-1811(99)00228-0.
[81] G. Xomeritakis, S. Nair, M. Tsapatsis, Transport properties of alumina-supported MFI
membranes made by secondary (seeded) growth, Microporous Mesoporous Mater. 38
(2000) 61–73. doi:10.1016/S1387-1811(99)00300-5.
[82] J.B. Lee, H.H. Funke, R.D. Noble, J.L. Falconer, Adsorption-induced expansion of defects
in MFI membranes, J. Memb. Sci. 341 (2009) 238–245. doi:10.1016/j.memsci.2009.06.011.
[83] R. Krishna, J.M. van Baten, Diffusion of hydrocarbon mixtures in MFI zeolite: Influence of
intersection blocking, Chem. Eng. J. 140 (2008) 614–620. doi:10.1016/j.cej.2007.11.026.
[84] K. Zhang, R.P. Lively, M.E. Dose, L. Li, W.J. Koros, D.M. Ruthven, B.A. McCool, R.R.
Chance, Diffusion of water and ethanol in silicalite crystals synthesized in fluoride media,
Microporous Mesoporous Mater. 170 (2013) 259–265.
doi:10.1016/j.micromeso.2012.12.015.
[85] K. Zhang, R.P. Lively, C. Zhang, W.J. Koros, R.R. Chance, Investigating the Intrinsic
Ethanol / Water Separation Capability of ZIF-8 : An Adsorption and Di ff usion Study, J.
Phys. Chem. C. 117 (2013) 7214–7225.
[86] K. Zhang, R.P. Lively, M.E. Dose, A.J. Brown, C. Zhang, J. Chung, S. Nair, W.J. Koros,
R.R. Chance, Alcohol and water adsorption in zeolitic imidazolate frameworks, Chem.
Commun. 49 (2013) 3245. doi:10.1039/c3cc39116g.
[87] S.K. Wirawan, D. Creaser, J. Lindmark, J. Hedlund, I.M. Bendiyasa, W.B. Sediawan,
H2/CO2permeation through a silicalite-1 composite membrane, J. Memb. Sci. 375 (2011)
313–322. doi:10.1016/j.memsci.2011.03.061.
[88] J. Shao, Z. Zhan, J. Li, Z. Wang, K. Li, Y. Yan, Zeolite NaA membranes supported on
alumina hollow fibers: Effect of support resistances on pervaporation performance, J.
Memb. Sci. 451 (2014) 10–17. doi:10.1016/j.memsci.2013.09.049.
[89] J.M. Van De Graaf, F. Kapteijn, J.A. Moulijn, Methodological and operational aspects of
permeation measurements on silicalite-1 membranes, J. Memb. Sci. 144 (1998) 87–104.
doi:10.1016/S0376-7388(98)00032-5.
[90] J.M. Van De Graaf, E. Van Der Bijl, A. Stol, F. Kapteijn, J.A. Moulijn, Effect of operating
conditions and membrane quality on the separation performance of composite silicalite-1
membranes, Ind. Eng. Chem. Res. 37 (1998) 4071–4083. doi:10.1021/ie980250c.
[91] H. Li, U. Schygulla, J. Hoffmann, P. Niehoff, K. Haas-Santo, R. Dittmeyer, Experimental
and modeling study of gas transport through composite ceramic membranes, Chem. Eng.
Sci. 108 (2014) 94–102. doi:10.1016/j.ces.2013.12.030.
[92] A.M. Avila, H.H. Funke, Y. Zhang, J.L. Falconer, R.D. Noble, Concentration polarization
in SAPO-34 membranes at high pressures, J. Memb. Sci. 335 (2009) 32–36.
doi:10.1016/j.memsci.2009.02.028.
[93] M. Grahn, J. Hedlund, Maxwell-Stefan modeling of high flux tubular silicalite-1
membranes for CO2removal from CO2/H2gas mixtures, J. Memb. Sci. 471 (2014) 328–
337. doi:10.1016/j.memsci.2014.08.034.
[94] S. Farooq, I.A. Karimi, Modeling support resistance in zeolite membranes, J. Memb. Sci.
186 (2001) 109–121. doi:10.1016/S0376-7388(00)00671-2.
[95] J.G. Martinek, T.Q. Gardner, R.D. Noble, J.L. Falconer, Modeling transient permeation of
127
binary mixtures through zeolite membranes, Ind. Eng. Chem. Res. 45 (2006) 6032–6043.
doi:10.1021/ie060166u.
[96] E.N. Fuller, P.D. Schettler, J.C. Giddings, A new method for prediction of binary gas-phase
diffusion coefficients, Ind. Eng. Chem. 58 (1966) 18–27. doi:10.1021/ie50677a007.
[97] F. Kapteijn, W.J.W. Bakker, J. van de Graaf, G. Zheng, J. Poppe, J.A. Moulijn, Permeation
and separation behaviour of a silicalite-1 membrane, Catal. Today. 25 (1995) 213–218.
doi:10.1016/0920-5861(95)00078-T.
[98] S. Bhattacharya, S.-T. Hwang, Concentration polarization, separation factor, and Peclet
number in membrane process, J. Memb. Sci. (1997) 73–90.
[99] G. He, Y. Mi, P.L. Yue, G. Chen, Theoretical study on concentration polarization in gas
separation membrane processes., J. Membr. Sci. 153 (1999) 243–258.
[100] B. Raghunath, S.T. Hwang, Effect of boundary layer mass transfer resistance in the
pervaporation of dilute organics, J. Memb. Sci. 65 (1992) 147–161. doi:10.1016/0376-
7388(92)87061-2.
[101] G. Ji, G. Wang, K. Hooman, S. Bhatia, J.C. Diniz da Costa, Simulation of binary gas
separation through multi-tube molecular sieving membranes at high temperatures, Chem.
Eng. J. 218 (2013) 394–404. doi:10.1016/j.cej.2012.12.063.
[102] G. Ji, G. Wang, K. Hooman, S. Bhatia, J.C. Diniz da Costa, The fluid dynamic effect on the
driving force for a cobalt oxide silica membrane module at high temperatures, Chem. Eng.
Sci. 111 (2014) 142–152. doi:10.1016/j.ces.2014.02.006.
[103] X. Feng, R.Y.M. Huang, Concentration polarization in pervaporation separation processes,
J. Memb. Sci. 92 (1994) 201–208. doi:10.1016/0376-7388(94)00056-5.
[104] W.M. (William M. Deen, Analysis of transport phenomena, n.d.
[105] S. (Sadık) Kakac, R.K. Shah, W. Aung, Handbook of single-phase convective heat transfer,
Wiley, 1987.
[106] E. Kim, J. Choi, M. Tsapatsis, On defects in highly a-oriented MFI membranes,
Microporous Mesoporous Mater. 170 (2013) 1–8. doi:10.1016/j.micromeso.2012.11.023.
[107] J. Hedlund, D. Korelskiy, L. Sandström, J. Lindmark, Permporometry analysis of zeolite
membranes, J. Memb. Sci. 345 (2009) 276–287. doi:10.1016/j.memsci.2009.09.012.
[108] E.E. Mallon, M.Y. Jeon, M. Navarro, A. Bhan, M. Tsapatsis, Probing the relationship
between silicalite-1 defects and polyol adsorption properties, Langmuir. 29 (2013) 6546–
6555. doi:10.1021/la4001494.
[109] M.E. Dose, K. Zhang, J.A. Thompson, J. Leisen, R.R. Chance, W.J. Koros, B.A. McCool,
R.P. Lively, Effect of crystal size on framework defects and water uptake in fluoride
mediated silicalite-1, Chem. Mater. 26 (2014) 4368–4376. doi:10.1021/cm500914b.
[110] P.H. Nelson, M. Tsapatsis, S.M. Auerbach, Modeling permeation through anisotropic
zeolite membranes with nanoscopic defects, J. Memb. Sci. 184 (2001) 245–255.
doi:10.1016/S0376-7388(00)00641-4.
[111] J. Kangas, L. Sandström, I. Malinen, J. Hedlund, J. Tanskanen, Maxwell-Stefan modeling
of the separation of H2and CO2at high pressure in an MFI membrane, J. Memb. Sci. 435
(2013) 186–206. doi:10.1016/j.memsci.2013.02.026.
[112] W. Ding, H. Li, P. Pfeifer, R. Dittmeyer, Crystallite-pore network model of transport and
reaction of multicomponent gas mixtures in polycrystalline microporous media, Chem. Eng.
128
J. 254 (2014) 545–558. doi:10.1016/j.cej.2014.05.081.
[113] G. Soave, Equilibrium constants from a modified Redlich-Kwong equation of state, Chem.
Eng. Sci. 27 (1972) 1197–1203. doi:10.1016/0009-2509(72)80096-4.
[114] J.F. Ely, H.J.M. Hanley, Prediction of transport properties. 1. Viscosity of fluids and
mixtures, Ind. Eng. Chem. Fundam. 20 (1981) 323–332. doi:10.1021/i100004a004.
[115] Process Systems Enterprise, gPROMS, www.psenterprise.com/gproms, 1997-2018, (n.d.).
[116] S. Moganti, R.D. Noble, C.A. Kovalb, Analysis of a membrane / distillation column hybrid
process, J. Memb. Sci. 93 (1994).
[117] W. Stephan, R.D. Noble, C.A. Koval, Design methodology for a membrane / distillation
column hybrid process, J. Memb. Sci. 99 (1995) 259–272.
[118] T. Pettersen, K.M. Lien, Design of hybrid distillation and vapor permeation processes, J.
Memb. Sci. 102 (1995) 21–30. doi:10.1016/0376-7388(94)00216-L.
[119] T.G. Pressly, K.M. Ng, A Break-Even Analysis of Distillation-Membrane Hybrids, AIChE
J. 44 (1998) 93–105.
[120] T. Titze, C. Chmelik, J. Kärger, J.M. van Baten, R. Krishna, Uncommon Synergy between
Adsorption and Diffusion of Hexane Isomer Mixtures in MFI Zeolite Induced by
Configurational Entropy Effects, J. Phys. Chem. C. 118 (2014) 2660–2665.
doi:10.1021/jp412526t.
[121] H. Stach, U. Lohse, H. Thamm, W. Schirmer, Adsorption equilibria of hydrocarbons on
highly dealuminated zeolites, Zeolites. 6 (1986) 74–90. doi:10.1016/S0144-
2449(86)80001-X.
[122] R.E. Richards, L.V.C. Rees, Sorption and Packing of n-Alkane Molecules in ZSM-5,
Langmuir. 3 (1987) 335–340. doi:10.1021/la00075a009.
[123] M.S. Sun, D.B. Shah, H.H. Xu, O. Talu, Adsorption Equilibria of C1 to C4 Alkanes, CO2 ,
and SF6 on Silicalite, J. Phys. Chem. B. 102 (1998) 1466–1473. doi:10.1021/jp9730196.
[124] W. Zhu, J.M. Van De Graaf, L.J.P. Van Den Broeke, F. Kapteijn, J.A. Moulijn, TEOM: a
unique technique for measuring adsorption properties. Light alkanes in silicalite-1, Ind. Eng.
Chem. Res. 37 (1998) 1934–1942. doi:10.1021/ie970739q.
[125] W. Zhu, F. Kapteijn, J.A. Moulijn, Adsorption of light alkanes on silicalite-1 :
Reconciliation of experimental data and molecular simulations, Phys. Chem. Chem. Phys.
(2000) 1989–1995.
[126] H.B. Abdul-Rehman, M.A. Hasanain, K.F. Loughlin, Quaternary , Ternary , Binary , and
Pure Component Sorption on Zeolites . Pressures, Ind. Eng. Chem. Res. 29 (1990) 1525–
1535.
[127] R.L. June, A.T. Bell, D.N. Theodorou, Prediction of Low Occupamy Sorption of Alkanes
in, J. Phys. Chem. (1990) 1508–1516.
[128] B. Smit, J.I. Siepmann, Computer simulations of the energetics and siting of n-alkanes in
zeolites, J. Phys. Chem. 98 (1994) 8442–8452. doi:10.1021/j100085a027.
[129] E.J. Maginn, A.T. Bell, D.N. Theodorou, Sorption thermodynamics, siting, and
conformation of long n-alkanes in silicalite as predicted by configurational-bias Monte
Carlo integration, J. Phys. Chem. 99 (1995) 2057–2079. doi:10.1021/j100007a042.
[130] H. Thamm, Adsorption site heterogeneity in silicalite: a calorimetric study, Zeolites. 7
(1987) 341–346. doi:10.1016/0144-2449(87)90037-6.
129
[131] H. Thamm, Calorimetric study on the state of C1-C4 alcohols sorbed on silicalite, J. Chem.
Soc. Faraday Trans. 1. 85 (1989) 1. doi:10.1039/f19898500001.
[132] T.J.H. Vlugt, W. Zhu, F. Kapteijn, J.A. Moulijn, R. Krishna, B. Smit, Adsorption Isotherms
of Linear and Branched Alkanes in the Zeolite Silicalite-I, J. Am. Chem. Soc. 120 (1998)
5599–5600. doi:10.1021/ja974336t.
[133] R. Krishna, D. Paschek, Separation of hydrocarbon mixtures using zeolite membranes: A
modelling approach combining molecular simulations with the Maxwell-Stefan theory, Sep.
Purif. Technol. 21 (2000) 111–136. doi:10.1016/S1383-5866(00)00196-9.
[134] C. Chmelik, L. Heinke, J.M. van Baten, R. Krishna, Diffusion of n-butane/iso-butane
mixtures in silicalite-1 investigated using infrared (IR) microscopy, Microporous
Mesoporous Mater. 125 (2009) 11–16. doi:10.1016/j.micromeso.2009.02.015.
[135] K.P. Datema, C.J.J. Denouden, W.D. Ylstra, H.P.C.E. Kuipers, M.F.M. Post, J. Kärger,
Fourier-Transform Pulsed-Field-Gradient H-1 Nuclear-Magnetic- Resonance Investigation
of the Diffusion of Light Normal-Alkanes in Zeolite ZSM-5, J. Chem. Soc. Faraday Trans.
87 (1991) 1935–1943.
[136] W. Heink, J. Karger, H. Pfeifer, K.P. Datema, A.K. Nowak, High-temperature Pulsed Field
Gradient Nuclear Magnetic Resonance Self-diff, J. Chem. Soc., Faraday. Trans. 88 (1992)
3505–3509.
[137] A. Pampel, M. Fernandez, D. Freude, J. Kärger, New options for measuring molecular
diffusion in zeolites by MAS PFG NMR, Chem. Phys. Lett. 407 (2005) 53–57.
doi:10.1016/j.cplett.2005.03.062.
[138] S. Brandani, J. Caro, H. Jobic, J. Kärger, C. Krause, R. Staudt, Diffusion of n-alkanes in
zeolites: the benefit of observation over different length scales, Elsevier B.V., 2007.
doi:10.1016/S0167-2991(07)80949-9.
[139] M. Fernandez, J. Kärger, D. Freude, A. Pampel, J.M. van Baten, R. Krishna, Mixture
diffusion in zeolites studied by MAS PFG NMR and molecular simulation, Microporous
Mesoporous Mater. 105 (2007) 124–131. doi:10.1016/j.micromeso.2007.05.042.
[140] K. Banas, F. Brandani, D.M. Ruthven, F. Stallmach, J. Kärger, Combining macroscopic and
microscopic diffusion studies in zeolites using NMR techniques, Magn. Reson. Imaging. 23
(2005) 227–232. doi:10.1016/j.mri.2004.11.015.
[141] H. Jobic, Diffusion of linear and branched alkanes in ZSM-5. A quasi-elastic neutron
scattering study, J. Mol. Catal. A Chem. 158 (2000) 135–142. doi:10.1016/S1381-
1169(00)00057-1.
[142] B. Millot, A. Méthivier, H. Jobic, H. Moueddeb, M. Bée, Diffusion of Isobutane in ZSM-5
Zeolite: A Comparison of Quasi-Elastic Neutron Scattering and Supported Membrane
Results, J. Phys. Chem. B. 103 (1999) 1096–1101. doi:10.1021/jp982897g.
[143] A.S. Chiang, A.G. Dixon, Y.H. Ma, The determination of zeolite crystal diffusivity by gas
chromatography-II. Experimental, Chem. Eng. Sci. 39 (1984) 1461–1468.
doi:10.1016/0009-2509(84)80004-4.
[144] J.R. Hufton, R.P. Danner, Chromatographic study of alkanes in silicalite: Equilibrium
properties, AIChE J. 39 (1993) 954–961. doi:10.1002/aic.690390605.
[145] T. a Nijhuis, L.J.P. Van Den Broeke, M.J.G. Linders, J.M. Van De Graaf, F. Kapteijn, M.
Makkee, J. a Moulijn, Measurement and modeling of the transient adsorption , desorption
and diffusion processes in microporous materials, Chem. Eng. Sci. 54 (1999) 4423–4436.
130
[146] T.A. Nijhuis, L.J.P. van den Broeke, M.J.G. Linders, M. Makkee, F. Kapteijn, J.A. Moulijn,
Modeling of the transient sorption and diffusion processes in microporous materials at low
pressure, Catal. Today. 53 (1999) 189–205. doi:http://dx.doi.org/10.1016/S0920-
5861(99)00116-9.
[147] J.R. Hufton, D.M. Ruthven, Diffusion of Light Alkanes in Silicalite Studied by the Zero
Length Column Method, Ind. Eng. Chem. Res. 32 (1993) 2379–2386.
doi:10.1021/ie00022a022.
[148] M. Jiang, M. Eic, S. Miachon, J.A. Dalmon, M. Kocirik, Diffusion of n-butane, isobutane
and ethane in a MFI-zeolite membrane investigated by gas permeation and ZLC
measurements, Sep. Purif. Technol. 25 (2001) 287–295. doi:10.1016/S1383-
5866(01)00055-7.
[149] M. Jiang, M. Eić, Transport properties of ethane, butanes and their binary mixtures in MFI-
type zeolite and zeolite-membrane samples, Adsorption. 9 (2003) 225–234.
doi:10.1023/A:1024797716739.
[150] W. Zhu, A. Malekian, M. Eić, F. Kapteijn, J.A. Moulijn, Concentration-dependent diffusion
of isobutane in silicalite-1 studied with ZLC technique, Chem. Eng. Sci. 59 (2004) 3827–
3835. doi:10.1016/j.ces.2004.06.007.
[151] A.P. Guimarães, A. Möller, R. Staudt, D.C.S. De Azevedo, S.M.P. Lucena, C.L. Cavalcante,
Diffusion of linear paraffins in silicalite studied by the ZLC method in the presence of CO2,
Adsorption. 16 (2010) 29–36. doi:10.1007/s10450-010-9205-6.
[152] D.T. Hayhurst, A.R. Paravar, Diffusion of C1 to C5 normal paraffins in silicalite, Zeolites.
8 (1988) 27–29. doi:10.1016/S0144-2449(88)80025-3.
[153] D.B. Shah, S. Chokchai-Acha, D.T. Hayhurst, Measurements of transport rates of C4
hydrocarbons across a single-crystal silicalite membrane, J. Chem. Soc. Faraday Trans. 89
(1993) 3161. doi:10.1039/ft9938903161.
[154] O. Talu, M.S. Sun, D.B. Shah, Diffusivities of n-alkanes in silicalite by steady-state single-
crystal membrane technique, AIChE J. 44 (1998) 681–694. doi:10.1002/aic.690440316.
[155] M.S. Sun, O. Talu, D.B. Shah, Diffusion Measurements through Embedded Zeolite
Crystals, AIChE J. 42 (1996) 3001–3007. doi:10.1002/aic.690421102.
[156] O. Geier, S. Vasenkov, E. Lehmann, J. Kärger, U. Schemmert, R.A. Rakoczy, J. Weitkamp,
Interference microscopy investigation of the influence of regular intergrowth effects in
MFI-type zeolites on molecular uptake, J. Phys. Chem. B. 105 (2001) 10217–10222.
doi:10.1021/jp010777u.
[157] P. Kortunov, S. Vasenkov, C. Chmelik, J. Kärger, D.M. Ruthven, J. Wloch, Influence of
defects on the external crystal surface on molecular uptake into MFI-type zeolites, Chem.
Mater. 16 (2004) 3552–3558. doi:10.1021/cm0401645.
[158] C. Chmelik, P. Kortunov, S. Vasenkov, J. Kärger, Internal transport resistances and their
influence on diffusion in zeolites as traced by microscopic measuring techniques,
Adsorption. 11 (2005) 455–460. doi:10.1007/s10450-005-5967-7.
[159] C. Chmelik, A. Varma, L. Heinke, D.B. Shah, J. Kärger, F. Kremer, U. Wilczok, W.
Schmidt, Effect of surface modification on uptake rates of isobutane in MFI crystals: An
infrared microscopy study, Chem. Mater. 19 (2007) 6012–6019. doi:10.1021/cm071632o.
[160] L.V.C. Rees, P.C. Laboratories, Adsorption and diffusion 2-butyne in silicalite-I, Zeolites.
11 (1991) 684–689.
131
[161] A. Möller, A. Pessoa Guimaraes, R. Gläser, R. Staudt, Uptake-curves for the determination
of diffusion coefficients and sorption equilibria for n-alkanes on zeolites, Microporous
Mesoporous Mater. 125 (2009) 23–29. doi:10.1016/j.micromeso.2009.04.029.
[162] R.L. June, A.T. Bell, D.N. Theodorou, Molecular Dynamics Studies of Butane and Hexane
in Siiicalite, J. Phys. Chem. 96 (1992) 1051–1060. doi:10.1021/j100182a009.
[163] H. Jobic, D.N. Theodorou, Diffusion of long n-alkanes in silicalite. A comparison between
neutron scattering experiments and hierarchical simulation results, J. Phys. Chem. B. 110
(2006) 1964–1967. doi:10.1021/jp056924w.
[164] R.C. Runnebaum, E.J. Maginn, Molecular Dynamics Simulations of Alkanes in the Zeolite
Silicalite: Evidence for Resonant Diffusion Effects, J. Phys. Chem. 101 (1997) 6394–6408.
doi:10.1021/jp970774a.
[165] A. Bouyermaouen, A. Bellemans, Molecular dynamics simulation of the diffusion of n-
butane and i-butane in silicalite, J. Chem. Phys. 108 (1998) 2170–2172.
doi:10.1063/1.475596.
[166] L.N. Gergidis, D.N. Theodorou, Molecular Dynamics Simulation of n-Butane-Methane
Mixtures in Silicalite, J. Phys. Chem. B. 103 (1999) 3380–3390. doi:10.1021/jp983680p.
[167] D. Paschek, R. Krishna, Monte Carlo simulations of sorption and di€ usion of isobutane in
silicalite, 342 (2001) 148–154.
[168] D. Shen, L.V.C. Rees, J. Caro, M. Bulow, B. Zibrowius, Diffusion of C4 Hydrocarbons in
Silicalite-1, J Chem. Soc. Faraday Trans. 86 (1990) 3943–3948.
[169] S. Goodbody, K. Watanabe, D. MacGowan, J.P. Walton, N. Quirke, Molecular Simulation
of Methane and Butane in Silicalite, J Chem. Soc. Faraday Trans. 87 (2007) 1951–1958.
doi:10.1080/08927029008022415.
[170] A.J. O’Malley, C.R.A. Catlow, M. Monkenbusch, H. Jobic, Diffusion of Isobutane in
Silicalite: A Neutron Spin-Echo and Molecular Dynamics Simulation Study, J. Phys. Chem.
C. 119 (2015) 26999–27006. doi:10.1021/acs.jpcc.5b08048.
[171] H. Jobic, A. Méthivier, G. Ehlers, B. Farago, W. Haeussler, Accelerated Diffusion of Long-
Chain Alkanes between Nanosized Cavities, Angew. Chemie - Int. Ed. 43 (2004) 364–366.
doi:10.1002/anie.200352691.
[172] H. Jobic, H. Ramanan, S.M. Auerbach, M. Tsapatsis, P. Fouquet, Probing cooperative jump-
diffusion in zeolites: Neutron spin-echo measurements and molecular dynamics simulations
of benzene in NaX, Microporous Mesoporous Mater. 90 (2006) 307–313.
doi:10.1016/j.micromeso.2005.11.006.
[173] V. Sebastian, R. Mallada, J. Coronas, A. Julbe, R.A. Terpstra, R.W.J. Dirrix, Microwave-
assisted hydrothermal rapid synthesis of capillary MFI-type zeolite – ceramic membranes
for pervaporation application, J. Memb. Sci. 355 (2010) 28–35.
doi:10.1016/j.memsci.2010.02.073.
[174] F. Kapteijn, W.J.W. Bakker, G. Zheng, J.A. Moulijn, Temperature- and occupancy-
dependent diffusion of n-butane through a silicalite-1 membrane, Microporous Mater. 3
(1994) 227–234. doi:10.1016/0927-6513(94)00035-2.
[175] W.J.W. Bakker, L.J.P. Van Den Broeke, F. Kapteijn, J.A. Moulijn, Temperature
Dependence of One-Component Permeation through a Silicalite-I Membrane, AIChE J. 43
(1997) 2203–2214.
[176] J.M. Van De Graaf, F. Kapteijn, J.A. Moulijn, Diffusivities of light alkanes in a silicalite-1
132
membrane layer, Microporous Mesoporous Mater. 35–36 (2000) 267–281.
doi:10.1016/S1387-1811(99)00227-9.
[177] F. Kapteijn, J. Poppe, J.A. Moulijn, Permeation characteristics of a metal-supported
silicalite-1 zeolite membrane, J. Memb. Sci. 117 (1996) 57–78.
[178] Z.A.E.P. Vroon, K. Keizer, M.J. Gilde, H. Verweij, A.J. Burggraaf, Transport properties of
alkanes through ceramic thin zeolite MFI membranes, J. Memb. Sci. 113 (1996) 293–300.
doi:10.1016/0376-7388(95)00128-X.
[179] A.J. Burggraaf, Z.A.E.P. Vroon, K. Keizer, H. Verweij, Permeation of single gases in thin
zeolite MFI membranes, J. Memb. Sci. 144 (1998) 77–86. doi:10.1016/S0376-
7388(98)00036-2.
[180] A.J. Burggraaf, Single gas permeation of thin zeolite (MFI) membranes: Theory and
analysis of experimental observations, J. Memb. Sci. 155 (1999) 45–65.
doi:10.1016/S0376-7388(98)00295-6.
[181] T.Q. Gardner, J.B. Lee, R.D. Noble, J.L. Falconer, Adsorption and Diffusion Properties of
Butanes in ZSM-5 Zeolite Membranes, Ind. Eng. Chem. Res. 41 (2002) 4094–4105.
doi:10.1021/ie020144h.
[182] T.Q. Gardner, J.L. Falconer, R.D. Noble, Adsorption and diffusion properties of zeolite
membranes by transient permeation, Desalination. 149 (2002) 435–440.
doi:10.1016/S0011-9164(02)00772-5.
[183] V.A. Tuan, J.L. Falconer, R.D. Noble, Alkali-free ZSM-5 membranes: Preparation
conditions and separation performance, Ind. Eng. Chem. Res. 38 (1999) 3635–3646.
doi:10.1021/ie980808g.
[184] H.K. Jeong, Z. Lai, M. Tsapatsis, J.C. Hanson, Strain of MFI crystals in membranes: An in
situ synchrotron X-ray study, Microporous Mesoporous Mater. 84 (2005) 332–337.
doi:10.1016/j.micromeso.2005.05.043.
[185] N. Rangnekar, M. Shete, K.V. Agrawal, B. Topuz, P. Kumar, Q. Guo, I. Ismail, A. Alyoubi,
S. Basahel, K. Narasimharao, C.W. Macosko, K.A. Mkhoyan, S. Al-Thabaiti, B. Stottrup,
M. Tsapatsis, 2D zeolite coatings: Langmuir-Schaefer deposition of 3 nm thick MFI zeolite
nanosheets, Angew. Chemie - Int. Ed. 54 (2015) 6571–6575. doi:10.1002/anie.201411791.
[186] J.N. Ghogomu, C. Guigui, J.C. Rouch, M.J. Clifton, P. Aptel, Hollow-fibre membrane
module design: Comparison of different curved geometries with Dean vortices, J. Memb.
Sci. 181 (2001) 71–80. doi:10.1016/S0376-7388(00)00364-1.
[187] H.B. Winzeler, G. Belfort, Enhanced performance for pressure-driven membrane processes:
the argument for fluid instabilities, J. Memb. Sci. 80 (1993) 35–47. doi:10.1016/0376-
7388(93)85130-O.
[188] K.T. Klemola, J.K. Ilme, Distillation efficiencies of an industrial-scale i-butane/n-butane
fractionator, Ind. Eng. Chem. Res. 35 (1996) 4579–4586. doi:10.1021/ie960390r.
[189] J.M. (James M. Douglas, Conceptual design of chemical processes, McGraw-Hill, 1988.
[190] R. Turton, Analysis, synthesis, and design of chemical processes, Prentice Hall, 2012.
[191] M. Morales, J. Quintero, R. Conejeros, G. Aroca, Life cycle assessment of lignocellulosic
bioethanol: Environmental impacts and energy balance, Renew. Sustain. Energy Rev. 42
(2015) 1349–1361. doi:10.1016/j.rser.2014.10.097.
[192] S.K. Thangavelu, A.S. Ahmed, F.N. Ani, Review on bioethanol as alternative fuel for spark
133
ignition engines, Renew. Sustain. Energy Rev. 56 (2016) 820–835.
doi:10.1016/j.rser.2015.11.089.
[193] B. Daylan, N. Ciliz, Life cycle assessment and environmental life cycle costing analysis of
lignocellulosic bioethanol as an alternative transportation fuel, Renew. Energy. 89 (2016)
578–587. doi:10.1016/J.RENENE.2015.11.059.
[194] M. Galbe, G. Zacchi, A review of the production of ethanol from softwood, Appl.
Microbiol. Biotechnol. 59 (2002) 618–628. doi:10.1007/s00253-002-1058-9.
[195] H. Chen, X. Fu, Industrial technologies for bioethanol production from lignocellulosic
biomass, Renew. Sustain. Energy Rev. 57 (2016) 468–478. doi:10.1016/j.rser.2015.12.069.
[196] A.J. Ragauskas, C.K. Williams, B.H. Davison, G. Britovsek, J. Cairney, C.A. Eckert, W.J.
Frederick Jr., J.P. Hallett, D.J. Leak, C.L. Liotta, J.R. Mielenz, R. Murphy, R. Templer, T.
Tschaplinski, The Path Forward for Biofuels and Biomaterials\r10.1126/science.1114736,
Science (80-. ). 311 (2006) 484–489. doi:10.1126/science.1114736.
[197] J.B. Haelssig, A.Y. Tremblay, J. Thibault, X.M. Huang, Membrane Dephlegmation: A
hybrid membrane separation process for efficient ethanol recovery, J. Memb. Sci. 381
(2011) 226–236. doi:10.1016/j.memsci.2011.07.035.
[198] C.A. Cardona Alzate, O.J. Sánchez Toro, Energy consumption analysis of integrated
flowsheets for production of fuel ethanol from lignocellulosic biomass, Energy. 31 (2006)
2111–2123. doi:10.1016/j.energy.2005.10.020.
[199] H.J. Huang, S. Ramaswamy, U.W. Tschirner, B. V. Ramarao, A review of separation
technologies in current and future biorefineries, Sep. Purif. Technol. 62 (2008) 1–21.
doi:10.1016/j.seppur.2007.12.011.
[200] N. Mittal, P. Bai, J.I. Siepmann, P. Daoutidis, M. Tsapatsis, Bioethanol enrichment using
zeolite membranes: Molecular modeling, conceptual process design and techno-economic
analysis, J. Memb. Sci. 540 (2017) 464–476. doi:10.1016/j.memsci.2017.06.075.
[201] L.M. Vane, Separation technologies for the recovery and dehydration of alcohols from
fermentation broths, Biofuels, Bioprod. Biorefining. 2 (2008) 553–588.
doi:10.1002/bbb.108.
[202] P. Taylor, P. Peng, B. Shi, Y. Lan, P. Peng, B. Shi, Y. Lan, Separation Science and
Technology A Review of Membrane Materials for Ethanol Recovery by Pervaporation A
Review of Membrane Materials for Ethanol Recovery by Pervaporation, Sep. Sci. Technol.
(2013) 37–41. doi:10.1080/01496395.2010.504681.
[203] L.M. Vane, A review of pervaporation for product recovery from biomass fermentation
processes †, J. Chem. Technol. Biotechnol. 629 (2005) 603–629. doi:10.1002/jctb.1265.
[204] V. Van Hoof, C. Dotremont, A. Buekenhoudt, Performance of Mitsui NaA type zeolite
membranes for the dehydration of organic solvents in comparison with commercial
polymeric pervaporation membranes, Sep. Purif. Technol. 48 (2006) 304–309.
doi:10.1016/J.SEPPUR.2005.06.019.
[205] Y. Morigami, M. Kondo, J. Abe, H. Kita, K. Okamoto, The first large-scale pervaporation
plant using tubular-type module with zeolite NaA membrane, Sep. Purif. Technol. 25 (2001)
251–260. doi:10.1016/S1383-5866(01)00109-5.
[206] J. Caro, M. Noack, P. Kölsch, Zeolite membranes: From the laboratory scale to technical
applications, Adsorption. 11 (2005) 215–227. doi:10.1007/s10450-005-5394-9.
[207] M. Weyd, H. Richter, P. Puhlf, I. Voigt, C. Hamel, A. Seidel-morgenstern, Transport of
134
binary water – ethanol mixtures through a multilayer hydrophobic zeolite membrane, J.
Memb. Sci. 307 (2008) 239–248. doi:10.1016/j.memsci.2007.09.032.
[208] P. Bai, M.Y. Jeon, L. Ren, C. Knight, M.W. Deem, M. Tsapatsis, J.I. Siepmann, Discovery
of optimal zeolites for challenging separations and chemical transformations using
predictive materials modeling, Nat. Commun. 6 (2015) 1–9. doi:10.1038/ncomms6912.
[209] M. Trzpit, M. Soulard, J. Patarin, N. Desbiens, F. Cailliez, A. Boutin, I. Demachy, A.H.
Fuchs, The effect of local defects on water adsorption in silicalite-1 zeolite: A joint
experimental and molecular simulation study, Langmuir. 23 (2007) 10131–10139.
doi:10.1021/la7011205.
[210] K. Sato, T. Nakane, A high reproducible fabrication method for industrial production of
high flux NaA zeolite membrane, J. Memb. Sci. 301 (2007) 151–161.
doi:10.1016/j.memsci.2007.06.010.
[211] M. Pera-Titus, C. Fité, V. Sebastián, E. Lorente, J. Llorens, F. Cunill, Modeling
pervaporation of ethanol/water mixtures within “real” zeolite NaA membranes, Ind. Eng.
Chem. Res. 47 (2008) 3213–3224. doi:10.1021/ie071645b.
[212] K. Sato, K. Aoki, K. Sugimoto, K. Izumi, S. Inoue, J. Saito, S. Ikeda, T. Nakane,
Dehydrating performance of commercial LTA zeolite membranes and application to fuel
grade bio-ethanol production by hybrid distillation/vapor permeation process, Microporous
Mesoporous Mater. 115 (2008) 184–188. doi:10.1016/J.MICROMESO.2007.10.053.
[213] Bin Chen, and Jeffrey J. Potoff, J.I. Siepmann, Monte Carlo Calculations for Alcohols and
Their Mixtures with Alkanes. Transferable Potentials for Phase Equilibria. 5. United-Atom
Description of Primary, Secondary, and Tertiary Alcohols, (2001).
doi:10.1021/JP003882X.
[214] W.L. Jorgensen, J. Chandrasekhar, J.D. Madura, R.W. Impey, M.L. Klein, Comparison of
simple potential functions for simulating liquid water, J. Chem. Phys. 79 (1983) 926–935.
doi:10.1063/1.445869.
[215] P. Bai, M. Tsapatsis, J.I. Siepmann, TraPPE-zeo: Transferable potentials for phase
equilibria force field for all-silica zeolites, J. Phys. Chem. C. 117 (2013) 24375–24387.
doi:10.1021/jp4074224.
[216] J.I. Siepmann, D. Frenkel, Configurational bias Monte Carlo: a new sampling scheme for
flexible chains, Mol. Phys. 75 (1992) 59–70. doi:10.1080/00268979200100061.
[217] M.G.M. and, J.I. Siepmann, Novel Configurational-Bias Monte Carlo Method for Branched
Molecules. Transferable Potentials for Phase Equilibria. 2. United-Atom Description of
Branched Alkanes, (1999). doi:10.1021/JP984742E.
[218] P. Bai, J.I. Siepmann, Assessment and Optimization of Configurational-Bias Monte Carlo
Particle Swap Strategies for Simulations of Water in the Gibbs Ensemble, J. Chem. Theory
Comput. 13 (2017) 431–440. doi:10.1021/acs.jctc.6b00973.
[219] A.Z. Panagiotopoulos, N. Quirke, M. Stapleton, D.J. Tildesley, Phase equilibria by
simulation in the Gibbs ensemble, Mol. Phys. 63 (1988) 527–545.
doi:10.1080/00268978800100361.
[220] Hoover, Canonical dynamics: Equilibrium phase-space distributions., Phys. Rev. A, Gen.
Phys. 31 (1985) 1695–1697. http://www.ncbi.nlm.nih.gov/pubmed/9895674 (accessed
February 25, 2018).
[221] W.C. Swope, H.C. Andersen, P.H. Berens, K.R. Wilson, A computer simulation method for
135
the calculation of equilibrium constants for the formation of physical clusters of molecules:
Application to small water clusters, J. Chem. Phys. 76 (1982) 637–649.
doi:10.1063/1.442716.
[222] M.P. Allen, D.J. Tildesley, Computer simulation of liquids, Clarendon Press, 1989.
[223] F. Cailliez, M. Trzpit, M. Soulard, I. Demachy, A. Boutin, J. Patarin, A.H. Fuchs,
Thermodynamics of water intrusion in nanoporous hydrophobic solids, Phys. Chem. Chem.
Phys. 10 (2008) 4817. doi:10.1039/b807471b.
[224] Y. Oumi, A. Miyajima, J. Miyamoto, T. Sano, Binary mixture adsorption of water and
ethanol on silicalite, Stud. Surf. Sci. Catal. 142 (2002) 1595–1602. doi:10.1016/S0167-
2991(02)80329-9.
[225] D.H. Olson, W.O. Haag, W.S. Borghard, Use of water as a probe of zeolitic properties:
Interaction of water with HZSM-5, Microporous Mesoporous Mater. 35–36 (2000) 435–
446. doi:10.1016/S1387-1811(99)00240-1.
[226] J. Caro, S. Hǒcevar, J. Kärger, L. Riekert, Intracrystalline self-diffusion of H2O and CH4
in ZSM-5 zeolites, Zeolites. 6 (1986) 213–216. doi:10.1016/0144-2449(86)90051-5.
[227] V.R. Choudhary, V.S. Nayak, T. V Choudhary, Single-Component Sorption / Diffusion of
Cyclic Compounds from Their Bulk Liquid Phase in H-ZSM-5 Zeolite, Society. (1997)
1812–1818.
[228] J.Z. Yang, Q.L. Liu, H.T. Wang, Analyzing adsorption and diffusion behaviors of ethanol /
water through silicalite membranes by molecular simulation, J. Memb. Sci. 291 (2007) 1–
9. doi:10.1016/j.memsci.2006.12.025.
[229] A. Özgür Yazaydin, R.W. Thompson, Molecular simulation of water adsorption in silicalite:
Effect of silanol groups and different cations, Microporous Mesoporous Mater. 123 (2009)
169–176. doi:10.1016/j.micromeso.2009.03.045.
[230] X. Zou, P. Bazin, F. Zhang, G. Zhu, V. Valtchev, Ethanol Recovery from Water Using
Silicalite-1 Membrane : An Operando Infrared Spectroscopic Study, Chem Plus Chem.
130012 (2012) 437–444. doi:10.1002/cplu.201200048.
[231] V.S. Nayak, J.B. Moffat, Sorption and diffusion of alcohols in heteropoly oxometalates and
ZSM-5 zeolite, J. Phys. Chem. 92 (1988) 7097–7102. doi:10.1021/j100336a014.
[232] Y.S. Lin, Y. Hua Ma, Liquid Diffusion and Adsorption of Aqueous Ethanol, Propanols, and
Butanols in Silicalite by HPLC, in: 1988: pp. 452–466. doi:10.1021/bk-1988-0368.ch028.
[233] F.A. Farhadpour, A. Bono, Sorptive separation of ethanol-water mixtures with a bi-
dispersed hydrophobic molecular sieve, silicalite: determination of the controlling mass
transfer mechanism, Chem. Eng. Process. Process Intensif. 35 (1996) 141–155.
doi:10.1016/0255-2701(95)04138-9.
[234] C. Bussai, S. Vasenkov, H. Liu, W. Böhlmann, S. Fritzsche, S. Hannongbua, R. Haberlandt,
J. Kärger, On the diffusion of water in silicalite-1: MD simulations using ab initio fitted
potential and PFG NMR measurements, Appl. Catal. A Gen. 232 (2002) 59–66.
doi:10.1016/S0926-860X(02)00066-2.
[235] M.U. Arı, M.G. Ahunbay, M. Yurtsever, A. Erdem-Senatalar, Molecular Dynamics
Simulation of Water Diffusion in MFI-Type Zeolites, J. Phys. Chem. B. 113 (2009) 8073–
8079. doi:10.1021/jp901986s.
[236] M.G. Ahunbay, Monte Carlo Simulation of Water Adsorption in Hydrophobic MFI Zeolites
with Hydrophilic Sites (vol 27, pg 4986, 2011), Langmuir. 27 (2011) 14703. doi:
136
10.1021/La2039174.
[237] R. Krishna, Diffusion of binary mixtures in zeolites: molecular dynamics simulations versus
Maxwell–Stefan theory, Chem. Phys. Lett. 326 (2000) 477–484. doi:10.1016/S0009-
2614(00)00846-0.
[238] R.W. Baker, J.G. Wijmans, Y. Huang, Permeability, permeance and selectivity: A preferred
way of reporting pervaporation performance data, J. Memb. Sci. 348 (2010) 346–352.
doi:10.1016/j.memsci.2009.11.022.
[239] N. Mittal, P. Bai, A. Kelloway, J.I. Siepmann, P. Daoutidis, M. Tsapatsis, A mathematical
model for zeolite membrane module performance and its use for techno-economic
evaluation of improved energy efficiency hybrid membrane-distillation processes for butane
isomer separations, J. Memb. Sci. 520 (2016) 434–449. doi:10.1016/j.memsci.2016.06.041.
[240] M. Nomura, T. Yamaguchi, S. Nakao, Ethanol / water transport through silicalite
membranes, J. Memb. Sci. 144 (1998) 161–171.
[241] T. Sano, H. Yanagishitab, K. Harayab, F. Mizukamib, K. Haraya, Separation of
ethanol/water mixture by silicalite membrane on pervaporation, J. Memb. Sci. 95 (1994)
221–228.
[242] X. Zhang, M. Zhu, R. Zhou, X. Chen, H. Kita, Synthesis of a Silicalite Zeolite Membrane
in Ultradilute Solution and Its Highly Selective Separation of Organic / Water Mixtures,
Ind. Eng. Chem. Res. 51 (2012) 11499–11508.
[243] X. Lin, H. Kita, K. Okamoto, Silicalite Membrane Preparation, Characterization, and
Separation Performance, Ind. Eng. Chem. Res. 40 (2001) 4069–4078.
doi:10.1021/ie0101947.
[244] H. Matsuda, H. Yanagishita, H. Negishi, D. Kitamoto, T. Ikegami, K. Haraya, T. Nakane,
Y. Idemoto, N. Koura, T. Sano, Improvement of ethanol selectivity of silicalite membrane
in pervaporation by silicone rubber coating, J. Memb. Sci. 210 (2002) 433–437.
[245] H. Chen, Y. Li, W. Yang, Preparation of silicalite-1 membrane by solution-filling method
and its alcohol extraction properties, J. Memb. Sci. 296 (2007) 122–130.
doi:10.1016/j.memsci.2007.03.021.
[246] J. Kuhn, S. Sutanto, J. Gascon, J. Gross, F. Kapteijn, Performance and stability of multi-
channel MFI zeolite membranes detemplated by calcination and ozonication in ethanol /
water pervaporation, J. Memb. Sci. 339 (2009) 261–274.
doi:10.1016/j.memsci.2009.05.006.
[247] B. Soydaş, Ö. Dede, A. Çulfaz, H. Kalipcilar, Separation of gas and organic/water mixtures
by MFI type zeolite membranes synthesized in a flow system, Microporous Mesoporous
Mater. 127 (2010) 96–103. doi:10.1016/j.micromeso.2009.07.004.
[248] D.J.O. Brien, L.H. Roth, A.J. Mcaloon, Ethanol production by continuous fermentation –
pervaporation : a preliminary economic analysis, J. Memb. Sci. 166 (2000) 105–111.
[249] N. Arifeen, R. Wang, I. Kookos, C. Webb, A. Koutinas, Process Design and Optimization
of Novel Wheat-Based Continuous Bioethanol Production System., Biotechnol Prog. 23
(2007) 1394–1403. doi:10.1021/bp0701517.
[250] J.A. Quintero, M.I. Montoya, O.J. Sánchez, O.H. Giraldo, C.A. Cardona, Fuel ethanol
production from sugarcane and corn: Comparative analysis for a Colombian case, Energy.
33 (2008) 385–399. doi:10.1016/j.energy.2007.10.001.
[251] F. Lipnizki, R.W. Field, P.-K. Ten, Pervaporation-based hybrid process: a review of process
137
design, applications and economics, J. Memb. Sci. 153 (1999) 183–210.
doi:10.1016/S0376-7388(98)00253-1.
[252] E. Nagy, P. Mizsey, J.Å. Hancsók, S. Boldyryev, P. Varbanov, Analysis of energy saving
by combination of distillation and pervaporation for biofuel production, Chem. Eng.
Process. Process Intensif. 98 (2015) 86–94.
[253] Y. Huang, R.W. Baker, L.M. Vane, Low-Energy Distillation-Membrane Separation
Process, Ind. Eng. Chem. Res. 49 (2010) 3760–3768.
[254] Y. Huang, J. Ly, D. Nguyen, R.W. Baker, Ethanol Dehydration Using Hydrophobic and
Hydrophilic Polymer Membranes, Ind Eng Chem Res. 49 (2010) 12067–12073.
[255] H. Nguyen, R.F. DeJaco, N. Mittal, J.I. Siepmann, M. Tsapatsis, M.A. Snyder, W. Fan, B.
Saha, D.G. Vlachos, A Review of Biorefinery Separations for Bioproduct Production via
Thermocatalytic Processing, Annu. Rev. Chem. Biomol. Eng. 8 (2017) 115–137.
doi:10.1146/annurev-chembioeng-060816-101303.
[256] D. Humbird, R. Davis, L. Tao, C. Kinchin, D. Hsu, A. Aden, Process Design and Economics
for Biochemical Conversion of Lignocellulosic Biomass to Ethanol: Dilute-Acid
Pretreatment and Enzymatic Hydrolysis of Corn Stover | Department of Energy, 2011.
https://energy.gov/eere/bioenergy/downloads/process-design-and-economics-biochemical-
conversion-lignocellulosic-biomass (accessed February 25, 2018).
[257] R. Power, Steam jet ejectors for the process industries, 1994.
[258] K. Sato, K. Sugimoto, T. Nakane, Preparation of higher flux NaA zeolite membrane on
asymmetric porous support and permeation behavior at higher temperatures up to 145 °C in
vapor permeation, J. Memb. Sci. 307 (2008) 181–195. doi:10.1016/j.memsci.2007.09.017.
[259] X. Shu, X. Wang, Q. Kong, X. Gu, N. Xu, High-Flux MFI Zeolite Membrane Supported on
YSZ Hollow Fiber for Separation of Ethanol / Water, Ind. Eng. Chem. Res. (2012).
[260] S. Xia, Y. Peng, Z. Wang, Microstructure manipulation of MFI-type zeolite membranes on
hollow fi bers for ethanol – water separation, J. Memb. Sci. 498 (2016) 324–335.
doi:10.1016/j.memsci.2015.10.024.
[261] H. Zhang, Q. Xiao, X. Guo, N. Li, P. Kumar, N. Rangnekar, M.Y. Jeon, S. Al-Thabaiti, K.
Narasimharao, S.N. Basahel, B. Topuz, F.J. Onorato, C.W. Macosko, K.A. Mkhoyan, M.
Tsapatsis, Open-Pore Two-Dimensional MFI Zeolite Nanosheets for the Fabrication of
Hydrocarbon-Isomer-Selective Membranes on Porous Polymer Supports, Angew. Chemie
- Int. Ed. 55 (2016) 7184–7187. doi:10.1002/anie.201601135.
[262] D.S. Sholl, R.P. Lively, Seven chemical separations to change the world, Nature. 532 (2016)
435–437. doi:10.1038/532435a.
[263] M. Eramo, Changing fundamentals and shattered paradigms, in: 32nd World Petrochemical
Conf., IHS Markit, 2017. http://cdn.ihs.com/www/Events/WPC2017/Presentations/IHSM-
Eramo-Touroftheworldglobal-March21.pdf (accessed January 19, 2018).
[264] M.S. Peters, K.D. Timmerhaus, R.E. (Ronald E. West, Plant design and economics for
chemical engineers., McGraw-Hill, 2003. https://www.amazon.com/Plant-Design-
Economics-Chemical-Engineers/dp/0072392665 (accessed January 19, 2018).
[265] J.A. Caballero, I.E. Grossmann, M. Keyvani, E.S. Lenz, N. Square, V. Pennsyl, Design of
Hybrid Distillation - Vapor Membrane Separation Systems, Ind. Eng. Chem. Res. 48 (2009)
9151–9162. doi:10.1021/ie900499y.
[266] V. Gokhale, S. Hurowitz, J.B. Riggs, A Comparison of Advanced Distillation Control
138
Techniques for a Propylene/Propane Splitter, Ind. Eng. Chem. Res. 34 (1995) 4413–4419.
doi:10.1021/ie00039a033.
[267] M. Azhin, T. Kaghazchi, M. Rahmani, A review on olefin/paraffin separation using
reversible chemical complexation technology, J. Ind. Eng. Chem. 14 (2008) 622–638.
doi:10.1016/J.JIEC.2008.04.014.
[268] R.B. Eldridge, Olefin/Paraffin Separation Technology: A Review, Ind. Eng. Chem. Res. 32
(1993) 2208–2212. doi:10.1021/ie00022a002.
[269] D.J. Safarik, R.B. Eldridge, Olefin/Paraffin Separations by Reactive Absorption: A Review,
Ind. Eng. Chem. Res. 37 (1998) 2571–2581. doi:10.1021/ie970897h.
[270] C.A. Grande, A.E. Rodrigues, Propane/propylene separation by Pressure Swing Adsorption
using zeolite 4A, Ind. Eng. Chem. Res. 44 (2005) 8815–8829. doi:10.1021/ie050671b.
[271] S.U. Rege, J. Padin, R.T. Yang, Olefin/Paraffin Separations by Adsorption: π-Complexation
vs. Kinetic Separation, AIChE J. 44 (1998) 799–809. doi:10.1002/aic.690440405.
[272] M. Galizia, W.S. Chi, Z.P. Smith, T.C. Merkel, R.W. Baker, B.D. Freeman, 50th
Anniversary Perspective: Polymers and Mixed Matrix Membranes for Gas and Vapor
Separation: A Review and Prospective Opportunities, Macromolecules. 50 (2017) 7809–
7843. doi:10.1021/acs.macromol.7b01718.
[273] A. Motelica, O.S.L. Bruinsma, R. Kreiter, M. Den Exter, J.F. Vente, Membrane retrofit
option for paraffin/olefin separation-a technoeconomic evaluation, Ind. Eng. Chem. Res. 51
(2012) 6977–6986. doi:10.1021/ie300587u.
[274] I.K. Kookos, Optimal Design of Membrane/Distillation Column Hybrid Processes, Ind.
Eng. Chem. Res. 42 (2003) 1731–1738. doi:10.1021/ie020616s.
[275] Y. Naidu, R.K. Malik, A generalized methodology for optimal configurations of hybrid
distillation-pervaporation processes, Chem. Eng. Res. Des. 89 (2011) 1348–1361.
doi:10.1016/j.cherd.2011.02.025.
[276] J. Park, K. Kim, J.W. Shin, K. Tak, Y.K. Park, Performance Study of multistage membrane
and hybrid distillation processes for propylene/propane separation, Can. J. Chem. Eng. 95
(2017) 2390–2397. doi:10.1002/cjce.22914.
[277] H.-J. Salgado-Gordon, G. Valbuena-Moreno, Technical and economic evaluation of the
separation of light olefins (ethylene and propylene) by using π-complexation with silver
salts, Ciencia, Tecnol. Y Futur. 4 (2011) 73–88.
[278] J.R. Alcántara-Avila, F.I. Gómez-Castro, J.G. Segovia-Hernández, K.I. Sotowa, T.
Horikawa, Optimal design of cryogenic distillation columns with side heat pumps for the
propylene/propane separation, Chem. Eng. Process. Process Intensif. 82 (2014) 112–122.
doi:10.1016/j.cep.2014.06.006.
[279] A.A. Shenvi, D.M. Herron, R. Agrawal, Energy efficiency limitations of the conventional
heat integrated distillation column (HIDiC) configuration for binary distillation, Ind. Eng.
Chem. Res. 50 (2011) 119–130. doi:10.1021/ie101698f.
[280] R.W. Baker, A.R. Da Costa, R. Daniels, I. Pinnau, Z. He, Membrane-augmented
polypropylene manufacturing, US 6,271,319 B1, 2000.
https://www.google.com/patents/US6271319 (accessed January 20, 2018).
[281] NIST, Propane - phase change data,.
http://webbook.nist.gov/cgi/cbook.cgi?ID=C74986&Mask=4#Thermo-Phase.
139
[282] NIST, Propene - phase change data,.
http://webbook.nist.gov/cgi/cbook.cgi?ID=C115071&Mask=4#Thermo-Phase.
[283] A.A. Kiss, S.J. Flores Landaeta, C.A.I. Ferreira, Towards energy efficient distillation
technologies e Making the right choice, Energy. 47 (2012) 531–542.
doi:10.1016/j.energy.2012.09.038.
[284] T.M. Zygula, K. Kolmetz, Design Considerations for Propylene Splitters, in: AIChE Spring
Meet. Glob. Congr. Process Saf., Chicago, 2011: p. 96f.
https://www.aiche.org/conferences/aiche-spring-meeting-and-global-congress-on-process-
safety/2011/proceeding/paper/96f-design-considerations-propylene-splitters-0 (accessed
January 19, 2018).
[285] D.F. Schneider, Heat integration complicates heat pump troubleshooting, Strat. Eng. Inc.
(2001) 1–13.
[286] R.L. Burns, W.J. Koros, Defining the challenges for C3H6/C3H8 separation using
polymeric membranes, J. Memb. Sci. 211 (2003) 299–309. doi:10.1016/S0376-
7388(02)00430-1.
[287] M. Rungta, C. Zhang, J.W. Koros, L. Xu, Membrane-Based Ethylene/Ethane Separation:
The Upper Bound and Beyond, AIChE J. 59 (2013) 3475–3489.
[288] R. Faiz, K. Li, Polymeric membranes for light olefin/paraffin separation, Desalination. 287
(2012) 82–97. doi:10.1016/j.desal.2011.11.019.
[289] R. Faiz, K. Li, Olefin/paraffin separation using membrane based facilitated
transport/chemical absorption techniques, Chem. Eng. Sci. 73 (2012) 261–284.
doi:10.1016/j.ces.2012.01.037.
[290] X. Ma, Y.S. Lin, X. Wei, J. Kniep, Ultrathin carbon molecular sieve membrane for
propylene/propane separation, AIChE J. 62 (2016) 491–499. doi:10.1002/aic.15005.
[291] L. Xu, M. Rungta, M.K. Brayden, M. V. Martinez, B.A. Stears, G.A. Barbay, W.J. Koros,
Olefins-selective asymmetric carbon molecular sieve hollow fiber membranes for hybrid
membrane-distillation processes for olefin/paraffin separations, J. Memb. Sci. 423–424
(2012) 314–323. doi:10.1016/j.memsci.2012.08.028.
[292] X. Ma, P. Kumar, N. Mittal, A. Khlyustova, P. Daoutidis, K.A. Mkhoyan, M. Tsapatsis,
Zeolitic imidazolate framework membranes made by ligand-induced permselectivation,
Submitted Manuscript.
[293] R. Surya Murali, K. Yamuna Rani, T. Sankarshana, A.F. Ismail, S. Sridhar, Separation of
Binary Mixtures of Propylene and Propane by Facilitated Transport through Silver
Incorporated Poly(Ether-Block-Amide) Membranes, Oil Gas Sci. Technol. – Rev. d’IFP
Energies Nouv. 70 (2015) 381–390. doi:10.2516/ogst/2013190.
[294] S. Bai, S. Sridhar, A.A. Khan, Recovery of propylene from refinery off-gas using metal
incorporated ethylcellulose membranes, J. Memb. Sci. 174 (2000) 67–79.
doi:10.1016/S0376-7388(00)00376-8.
[295] S. Sunderrajan, B.D. Freeman, C.K. Hall, I. Pinnau, Propane and propylene sorption in solid
polymer electrolytes based on poly ( ethylene oxide ) and silver salts, J. Memb. Sci. 182
(2001) 1–12.
[296] I. Pinnau, L.G. Toy, Solid polymer electrolyte composite membranes for olefin / paraffin
separation, J. Memb. Sci. 184 (2001) 39–48.
[297] Y.S. Park, J. Won, Y.S. Kang, Facilitated transport of olefin through solid PAAm and
140
PAAm-graft composite membranes with silver ions, J. Memb. Sci. 183 (2001) 163–170.
doi:10.1016/S0376-7388(00)00589-5.
[298] J.H. Kim, B.R. Min, J. Won, S.H. Joo, H.S. Kim, Y.S. Kang, Role of polymer matrix in
polymer/silver complexes for structure, interactions, and facilitated olefin transport,
Macromolecules. 36 (2003) 6183–6188. doi:10.1021/ma034314t.
[299] J.H. Kim, J. Won, Y.S. Kang, Olefin-induced dissolution of silver salts physically dispersed
in inert polymers and their application to olefin/paraffin separation, J. Memb. Sci. 241
(2004) 403–407. doi:10.1016/j.memsci.2004.05.027.
[300] J.H. Kim, B.R. Min, Y.W. Kim, S.W. Kang, J. Won, Y.S. Kang, Novel composite
membranes comprising silver salts physically dispersed in poly(ethylene-co-propylene) for
the separation of propylene/propane, Macromol. Res. 15 (2007) 343–347.
[301] T.C. Merkel, R. Blanc, I. Ciobanu, B. Firat, A. Suwarlim, J. Zeid, Silver salt facilitated
transport membranes for olefin/paraffin separations: Carrier instability and a novel
regeneration method, J. Memb. Sci. 447 (2013) 177–189.
doi:10.1016/j.memsci.2013.07.010.
[302] M. Rungta, L. Xu, W.J. Koros, Carbon molecular sieve dense film membranes derived from
Matrimid for ethylene/ethane separation, Carbon N. Y. 50 (2012) 1488–1502.
doi:10.1016/j.carbon.2011.11.019.
[303] L. Xu, M. Rungta, W.J. Koros, Matrimid derived carbon molecular sieve hollow fiber
membranes for ethylene/ethane separation, J. Memb. Sci. 380 (2011) 138–147.
doi:10.1016/j.memsci.2011.06.037.
[304] R.J. Swaidan, X. Ma, I. Pinnau, Spirobisindane-based polyimide as efficient precursor of
thermally-rearranged and carbon molecular sieve membranes for enhanced
propylene/propane separation, J. Memb. Sci. 520 (2016) 983–989.
doi:10.1016/j.memsci.2016.08.057.
[305] J. Liu, Y. Liu, D. Kayrak Talay, E. Calverley, M. Brayden, M. Martinez, A new carbon
molecular sieve for propylene/propane separations, Carbon N. Y. 85 (2015) 201–211.
doi:10.1016/j.carbon.2014.12.089.
[306] ICIS, Americas Chemicals Outlook 2017.
[307] W.J. Koros, R.P. Lively, Water and Beyond: Expanding the Spectrum of Large-Scale
Energy Efficient Separation Processes, AIChE J. 58 (2012) 2624–2633. doi:10.1002/aic.
[308] M.T. Castoldi, J.C. Pinto, P.A. Melo, Modeling of the separation of propene/propane
mixtures by permeation through membranes in a polymerization system, Ind. Eng. Chem.
Res. 46 (2007) 1259–1269. doi:10.1021/ie060333q.
[309] Global Polypropylene (PP) Market Report 2017: $100+ Billion Market Size, Demand
Forecasts, Industry Trends and Updates 2017-2021, 2017.
[310] D. Kim, S. Lee, C. Engineering, C. Techno, Numerical simulation of fixed-bed catalytic
reactor for isopropyl alcohol synthesis, Korean J. Chem. Eng. 6 (1989) 99–104.
[311] Y. Xu, K.T. Chuang, A.R. Sanger, Design of a Process for production of isopropyl alcohol
by hydration of propylene in a catalytic distillation column, Chem. Eng. Res. Des. 80 (2002)
686–694. doi:10.1205/026387602760312908.
[312] A. Shamiri, M.A. Hussain, F.S. Mjalli, M.S. Shafeeyan, N. Mostoufi, Experimental and
Modeling Analysis of Propylene Polymerization in a Pilot-Scale Fluidized Bed Reactor,
Ind. Eng. Chem. Res. 53 (2014) 8694–8705. doi:10.1021/ie501155h.