Embed Size (px)
Citation preview
Solar Energy 155 (2017) 1389–1402
Contents lists available at ScienceDirect
Solar Energy
journal homepage: www.elsevier .com/locate /solener
Techno-economic modeling and optimization of solar-drivenhigh-temperature electrolysis systems
http://dx.doi.org/10.1016/j.solener.2017.07.0770038-092X/� 2017 Elsevier Ltd. All rights reserved.
⇑ Corresponding author.E-mail address: [email protected] (S. Haussener).
Meng Lin, Sophia Haussener ⇑Laboratory of Renewable Energy Science and Engineering, EPFL, Station 9, 1015 Lausanne, Switzerland
a r t i c l e i n f o
Article history:Received 9 January 2017Received in revised form 24 July 2017Accepted 26 July 2017Available online 9 August 2017
Keywords:Concentrated solarPhotovoltaicsHigh-temperature electrolysisTechno-economical analysis
a b s t r a c t
We present a techno-economic analysis of solar-driven high-temperature electrolysis systems used forthe production of hydrogen and synthesis gas. We consider different strategies for the incorporation ofsolar energy, distinguished by the use of differing technologies to provide solar power and heat: (i) ther-mal approaches (system 1) using concentrated solar technologies to provide heat and to generate elec-tricity through thermodynamic cycles, (ii) electrical approaches (system 2) using photovoltaictechnologies to provide electricity and to generate heat through electrical heaters, and (iii) hybridapproaches (system 3) utilizing concentrated solar technologies and photovoltaics to provide heat andelectricity, respectively. We find that system 3 generates hydrogen at a high efficiency (gSTF = 9.9%,slightly lower than the best performing system 1 with 10.6%) and at a low cost (Cfuel = $4.9/kg, lowest costof all three systems) at reference conditions, providing evidence for the competitiveness of this hybridapproach for scaled solar hydrogen generation. Sensitivity analysis indicates an optimal working temper-ature for system 3 of 1350 K, which balances the increased thermal receiver losses with the reduced elec-trolysis cell potential when increasing the temperature. Lower working pressure always favors highsystem efficiency and low cost. The working current densities for thermoneutral voltage were deter-mined for various temperature and pressure combinations, and trends for efficient and cost-effectivethermoneutral operation were identified. The water conversion extent was optimized to avoid masstransport limitations in the electrodes while ensuring large fuel generation rates. For synthesis gasproduction, a H2/CO molar ratio of 2 can be achieved by tuning the inlet feeding molar ratio of CO2/H2O, temperature, and pressure. This study introduces a flexible simulation framework of solar-drivenhigh-temperature electrolysis systems allowing for the assessment of competing solar integrationapproaches and for the guidance of the operational conditions maximizing efficiency and minimizingcost, providing pathways for scalable solar fuel processing.
� 2017 Elsevier Ltd. All rights reserved.
1. Introduction
A high-temperature electrolysis (HTE) system requires heat andelectricity as input, both ideally supplied by sustainable andrenewable energy sources such as solar, wind, or biomass (Balat,2009; Shi et al., 2015). HTE of water and CO2 driven by renewableenergies can potentially lead to the sustainable large-scale produc-tion of hydrogen and synthesis gas (a mixture of H2 and CO). Syn-thesis gas can then be processed into liquid fuels through a Fischer-Tropsch synthesis, providing a direct pathway for the renewableproduction of liquid fuels. Compared to ambient temperature elec-trolysis, HTE has the advantage of operating at reduced electricalpotentials and, consequently, enhanced efficiency. This potential
reduction results from elevated temperatures which reduce theequilibrium potential, reaction overpotential, and ohmic losses inthe solid electrolyte (Graves et al., 2011).
The coupling of HTE with solar energy provides a promisingroute for large-scale solar fuel generation. Solar energy is a versa-tile source and can be incorporated in HTE systems as a supplier ofelectricity through concentrated solar power (CSP) or photo-voltaics (PV), in addition to being a supplier of high-temperatureheat through concentrated solar heat. HTE driven by concentratedsolar technologies is interesting because high-temperature steamand CO2 can be supplied to simultaneously produce both electricalpower (by a conventional power cycle), and high temperature reac-tants (direct heating by the solar receiver) for the electrolysis pro-cess (Houaijia et al., 2015; Padin, 2000). Design guidelines foroptimized concentrated solar-driven HTE systems have been pro-posed based on a system process model (AlZahrani and Dincer,
Nomenclature
Latin symbolsa modified ideality factorA area (m2)B permeability (m2)C cost ($)CR concentration ratiod thickness (lm)D diffusion coefficient (m2/s)DHI diffuse horizontal irradiance (W/m2)DNI direct normal irradiance (W/m2)E Nernst potential (V)F Faraday constant (96485.3C/mol)HHV higher heating value (J/mol)I current (A)I0 diode reverse saturation current (A)J current density (A/m2)J0 exchange current density (A/m2)k Boltzmann’s constant (1.38 � 10�23 J/K)L length (m)_m mass flow rate (kg/day)_n molar flow rate (mol/s)nI ideality factorN molar flux (mol/(s�m2))Ns number of cells in seriesp pressure (Pa, bar)P power (J)q electron charge (1.6 � 10�19 C)Q heat (J)_Q heat rate (W)r radius (m)R universal gas constant (8.3145 J/(mol�K))RHN ratio of DHI to (DNI + DHI)Rs series resistance (X)Rsh shunt resistance (X)RWGSR reaction rate of water-gas shift reaction (mol/(m3�s))t life time (year)T temperature (K)v wind speed (m/s)V potential (V)W width (m)x, y coordinate direction (m)yi molar fraction of species i
GreekaIsc temperature coefficient for short circuit current (A/K)bVoc temperature coefficient for open circuit voltage (V/K)c pre-exponential factor (A/m2)e emissivityg efficiency, overpotential (V)n tortuosity/ porosityl dynamic viscosity (kg/(ms))
Subscripts0 reference conditiona anodeact activationap apertureav averagec cathodece conversion extentconv convectionCSP concentrated solar powerCEI channel-electrode interfaced directe electrolyteeff effective valueel electrolyzergc gas channelHE heat exchangeri, j species indexind indirectinvest investmentk Knudsen diffusionL lightmp maximum powernoct nominal cell temperature valueoc open circuitPV photovoltaicsrad radiationre receiversc short circuittn thermoneutralTPB triple-phase boundary
1390 M. Lin, S. Haussener / Solar Energy 155 (2017) 1389–1402
2016; Sanz-Bermejo et al., 2014b). These systems suffer from ahigh hydrogen production price because of the high capital costof solar concentrating systems (Holladay et al., 2009). Techno-economic models of HTE systems coupled with concentrated solartechnologies using various coupling strategies are required to pro-vide performance and cost estimates as well as to provide guidancefor the design and optimization of cost-competitive systems. PVpower generation is less costly and simpler (due to the absenceof a solar tower and power block) than CSP generation. The intro-duction of PV into HTE systems shows the potential to reduce fuelproduction costs. Commercial polycrystalline Si-based PV showssolar-to-electricity efficiencies above 15%, and advanced PV tech-nologies (multi-junction, III-V materials) can attain up to 42%(Sagol et al., 2007). A techno-economic analysis has shown that ahybrid HTE system (using parabolic trough concentrators for reac-tant heating and monocrystalline PV panels for electricity), with anoptimized heat recovery system, leads to cheaper hydrogen pro-duction costs compared to a concentrated solar technology drivenHTE system (Koumi Ngoh et al., 2014). This analysis used an outlet
steam temperature for the parabolic trough concentrator of 593 K,and further heating to the operation temperature by the elec-trolyzer exhaust was needed requiring exothermic operation ofthe electrolyzer, increasing electricity demand. No details on trade-offs between the benefits of electrolyzer performance andenhanced reradiation losses in the solar receiver at higher operat-ing temperature were given. More sophisticated HTE system anal-ysis is required in order to quantify the performance and costresponse of the system to varying operating conditions and toalternative solar coupling approaches.
HTE systems can be used for the production of synthesis gaswhich can be further processed by a Fischer-Tropsch process togenerate liquid fuels (Becker et al., 2012). The advantages ofco-electrolysis of H2O and CO2 over separate electrolysis lie in: (i)alleviating the problem of carbon deposition during dry CO2 elec-trolysis, and (ii) omitting the use of an additional water-gas shiftreactor, since H2 thermochemically converts CO2 into CO in the elec-trolyzer (Stoots et al., 2009). Detailed numerical models have beenproposed to predict the performance of high-temperature
M. Lin, S. Haussener / Solar Energy 155 (2017) 1389–1402 1391
co-electrolysis, considering mass transport, electrochemical reac-tion, and the reversible water-gas shift reaction (Aicart et al.,2016, 2015; Menon et al., 2015; Ni, 2012a, 2012b). However, amore detailed elaboration on the impact of the working conditions(cathode inlet gas composition, operating temperature, and pres-sure) on the product gas composition is needed in order to ensurea HTE system design that robustly produces a well-controlled pro-duct composition.
Here we present the development of a techno-economic modelapplied to different solar-drivenHTE hydrogen or synthesis gas pro-cessing systems, distinguished by their approaches for solar integra-tion: pure thermal, pure electrical, and hybrid approaches. Purethermal approaches (system 1) use solar heat to heat the reactantsand to drive a thermodynamic power cycle, whose electricity pow-ers the electrolyzer stack and other system auxiliaries, such aspumps and compressors. Pure electrical approaches (system 2) usesolar-electricity (PV electricity) to drive HTE and other system aux-iliaries, and to drive resistive heaters for fulfilling the heating needsof the system (reactant heating). Hybrid approaches (system 3) useconcentrated solar technologies to provide heat for heating needsand PV electricity to fulfill electrical needs. For each systemapproach, we develop a comprehensive performance model basedon: adetailedquasi 2-dimensional electrolyzermodel, anequivalentcircuit PVmodel, lumpedparametermodels of the solar receiver andauxiliary components, anda thermodynamicpower cyclemodel. Foreach system, the complete performancemodel is coupled to an eco-nomic model accounting for the direct capital investment, indirectcost (including engineering, procurement, commissioning, andmanagement), contingency cost, and operation and maintenancecosts. The complete model allows for a direct comparison of thethree approaches using performance criteria (e.g. solar-to-fuel effi-ciency) andeconomic criteria (e.g. levelized fuel price) under variousdesign and operational conditions, and using various material anddevice choices. The results provide guidance for the implementationof a scalable demonstrator system.
2. System description
We use two relatively mature technologies for the design of oursystems: (i) concentrated solar technologies, and (ii) photovoltaic
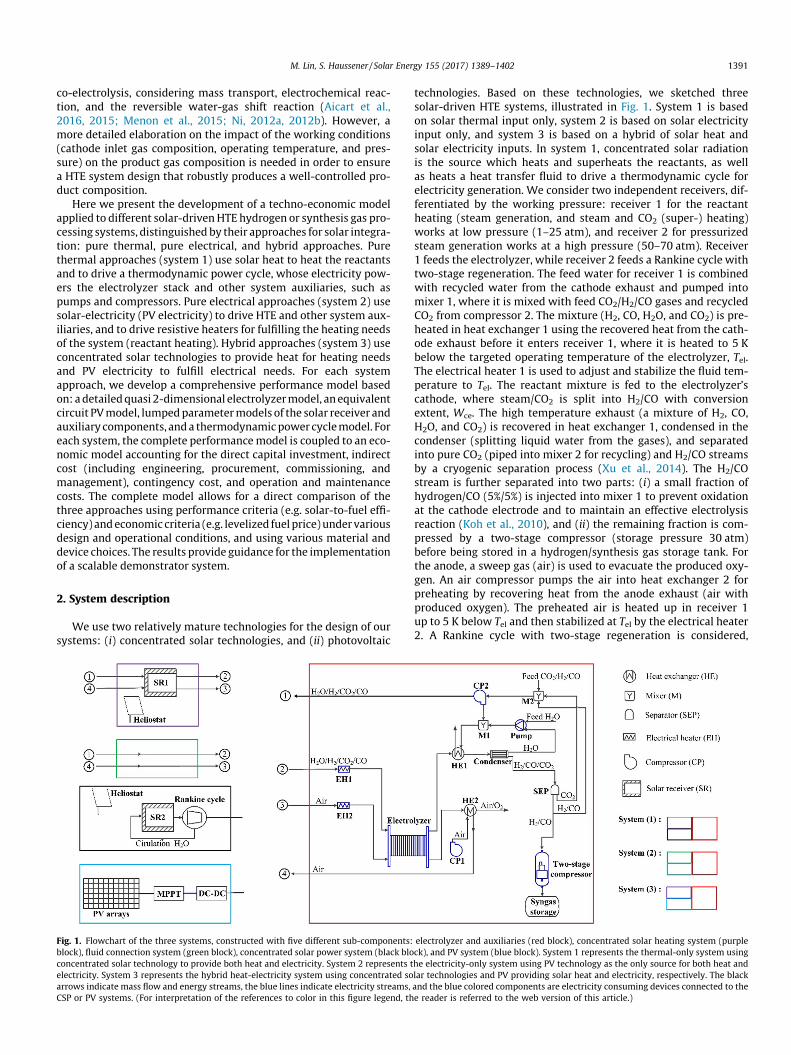
Fig. 1. Flowchart of the three systems, constructed with five different sub-components:block), fluid connection system (green block), concentrated solar power system (black bloconcentrated solar technology to provide both heat and electricity. System 2 represents telectricity. System 3 represents the hybrid heat-electricity system using concentrated soarrows indicate mass flow and energy streams, the blue lines indicate electricity streams,CSP or PV systems. (For interpretation of the references to color in this figure legend, th
technologies. Based on these technologies, we sketched threesolar-driven HTE systems, illustrated in Fig. 1. System 1 is basedon solar thermal input only, system 2 is based on solar electricityinput only, and system 3 is based on a hybrid of solar heat andsolar electricity inputs. In system 1, concentrated solar radiationis the source which heats and superheats the reactants, as wellas heats a heat transfer fluid to drive a thermodynamic cycle forelectricity generation. We consider two independent receivers, dif-ferentiated by the working pressure: receiver 1 for the reactantheating (steam generation, and steam and CO2 (super-) heating)works at low pressure (1–25 atm), and receiver 2 for pressurizedsteam generation works at a high pressure (50–70 atm). Receiver1 feeds the electrolyzer, while receiver 2 feeds a Rankine cycle withtwo-stage regeneration. The feed water for receiver 1 is combinedwith recycled water from the cathode exhaust and pumped intomixer 1, where it is mixed with feed CO2/H2/CO gases and recycledCO2 from compressor 2. The mixture (H2, CO, H2O, and CO2) is pre-heated in heat exchanger 1 using the recovered heat from the cath-ode exhaust before it enters receiver 1, where it is heated to 5 Kbelow the targeted operating temperature of the electrolyzer, Tel.The electrical heater 1 is used to adjust and stabilize the fluid tem-perature to Tel. The reactant mixture is fed to the electrolyzer’scathode, where steam/CO2 is split into H2/CO with conversionextent, Wce. The high temperature exhaust (a mixture of H2, CO,H2O, and CO2) is recovered in heat exchanger 1, condensed in thecondenser (splitting liquid water from the gases), and separatedinto pure CO2 (piped into mixer 2 for recycling) and H2/CO streamsby a cryogenic separation process (Xu et al., 2014). The H2/COstream is further separated into two parts: (i) a small fraction ofhydrogen/CO (5%/5%) is injected into mixer 1 to prevent oxidationat the cathode electrode and to maintain an effective electrolysisreaction (Koh et al., 2010), and (ii) the remaining fraction is com-pressed by a two-stage compressor (storage pressure 30 atm)before being stored in a hydrogen/synthesis gas storage tank. Forthe anode, a sweep gas (air) is used to evacuate the produced oxy-gen. An air compressor pumps the air into heat exchanger 2 forpreheating by recovering heat from the anode exhaust (air withproduced oxygen). The preheated air is heated up in receiver 1up to 5 K below Tel and then stabilized at Tel by the electrical heater2. A Rankine cycle with two-stage regeneration is considered,
electrolyzer and auxiliaries (red block), concentrated solar heating system (purpleck), and PV system (blue block). System 1 represents the thermal-only system usinghe electricity-only system using PV technology as the only source for both heat andlar technologies and PV providing solar heat and electricity, respectively. The blackand the blue colored components are electricity consuming devices connected to thee reader is referred to the web version of this article.)

1392 M. Lin, S. Haussener / Solar Energy 155 (2017) 1389–1402
driven by a direct steam generation solar receiver (receiver 2). TheRankine cycle incorporates a boiler and superheater and providesthe electricity to drive the electrolyzer, pumps, and compressors.The energy demand for the mixers, splitters, and separator isneglected.
System 2 is similar to system 1 with regards to the cathode andanode fluid preheating, product condensation, separation, storage,and electrolyzer operation. However, the reactant heating is solelyaccomplished by electrical heaters driven by the electricity gener-ated by the PV panels. The electricity demand of the electrolyzer,pumps, and compressors is also met by PV electricity.
System 3 is also similar to system 1 with regards to the cathodeand anode fluids preheating, product condensation, separation,storage, and the electrolyzer operation. However, the reactantsheating is achieved by concentrated solar heat absorbed in a recei-ver (similar to system 1) and the electricity demand is met by PVpanels (similar to system 2).
The scheme for the production of hydrogen only, or just CO, isobtained by removing CO2/CO or H2O/H2 (together with theremoval of the pump and mixer 1), respectively (Fig. 1).
We did not consider heat storage or electricity storage compo-nents in any of the systems. The continuous production of fuel canbe obtained with the current system designs without any need foradditional heat or electricity storage components. Namely, the pro-duced fuels – inherently stored energy – can be continuouslyreleased from the compressed fuel storage tank independent ofthe transient and cyclical solar irradiation. Our solar HTE systemstores solar energy directly in the chemical bonds of the products,making additional storage not compulsory for continuous fueldelivery. The use of additional storage technologies (such as heatstorage for systems 1 or 3, or electricity storage for systems 2and 3) could result in additional equipment investment cost. How-ever, energy storage components will become important whenconsidering the dynamic behavior of the systems. For exampleadding a thermal energy storage (TES) component in system 1ensures a stable and continuous supply of heat and electricity (atsmaller values than during the peak irradiation) to the receiverand electrolyzer, which will allow for a smaller design of thesecomponents and for their full load operation with reduced startupand shutdown frequencies. The latter ensures more reliable opera-tion and smaller equipment degradation rates (especially in theelectrolyzer). Overall, this could decrease the cost and increasethe efficiency of the system.
Fig. 2. Schematic of a planar SOEC for the synthesis gas production. The reactant mixtucathode towards the TPB. At the anodic channel, air removes the generated O2. The x-direthe direction of flow in the channels. The required power is provided either by CSP (sys
For simplicity, we did not account for degradation of the com-ponents, including heliostats and receiver(s) for system 1 and sys-tem 3, PV panels for system 2 and system 3, and electrolyzer for allthree systems. The electrolyzer will most likely suffer from themost severe degradation, however, it will similarly affect all threesystems and therefore not alter the trends and conclusions of thestudy. In addition, our model only predicted the yearly-averagedsystem performance in which the impact of daily irradiation vari-ation was not discussed. These two assumptions lead to underesti-mation of the hydrogen price and to loss in the understanding ofthe dynamic plant behavior.
Considering all the assumptions made in this study, we advisefor careful use of the model results for absolute quantitative pre-dictions of efficiency or cost. Instead, we emphasize trends of thesystem behavior and qualitative comparison among various solarenergy integration strategies.
3. Governing equations and methodology
3.1. Electrolyzer performance model
The electrolyzer stack considered in this study is composed ofplanar solid oxide electrolysis cells (SOECs) connected in parallel.A representative SOEC model is illustrated in Fig. 2 and includesa cathode, an anode, an electrolyte, and gas channels. In the SOEC,the gas mixture (H2O, CO2, H2, and CO) flows into the cathodechannel, while the sweep gas (air) passes through the anode chan-nel to remove the generated O2. In the porous cathode, H2O andCO2 diffuse through the porous electrode toward the catalysts atthe cathode-electrolyte interface (considered as the triple-phase-boundary (TPB)), where H2O and CO2 molecules are split into H2,CO, and oxygen ions according to:
H2Oþ 2e� ! H2 þ O2�; ð1Þ
CO2 þ 2e� ! COþ O2�: ð2ÞThe produced H2 and CO are collected at the cathode gas chan-
nel outlet. The generated oxygen ions are transported through theelectrolyte to the anode for the oxidization and the production ofoxygen according to:
O2� ! 12O2 þ 2e�: ð3Þ
re (H2O, H2, CO2, and CO) passes through the cathode channel and diffuses into thection is the direction of gas diffusion in the porous electrodes, and the y-direction istem 1) or PV (systems 2 and 3).
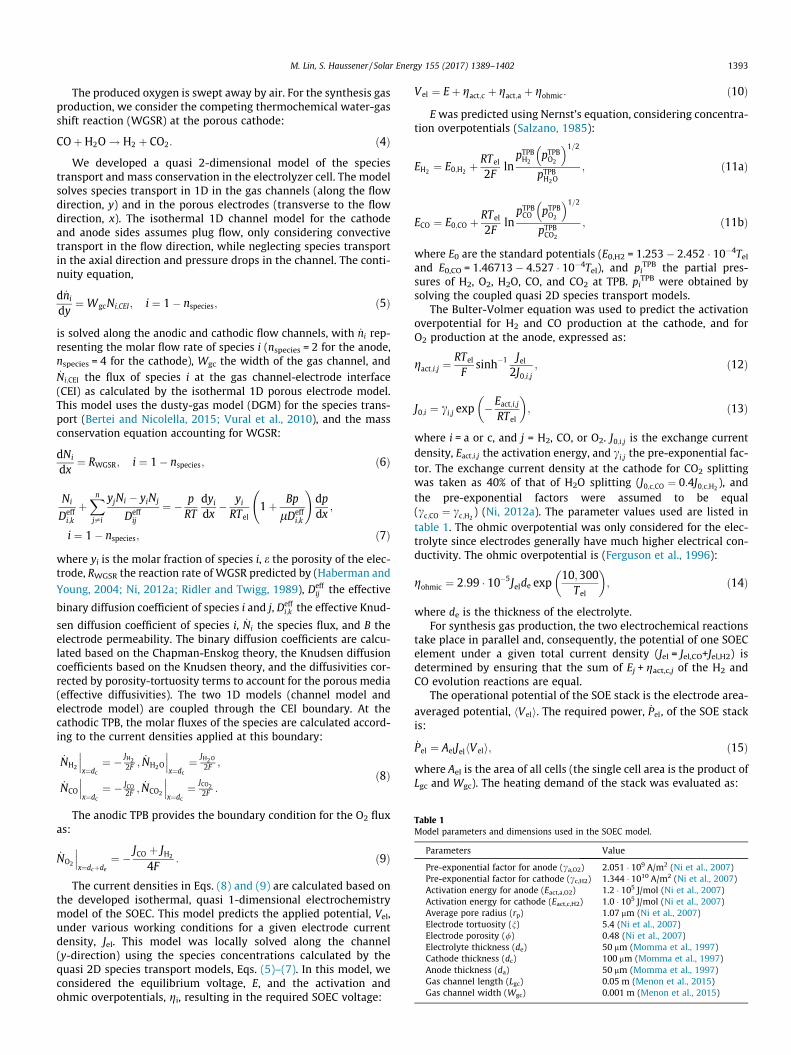
Table 1Model parameters and dimensions used in the SOEC model.
Parameters Value
Pre-exponential factor for anode (ca,O2) 2.051 � 109 A/m2 (Ni et al., 2007)Pre-exponential factor for cathode (cc,H2) 1.344 � 1010 A/m2 (Ni et al., 2007)Activation energy for anode (Eact,a,O2) 1.2 � 105 J/mol (Ni et al., 2007)Activation energy for cathode (Eact,c,H2) 1.0 � 105 J/mol (Ni et al., 2007)Average pore radius (rp) 1.07 mm (Ni et al., 2007)Electrode tortuosity (n) 5.4 (Ni et al., 2007)Electrode porosity (/) 0.48 (Ni et al., 2007)Electrolyte thickness (de) 50 mm (Momma et al., 1997)Cathode thickness (dc) 100 mm (Momma et al., 1997)Anode thickness (da) 50 mm (Momma et al., 1997)Gas channel length (Lgc) 0.05 m (Menon et al., 2015)Gas channel width (Wgc) 0.001 m (Menon et al., 2015)
M. Lin, S. Haussener / Solar Energy 155 (2017) 1389–1402 1393
The produced oxygen is swept away by air. For the synthesis gasproduction, we consider the competing thermochemical water-gasshift reaction (WGSR) at the porous cathode:
COþH2O ! H2 þ CO2: ð4ÞWe developed a quasi 2-dimensional model of the species
transport and mass conservation in the electrolyzer cell. The modelsolves species transport in 1D in the gas channels (along the flowdirection, y) and in the porous electrodes (transverse to the flowdirection, x). The isothermal 1D channel model for the cathodeand anode sides assumes plug flow, only considering convectivetransport in the flow direction, while neglecting species transportin the axial direction and pressure drops in the channel. The conti-nuity equation,
d _ni
dy¼ WgcNi;CEI; i ¼ 1� nspecies; ð5Þ
is solved along the anodic and cathodic flow channels, with _ni rep-resenting the molar flow rate of species i (nspecies = 2 for the anode,nspecies = 4 for the cathode), Wgc the width of the gas channel, and_Ni;CEI the flux of species i at the gas channel-electrode interface(CEI) as calculated by the isothermal 1D porous electrode model.This model uses the dusty-gas model (DGM) for the species trans-port (Bertei and Nicolella, 2015; Vural et al., 2010), and the massconservation equation accounting for WGSR:
dNi
dx¼ RWGSR; i ¼ 1� nspecies; ð6Þ
Ni
Deffi;k
þXnj–i
yjNi � yiNj
Deffij
¼ � pRT
dyidx
� yiRTel
1þ Bp
lDeffi;k
!dpdx
;
i ¼ 1� nspecies; ð7Þwhere yi is the molar fraction of species i, e the porosity of the elec-trode, RWGSR the reaction rate of WGSR predicted by (Haberman and
Young, 2004; Ni, 2012a; Ridler and Twigg, 1989), Deffij the effective
binary diffusion coefficient of species i and j, Deffi;k the effective Knud-
sen diffusion coefficient of species i, _Ni the species flux, and B theelectrode permeability. The binary diffusion coefficients are calcu-lated based on the Chapman-Enskog theory, the Knudsen diffusioncoefficients based on the Knudsen theory, and the diffusivities cor-rected by porosity-tortuosity terms to account for the porous media(effective diffusivities). The two 1D models (channel model andelectrode model) are coupled through the CEI boundary. At thecathodic TPB, the molar fluxes of the species are calculated accord-ing to the current densities applied at this boundary:
_NH2
���x¼dc
¼ � JH22F ;
_NH2O
���x¼dc
¼ JH2O2F ;
_NCO
���x¼dc
¼ � JCO2F ;
_NCO2
���x¼dc
¼ JCO22F :
ð8Þ
The anodic TPB provides the boundary condition for the O2 fluxas:
_NO2
���x¼dcþde
¼ � JCO þ JH2
4F: ð9Þ
The current densities in Eqs. (8) and (9) are calculated based onthe developed isothermal, quasi 1-dimensional electrochemistrymodel of the SOEC. This model predicts the applied potential, Vel,under various working conditions for a given electrode currentdensity, Jel. This model was locally solved along the channel(y-direction) using the species concentrations calculated by thequasi 2D species transport models, Eqs. (5)–(7). In this model, weconsidered the equilibrium voltage, E, and the activation andohmic overpotentials, gi, resulting in the required SOEC voltage:
Vel ¼ Eþ gact;c þ gact;a þ gohmic: ð10ÞEwas predicted using Nernst’s equation, considering concentra-
tion overpotentials (Salzano, 1985):
EH2 ¼ E0;H2 þRTel
2Fln
pTPBH2
pTPBO2
� �1=2pTPBH2O
; ð11aÞ
ECO ¼ E0;CO þ RTel
2Fln
pTPBCO pTPB
O2
� �1=2pTPBCO2
; ð11bÞ
where E0 are the standard potentials (E0,H2 = 1.253 � 2.452 � 10�4Teland E0,CO = 1.46713 � 4.527 � 10�4Tel), and pi
TPB the partial pres-sures of H2, O2, H2O, CO, and CO2 at TPB. piTPB were obtained bysolving the coupled quasi 2D species transport models.
The Bulter-Volmer equation was used to predict the activationoverpotential for H2 and CO production at the cathode, and forO2 production at the anode, expressed as:
gact;i;j ¼RTel
Fsinh�1 Jel
2J0;i;j; ð12Þ
J0;i ¼ ci;j exp � Eact;i;j
RTel
� �; ð13Þ
where i = a or c, and j = H2, CO, or O2. J0;i;j is the exchange currentdensity, Eact;i;j the activation energy, and ci;j the pre-exponential fac-tor. The exchange current density at the cathode for CO2 splittingwas taken as 40% of that of H2O splitting (J0;c;CO ¼ 0:4J0;c;H2
), andthe pre-exponential factors were assumed to be equal(cc;CO ¼ cc;H2
) (Ni, 2012a). The parameter values used are listed intable 1. The ohmic overpotential was only considered for the elec-trolyte since electrodes generally have much higher electrical con-ductivity. The ohmic overpotential is (Ferguson et al., 1996):
gohmic ¼ 2:99 � 10�5Jelde exp10;300
Tel
� �; ð14Þ
where de is the thickness of the electrolyte.For synthesis gas production, the two electrochemical reactions
take place in parallel and, consequently, the potential of one SOECelement under a given total current density (Jel = Jel,CO+Jel,H2) isdetermined by ensuring that the sum of Ej + gact,c,j of the H2 andCO evolution reactions are equal.
The operational potential of the SOE stack is the electrode area-averaged potential, hVeli. The required power, _Pel, of the SOE stackis:
_Pel ¼ AelJelhVeli; ð15Þwhere Ael is the area of all cells (the single cell area is the product ofLgc and Wgc). The heating demand of the stack was evaluated as:
1394 M. Lin, S. Haussener / Solar Energy 155 (2017) 1389–1402
_Q el ¼ AelJelðV tn � hVeliÞ; ð16Þwhere Vtn is the thermoneutral voltage for a given Tel. For Vtn < hVeli,_Q el ¼ 0, assuming effective electrolyzer cooling. This heat is eitherprovided by the electrical heaters (system 2) or by the solar receiver(systems 1 and 3).
Both, the quasi 2D species transport and conservation modeland the quasi 1D electrolyzer model were solved in Matlab. TheDGM equations were solved by a Matlab boundary value solver(bp4c), based on a collocation numerical method (Shampineet al., 2000). Following a mesh independent study with a relativeerror tolerance of 10�3 for species flux, molar fractions, and pres-sure, we used ten uniform mesh elements along the x-axis for eachelectrode, and ten uniform elements along the y-axis for both fluidchannels and electrodes. The electrolyzer model was validatedwith experimental data in the literature and the details are inthe supporting information for hydrogen generation (Fig. S2a)and syngas production (Fig. S2b). All reference cell parametersand properties used in the model are listed in Table 1.
3.2. CSP performance model
For the CSP model, we utilize a point-concentrating solar towersystem for the production of high-temperature heat. The heliostatfield’s annual optical efficiency was assumed to be 64% based ondata from the 11 MWel power tower PS10 located in Andalusia,Spain (Kistler, 1986).
Here we introduce two sub-models: (i) a solar receiver model,and (ii) a Rankine cycle model. We consider two types of receivers:(i) a receiver for the high temperature reactant and sweep gasheating, and (ii) a receiver for high temperature and high pressuresteam generation for the power cycle. The receiver is a cylindricalcavity receiver with a circular aperture area through which theconcentrated solar radiation enters. The energy transferred to thefluids (H2, CO, H2O, CO2, and air) was calculated by consideringthe energy balance of the receiver. The working fluids in the powerunit (H2O) and the electrolyzer (H2, CO, H2O, CO2, and air) weredirectly heated by the solar receiver without considering an inter-mediate heat transfer fluid (such as synthetic oil or molten salts)and a subsequent heat exchanger. This choice was made in orderto increase the efficiency and keeping system complexity low.We only considered radiative and convective heat losses. Conduc-tive heat losses were neglected. The energy balance of the receiveris given by:
_Q fluid ¼ _Q aperture � _Q rad � _Q conv; ð17Þ
where _Q fluid represents the sensible and latent energy transferred to
the working fluid, _Q aperture the energy arriving at the receiver aper-
ture, _Q rad the radiative heat loss form the aperture,
_Q rad ¼ eapparentrpr2apðT4re;av � T4
0Þ; ð18Þ
and _Q conv the combined natural and forced convection heat losses,
_Q conv ¼ ðpr2ap þ 2prapLreÞhconvðTre;av � T0Þ: ð19ÞThe heat transfer coefficient, hconv, was evaluated from empiri-
cal correlations considering natural and forced convection (Neisesand Wagner, 2012; Wagner, 2008). The cavity length was Lre = 3rap.The power from the heliostat field was given as a function of theaperture radius, rap:
_Q aperture ¼ pr2ap � DNI � CR; ð20aÞ
CR ¼ Aheliostat
pr2apgopt; ð20bÞ
where CR is the effective concentration ratio. _Q rad was calculatedby:
_Q rad ¼ eapparentpr2apðT4re;av � T4
0Þ; ð21Þusing an apparent emissivity, eapparent (a constant determined bythe Lre/rap ratio and the material emissivity) (Howell et al., 2010),and the averaged fluid temperature, Tre,av = ½(Tf,in+Tf,out). The recei-ver’s thermal efficiency is defined as the ratio of _Q fluid to _Q rad. Wevalidated our receiver model with literature data (Sanz-Bermejoet al., 2014a). The solar receiver thermal efficiency for our referencecase for system 1 with a mean temperature of 727 K was 82% (seeSection 4.2) which agreed with the efficiency of 81.7% reported in(Sanz-Bermejo et al., 2014a) for their superheating receiver with amean temperature of 736 K.
A Rankine cycle with two-stage regeneration was used (Cengelet al., 2002). The inlet temperature and pressure of the turbine was823 K and 70 atm, and the back pressure was 1 atm. The two steamextraction pressures were 30 atm and 5 atm. A separate solar recei-ver was used for power generation. Solar receiver size and theadditional size of the solar field were calculated according to theaforementioned receiver model with the exception that the fluidproperties were different at the different operational pressures.The total electricity demand provided by the CSP sub-system ofsystems 1, _Ptotal;CSP, was the sum of the demands of the electrolyzer,pumps, compressors, and electrical heaters.
3.3. Photovoltaic cell array performance model
An equivalent circuit model for the individual PV modules wasused to predict module current-voltage (I-V) characteristics basedon the data provided by the manufacturer: the open circuit voltage,Voc, the short circuit current, Isc, the maximum power current andvoltage, Imp and Vmp, and the temperature coefficients of the opencircuit voltage and short circuit current, bVoc and aIsc. The circuitaccounted for series and shunt resistances, Rs and Rsh (De Sotoet al., 2006):
IPV ¼ IL � I0 eVþIRs
a � 1� �
� VPV þ IPVRs
Rsh; ð22Þ
a ¼ NsnIkTPV
q; ð23Þ
TPV ¼ T0 þ ðDNI þ DHIÞðTnoct � T0ÞðDNI0 þ DHI0Þ þ 6:62ðv � v0ÞðTnoct � T0Þ ; ð24Þ
where IL is the light current, I0 the diode reverse saturation current,a the modified ideality factor, Ns the number of cells in series ineach PV module, TPV the cell temperature, and nI the ideality factor.In Eq. (24), TPV is given as a function of the nominal cell tempera-ture, Tnoct = 317 K, nominal direct normal irradiance, DNI0, nominaldiffuse horizontal irradiance, DHI0, nominal wind speed, v0, ambienttemperature, T0, operating DNI and DHI (DHI = 0.165�DNI/(1 � 0.165) (Duffie and Beckman, 2013)), and operating wind speed,v (Bizzarri et al., 2013). The detailed calculation procedures for theparameters are detailed in (De Soto et al., 2006). We used amonocrystalline Si PV module (Sunpower SPR-210-BLK-U) for ourinvestigation with module characteristics from Gilman et al.(Gilman and Dobos, 2012), tabulated in Table S1. The validation ofthe PV model was conducted under nominal conditions and thecomparison between the simulated data and the reference curveof the provider shows good agreement (Fig. S1). We assumedv = 3 m/s. Two-axis tracking was considered for the PV panels, max-imizing the optical efficiency of the PV system. The total electricitydemand of the PV array, _Ptotal;PV, for both systems 2 and 3, was thesum of the demands of the electrolyzer, pumps, compressors, and
M. Lin, S. Haussener / Solar Energy 155 (2017) 1389–1402 1395
electrical heaters (heaters for system 2 and temperature stabilizerfor system 3). Hence, the total PV panel area is given by:
APV;array ¼ APV_Ptotal;PV
IPVVPV; ð25Þ
where APV is the PV module area. To make use of the maximum butvarying power generated by the PV module arrays, the PV systemused a maximum power point tracker (MPPT) with a full sun track-ing system. Additionally, a DC-DC converter was used. The effi-ciency of the MPPT and the DC-DC converter were each assumedto be 95% (Gibson and Kelly, 2008).
3.4. Auxiliary devices
Heat exchangers were modeled in a counter flow manner withthe temperature of the hot and cold streams predicted by the energybalance equation assuming a range of heat recovery effectiveness,eHE. For heat exchanger 1 (HE1), we assumed that only the sensibleheat of the exhaust stream could be recovered. In order to calculatelogmean temperature differences and required heat exchanger sur-face areas of the cold streamundergoing phase change, heat transferwas divided into subcooled, two-phase, and superheating regions.The overall heat transfer coefficient, U, for each regionwas assumedto be constant (U = 500W/m2 K for liquid-liquid heat exchange,U = 200W/m2 K for gas-gas heat exchange, and U = 2000 W/m2 Kfor the two-phase region (Lienhard, 2013)). The electricity demandof pumps and compressorswas estimated assuming isentropic com-pression with isentropic efficiencies of 0.8 and mechanical efficien-cies of 0.9. The energy consumption of mixers, splitters, andseparators were neglected.
The cost of separating CO2 from the produced gases wasassumed to be $10.28/tCO2 based on a multi-stage compression,refrigeration and cryogenic separation processes (Xu et al., 2014).These costs were added to Cfeed (see section 3.6). The energy con-sumption of this process was 0.45 MJ/kgCO2 and was neglectedin the calculations as it was always smaller than the energyrequirements for the pumps and compressors. This led to a slightoverestimation of the plant efficiency (maximum overestimationof about 16%).
3.5. System efficiency definition
The overall solar-to-fuel efficiency of the system is defined asthe ratio of the energy content of the products to the overall inci-dent solar radiation and the energy content of the fed feedstock:
gSTF ¼_nH2HHVH2 þ _nCOHHVCO
ðDNIþDHIÞðAPV;arraryþAheliostatÞþ _nH2 ;feedHHVH2 þ _nCO;feedHHVCO:
ð26ÞWe used the high heating value (HHV) of each of the products
and feed streams.
3.6. Cost model of the systems
The costmodel considered investment and operating cost for themajor components of the three systems. The cost of the photovoltaicsystemdepends on the unit cost of themodule,which itself dependson the choice of module material. The price for monocrystalline Si-based modules is $1.24/W (Gilman and Dobos, 2012). The trackingand other auxiliary equipment cost was considered to be 40% ofthe total PV system cost (Gielen, 2012), resulting in total PV cost of
CPV ¼ C�module
_Ptotal;PV
0:6: ð27Þ
The cost of the electrolyzer unit per unit area was $1695/m2 (Fuet al., 2010) and a similar cost value ($1555/m2) was reported by
(Milobar et al., 2015). In addition, a recent paper by (Ferreroet al., 2016) showed that the SOFC stack cost is expected to drop10 times by 2030 compared with 2013. Here, we took $1695/m2
as the reference case value. The effect of the SOEC stack cost onthe hydrogen production price was investigated with a sensitivitystudy and the results are shown in Fig. S3. This total electrolyzerunit cost consisted of the stack (46%), the balance of plant (21%),and the power electronics and gas conditioning (33%) (Saur, 2008),
Cel ¼ C 00unitAel
0:46: ð28Þ
The cost of the concentrated solar power system consisted offour major parts: solar tower, heliostat field, receiver, and powerunit, with the heliostat field the major fraction of the cost (Singeret al., 2010):
Cheliostat ¼ 3951:8A0:7heliostat; ð29Þ
Ctower ¼ 4785Htower � 10:51Aheliostat þ 0:608HtowerAheliostat � 82740;
ð30Þ
Creceiver ¼ 0:5224 _Q0:93fluid; ð31Þ
Cpowerunit ¼ 2:7164 _P0:93CSP : ð32Þ
For the hybrid system (system 3), the power unit is not presentand is therefore not included. For the thermal only system (system1), the receiver cost is counted twice and the cost of each receiveris calculated according to the energy delivered ( _Q fluid).
The land cost of the required PV plant and/or CSP plant areas iscalculated by considering a land use factor of 0.35 and land unitcost of $2/m2 (Meier et al., 2005),
Cland ¼ 2 APV;array þ Aheliostat� �
0:35: ð33Þ
Costs of the heat exchangers were derived from the total area ofthe heat exchanger (Myers et al., 2002),
CHE ¼ 2:78� 103:6788þ0:4412 logAHE : ð34ÞThe costs of auxiliary devices such as pumps, compressors, and
mixers were calculated based on available references (Meier et al.,2005; Rivera-Tinoco et al., 2010). The costs of auxiliary devices andthe heat exchangers were lumped into one term, Cother.
The direct investment cost is the sum of the equipment,
Cd;total ¼ CPV þ Cel þ Cheliostat þ Ctower þ Creceiver þ Cpowerunit þ Cland þ Cother� �
:
ð35ÞThe indirect investment cost, Cind,total, for engineering, procure-
ment, commissioning, and management were considered to be 20%of the initial direct capital cost, except for the heliostat costs, forwhich only 10% indirect investment costs were assumed (Meieret al., 2005). Additionally, a 15% contingency cost, Ccontingency, wasadded to the total investment cost.
The maintenance cost, Cm, was included, assumed as equal to 4%of the total investment cost. The feedstock costs (feed H2O andCO2), Cfeed, were based on a specific cost for CO2 of $0.1808/kgand for H2O of $0.001/kg (Fu et al., 2010), multiplied by the quan-tity required over the lifetime.
The total plant cost, Ctotal, is the sum of all the costs: investment,indirect, contingency, maintenance, and feed. The interest rate, i,was assumed to be 6% and a life time, t, of 25 years was chosen.The total annual cost including interest is
Cannual;total ¼ ið1þ iÞtCtotal
ð1þ iÞt � 1: ð36Þ
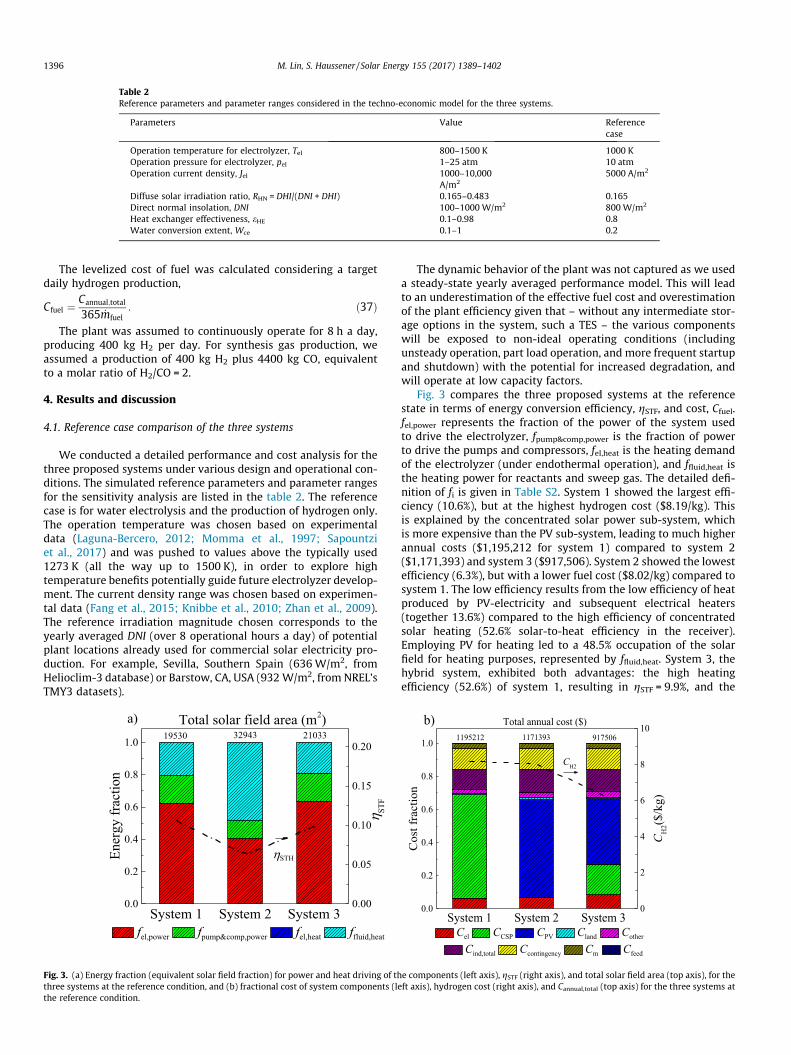
Table 2Reference parameters and parameter ranges considered in the techno-economic model for the three systems.
Parameters Value Referencecase
Operation temperature for electrolyzer, Tel 800–1500 K 1000 KOperation pressure for electrolyzer, pel 1–25 atm 10 atmOperation current density, Jel 1000–10,000
A/m25000 A/m2
Diffuse solar irradiation ratio, RHN = DHI/(DNI + DHI) 0.165–0.483 0.165Direct normal insolation, DNI 100–1000 W/m2 800 W/m2
Heat exchanger effectiveness, eHE 0.1–0.98 0.8Water conversion extent, Wce 0.1–1 0.2
1396 M. Lin, S. Haussener / Solar Energy 155 (2017) 1389–1402
The levelized cost of fuel was calculated considering a targetdaily hydrogen production,
Cfuel ¼ Cannual;total
365 _mfuel: ð37Þ
The plant was assumed to continuously operate for 8 h a day,producing 400 kg H2 per day. For synthesis gas production, weassumed a production of 400 kg H2 plus 4400 kg CO, equivalentto a molar ratio of H2/CO = 2.
4. Results and discussion
4.1. Reference case comparison of the three systems
We conducted a detailed performance and cost analysis for thethree proposed systems under various design and operational con-ditions. The simulated reference parameters and parameter rangesfor the sensitivity analysis are listed in the table 2. The referencecase is for water electrolysis and the production of hydrogen only.The operation temperature was chosen based on experimentaldata (Laguna-Bercero, 2012; Momma et al., 1997; Sapountziet al., 2017) and was pushed to values above the typically used1273 K (all the way up to 1500 K), in order to explore hightemperature benefits potentially guide future electrolyzer develop-ment. The current density range was chosen based on experimen-tal data (Fang et al., 2015; Knibbe et al., 2010; Zhan et al., 2009).The reference irradiation magnitude chosen corresponds to theyearly averaged DNI (over 8 operational hours a day) of potentialplant locations already used for commercial solar electricity pro-duction. For example, Sevilla, Southern Spain (636W/m2, fromHelioclim-3 database) or Barstow, CA, USA (932 W/m2, from NREL’sTMY3 datasets).
System 1 System 2 System 30.0
0.2
0.4
0.6
0.8
1.0
fel,power fpump&comp,power fel,heat ffluid,heat
Ener
gy fr
actio
n
0.00
0.05
0.10
0.15
0.20
Total solar field area (m2)2103332943
STH
19530
STF
a)
Fig. 3. (a) Energy fraction (equivalent solar field fraction) for power and heat driving of ththree systems at the reference condition, and (b) fractional cost of system components (lethe reference condition.
The dynamic behavior of the plant was not captured as we useda steady-state yearly averaged performance model. This will leadto an underestimation of the effective fuel cost and overestimationof the plant efficiency given that – without any intermediate stor-age options in the system, such a TES – the various componentswill be exposed to non-ideal operating conditions (includingunsteady operation, part load operation, and more frequent startupand shutdown) with the potential for increased degradation, andwill operate at low capacity factors.
Fig. 3 compares the three proposed systems at the referencestate in terms of energy conversion efficiency, gSTF, and cost, Cfuel.fel,power represents the fraction of the power of the system usedto drive the electrolyzer, fpump&comp,power is the fraction of powerto drive the pumps and compressors, fel,heat is the heating demandof the electrolyzer (under endothermal operation), and ffluid,heat isthe heating power for reactants and sweep gas. The detailed defi-nition of fi is given in Table S2. System 1 showed the largest effi-ciency (10.6%), but at the highest hydrogen cost ($8.19/kg). Thisis explained by the concentrated solar power sub-system, whichis more expensive than the PV sub-system, leading to much higherannual costs ($1,195,212 for system 1) compared to system 2($1,171,393) and system 3 ($917,506). System 2 showed the lowestefficiency (6.3%), but with a lower fuel cost ($8.02/kg) compared tosystem 1. The low efficiency results from the low efficiency of heatproduced by PV-electricity and subsequent electrical heaters(together 13.6%) compared to the high efficiency of concentratedsolar heating (52.6% solar-to-heat efficiency in the receiver).Employing PV for heating led to a 48.5% occupation of the solarfield for heating purposes, represented by ffluid,heat. System 3, thehybrid system, exhibited both advantages: the high heatingefficiency (52.6%) of system 1, resulting in gSTF = 9.9%, and the
System 1 System 2 System 30.0
0.2
0.4
0.6
0.8
1.0
Cos
t fra
ctio
n
Cel CCSP CPV Cland Cother
Cind,total Ccontingency Cm Cfeed
b)
0
2
4
6
8
101195212
CH2
CH
2($/k
g)
9175061171393
Total annual cost ($)
e components (left axis), gSTF (right axis), and total solar field area (top axis), for theft axis), hydrogen cost (right axis), and Cannual,total (top axis) for the three systems at
0.030
0.050
0.070
0.090
0.030
0.050
0.070
0.090
900 1150 1400
4
8
12
16
20
24
p el (P
a)
Tel (K)
0.11
0.13
0.15
0.17STFSTF
900 1150 14004.05.06.07.08.09.01011121314151617
Cfuel($/kg)Cfuela)
900 1150 1400
4
8
12
16
20
24
p el (P
a)
Tel (K)
0.030
0.050
0.070
0.090
0.11
0.13
0.15
0.17STF
900 1150 14004.05.06.07.08.09.01011121314151617
Cfuel($/kg)STF Cfuel
b)
900 1150 1400
4
8
12
16
20
24c)
p el (P
a)
Tel (K)
0.11
0.13
0.15
0.17STFSTF Cfuel
900 1150 14004.05.06.07.08.09.01011121314151617
Cfuel($/kg)
800 900 1000 1100 1200 1300 1400 1500
4
8
12
16
20
24
d) Cfuel,1-Cfuel,2 ($/kg)
p el (P
a)Tel (K)
-1.0
-0.50
0.0
0.50
1.0
1.5
2.0
2.5
I
II
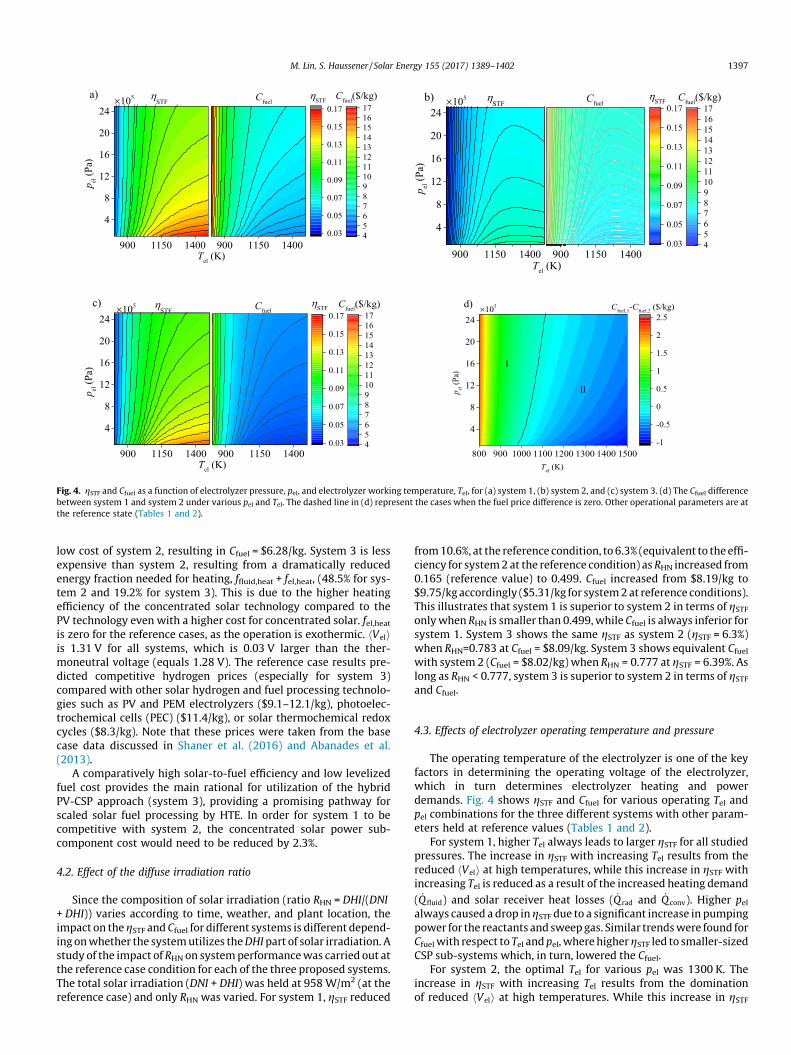
Fig. 4. gSTF and Cfuel as a function of electrolyzer pressure, pel, and electrolyzer working temperature, Tel, for (a) system 1, (b) system 2, and (c) system 3. (d) The Cfuel differencebetween system 1 and system 2 under various pel and Tel. The dashed line in (d) represent the cases when the fuel price difference is zero. Other operational parameters are atthe reference state (Tables 1 and 2).
M. Lin, S. Haussener / Solar Energy 155 (2017) 1389–1402 1397
low cost of system 2, resulting in Cfuel = $6.28/kg. System 3 is lessexpensive than system 2, resulting from a dramatically reducedenergy fraction needed for heating, ffluid,heat + fel,heat, (48.5% for sys-tem 2 and 19.2% for system 3). This is due to the higher heatingefficiency of the concentrated solar technology compared to thePV technology even with a higher cost for concentrated solar. fel,heatis zero for the reference cases, as the operation is exothermic. hVeliis 1.31 V for all systems, which is 0.03 V larger than the ther-moneutral voltage (equals 1.28 V). The reference case results pre-dicted competitive hydrogen prices (especially for system 3)compared with other solar hydrogen and fuel processing technolo-gies such as PV and PEM electrolyzers ($9.1–12.1/kg), photoelec-trochemical cells (PEC) ($11.4/kg), or solar thermochemical redoxcycles ($8.3/kg). Note that these prices were taken from the basecase data discussed in Shaner et al. (2016) and Abanades et al.(2013).
A comparatively high solar-to-fuel efficiency and low levelizedfuel cost provides the main rational for utilization of the hybridPV-CSP approach (system 3), providing a promising pathway forscaled solar fuel processing by HTE. In order for system 1 to becompetitive with system 2, the concentrated solar power sub-component cost would need to be reduced by 2.3%.
4.2. Effect of the diffuse irradiation ratio
Since the composition of solar irradiation (ratio RHN = DHI/(DNI+ DHI)) varies according to time, weather, and plant location, theimpact on thegSTF and Cfuel for different systems is different depend-ing onwhether the systemutilizes theDHIpart of solar irradiation. Astudy of the impact of RHN on systemperformancewas carried out atthe reference case condition for each of the three proposed systems.The total solar irradiation (DNI + DHI) was held at 958W/m2 (at thereference case) and only RHN was varied. For system 1, gSTF reduced
from10.6%, at the reference condition, to6.3% (equivalent to the effi-ciency for system2at the reference condition) as RHN increased from0.165 (reference value) to 0.499. Cfuel increased from $8.19/kg to$9.75/kgaccordingly ($5.31/kg for system2at reference conditions).This illustrates that system 1 is superior to system 2 in terms of gSTFonlywhen RHN is smaller than 0.499,while Cfuel is always inferior forsystem 1. System 3 shows the same gSTF as system 2 (gSTF = 6.3%)when RHN=0.783 at Cfuel = $8.09/kg. System 3 shows equivalent Cfuelwith system 2 (Cfuel = $8.02/kg) when RHN = 0.777 at gSTF = 6.39%. Aslong as RHN < 0.777, system 3 is superior to system 2 in terms of gSTFand Cfuel.
4.3. Effects of electrolyzer operating temperature and pressure
The operating temperature of the electrolyzer is one of the keyfactors in determining the operating voltage of the electrolyzer,which in turn determines electrolyzer heating and powerdemands. Fig. 4 shows gSTF and Cfuel for various operating Tel andpel combinations for the three different systems with other param-eters held at reference values (Tables 1 and 2).
For system 1, higher Tel always leads to larger gSTF for all studiedpressures. The increase in gSTF with increasing Tel results from thereduced hVeli at high temperatures, while this increase in gSTF withincreasing Tel is reduced as a result of the increased heating demand
( _Q fluid) and solar receiver heat losses ( _Q rad and _Q conv). Higher pelalways caused a drop ingSTF due to a significant increase in pumpingpower for the reactants and sweepgas. Similar trendswere found forCfuelwith respect to Tel and pel, wherehighergSTF led to smaller-sizedCSP sub-systems which, in turn, lowered the Cfuel.
For system 2, the optimal Tel for various pel was 1300 K. Theincrease in gSTF with increasing Tel results from the dominationof reduced hVeli at high temperatures. While this increase in gSTF
a)
0.02 0.04 0.06 0.08 0.10 0.12 0.144
6
8
10
12
14
16
18
20
Cfu
el ($
/kg)
STF
Tel=800 KTel=900 KTel=1000 KTel=1100 KTel=1200 KTel=1500 K
1000
2000
3000
4000
5000
6000
7000
8000
9000
10000Jel (A/m2) b)
0.08 0.10 0.12 0.145
6
7
8
9
10Jel (A/m2)
Cfu
el ($
/kg)
STF
pel=1 atmpel=5 atmpel=10 atmpel=15 atmpel=20 atmpel=25 atm
1000
2000
3000
4000
5000
6000
7000
8000
9000
10000 c)
0 2000 4000 6000 8000 10000750
800
850
900
950
1000
1050
1100
T el (K
)
Jel (A/m2)
pel=1 atmpel=5 atmpel=10 atmpel=15 atmpel=20 atmpel=25 atm
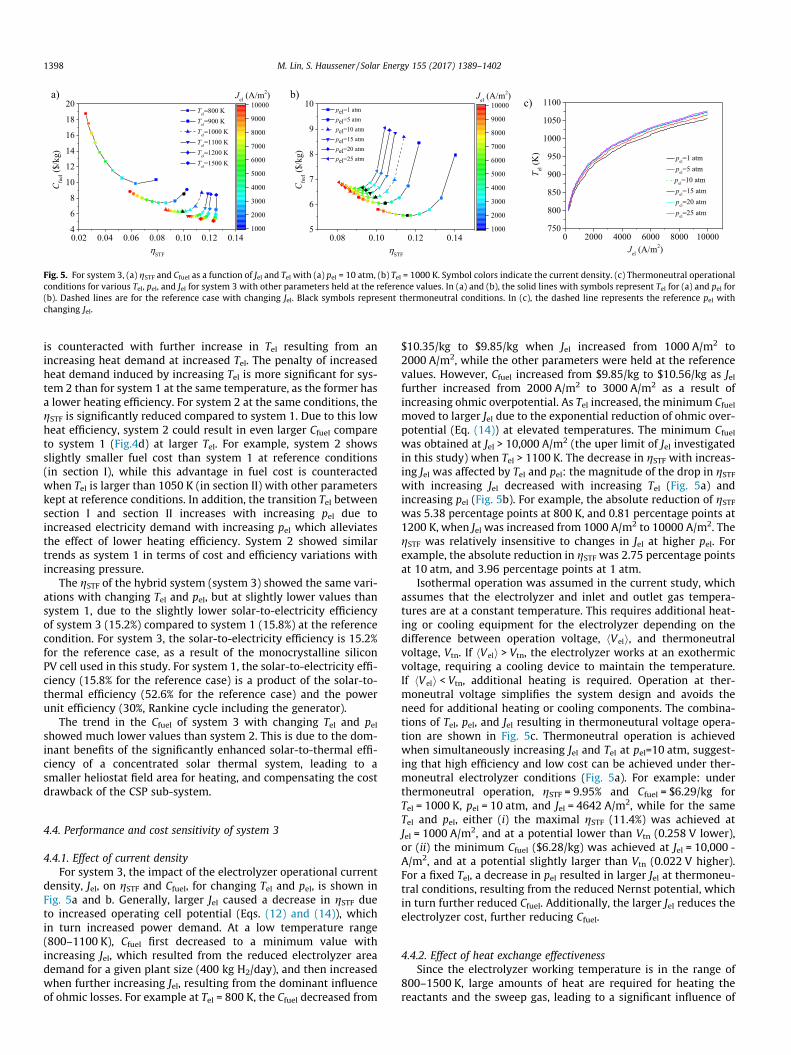
Fig. 5. For system 3, (a) gSTF and Cfuel as a function of Jel and Tel with (a) pel = 10 atm, (b) Tel = 1000 K. Symbol colors indicate the current density. (c) Thermoneutral operationalconditions for various Tel, pel, and Jel for system 3 with other parameters held at the reference values. In (a) and (b), the solid lines with symbols represent Tel for (a) and pel for(b). Dashed lines are for the reference case with changing Jel. Black symbols represent thermoneutral conditions. In (c), the dashed line represents the reference pel withchanging Jel.
1398 M. Lin, S. Haussener / Solar Energy 155 (2017) 1389–1402
is counteracted with further increase in Tel resulting from anincreasing heat demand at increased Tel. The penalty of increasedheat demand induced by increasing Tel is more significant for sys-tem 2 than for system 1 at the same temperature, as the former hasa lower heating efficiency. For system 2 at the same conditions, thegSTF is significantly reduced compared to system 1. Due to this lowheat efficiency, system 2 could result in even larger Cfuel compareto system 1 (Fig.4d) at larger Tel. For example, system 2 showsslightly smaller fuel cost than system 1 at reference conditions(in section I), while this advantage in fuel cost is counteractedwhen Tel is larger than 1050 K (in section II) with other parameterskept at reference conditions. In addition, the transition Tel betweensection I and section II increases with increasing pel due toincreased electricity demand with increasing pel which alleviatesthe effect of lower heating efficiency. System 2 showed similartrends as system 1 in terms of cost and efficiency variations withincreasing pressure.
The gSTF of the hybrid system (system 3) showed the same vari-ations with changing Tel and pel, but at slightly lower values thansystem 1, due to the slightly lower solar-to-electricity efficiencyof system 3 (15.2%) compared to system 1 (15.8%) at the referencecondition. For system 3, the solar-to-electricity efficiency is 15.2%for the reference case, as a result of the monocrystalline siliconPV cell used in this study. For system 1, the solar-to-electricity effi-ciency (15.8% for the reference case) is a product of the solar-to-thermal efficiency (52.6% for the reference case) and the powerunit efficiency (30%, Rankine cycle including the generator).
The trend in the Cfuel of system 3 with changing Tel and pelshowed much lower values than system 2. This is due to the dom-inant benefits of the significantly enhanced solar-to-thermal effi-ciency of a concentrated solar thermal system, leading to asmaller heliostat field area for heating, and compensating the costdrawback of the CSP sub-system.
4.4. Performance and cost sensitivity of system 3
4.4.1. Effect of current densityFor system 3, the impact of the electrolyzer operational current
density, Jel, on gSTF and Cfuel, for changing Tel and pel, is shown inFig. 5a and b. Generally, larger Jel caused a decrease in gSTF dueto increased operating cell potential (Eqs. (12) and (14)), whichin turn increased power demand. At a low temperature range(800–1100 K), Cfuel first decreased to a minimum value withincreasing Jel, which resulted from the reduced electrolyzer areademand for a given plant size (400 kg H2/day), and then increasedwhen further increasing Jel, resulting from the dominant influenceof ohmic losses. For example at Tel = 800 K, the Cfuel decreased from
$10.35/kg to $9.85/kg when Jel increased from 1000 A/m2 to2000 A/m2, while the other parameters were held at the referencevalues. However, Cfuel increased from $9.85/kg to $10.56/kg as Jelfurther increased from 2000 A/m2 to 3000 A/m2 as a result ofincreasing ohmic overpotential. As Tel increased, the minimum Cfuelmoved to larger Jel due to the exponential reduction of ohmic over-potential (Eq. (14)) at elevated temperatures. The minimum Cfuelwas obtained at Jel > 10,000 A/m2 (the uper limit of Jel investigatedin this study) when Tel > 1100 K. The decrease in gSTF with increas-ing Jel was affected by Tel and pel: the magnitude of the drop in gSTFwith increasing Jel decreased with increasing Tel (Fig. 5a) andincreasing pel (Fig. 5b). For example, the absolute reduction of gSTFwas 5.38 percentage points at 800 K, and 0.81 percentage points at1200 K, when Jel was increased from 1000 A/m2 to 10000 A/m2. ThegSTF was relatively insensitive to changes in Jel at higher pel. Forexample, the absolute reduction in gSTF was 2.75 percentage pointsat 10 atm, and 3.96 percentage points at 1 atm.
Isothermal operation was assumed in the current study, whichassumes that the electrolyzer and inlet and outlet gas tempera-tures are at a constant temperature. This requires additional heat-ing or cooling equipment for the electrolyzer depending on thedifference between operation voltage, hVeli, and thermoneutralvoltage, Vtn. If hVeli > Vtn, the electrolyzer works at an exothermicvoltage, requiring a cooling device to maintain the temperature.If hVeli < Vtn, additional heating is required. Operation at ther-moneutral voltage simplifies the system design and avoids theneed for additional heating or cooling components. The combina-tions of Tel, pel, and Jel resulting in thermoneutural voltage opera-tion are shown in Fig. 5c. Thermoneutral operation is achievedwhen simultaneously increasing Jel and Tel at pel=10 atm, suggest-ing that high efficiency and low cost can be achieved under ther-moneutral electrolyzer conditions (Fig. 5a). For example: underthermoneutral operation, gSTF = 9.95% and Cfuel = $6.29/kg forTel = 1000 K, pel = 10 atm, and Jel = 4642 A/m2, while for the sameTel and pel, either (i) the maximal gSTF (11.4%) was achieved atJel = 1000 A/m2, and at a potential lower than Vtn (0.258 V lower),or (ii) the minimum Cfuel ($6.28/kg) was achieved at Jel = 10,000 -A/m2, and at a potential slightly larger than Vtn (0.022 V higher).For a fixed Tel, a decrease in pel resulted in larger Jel at thermoneu-tral conditions, resulting from the reduced Nernst potential, whichin turn further reduced Cfuel. Additionally, the larger Jel reduces theelectrolyzer cost, further reducing Cfuel.
4.4.2. Effect of heat exchange effectivenessSince the electrolyzer working temperature is in the range of
800–1500 K, large amounts of heat are required for heating thereactants and the sweep gas, leading to a significant influence of
a)
0.04 0.06 0.08 0.10 0.12 0.14456789
1011121314
Tel=800 KTel=900 KTel=1000 KTel=1200 KTel=1500 K
Cfu
el ($
/kg)
STF
0.1
0.2
0.3
0.4
0.5
0.6
0.7
0.8
0.9
HE0.98 b)
0.08 0.09 0.10 0.11 0.12 0.135.0
5.5
6.0
6.5
7.0
7.5
8.0
0.1
0.2
0.3
0.4
0.5
0.6
0.7
0.8
0.9
0.98HE
Cfu
el ($
/kg)
STF
pel=1 atmpel=10 atmpel=25 atm
Fig. 6. For system 3, gSTF and Cfuel as a function of eHE and (a) Tel with pel = 10 atm, and (b) pel with Tel = 1000 K. Symbol colors indicate eHE. The solid lines with symbolsrepresent Tel for (a), and pel for (b). Dashed lines are for the reference case with changing eHE.
a)
0.02 0.04 0.06 0.08 0.10 0.12 0.144
6
8
10
12
14
16
18
20
Cfu
el ($
/kg)
STF
Tel=800 KTel=900 KTel=1000 KTel=1100 KTel=1200 KTel=1300 KTel=1500 K
100
200
300
400
500
600
700
800
900
1000DNI (W/m2) b)
0.04 0.06 0.08 0.10 0.12 0.144
6
8
10
12
14DNI (W/m2)
C fuel ($
/kg)
STF
pel=1 atmpel=5 atmpel=10 atmpel=15 atmpel=20 atmpel=25 atm
100
200
300
400
500
600
700
800
900
1000 c)
Fig. 7. For system 3, gSTF and Cfuel as a function of DNI and (a) Tel for pel = 10 atm, or (b) pel for Tel = 1000 K. (c) gSTF and Cfuel as a function of CR and DNI for pel = 10 atm andTel = 1000 K. In (a) and (b), symbol colors indicate the DNI. The solid lines with symbols represent Tel for a) and pel for (b). Dashed lines are for the reference case with varyingDNI. In (c), symbols represent varying CR, and hollow symbols are for reference cases with changing DNI.
M. Lin, S. Haussener / Solar Energy 155 (2017) 1389–1402 1399
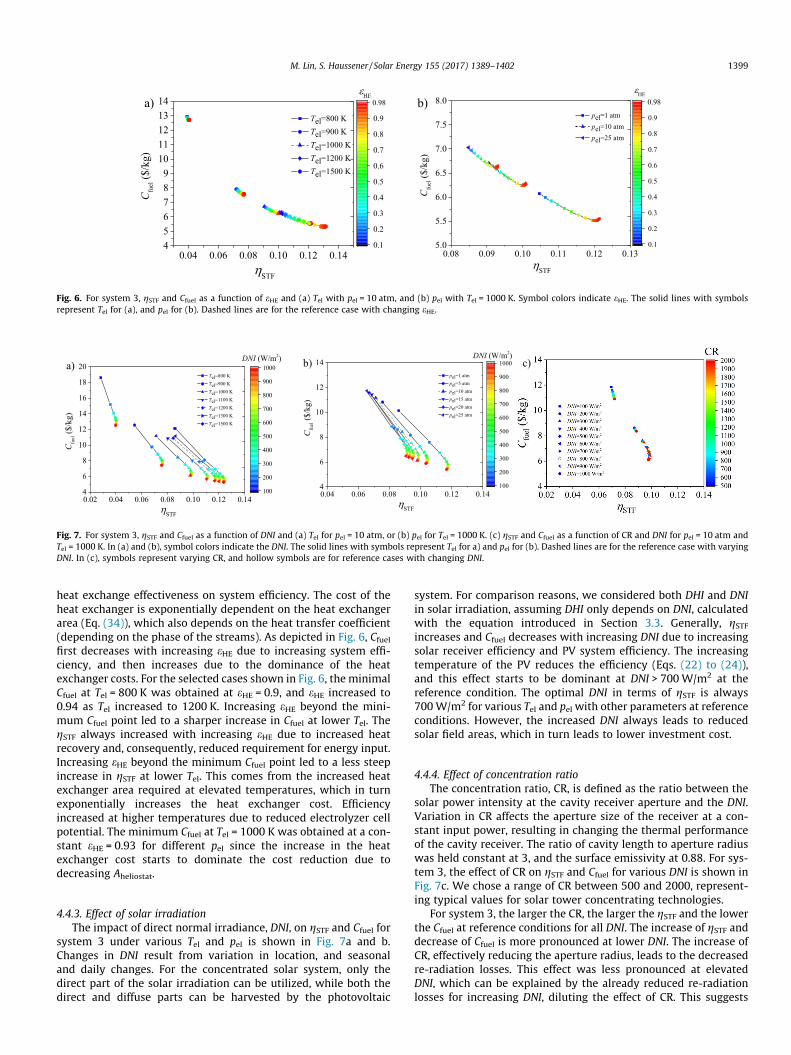
heat exchange effectiveness on system efficiency. The cost of theheat exchanger is exponentially dependent on the heat exchangerarea (Eq. (34)), which also depends on the heat transfer coefficient(depending on the phase of the streams). As depicted in Fig. 6, Cfuelfirst decreases with increasing eHE due to increasing system effi-ciency, and then increases due to the dominance of the heatexchanger costs. For the selected cases shown in Fig. 6, the minimalCfuel at Tel = 800 K was obtained at eHE = 0.9, and eHE increased to0.94 as Tel increased to 1200 K. Increasing eHE beyond the mini-mum Cfuel point led to a sharper increase in Cfuel at lower Tel. ThegSTF always increased with increasing eHE due to increased heatrecovery and, consequently, reduced requirement for energy input.Increasing eHE beyond the minimum Cfuel point led to a less steepincrease in gSTF at lower Tel. This comes from the increased heatexchanger area required at elevated temperatures, which in turnexponentially increases the heat exchanger cost. Efficiencyincreased at higher temperatures due to reduced electrolyzer cellpotential. The minimum Cfuel at Tel = 1000 K was obtained at a con-stant eHE = 0.93 for different pel since the increase in the heatexchanger cost starts to dominate the cost reduction due todecreasing Aheliostat.
4.4.3. Effect of solar irradiationThe impact of direct normal irradiance, DNI, on gSTF and Cfuel for
system 3 under various Tel and pel is shown in Fig. 7a and b.Changes in DNI result from variation in location, and seasonaland daily changes. For the concentrated solar system, only thedirect part of the solar irradiation can be utilized, while both thedirect and diffuse parts can be harvested by the photovoltaic
system. For comparison reasons, we considered both DHI and DNIin solar irradiation, assuming DHI only depends on DNI, calculatedwith the equation introduced in Section 3.3. Generally, gSTFincreases and Cfuel decreases with increasing DNI due to increasingsolar receiver efficiency and PV system efficiency. The increasingtemperature of the PV reduces the efficiency (Eqs. (22) to (24)),and this effect starts to be dominant at DNI > 700W/m2 at thereference condition. The optimal DNI in terms of gSTF is always700W/m2 for various Tel and pel with other parameters at referenceconditions. However, the increased DNI always leads to reducedsolar field areas, which in turn leads to lower investment cost.
4.4.4. Effect of concentration ratioThe concentration ratio, CR, is defined as the ratio between the
solar power intensity at the cavity receiver aperture and the DNI.Variation in CR affects the aperture size of the receiver at a con-stant input power, resulting in changing the thermal performanceof the cavity receiver. The ratio of cavity length to aperture radiuswas held constant at 3, and the surface emissivity at 0.88. For sys-tem 3, the effect of CR on gSTF and Cfuel for various DNI is shown inFig. 7c. We chose a range of CR between 500 and 2000, represent-ing typical values for solar tower concentrating technologies.
For system 3, the larger the CR, the larger the gSTF and the lowerthe Cfuel at reference conditions for all DNI. The increase of gSTF anddecrease of Cfuel is more pronounced at lower DNI. The increase ofCR, effectively reducing the aperture radius, leads to the decreasedre-radiation losses. This effect was less pronounced at elevatedDNI, which can be explained by the already reduced re-radiationlosses for increasing DNI, diluting the effect of CR. This suggests
0
1
2
3
4
5
1.33
a)
Mol
ar ra
tio o
f H
2/CO
Molar ratio of CO2/H2O
Tel= 800K, pel= 1atm Tel= 900K, pel= 1atm Tel= 1000K, pel= 1atmTel= 1200K, pel= 1atm Tel= 800K, pel= 5atmTel= 900K, pel= 5atmTel= 1000K, pel= 5atm
2
0 1 2 3 0 1 2 3
0.04
0.06
0.08
0.10
0.12
0.14
1.52
1.311.23
1.18
1.09
b)
STF
Molar ratio of CO2/H2O
Tel= 800K, pel= 1atm Tel= 800K, pel= 5atm Tel= 900K, pel= 1atm Tel= 900K, pel= 5atm Tel= 1000K, pel= 1atm Tel= 1000K, pel= 5atmTel= 1200K, pel= 1atm
1.98$/kg
Fig. 8. (a) H2 to COmolar ratio of synthesis gas as a function of cathode inlet molar ratio of CO2 to H2O for varying Tel and pel (solid lines for 1 atm and dashed lines for 10 atm),(b) gSTF as a function of cathode inlet molar ratio of CO2 to H2O for various Tel and pel. Symbols in (b) represent cases that result in a molar ratio of H2 to CO equal to 2, with thenumber indicating the corresponding fuel cost.
1400 M. Lin, S. Haussener / Solar Energy 155 (2017) 1389–1402
that CR is not the limiting factor for high gSTF and low Cfuel whenthe DNI of the chosen location is larger than 300W/m2.
4.4.5. Effect of water conversion extentFor system 3, the effect of water conversion extent, Wce, on gSTF
and Cfuel for varying Tel and pel is shown in Fig. S6. The increase ofWce can lead to three contradictory effects: (i) a reduced energyneed for heating the water to the required operational temperature(i.e. the total fluid heating demand was 1974.1 kW at the referenceconditions, and decreased to 514.9 kW for Wce = 1), (ii) mass trans-port limitations in the porous cathode increasing the Nernst poten-tial (i.e. 0.954 V at the reference conditions, increased to 1.037 Vfor Wce = 1), which in turn leads to an increased electrolyzer elec-tricity demand (i.e. total electricity demand for the electrolyzerwas 1750 kW at the reference conditions, increased to 1861 kWforWce = 1), and (iii) reduced requirements for pumping of the fluid(i.e. total pumping power demand was 374.4 kW at the referenceconditions, decreased to 74.9 kW for Wce = 1). As shown inFig. S6, the increase of Wce always benefits gSTF and Cfuel, domi-nantly coming from the effects of reduced heating and pumpingdemands compared to the increased electricity demand of the elec-trolyzer (due to increasing Nernst potential). Generally, an increasein Wce leads to increasing gSTF and decreasing Cfuel. However, lowerpel may result in mass transport limitations of the water in thecathode. For example at pel = 1 atm, an increase of Wce above0.85 reduced gSTF, which resulted primarily from the potentialincrease effects over the benefit of pumping and heating demandreduction. At a constant Wce, a reduction in pressure reduces Cfuelbecause of the reduced compression demand.
4.5. Synthesis gas production in system 3
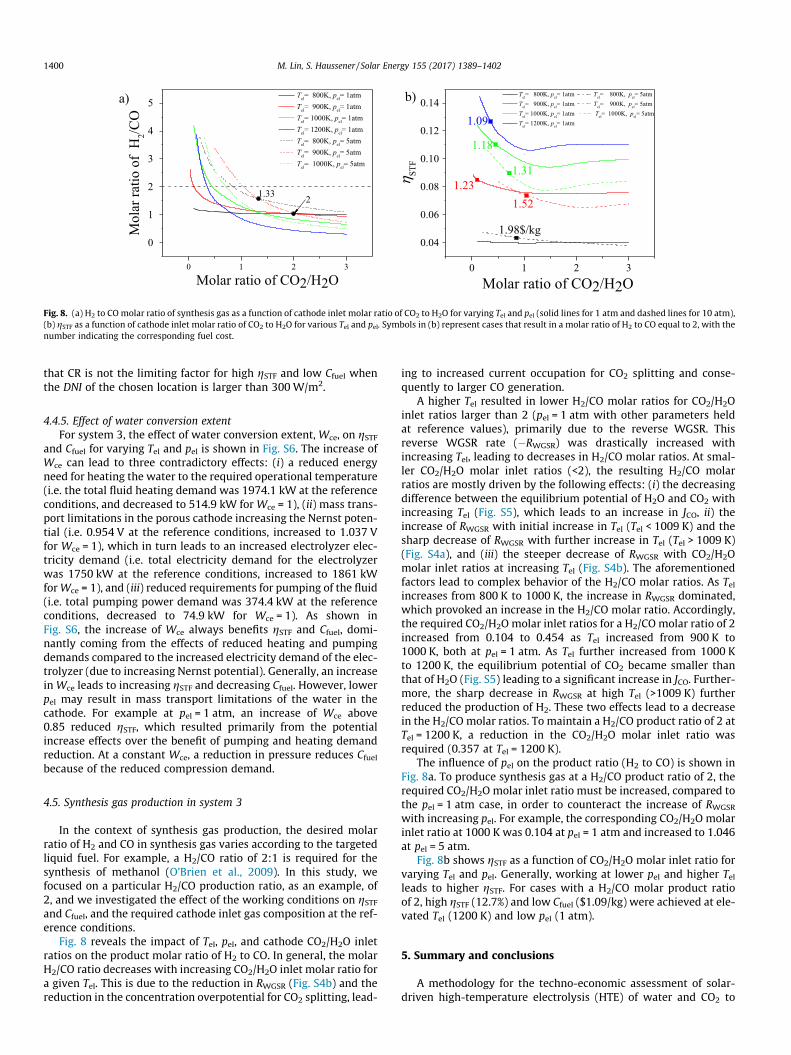
In the context of synthesis gas production, the desired molarratio of H2 and CO in synthesis gas varies according to the targetedliquid fuel. For example, a H2/CO ratio of 2:1 is required for thesynthesis of methanol (O’Brien et al., 2009). In this study, wefocused on a particular H2/CO production ratio, as an example, of2, and we investigated the effect of the working conditions on gSTFand Cfuel, and the required cathode inlet gas composition at the ref-erence conditions.
Fig. 8 reveals the impact of Tel, pel, and cathode CO2/H2O inletratios on the product molar ratio of H2 to CO. In general, the molarH2/CO ratio decreases with increasing CO2/H2O inlet molar ratio fora given Tel. This is due to the reduction in RWGSR (Fig. S4b) and thereduction in the concentration overpotential for CO2 splitting, lead-
ing to increased current occupation for CO2 splitting and conse-quently to larger CO generation.
A higher Tel resulted in lower H2/CO molar ratios for CO2/H2Oinlet ratios larger than 2 (pel = 1 atm with other parameters heldat reference values), primarily due to the reverse WGSR. Thisreverse WGSR rate (�RWGSR) was drastically increased withincreasing Tel, leading to decreases in H2/CO molar ratios. At smal-ler CO2/H2O molar inlet ratios (<2), the resulting H2/CO molarratios are mostly driven by the following effects: (i) the decreasingdifference between the equilibrium potential of H2O and CO2 withincreasing Tel (Fig. S5), which leads to an increase in JCO, ii) theincrease of RWGSR with initial increase in Tel (Tel < 1009 K) and thesharp decrease of RWGSR with further increase in Tel (Tel > 1009 K)(Fig. S4a), and (iii) the steeper decrease of RWGSR with CO2/H2Omolar inlet ratios at increasing Tel (Fig. S4b). The aforementionedfactors lead to complex behavior of the H2/CO molar ratios. As Telincreases from 800 K to 1000 K, the increase in RWGSR dominated,which provoked an increase in the H2/CO molar ratio. Accordingly,the required CO2/H2O molar inlet ratios for a H2/COmolar ratio of 2increased from 0.104 to 0.454 as Tel increased from 900 K to1000 K, both at pel = 1 atm. As Tel further increased from 1000 Kto 1200 K, the equilibrium potential of CO2 became smaller thanthat of H2O (Fig. S5) leading to a significant increase in JCO. Further-more, the sharp decrease in RWGSR at high Tel (>1009 K) furtherreduced the production of H2. These two effects lead to a decreasein the H2/CO molar ratios. To maintain a H2/CO product ratio of 2 atTel = 1200 K, a reduction in the CO2/H2O molar inlet ratio wasrequired (0.357 at Tel = 1200 K).
The influence of pel on the product ratio (H2 to CO) is shown inFig. 8a. To produce synthesis gas at a H2/CO product ratio of 2, therequired CO2/H2O molar inlet ratio must be increased, compared tothe pel = 1 atm case, in order to counteract the increase of RWGSR
with increasing pel. For example, the corresponding CO2/H2O molarinlet ratio at 1000 K was 0.104 at pel = 1 atm and increased to 1.046at pel = 5 atm.
Fig. 8b shows gSTF as a function of CO2/H2O molar inlet ratio forvarying Tel and pel. Generally, working at lower pel and higher Telleads to higher gSTF. For cases with a H2/CO molar product ratioof 2, high gSTF (12.7%) and low Cfuel ($1.09/kg) were achieved at ele-vated Tel (1200 K) and low pel (1 atm).
5. Summary and conclusions
A methodology for the techno-economic assessment of solar-driven high-temperature electrolysis (HTE) of water and CO2 to
M. Lin, S. Haussener / Solar Energy 155 (2017) 1389–1402 1401
hydrogen and CO was developed in order to compare the perfor-mance and cost of three different solar integration schemes at var-ious working conditions. The three solar integration schemesincorporated concentrated solar technology (system 1), photo-voltaic technology (system 2), and the combination thereof (sys-tem 3) for the production of power and heat needed in theprocess. The impact of operating temperature, pressure, currentdensity, heat recovery effectiveness, direct normal irradiance, con-version extent, and concentration ratio was investigated and dis-cussed. The model is developed for the qualitative techno-economic performance evaluation for different solar integrationschemes under various operation conditions.
System 1, utilizing only concentrated solar technology for theproduction of heat and electricity, is able to work at high efficiency,but exhibits large fuel costs resulting from the expensive concen-trated solar heat and power technologies. System 2, utilizing onlyPV technology, allowed for the production of hydrogen at areduced levelized cost of $8.02/kg at the reference condition. Thisresulted from the smaller costs of PV technologies compared toconcentrated solar power (CSP) technologies. System 3 provides asuperior and more competitive techno-economic performancecompared to systems 1 and 2 individually. The predicted hydrogenprice (especially for system 3) is competitive with other solarhydrogen and fuel processing technologies.
Higher operating temperature is always favorable for thesolar-to-fuel efficiency in system 1 and 3. There exists an optimalelectrolyzer operating temperature for system 2 (1300 K) whichallows to achieve the highest solar-to-fuel efficiency. Furtherincrease in temperature leads to larger heating demand, resultingin reduced efficiency. The system 2 shows higher fuel cost at hightemperature (>1050 K at 10 atm) and this transition temperatureincreases with increasing pressure. Working at ambient pressureshows the best performance in terms of efficiency and fuel price.
The system can be optimized by tuning the operational temper-ature and pressure in order to achieve a current density whichresults in minimized efficiency drop and maximized cost reduc-tion. Operation at thermoneutral voltage is suggested to simplifythe heat management of the electrolyzer and shows to be closeto the cost and efficiency-optimum case for large temperaturesand small pressures. Optimized temperature and current densitycombinations for the thermoneutral operation were predicted,resulting in high efficiency and low fuel cost.
A high heat exchanger effectiveness leads to higher efficiencydue to increased heat recovery. However, large heat exchangereffectiveness requires a larger heat exchanger area, leading toexponentially increased heat exchanger cost. Consequently, anoptimal effectiveness for minimized fuel price is observed (around90%). This optimal effectiveness value needs to be chosen for eachsystem design and operating conditions.
Larger DNI results in lower fuel cost due to reduced neededsolar field area in the concentrated solar system (the dominatingcost of systems 1 and 3) and due to the reduced receiver heat lossesowing to the decreased receiver aperture. For system 2, initially PVefficiency increases with increasing DNI. However, the solar-to-fuelefficiency was affected at high DNI (>700 W/m2) due to theincreased PV cell temperature, reducing solar-to-electricity effi-ciency. Consequently, plant location and local irradiation condi-tions need to be carefully considered for system 2, while systems1 and 3 should be built at locations with the largest possible DNI.
Generally, larger water conversion results in larger efficiencyand lower fuel cost. However, at large conversion rates, mass trans-port limits increased the Nernst potential which, in turn, counter-acts the benefit of the reduced heating and pumping energy.Consequently, water conversion needs to be carefully tailored tothe system and operating conditions for optimal system techno-economic performance.
In the context of synthesis gas production, the effects of tem-perature and pressure on fuel price and efficiency are similar tothe hydrogen production cases. Due to the concurrent electrolysisand water-gas shift reactions, a smart combination of inletCO2/H2O molar fraction, Tel, and pel is required to produce a syngasproduct with a desired molar ratio of H2 to CO (here illustratedwith a H2/CO ratio of 2). Lower pel and higher Tel favors highefficiency and low cost syngas production with a H2/CO ratio of2. The system proposed allows to flexibly adjust the productcomposition by adjusting the inlet reactants composition, or theoperational temperature or pressure. Consequently, such a plantcan be combined with a variety of downstream processes, whichmay require different product composition as an input.
In summary, this work provides a complete, detailed, and flex-ible simulation framework for the evaluation of the performanceand cost of three conceptually different solar-driven high-temperature electrolysis systems, differentiated by the utilizationof different solar technologies for solar integration (concentratedsolar or photovoltaics). We quantify the sensitivity of the perfor-mance and cost metrics towards operational conditions (tempera-ture, pressure, current density, heat exchanger effectiveness,irradiation, and concentration ratio) and provide guidance foroperational conditions which maximize the efficiency and mini-mize the cost. Our assessment and comparison of these three com-peting solar integration approaches predicts that the hybridsystem proposed in this paper exhibits an efficiency and costadvantage compared to the others and should be considered apromising scalable approach to large-scale solar fuel processing.
Acknowledgments
The research leading to these results has received funding fromthe European Union’s Seventh Framework Programme (FP7/2007–2013) for the Fuel Cells and Hydrogen Joint Technology Initiativeunder grant agreement no. 621173 (project SOPHIA). We thankthe Chinese Scholarship Council for partial financial support ofthe doctoral studies of Meng Lin.
Appendix A. Supplementary material
Supplementary data associated with this article can be found, inthe online version, at http://dx.doi.org/10.1016/j.solener.2017.07.077.
References
Abanades, A., Rubbia, C., Salmieri, D., 2013. Thermal cracking of methane intohydrogen for a CO2-free utilization of natural gas. Int. J. Hydrogen Energy 38,8491–8496.
Aicart, J., Petitjean, M., Laurencin, J., Tallobre, L., Dessemond, L., 2015. Accuratepredictions of H2O and CO2 co-electrolysis outlet compositions in operation. Int.J. Hydrogen Energy 40, 3134–3148. http://dx.doi.org/10.1016/j.ijhydene.2015.01.031.
Aicart, J., Usseglio-Viretta, F., Laurencin, J., Petitjean, M., Delette, G., Dessemond, L.,2016. Operating maps of high temperature H2O electrolysis and H2O + CO2 co-electrolysis in solid oxide cells. Int. J. Hydrogen Energy 41, 17233–17246. http://dx.doi.org/10.1016/j.ijhydene.2016.07.269.
AlZahrani, A.A., Dincer, I., 2016. Design and analysis of a solar tower basedintegrated system using high temperature electrolyzer for hydrogenproduction. Int. J. Hydrogen Energy 1–15. http://dx.doi.org/10.1016/j.ijhydene.2015.12.103.
Balat, M., 2009. Prospects for worldwide biodiesel market development. EnergySources Part B 4, 48–58.
Becker, W.L., Braun, R.J., Penev, M., Melaina, M., 2012. Production of Fischer–Tropsch liquid fuels from high temperature solid oxide co-electrolysis units.Energy 47, 99–115. http://dx.doi.org/10.1016/j.energy.2012.08.047.
Bertei, a., Nicolella, C., 2015. Common inconsistencies in modeling gas transport inporous electrodes: the dusty-gas model and the Fick law. J. Power Sources 279,133–137. http://dx.doi.org/10.1016/j.jpowsour.2015.01.007.
Bizzarri, F., Bongiorno, M., Brambilla, A., Gruosso, G., 2013. Model of photovoltaicpower plants for performance analysis and production. Forecast 4, 278–285.
1402 M. Lin, S. Haussener / Solar Energy 155 (2017) 1389–1402
Cengel, Y.A., Boles, M.A., Kanoglu, M., 2002. Thermodynamics: an EngineeringApproach. McGraw-Hill, New York.
De Soto, W., Klein, S.A., Beckman, W.A., 2006. Improvement and validation of amodel for photovoltaic array performance. Sol. Energy 80, 78–88. http://dx.doi.org/10.1016/j.solener.2005.06.010.
Duffie, J.A., Beckman, W.A., 2013. Solar Engineering of Thermal Processes. JohnWiley & Sons.
Fang, Q., Blum, L., Menzler, N.H., 2015. Performance and degradation of solid oxideelectrolysis cells in stack. J. Electrochem. Soc. 162, F907–F912. http://dx.doi.org/10.1149/2.0941508jes.
Ferguson, J.R.R., Fiard, J.M.M., Herbin, R., 1996. Three-dimensional numericalsimulation for various geometries of solid oxide fuel cells. J. Power Sources58, 109–122. http://dx.doi.org/10.1016/0378-7753(95)02269-4.
Ferrero, D., Gamba, M., Lanzini, A., Santarelli, M., 2016. Power-to-Gas hydrogen:techno-economic assessment of processes towards a multi-purpose energycarrier. Energy Procedia. 101, 50–57. http://dx.doi.org/10.1016/j.egypro.2016.11.007.
Fu, Q., Mabilat, C., Zahid, M., Brisse, A., Gautier, L., 2010. Syngas production via high-temperature steam/CO2 co-electrolysis: an economic assessment. EnergyEnviron. Sci. 3, 1382. http://dx.doi.org/10.1039/c0ee00092b.
Gibson, T.L., Kelly, N.a., 2008. Optimization of solar powered hydrogen productionusing photovoltaic electrolysis devices. Int. J. Hydrogen Energy 33, 5931–5940.http://dx.doi.org/10.1016/j.ijhydene.2008.05.106.
Gielen, D., 2012. Renewable energy technologies: cost analysis series. Sol. Photovolt.1, 52.
Gilman, P., Dobos, A., 2012. System Advisor Model, SAM 2011.12. 2: GeneralDescription. National Renewable Energy Laboratory (NREL), Golden CO.
Graves, C., Ebbesen, S.D., Mogensen, M., Lackner, K.S., 2011. Sustainablehydrocarbon fuels by recycling CO2 and H2O with renewable or nuclearenergy. Renew. Sustain. Energy Rev. 15, 1–23. http://dx.doi.org/10.1016/j.rser.2010.07.014.
Haberman, B.A., Young, J.B., 2004. Three-dimensional simulation of chemicallyreacting gas flows in the porous support structure of an integrated-planar solidoxide fuel cell. Int. J. Heat Mass Transf. 47, 3617–3629. http://dx.doi.org/10.1016/j.ijheatmasstransfer.2004.04.010.
Holladay, J.D., Hu, J., King, D.L., Wang, Y., 2009. An overview of hydrogen productiontechnologies. Catal. Today 139, 244–260. http://dx.doi.org/10.1016/j.cattod.2008.08.039.
Houaijia, A., Roeb, M., Monnerie, N., Sattler, C., 2015. Solar power tower as heat andelectricity source for a solid oxide electrolyzer: a case study. Int. J. Energy Res.
Howell, J.R., Siegel, R., Menguc, M.P., 2010. Thermal Radiation Heat Transfer. CRCPress.
Kistler, B.L., 1986. A User’s Manual for DELSOL3: A Computer Code for Calculatingthe Optical Performance and Optimal System Design for Solar Thermal CentralReceiver Plants. Sandia National Labs, Livermore, CA (USA).
Knibbe, R., Traulsen, M.L., Hauch, A., Ebbesen, S.D., Mogensen, M., 2010. Solid oxideelectrolysis cells: degradation at high current densities. J. Electrochem. Soc. 157,B1209–B1217. http://dx.doi.org/10.1149/1.3447752.
Koh, J., Yoon, D., Oh, C.H., 2010. Simple electrolyzer model development for high-temperature electrolysis system analysis using solid oxide electrolysis cell. J.Nucl. Sci. Technol. 47, 599–607. http://dx.doi.org/10.1080/18811248.2010.9720957.
Koumi Ngoh, S., Ayina Ohandja, L.M., Kemajou, A., Monkam, L., 2014. Design andsimulation of hybrid solar high-temperature hydrogen production system usingboth solar photovoltaic and thermal energy. Sustain. Energy Technol. Assessm.7, 279–293. http://dx.doi.org/10.1016/j.seta.2014.05.002.
Laguna-Bercero, M.A., 2012. Recent advances in high temperature electrolysis usingsolid oxide fuel cells: a review. J. Power Sources. http://dx.doi.org/10.1016/j.jpowsour.2011.12.019.
Lienhard, J.H., 2013. A Heat Transfer Textbook. Courier Corporation.Meier, A., Gremaud, N., Steinfeld, A., 2005. Economic evaluation of the industrial
solar production of lime. Energy Convers. Manage. 46, 905–926.Menon, V., Fu, Q., Janardhanan, V.M., Deutschmann, O., 2015. A model-based
understanding of solid-oxide electrolysis cells (SOECs) for syngas production byH2O/CO2 co-electrolysis. J. Power Sources 274, 768–781. http://dx.doi.org/10.1016/j.jpowsour.2014.09.158.
Milobar, D.G., Hartvigsen, J.J., Elangovan, S., 2015. A techno-economic model of asolid oxide electrolysis system. Faraday Discuss. 182, 329–339. http://dx.doi.org/10.1039/C5FD00015G.
Momma, A., Kato, T., Kaga, Y., Nagata, S., 1997. Polarization behavior of hightemperature solid oxide electrolysis cells (SOEC). J. Ceram. Soc. Jpn. 105, 369–373.
Myers, D.B., Ariff, G.D., James, B.D., Lettow, J.S., Thomas, C.E., Kuhn, R.C., 2002. Costand performance comparison of stationary hydrogen fueling appliances.Hydrog. Progr. Off.
Neises, T., Wagner, M.J., 2012. Simulation of direct steam power tower concentratedsolar plant. In: ASME 2012 6th Int. Conf. Energy Sustain. Parts A B, pp. 499–507.http://dx.doi.org/10.1115/ES2012-91364.
Ni, M., 2012a. An electrochemical model for syngas production by co-electrolysis ofH2O and CO2. J. Power Sources 202, 209–216. http://dx.doi.org/10.1016/j.jpowsour.2011.11.080.
Ni, M., 2012b. 2D thermal modeling of a solid oxide electrolyzer cell (SOEC) forsyngas production by H2O/CO2 co-electrolysis. Int. J. Hydrogen Energy 37,6389–6399. http://dx.doi.org/10.1016/j.ijhydene.2012.01.072.
Ni, M., Leung, M.K.H., Leung, D.Y.C., 2007. Parametric study of solid oxide steamelectrolyzer for hydrogen production. Int. J. Hydrogen Energy 32, 2305–2313.http://dx.doi.org/10.1016/j.ijhydene.2007.03.001.
O’Brien, J.E., McKellar, M.G., Stoots, C.M., Herring, J.S., Hawkes, G.L., 2009.Parametric study of large-scale production of syngas via high-temperature co-electrolysis. Int. J. Hydrogen Energy 34, 4216–4226. http://dx.doi.org/10.1016/j.ijhydene.2008.12.021.
Padin, J., 2000. Hybrid solar high-temperature hydrogen production system. Int. J.Hydrogen Energy 25, 295–317. http://dx.doi.org/10.1016/S0360-3199(99)00028-2.
Ridler, D.E., Twigg, M.V., 1989. Steam Reforming, Catalyst Handbook. WolfePublishing Ltd, Cleveland, UK.
Rivera-Tinoco, R., Mansilla, C., Bouallou, C., 2010. Competitiveness of hydrogenproduction by high temperature electrolysis: impact of the heat source andidentification of key parameters to achieve low production costs. EnergyConvers. Manage. 51, 2623–2634. http://dx.doi.org/10.1016/j.enconman.2010.05.028.
Sagol, B.E., Seidel, U., Szabó, N., Schwarzburg, K., Hannappel, T., 2007. Basic conceptsand interfacial aspects of high-efficiency III–V multijunction solar cells. Chim.Int. J. Chem. 61, 775–779.
Salzano, F., 1985. Water vapor electrolysis at high temperature: systemsconsiderations and benefits. Int. J. Hydrogen Energy 10, 801–809. http://dx.doi.org/10.1016/0360-3199(85)90168-5.
Sanz-Bermejo, J., Gallardo-Natividad, V., Gonzalez-Aguilar, J., Romero, M., 2014a.Comparative system performance analysis of direct steam generation centralreceiver solar thermal power plants in megawatt range. J. Sol. Energy Eng. 136,11028. http://dx.doi.org/10.1115/1.4026279.
Sanz-Bermejo, J., Muñoz-Antón, J., Gonzalez-Aguilar, J., Romero, M., 2014b. Optimalintegration of a solid-oxide electrolyser cell into a direct steam generation solartower plant for zero-emission hydrogen production. Appl. Energy 131, 238–247. http://dx.doi.org/10.1016/j.apenergy.2014.06.028.
Sapountzi, F.M., Gracia, J.M., Fredriksson, H.O., Niemantsverdriet, J.H., 2017.Electrocatalysts for the generation of hydrogen, oxygen and synthesis gas.Prog. Energy Combust. Sci. 58, 1–35. http://dx.doi.org/10.1016/j.pecs.2016.09.001.
Saur, G., 2008. Wind-to-Hydrogen Project: Electrolyzer Capital Cost Study. Citeseer.Shampine, L.F., Kierzenka, J., Reichelt, M.W., 2000. Solving boundary value problems
for ordinary differential equations in MATLAB with bvp4c. Tutor. Notes, 437–448.
Shaner, M.R., Atwater, H.A., Lewis, N.S., McFarland, E.W., 2016. A comparativetechnoeconomic analysis of renewable hydrogen production using solar energy.Energy Environ. Sci. 9, 2354–2371. http://dx.doi.org/10.1039/C5EE02573G.
Shi, Y., Luo, Y., Li, W., Ni, M., Cai, N., 2015. High temperature electrolysis forhydrogen or syngas production from nuclear or renewable energy. Handb. CleanEnergy Syst.
Singer, C., Buck, R., Pitz-Paal, R., Müller-Steinhagen, H., 2010. Assessment of solarpower tower driven ultrasupercritical steam cycles applying tubular centralreceivers with varied heat transfer media. J. Sol. Energy Eng. 132, 41010. http://dx.doi.org/10.1115/1.4002137.
Stoots, C.M., O’Brien, J.E., Herring, J.S., Hartvigsen, J.J., 2009. Syngas production viahigh-temperature coelectrolysis of steam and carbon dioxide. J. Fuel Cell Sci.Technol. 6, 11014. http://dx.doi.org/10.1115/1.2971061.
Vural, Y., Ma, L., Ingham, D.B., Pourkashanian, M., 2010. Comparison of themulticomponent mass transfer models for the prediction of the concentrationoverpotential for solid oxide fuel cell anodes. J. Power Sources 195, 4893–4904.http://dx.doi.org/10.1016/j.jpowsour.2010.01.033.
Wagner, M.J., 2008. Simulation and Predictive Performance Modeling of Utility-scale Central Receiver System Power Plants. University of Wisconsin-Madison.
Xu, G., Liang, F., Yang, Y., Hu, Y., Zhang, K., Liu, W., 2014. An improved CO2
separation and purification system based on cryogenic separation anddistillation theory. Energies 7, 3484–3502. http://dx.doi.org/10.3390/en7053484.
Zhan, Z., Kobsiriphat, W., Wilson, J.R., Pillai, M., Kim, I., Barnett, S.A., 2009. Syngasproduction by coelectrolysis of CO2/H2O: the basis for a renewable energy cycle.Energy Fuels 23, 3089–3096. http://dx.doi.org/10.1021/ef900111f.