Embed Size (px)
Citation preview
Process-induced Long-term Deformation Behavior of Injection Molded Semicrystalline
Thermoplastics
Prozeßinduziertes Langzeitdeformationsverhalten von spritzgegossenen teilkristallinen Kunststoffen
Von der Fakultät für Maschinenbau der
Technischen Universität Chemnitz
genehmigte
Dissertation
zur Erlangung des akademischen Grades
Doktor-Ingenieur
(Dr.-Ing.)
vorgelegt
von M. Tech, Kaushik Banik
geboren am 07.05.1974 in Hooghly, Indien
Gutachter: Prof. Dr.-Ing. Günter Mennig
Prof. Dr. rer. nat. Helmut Münstedt
Prof. Dr.-Ing. habil. Bernd Platzer
Tag der Einreichung: 18. 01. 2006 Tag der Verteidigung: 16. 08. 2006 http://archiv.tu-chemnitz.de/pub/2006/0127 ISBN: 3-939382-03-5 (978-3-939382-03-4)
Author:
K. Banik
Chemnitz University of Technology, Reichenhainer Str. 70, D 017
09126 Chemnitz
Email: [email protected]
Bibliographic Description Banik, Kaushik
Process-induced Long-term Deformation Behavior of Injection Molded Semicrystalline
Thermoplastics
Thesis submitted to the Faculty of Mechanical Engineering at Chemnitz University of
Technology, Institute of Mechanical and Plastics Engineering, Chemnitz, 2006
121 pages, 69 figures, 2 tables and 120 references
Abstract
Injection molding is a very complex process because the polymer experiences a complex
thermorheological history during molding that influences the frozen-in free volume, crystallinity,
molecular orientation and residual stresses inside the part. These generally govern the final part
properties. Therefore it is highly desirable to anticipate the effect of process parameters on the
resulting microstructure and mechanical properties of the finished part in the long run. In the
case of a semicrystalline thermoplastic part, the problem in understanding the deformation
behavior arises from its two-phase structure and a tendency exists to concentrate primarily on the
effect of the crystalline phase on the deformation behavior, while the contribution of the
amorphous phase is less investigated. In this work, the influence of the processing parameters on
the deformation behavior of injection molded semicrystalline thermoplastic parts, viz.,
syndiotactic Polystyrene (sPS) and Polybutylene terepthalate (PBT), has been monitored through
creep. The resulting internal structures due to processing have been determined and the
deformation behavior has been analyzed. It has been observed that only the rate of cooling shows
a remarkable effect on the long-term viscoelastic behavior of an injection molded semicrystalline
thermoplastic part as it influences not only the crystalline, but also the free volume fraction,
whereas the different states of frozen-in orientations and pressure-induced densification have
only a negligible effect. Besides, physical aging also plays an important role in the deformation
behavior of the injection moldings which was manifested with the decrease in the tendency to
creep. Therefore, it was suggested that the cooling rate during injection molding and the aging
time can significantly affect the long-term deformation behavior of the injection molded
semicrystalline thermoplastics. The results also showed that when no significant effect is
observed in terms of short-term mechanical properties by changing the processing conditions,
but while considering the long-term behavior they show a significant effect.
Key words: Injection molding, thermorheological history, semicrystalline, thermoplastics, long-
term deformation behavior, crystallinity, free volume, molecular orientation, physical aging
Referat
Spritzgießen ist ein sehr komplexer Prozeß, weil der Kunststoff während der Verarbeitung eine
komplexe thermorheologische Vorgeschichte durchläuft, die Einfluß auf das im Werkstoff
eingefrorene freie Volumen, die Kristallinität, eingefrorene Molekülorientierungen und
Eigenspannungen hat. Dies hat natürlich Auswirkung auf die innere Struktur des erstarrten
Kunststoffs und das resultierende Deformationsverhalten. Die Probleme beim Verständnis für
das Deformationsverhalten beruhen auf der zweiphasigen Struktur aus amorphen und
teilkristallinen Bereichen, wobei eine Tendenz zu beobachten ist, sich vornehmlich mit der
Kristallinität zu beschäftigen. In dieser Arbeit ist der Effekt der thermorheologischen
Vorgeschichte auf das Deformationsverhalten von zwei teilkristallinen Thermoplasten,
sydiotaktisches Polystyrol (sPS) und Polybutylenterepthalat (PBT), in Form von Kriechen
untersucht worden. Hierfür wurden die verarbeitungsinduzierten inneren Strukturen analysiert.
Es wurde beobachtet, dass vornehmlich die Abkühlrate einen wesentlichen Einfluß auf das
Langzeitdeformationsverhalten hat, in dem es gleichzeitig den Grad der Kristallinität und das
freie Volumen beeinflusst, während Orientierungen und Druckverdichtung sich nur gering
auswirken. Weiter wurde der Einfluß der physikalischen Alterung untersucht. Neben einem
besseren Verständnis für die beim Spritzgießen ablaufenden Vorgänge sind die wesentlichen
Erkenntnisse dieser Untersuchungen, dass bei spritzgegossenen teilkristallinen Kunststoffen in
erster Linie das im Werkstoff vorhandene freie Volumen und der Kristallinitätsgrad die
Relaxationszeiten und folglich das Kriechverhalten bestimmen, andererseits aber keinen
signifikanten Einfluß auf Kurzeitkennwerte haben.
Schlagworte: Spritzgießen, thermorheologische Vorgeschichte, teilkristallin, Thermoplaste,
Langzeitdeformationsverhalten, Kristallinität, freies Volumen, Molekülorientierungen,
physikalische Alterung

Acknowledgement It is a pleasant aspect to express my deep sense of gratitude to all who have helped me along my way through
the doctoral studies and a memorable stay at Chemnitz. There are, of course, very few words to properly thank
all of them.
My foremost thanks go to my supervisor Prof. Dr.-Ing. Günter Mennig. I have been in his project since
October 2002 when I started my doctoral studies. His overwhelming enthusiasm, integral view on research and
his mission for providing a scientific insight has left a deep impression on me. I owe him lots of gratitude for
having me shown the way of research. His kind supervision, stimulating suggestions and constant
encouragement helped me at various stages of my research and writing of this thesis. I am now overwhelmed
with rejoice to avail this rare opportunity of expressing my sincere gratitude to him.
I would also like to thank the Deutsche Froschungsgemeinschaft (DFG) for providing their financial
support to this project, without which it would not have been possible to achieve this great experience.
A journey is easier when travelled together. Interdependence is certainly more valuable than
independence. This thesis is the result of my four years of work in the Institute of Mechanical and Plastics
Engineering accompanied by the support from many people. I am therefore highly indebted to all of them,
especially to my colleagues and my friends for their constant support and friendly advices. I would also like to
thank all our technical staffs who have helped me either during specimen preparation or during the mechanical
testing. Special thanks to Dr. Klaus Nestler (Institute of Physical Chemistry, Technische Universität
Chemnitz), Dr. Dieter Jehnichen and Dr. Konrad Schneider (Leibnitz Institut für Polymer Forschung,
Dresden) for their support and open discussion. I also wish to express my warm and sincere thanks to Prof. Dr.
rer. nat. Helmut Münstedt (Friedrich-Alexander-Universität Erlangen-Nürnberg) and his group for their
invaluable suggestions during the course of this study. Thanks are also due to BASF and PolyOne, Germany,
for their cost-free supply of the materials used in this study.
My profound sense of indebtness evinces to my parents, whose perpetual encouragement filled with
love and affection inspired me to cross several miles. Last but not the least, I owe a lot to my wife, Baishali,
whose patient love, understanding and enormous support enabled me to complete this work. I am glad to share
one of the happiest moments with her.
Chemnitz, January 2006 Kaushik Banik


Contents
1 Introduction and Objective 11
2 Injection Molding and Structural Parameters 15
2.1 Injection molding process 15
2.2 Internal structure and stresses of an injection
molded plastic part 18
2.2.1 Molecular orientation 19
2.2.2 Free volume 19
2.2.3 Crystallinity and crystalline morphology 20
2.2.4 Residual stress 21
3 State of the Art 23 3.1 Free volume theory 23
3.2 Glass transition 27
3.2.1 Effect of cooling rate 28
3.2.2 Effect of pressure 29
3.3 Pressure-induced densification in injection moldings 31
3.4 Semicrystalline morphology 35
3.5 Polymer crystallization 36
3.5.1 Effect of cooling rate 38
3.5.2 Effect of pressure 39
3.5.3 Effect of flow 40
3.6 Physical aging 41
3.7 Long-term deformation behavior of polymers 45
3.7.1 Creep 46
3.7.2 Stress relaxation 48

4 Experimental Investigations 49
4.1 Material 49
4.2 Variation of process parameters 49
4.3 Investigation of the deformation behavior 53
4.3.1 Creep test 53
4.3.2 Short-term tensile tests 54
4.4 Structure Analysis 54
4.4.1 Estimation of free volume 54
4.4.1.1 Specific volume measurement 54
4.4.1.2 Water absorption test 54
4.4.2 Determination of crystallinity 55
4.4.3 Shrinkage 55
4.5 Annealing below Tg 56
5 Crystallinity 57
5.1 Influence of processing conditions 57
5.2 Effect of mold temperature on crystallinity distribution
in the thickness direction of the injection moldings 64
6 Free Volume 67
6.1 Specific volume 68
6.1.1 Influence of processing conditions 68
6.1.2 Volume relaxation due to physical aging and
annealing below Tg 71
6.1.3 Effect of mold temperature on free volume distribution
in the thickness direction of the injection moldings 74
6.2 Water Absorption 75
7 Molecular Orientation 81
7.1 Influence of processing conditions 81
7.2 Effect of mold temperature on molecular orientation
distribution in the thickness direction of the injection moldings 85
Contents
8 Deformation Behavior 87
8.1 Creep behavior 87
8.1.1 Influence of processing conditions 87
8.1.2 Effect of physical aging 93
8.1.3 Deformation behavior of the injection moldings
in the thickness direction 95
8.2 Tensile tests 97
8.3 Tensile properties of the injection moldings
in the thickness direction 102
9 Summary 105
References 109
Curriculum Vitae 121

Chapter 1
Introduction and Objective With the increasing use of polymers in various engineering areas such as electronic, mechanical
and biomedical engineering, a critical evaluation of the stress and deformation is needed to
predict the reliability and failure behavior of such structures. Material property determination is
an important aspect of stress analysis. When compared to the conventional materials like steel,
wood, etc, polymers exhibit lower strength and modulus. Their viscoelastic behavior reflects the
combined effect of the viscous and elastic responses and determines the overall mechanical
properties of the final part. The deformation behavior of polymers is thus quite different from
that of the elastic materials. The material response to the loading depends strongly on the
timescale over which the perturbing force is applied, temperature and the speed at which they are
deformed. This is exhibited in a set of processes like creep or stress relaxation rate. It is well
known that all viscoelastic materials possess mechanical properties which are sensitive to time,
precisely the aging time, due to a thermo-reversible process called “physical aging” [1]. So, the
properties defining the mechanical behavior of a viscoelastic material observed immediately
after its manufacture are inadequate to account for its long-term performance. Hence, to use
polymeric products as critical structural components in existing and novel technological
applications, it is very important to understand this time-dependent viscoelastic behavior of the
polymeric materials in order to predict their long-term performance.
The viscoelastic properties of polymers are also known to depend on the
thermomechanical history during processing, without any chemical intervention. Generally, the
commercial molding processes like injection molding, involve three extreme conditions - very
high cooling rates, high pressure and shear and elongational flow while making a polymeric part.
Thus the complex thermorheological situations that arise by varying the injection molding
process parameters lead to different structural parameters like molecular orientation, residual
stress, free volume and crystallinity (for a semicrystalline polymer) in the finished part varying
along the flow direction as well as along the thickness direction, especially for the
semicrystalline polymers. These can influence the viscoelastic properties of the molding
Introduction and Objective
12
significantly. An extensive review of the effect of processing and more specifically of thermal
history on the properties of semicrystalline thermoplastics and its composites has been made by
DePorter et al [2]. While from an engineering point of view, the particular process variables that
would maximize the product’s performance are crucial, from a research point of view, the
resulting molecular or physical structures that can influence the viscoelastic properties are of
fundamental interest.
While cooling down a thermoplastic part from a higher melt temperature to a lower mold
temperature, the mobility of the polymer chains decreases as the free volume decreases.
According to the free volume theory, in the glassy state, the molecular mobility of a purely
amorphous polymer depends primarily on the molecular packing density and thus on the free
volume [1]. Hence the deformation behavior of the injection molded amorphous thermoplastics
depends primarily on the free volume present [3]. But unlike the amorphous thermoplastics,
semicrystalline polymers exhibit a complex semicrystalline morphology after processing that
consists of both the amorphous as well as crystalline regions which greatly determines the
properties of the finished part. Therefore a search for a relationship between these structural
parameters and the viscoelastic properties of semicrystalline polymers has been a motive for
extensive study. The problems in understanding the deformation behavior of semicrystalline
polymers arise mainly from the presence of a two-phased structure and a tendency exists in
concentrating primarily on the behavior of the crystalline regions, while the contribution from
the amorphous phase has been less investigated, although it can strongly influence the
deformation behavior of the final part. Also in this context, the effect of thermal history on the
long-term viscoelastic behavior like creep has been less investigated so far.
Therefore, the main objective of this work is to determine the effect of processing history
on the long-term viscoelastic behavior of the moldings and simultaneously to understand the
phenomena behind the time-dependent changes in the viscoelastic behavior of the injection
molded semicrystalline thermoplastics. Thus a goal of this investigation is, on one hand to
deepen the understanding of the role of crystallinity, frozen-in free volume as well as molecular
orientations on the creep behavior of the semicrystalline polymers; on the other hand, it is very
important to convert the knowledge of physical structure to the technologically important
injection molding process.

Chapter 1 13
Overview of this study:
Chapter 2 presents a very brief overview of the injection molding process and the internal
structure and stresses that develops in the part due to injection molding. In chapter 3, the state of
the art has been presented with a review of several subjects that are important and relevant to this
study. Chapter 4 describes the materials and the processing conditions used and the methods of
characterization employed. Chapters 5 and 6 present the effect of injection molding conditions
on the development of crystallinity and free volume respectively in the moldings and also their
distribution along the thickness as obtained from thermal and physical analysis. Chapter 7 deals
with the effect of thermomechanical history during processing on the frozen-in molecular
orientation. A discussion on the dependence of molecular orientation on the thermomechanical
history has been made. Chapter 8 discusses the effect of thermomechanical history on the long-
term as well as short-term deformation behavior of the injection moldings. The effect of physical
aging on the deformation behavior has also been monitored and their creep behavior has been
discussed. Finally, chapter 9 presents the summary of the important observations and conclusions
that can be drawn from the present study.


Chapter 2
Injection Molding and Structural Parameters The final properties of a polymeric product are to a great extend determined by the internal
structure and stresses developed during processing, especially in the case of injection molding
which is a very complicated process. In general for an injection molded semicrystalline
thermoplastic part, apart from the chemical structure of the polymer, there are three important
structural parameters that can determine the final part properties. These are frozen-in molecular
orientations, internal stresses and molecular packing density, which includes free volume and
crystallinity. But before going in details about these important structural parameters, an overview
of the operational sequences and principles associated with the injection molding process is
discussed.
2.1 Injection molding process
Nowadays, injection molding is one of the most commonly and widely used polymeric
fabrication processes for the thermoplastic polymers. More than one-third of all thermoplastic
materials are injection molded and more than half of the polymer processing equipment is for
injection molding. It evolved from metal die casting [4], however, unlike molten metals, polymer
melts have a high viscosity and cannot simply be poured into a mold. Instead a large force must
be used to inject the polymer into the hollow mold cavity. The process allows rapid, automated
production of a wide variety of discrete articles that are complex shaped including curvatures,
snaps, hinges, threaded holes, gear teeth, etc. Complexity is virtually unlimited; sizes may range
from very small to very large with excellent control of tolerances. Identical parts are produced
through a cyclic process involving the melting of the polymer granules followed by the injection
of the polymer melt under high pressure. Most polymers may be injection molded, including
thermoplastics, fiber reinforced thermoplastics, thermosetting plastics and elastomers. Structural
injection molding is also possible in which a core and skin may be made of different polymers.
Reaction injection molding and liquid injection molding, which differ in the manner of mixing

Chapter 2 16
ingredients, involve the injection of liquid polyurethane systems that polymerize within the
mold.
Injection molding machines consist of two basic parts, an injection or plastication unit
and a clamping unit. Today’s injection molding machines are reciprocating-screw injection
molding machines patented in 1956 and are the most common injection unit used nowadays.
Fig. 2.1 Injection molding machine
The main function of the injection unit is to melt the polymer granules and to inject the
molten polymer into the mold. The screw rotates and reciprocates axially. Rotation is produced
by a hydraulic motor and acts to melt, mix and pump the polymer. A hydraulic system controls
the axial reciprocation of the screw, allowing it to act like a plunger, moving the melt forward for
injection. A valve prevents back flow of the melt from the mold cavity.
The clamping unit holds the mold together, opens and closes it automatically and finally
the finished part is ejected. The mold is usually made of steel consisting of sprue and runner
system, gate, mold cavity, cooling system and an ejector system.
The injection molding process occurs cyclically. Typical cycle times range from 10 to
100 seconds and are controlled by the cooling time of the thermoplastic or the curing time of the
thermosetting plastic. A typical injection molding cycle is shown in the Fig. 2.2. The cycle
begins with the closing of the mold. The plastic material in the form of pellets or powder is fed
from the hopper and melted. In a reciprocating screw type injection molding machine, the screw
rotates and simultaneously takes in material from the hopper. The rotating action of the screw
causes the material to plasticate and advance towards the nozzle. The plasticated melt conveyed
forward is stored in front of the screw tip. After the plastication step is completed, the screw
works as a piston and moves forward and fills the mold with melt, holds the melt under high
pressure and adds more melt to compensate for the contraction due to cooling and solidification

Injection Molding and Structural Parameters
17
of the polymer. This is called the holding phase. Eventually the gate freezes, isolating the mold
from the injection unit, the melt cools and solidifies. Next the screw begins to rotate and more
melt is generated for the next shot. The solidified part is then ejected and the mold closes for the
next shot.
Fig. 2.2 Typical phases during injection molding – (A) closing of the mold and melting
of the plastic resin, (B) injection of melt into the mold, (C) holding and cooling of the
mold and (D) removal of the part
The quality of molded parts depends upon the mold design, material properties and
processing. However, common factors that influence the part quality in injection molding include
weld lines (or knit lines), short shot (the cavity is not completely filled), air traps (trapped air
could cause diesel effect and result in burning marks), shrinkage and warpage (distortion in
dimension), material degradation and part aging, voids and sink marks, runner balancing,
residual stresses and overpacking (over weight and flash resulted).

Chapter 2 18
2.2 Internal structure and stresses of an injection molded plastic part
Material characteristics and injection molding process interactively affect the quality of the
resulting molded part. Although the overall process is governed by the thermodynamic principles
that makes it possible to manage the characteristics of the final product, but still it is difficult to
predict the deformation behavior. During the injection phase, locally very different flow rates
arise. The melt flow profile is nearly parabolic (Fig. 2.3). When the polymer melt touches the
cold mold, a solidified outer layer is formed at the wall. This affects mainly the state of
orientation in the outer layers due to the strong interaction between the temperature and the flow
field. A transverse flow of the polymer melt develops at the flow front. Because of the rapid
cooling and the low heat conductivity of polymers very large temperature gradients arise across
the thickness of the molded part. During the holding pressure phase, the melt is packed in the
mold for compensation of the cooling induced polymer shrinkage. This creates further flow
processes of the increasingly higher viscous polymer melt after the initial injection phase. Thus,
during injection molding the polymer experiences a complex thermorheological history. A
further difficulty, when investigating the influence of processing conditions on the properties of
injection molded parts, is that the variation of one processing parameter, e.g. the mold
temperature, usually changes several physical parameters like temperature, pressure and the local
and temporal profiles of the flow rate at the same time. Because of the complexity of the
injection molding process, these variables are closely inter-related in various ways and lead to a
locally different internal structure and stresses of the injection molded part, which generally
influence the mechanical properties. In order to make injection molding process more effective,
it is essential to study the effects of process conditions on the structure and properties of the
moldings.
Fig. 2.3 Schematic of flow profile during injection phase
frozenlayer
pTM
T W
T W Q
Q
velocityprofile
thic
knes
s
V
frozenlayer
pTM
T W
T W Q
Q
velocityprofile
frozenlayer
pTM
T W
T W Q
Q
velocityprofile
thic
knes
s
V
Injection Molding and Structural Parameters
19
As mentioned before, the main structural characteristics of an unreinforced semicrystalline
polymer are the frozen-in molecular orientations, free volume, crystallinity and crystalline
morphology. Besides these, internal stresses (residual stresses) can also be characterized in the
finished product [5]. These internal structures (physical structures) and stresses are briefly
discussed below.
2.2.1 Molecular orientation
Molecular orientation in a molded part means the alignment of the polymer chains in a
preferential direction. Deformation process during injection molding results in a state of
molecular orientation, which remains frozen-in after cooling. Due to a combination of high shear
stress and a high cooling rate adjacent to the mold wall, there is a highly oriented layer frozen-in
immediately below the part surface. As the time for a complete relaxation of the orientations is in
general considerably longer than the cooling time during injection molding, a great part of the
oriented molecules is frozen-in. Due to the thermal insulating effect of the frozen layers, polymer
melt in the hot core is able to relax to a higher degree, leading to a low molecular orientation
zone. This causes anisotropy in various physical properties, dimensional stability and shape. The
degree of frozen-in orientation is strongly influenced by the injection flow rate [6]; slower
injection flow rate produces higher frozen in orientation since more time is available for the
cooling process during the filling phase.
In comparison to the isotropic material, the strength, limiting strain, elongation at break
and elastic modulus is higher in the direction parallel to orientation and lower perpendicular to it
[7]. The state of orientation in an injection molded part, thus, varies both over the cross-section
and along the flow in the molded part.
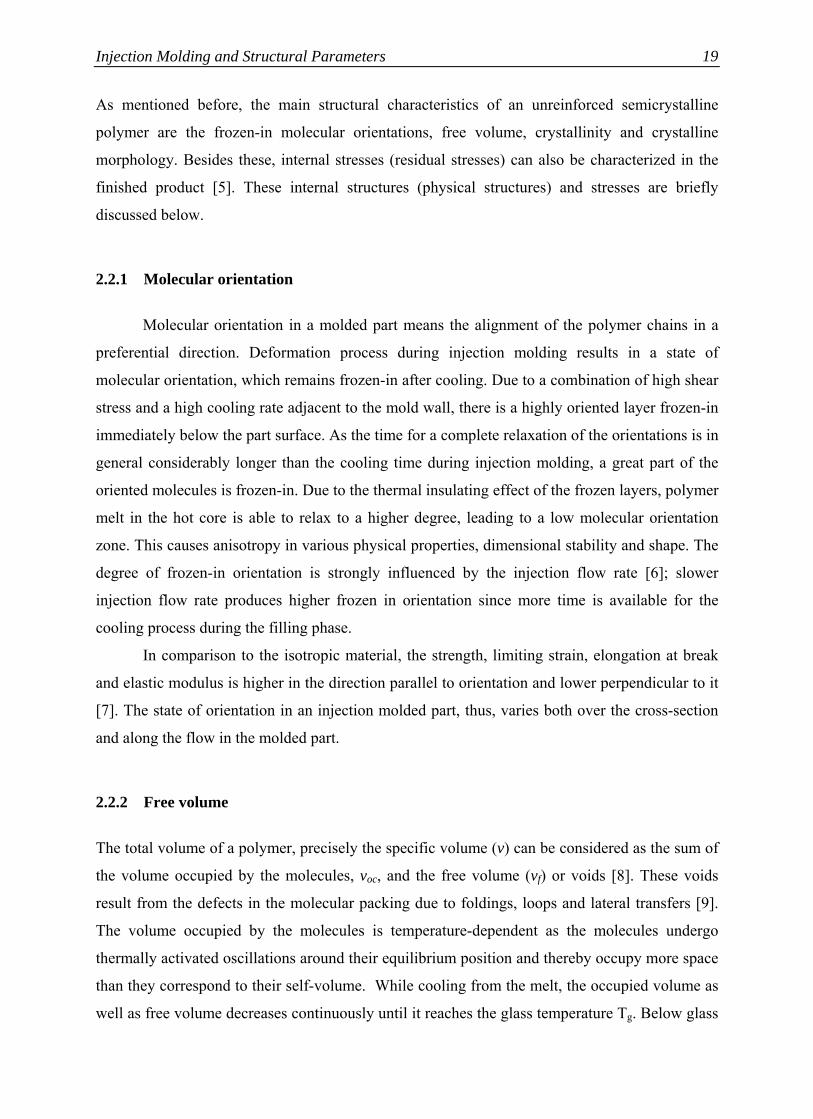
2.2.2 Free volume
The total volume of a polymer, precisely the specific volume (v) can be considered as the sum of
the volume occupied by the molecules, voc, and the free volume (vf) or voids [8]. These voids
result from the defects in the molecular packing due to foldings, loops and lateral transfers [9].
The volume occupied by the molecules is temperature-dependent as the molecules undergo
thermally activated oscillations around their equilibrium position and thereby occupy more space
than they correspond to their self-volume. While cooling from the melt, the occupied volume as
well as free volume decreases continuously until it reaches the glass temperature Tg. Below glass
Chapter 2 20
transition temperature, the specific volume changes very little with time and is mainly attributed
to the time-dependent reduction in free volume. This is observed in v-T-diagram (Fig. 2.4) in
form of a change in the slope of the curve at Tg. In the glassy state, the polymer is in a
thermodynamically metastable state with excess volume. So it tries to reach its hypothetical
thermodynamically equilibrium state by the slowly diffusing out excess free volume (physical
aging) [1, 10]. As free volume diffuses out, the material becomes stiffer and brittle, its modulus
and strength increases and the creep and stress relaxation rate decreases [11].
Fig. 2.4 Temperature dependence of specific volume (v) and occupied volume (vOC)
2.2.3 Crystallinity and crystalline morphology
Molecular shape and the way molecules are arranged in a material play an important role in
determining its properties. Macromolecules of many polymeric materials adopt an ordered
arrangement and form crystalline areas. The molecules are not arranged in regular structures
along their entire length, but in randomly distributed sections only. Therefore parts of the
macromolecules can also be found in a disordered amorphous state. Plastics of this type are
called semicrystalline. Semicrystalline structures are formed during cooling process. Thermal
conditions and flow effects are also important to the formation of crystals. Slow cooling provides
time for greater amounts of crystallization to occur. Fast rates, on the other hand, such as rapid
quenches, yield highly amorphous materials. Subsequent annealing (heating and holding at an
appropriate temperature below the crystalline melting point, followed by slow cooling) will
produce a significant increase in crystallinity in most polymers, as well as relieving stresses.
The degree of crystallinity is defined as the ratio of the crystallized material to material capable
of being crystallized. It determines several properties of the molding. For example, there is a
Tg
vf
Spec
ific
volu
me
Temperature
v
vOC
Tg
vf
Spec
ific
volu
me
Temperature
v
vOC
Injection Molding and Structural Parameters
21
direct correlation between the degree of crystallinity and the weight of the part. Other
characteristics such as yield strength, Young’s modulus and impact strength increases in
proportion to the degree of crystallinity. In most polymers, the combination of crystalline and
amorphous structures forms a material with advantageous properties of strength and stiffness.
Semi-crystallinity is a desirable property for most plastics because they combine the strength of
crystalline polymers with the flexibility of amorphous. Thus semi-crystalline polymers can be
tough with an ability to bend without breaking.
2.2.4 Residual stress
This is a kind of internal stress arising from the rapid cooling of the molded part. During
injection molding cooling is very fast and inhomogeneous, accompanied by thermal stresses.
These stresses are called residual stresses. Residual stresses are process-induced stresses, frozen
in a molded part. It can be either thermal-induced or flow-induced. Thermal-induced stresses are
also called as cooling stresses and are due to the hindered thermal contraction of the (fluid)
center by the solidified outer layer at the cavity wall. Residual cooling stresses lead to
compressive stresses in the (first solidified) outer layers and tensile stresses in the (last solidified)
center of the molded part. These energy-elastic deformations (spontaneously reversible) are very
small (usually below 5%) in comparison to the entropy-elastic deformations arising from
molecular orientations which can have values of several hundred percent [7] and are expressed
by a change of atomic distances and a deformation of valence angles.
In addition to these cooling stresses, residual stresses arise also from the holding pressure
[9]. These are caused by the elastic expansion of the unsolidified areas when releasing the
holding pressure. They affect a part similarly to externally applied stresses. If they are strong
enough to overcome the structural integrity of the part, the part will warp upon ejection, or later
crack, when external service load is applied.
Residual stresses are important, when the molded part fails even without external
mechanical load through stress crack formation [9]. They usually affect the strength of a molded
part and are the main cause of part shrinkage and warpage. Since stiffness is a volume property,
residual stresses have no marked effect on modulus values. Residual stresses can only affect the
dimensional stability of the injection molded parts [3, 7, 9], however for the time-dependent
deformation behavior (e.g. creep behavior) it pays hardly any role. The process conditions and
design elements that reduce shear stress during cavity filling will help to reduce flow-induced
Chapter 2 22
residual stress. Likewise, those that promote sufficient packing and uniform mold cooling will
reduce thermal-induced residual stress.

Chapter 3
State of the Art 3.1 Free volume theory
The free volume theory states that the transport mobility of the particles in a closely packed
system depends primarily on the degree of packing or on the free volume (voids) present. With
the increase in packing, this mobility decreases. In the case of polymers, this transport mobility is
identified with the segmental mobility [1]. When a polymer is cooled down from a temperature
above Tg to a temperature below Tg, the mobility (M) of the polymer chain segments decreases
with decreasing temperature. Since above Tg, a polymer behaves as a rubber or a fluid, even at
very small strains, its segmental mobility is large as its free volume, vf, is also large. Thus, when
the polymer is cooled down, vf and M decrease simultaneously. Since free volume is made up of
holes and the molecules attract one another, the existence of free volume represents an increase
in internal energy (∆U) with respect to the zero free volume state. Free volume actually exists
because it is also accompanied with an increase in entropy (∆S). In fact vf has precisely that value
for which ∆U balances T∆S. A lowering of the temperature decreases the importance of the term
T∆S, so vf and M will also decrease simultaneously as suggested by Turnbull and Cohen [12].
This behavior is shown in Fig. 3.1.
Fig. 3.1 Temperature dependence of free volume and molecular mobility
Tg
M
vf
Free
vol
ume
Temperature
Mol
ecul
arm
obili
ty
Tg
M
vf
Free
vol
ume
Temperature
Mol
ecul
arm
obili
ty
Tg
M
vf
Free
vol
ume
Temperature
Mol
ecul
arm
obili
ty
Tg
M
vf
Free
vol
ume
Temperature
Mol
ecul
arm
obili
ty
Chapter 3 24
The authors [12] further suggested that changes in free volume are brought about by a
redistribution of holes and no energy is required for this redistribution. The rate of this process is
determined by the segmental mobility (M) and this process of volume relaxation can be
symbolically represented by the following closed-loop scheme:
vf M dt dvf
(3.1)
According to this scheme, free volume determines the molecular mobility, while the mobility
determines the rate at which free volume changes. This closed-loop system thus implies that the
volume-relaxation process is basically non-linear [10] and suggests that vf cannot decrease
indefinitely. Below a certain temperature, M becomes so small that vf almost stops decreasing.
The material then passes through its glass transition. Upon further cooling, vf can only change
slightly and slowly. Consequently below Tg, the mobility cannot become zero. A decrease in the
mobility requires a decrease in the free volume and for this there must be mobility. Therefore M
cannot vanish in a finite time; it can only be approached asymptotically. The mobility at any
temperature depends primarily on the free volume remaining, so that the rates of both bulk and
shear deformation can be advantageously expressed in terms of vf rather than temperature as
independent variable. Many theories have been proposed for modeling the effect of
thermodynamic parameters such as temperature or pressure on the time-dependent behavior of
polymers based on the free volume concept. This principle has been applied by Doolittle and
Doolittle [13] in their work on the viscosity of liquids. Assuming that the change in viscosity
depends on the distribution of molecule-size holes in the fluid and the sum of these directly
affects the mobility of the liquid molecules, they expressed the viscosity (η) of ordinary liquids
of low molecular weight with high accuracy as shown in the equation 3.2.
⎟⎟⎠
⎞⎜⎜⎝
⎛ −=
f
f
vvv
BAexpη (3.2)
Here, A and B are empirical constants, v is the total volume and vf is the unoccupied
intermolecular space for molecular motion or the free volume.
In equation 3.2, v and vf can be replaced by the free volume fraction, f, which is defined as
the ratio of free volume to the total volume as shown in the equation 3.3.
vv
f f= (3.3)
State of the Art
25
Equation 3.2 then becomes
⎥⎦
⎤⎢⎣
⎡−= 11exp
fBAη (3.4)
The physical basis of equation 3.4 can be understood from the theory of Cohen and Turnbull [12,
14], which treats the self-diffusion of spherical molecules with the assumption that motion of a
molecule occurs only when a void exceeding some critical volume, v*m, is available for it to
move into. The above equation thus implies that free volume is the sole parameter in determining
the rate of molecular rearrangements. Although these concepts cannot be formulated rigorously,
they make intuitive sense. In equation 3.4, η and f represents the viscosity and the free volume
fraction at a given temperature, T. If η0 and f0 be the same quantities at a conveniently chosen
temperature, T0, then one can write
⎥⎦
⎤⎢⎣
⎡−=
00
11expff
Bηη (3.5)
The Doolittle’s equation is originally referred to the liquids consisting of small molecules.
Williams et al adapted the Doolittle’s equation and modified the Rouse theory for the behavior of
polymers in infinitely dilute solutions to the behavior of polymers in bulk [15]. On the basis of
this approach they lead to
)()(
)()(
00 TT
TT
i
i
f
f
ττ
ηη
= (3.6)
where ηf is the steady-state viscosity and τi is any relaxation time at a given temperature. By
means of a temperature shift factor (aT), the temperature dependence of the relaxation time can
then be written as
⎥⎦
⎤⎢⎣
⎡−==
000
11exp)(
)(ff
BTT
ai
iT τ
τ (3.7)
If T0 is taken as the glass transition temperature, Tg, then equation 3.7 becomes
⎥⎥⎦
⎤
⎢⎢⎣
⎡−==
ggig
iT ff
BTT
a 11exp)(
)(ττ
(3.8)
In the logarithmic form, equation 3.7 becomes
⎥⎦
⎤⎢⎣
⎡−=
0
11303.2
logff
BaT (3.9)

Chapter 3 26
where log aT is the distance required to bring (shift) data recorded at the temperature, T, into
superposition with data recorded at the reference temperature, T0, along the logarithmic time
axis. Williams et al [16] modeled the dependency of free volume on temperature for the
amorphous polymers, homopolymers or random copolymers as
f(T) = f(T0) + αf (T - T0) (3.10)
where αf is the coefficient of thermal expansion of the free volume. By substituting equation 3.10
in 3.9, the empirical WLF equation, well known after William-Landel-Ferry [15] is obtained as
follows
( ) ( )
( ) ( ) ⎥⎥⎥⎥
⎦
⎤
⎢⎢⎢⎢
⎣
⎡
−+
−⋅−=
00
00303.2
logTT
Tf
TTTf
B
a
f
T
α
(3.11)
or ( )
( )02
01logTTC
TTCaT −+
−−= (3.12)
where C1 and C2 are the material constants depending on the reference temperature T0. If T0 = Tg,
then C1 and C2 become C1g = 17.44 K and C2
g = 51.6 K respectively and are called as the
universal constants. Thus the free volume fraction at Tg (fg) is a constant and its value has been
found to be 0.025 ± 0.005 (B ≈ 1) for a majority of systems [15]. The thermal expansion
coefficient, αf, then becomes 4.8 x 10⁴ K-1. It should be noted that αf and fg are quite sensitive to
the graphical fitting of experimental aT and some degree of uncertainty can be expected from this
source.
The change in relaxation time of polymers with temperature depends primarily on the
change in free volume with temperature. With the increase in temperature (T > Tg), the free
volume increases and the polymer molecules take less time to relax. The WLF equation thus
implies that higher temperatures lead to small molecular relaxation times and low temperatures
lead to larger relaxation times. When changing the temperature, the shape of the creep or stress
relaxation curves results are horizontally shifted to the left or right, which represent lower or
higher relaxation times, respectively. The time-temperature equivalence can thus be observed
from the creep or stress relaxation results at various temperatures and the horizontal shift (aT)

State of the Art
27
between the relaxation responses at various temperatures to a reference temperature can be
computed using the WLF equation.
The time dependent behavior of materials is often referred to as viscoelasticity. In
general, for a constant stress, σ, the creep compliance D (t) can be written as the ratio of the
strain (ε) to stress at a certain time, t.
( ) ( )σ
ε tTtTJ ,, = (3.13)
In this case, the time-temperature equivalence can be written as
J (T, t) = J (T0, t / aT) (3.14)
A change in temperature not only influences the free volume and so the specific volume
of the polymeric material, but also the enthalpy and entropy. Goldstein [17] considered excess
enthalpy instead of excess entropy and modeled the logarithmic shift factor as
⎥⎥⎦
⎤
⎢⎢⎣
⎡−=
)(1
)(1
303.2log
g
GST THTH
Ba (3.15)
where H(T) and H(Tg) are the excess enthalpy of the polymer above the glass transition
temperature and at the glass transition temperature respectively and BGS is the Goldstein
proportionality constant. This is again identical with the model of the temperature shift factor
obtained from the WLF equation.
3.2 Glass transition
In order to create a polymer material with a set of desired properties, physics underlying the
material behavior must be understood and characterized. Although various macroscopic
properties around and below the glass transition temperature have been extensively investigated
experimentally, the phenomena of glass transition and relaxation in glasses are not yet fully
understood from molecular point of view.
In polymers, the transition from liquid or rubber-like to glass-like behavior is called the
glass transition. There are many theories including kinetical, phenomenological and thermo-
dynamical models. In the kinetic regime, the glass transition temperature is defined as the
temperature at which large-scale cooperative mobility of the polymer matrix occurs, or
alternatively, where the thermal expansion coefficient (α) changes from the rubbery to the glassy
state with its value being dependent on the rate at which data are measured [18]. The secondary
or β transition, associated with limited molecular mobility below Tg at a temperature Tβ, is a
broad relaxational process. This process is related to side chain rotations (such as the wagging of

Chapter 3 28
the phenyl ring in polystyrene), the motion of a small number of monomeric units in the main
chain and short chain portions. The relaxations, characterized by both Tg and Tβ, represent a
distribution of relaxation times. Among various kinetic models, the free volume theory is the
most widely accepted one. When the polymer is in the liquid or rubber-like state, the amount of
free volume will increase with temperature as the molecular motion increases. If the temperature
is decreased, this free volume will contract and eventually reach a critical value where there is
insufficient free space to allow large scale segmental motion to take place. The temperature at
which this critical volume is reached is the glass transition temperature. Below Tg the free
volume will remain essentially constant as the temperature decreases further, since the chains
have now been immobilized and frozen-in. The glass transition can then be visualized as the
onset of coordinated segmental motion, made possible by an increase of the holes in the polymer
matrix to a size sufficient to allow this type of motion to occur.
3.2.1 Effect of cooling rate
On cooling a polymer from the melt, its volume (also entropy and enthalpy) departs from
equilibrium in a temperature interval around the glass transition temperature (Tg), which depends
not only on the material but also on the cooling rate and asymptotically approaches a glassy
structure with excess values of volume, entropy and enthalpy. This kinetic effect results from the
increasing time scales for molecular motions as the temperature is reduced and results in a
freezing in of the glassy structure. The glass transition region thus represents a range of
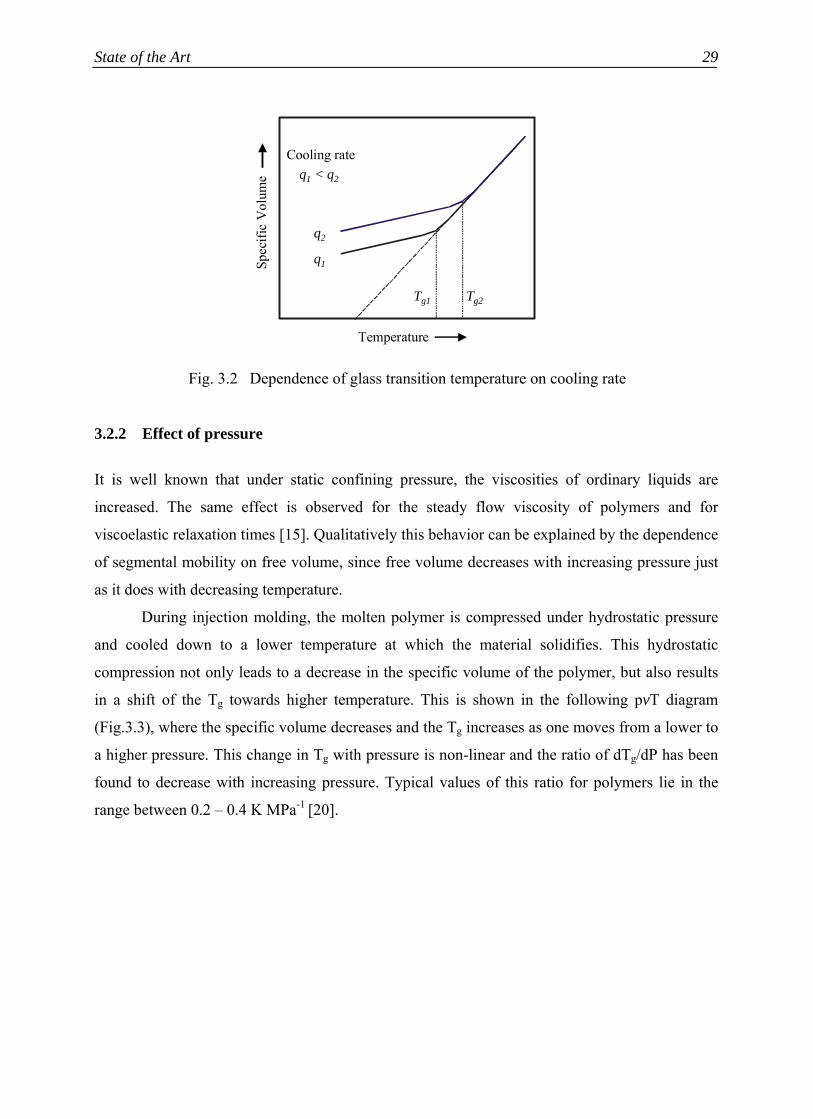
temperatures over which the glass undergoes both thermal and physical changes. Fig. 3.2 shows
the volumetric response to different cooling rates of a glass forming polymer. The recorded Tg
increases with increasing cooling rate. Experimental investigations have shown that Tg is
changed by approximately 3K for a change by a factor of 10 in the cooling rate [19]. At higher
cooling rate (q2), the time available to the system at each temperature is shorter than at a slower
cooling rate (q1) and the curve begins to deviate from the equilibrium line at a higher
temperature. Due to this rapid cooling, more free volume is frozen-in in the material which
results in an increase in the total volume. Moreover, for the semicrystalline polymers, the amount
of crystalline phase fraction also decreases with the increase in the cooling rate. These lead to an
increased mobility of the polymer chain segments that results in higher creep or stress relaxation
rate [1, 11].
State of the Art
29
Fig. 3.2 Dependence of glass transition temperature on cooling rate
3.2.2 Effect of pressure
It is well known that under static confining pressure, the viscosities of ordinary liquids are
increased. The same effect is observed for the steady flow viscosity of polymers and for
viscoelastic relaxation times [15]. Qualitatively this behavior can be explained by the dependence
of segmental mobility on free volume, since free volume decreases with increasing pressure just
as it does with decreasing temperature.
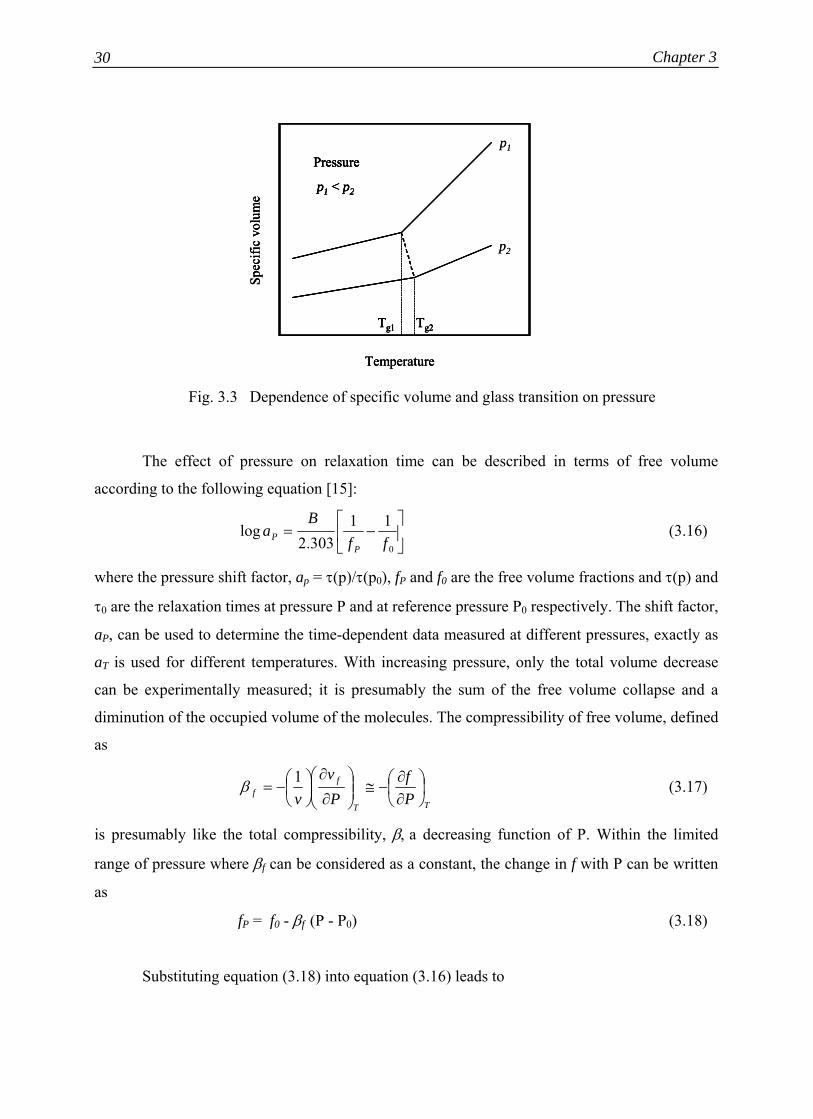
During injection molding, the molten polymer is compressed under hydrostatic pressure
and cooled down to a lower temperature at which the material solidifies. This hydrostatic
compression not only leads to a decrease in the specific volume of the polymer, but also results
in a shift of the Tg towards higher temperature. This is shown in the following pvT diagram
(Fig.3.3), where the specific volume decreases and the Tg increases as one moves from a lower to
a higher pressure. This change in Tg with pressure is non-linear and the ratio of dTg/dP has been
found to decrease with increasing pressure. Typical values of this ratio for polymers lie in the
range between 0.2 – 0.4 K MPa-1 [20].
Tg1 Tg2
Spec
ific
Vol
ume
Temperature
q1 < q2
Cooling rate
q2
q1
Tg1 Tg2
Spec
ific
Vol
ume
Temperature
q1 < q2
Cooling rate
q2
q1
Tg1 Tg2
Spec
ific
Vol
ume
Temperature
q1 < q2
Cooling rate
q2
q1
Tg1 Tg2
Spec
ific
Vol
ume
Temperature
q1 < q2
Cooling rate
q2
q1
Chapter 3 30
Fig. 3.3 Dependence of specific volume and glass transition on pressure
The effect of pressure on relaxation time can be described in terms of free volume
according to the following equation [15]:
⎥⎦
⎤⎢⎣
⎡−=
0
11303.2
logff
Ba
PP (3.16)
where the pressure shift factor, ap = τ(p)/τ(p0), fP and f0 are the free volume fractions and τ(p) and
τ0 are the relaxation times at pressure P and at reference pressure P0 respectively. The shift factor,
aP, can be used to determine the time-dependent data measured at different pressures, exactly as
aT is used for different temperatures. With increasing pressure, only the total volume decrease
can be experimentally measured; it is presumably the sum of the free volume collapse and a
diminution of the occupied volume of the molecules. The compressibility of free volume, defined
as
TT
ff P
fPv
v⎟⎠⎞
⎜⎝⎛
∂∂
−≅⎟⎟⎠
⎞⎜⎜⎝
⎛∂
∂⎟⎠⎞
⎜⎝⎛−=
1β (3.17)
is presumably like the total compressibility, β, a decreasing function of P. Within the limited
range of pressure where βf can be considered as a constant, the change in f with P can be written
as
fP = f0 - βf (P - P0) (3.18)
Substituting equation (3.18) into equation (3.16) leads to
Tg2Tg1
Pressure
p1 < p2
Spec
ific
volu
me
Temperature
p1
p2
Tg2Tg1
Pressure
p1 < p2
Spec
ific
volu
me
Temperature
Tg2Tg1
Pressure
p1 < p2
Tg2Tg1
Pressure
p1 < p2
Spec
ific
volu
me
Temperature
p1
p2
State of the Art
31
( )( )
( )00
00
/303.2/
logPPf
PPfBa
fP −−
−=
β (3.19)
The pressure dependence of relaxation behavior can be analyzed using the equation (3.19) which
provides the values for the free volume fraction and βf (if B is set to unity). Generally for most of
the polymers, βf is less than half of β, so the major portion of the volume change in compression
is due to reduction of the occupied volume. In contrast during thermal expansion major portion is
due to increase in the free volume. In fact βf is presumably closely similar to the difference
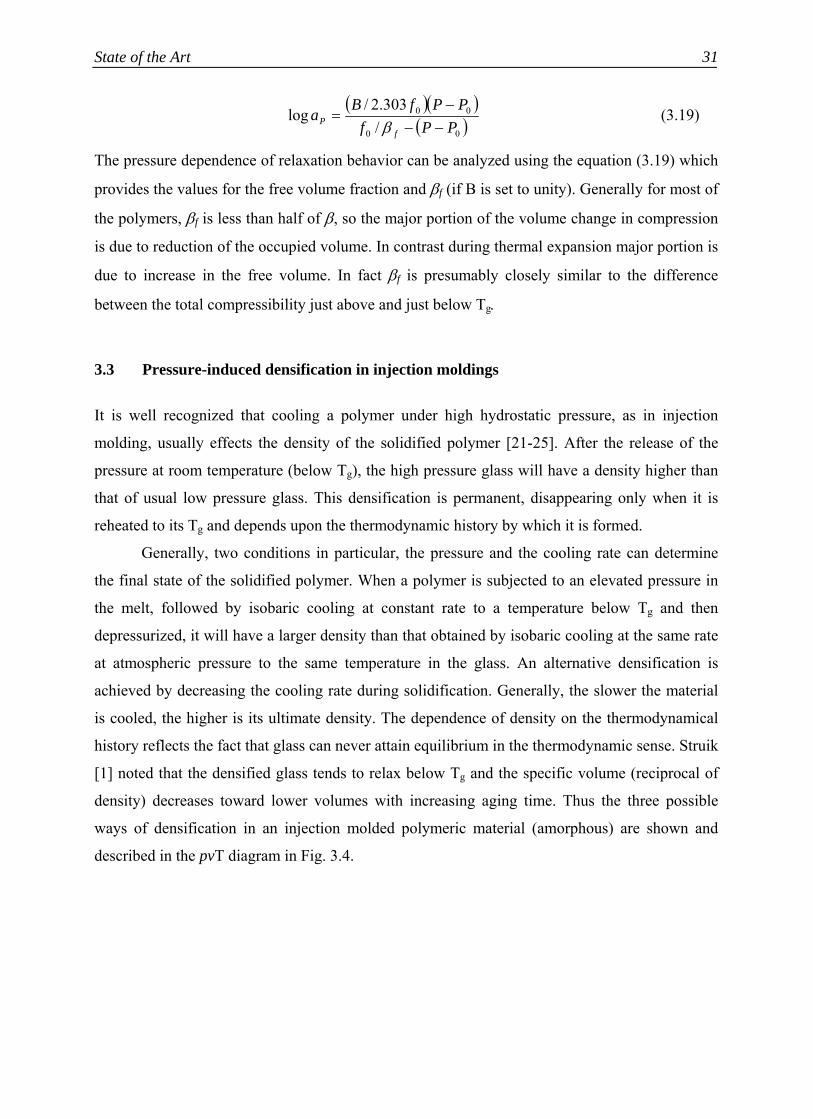
between the total compressibility just above and just below Tg.
3.3 Pressure-induced densification in injection moldings
It is well recognized that cooling a polymer under high hydrostatic pressure, as in injection
molding, usually effects the density of the solidified polymer [21-25]. After the release of the
pressure at room temperature (below Tg), the high pressure glass will have a density higher than
that of usual low pressure glass. This densification is permanent, disappearing only when it is
reheated to its Tg and depends upon the thermodynamic history by which it is formed.
Generally, two conditions in particular, the pressure and the cooling rate can determine
the final state of the solidified polymer. When a polymer is subjected to an elevated pressure in
the melt, followed by isobaric cooling at constant rate to a temperature below Tg and then
depressurized, it will have a larger density than that obtained by isobaric cooling at the same rate
at atmospheric pressure to the same temperature in the glass. An alternative densification is
achieved by decreasing the cooling rate during solidification. Generally, the slower the material
is cooled, the higher is its ultimate density. The dependence of density on the thermodynamical
history reflects the fact that glass can never attain equilibrium in the thermodynamic sense. Struik
[1] noted that the densified glass tends to relax below Tg and the specific volume (reciprocal of
density) decreases toward lower volumes with increasing aging time. Thus the three possible
ways of densification in an injection molded polymeric material (amorphous) are shown and
described in the pvT diagram in Fig. 3.4.
Chapter 3 32
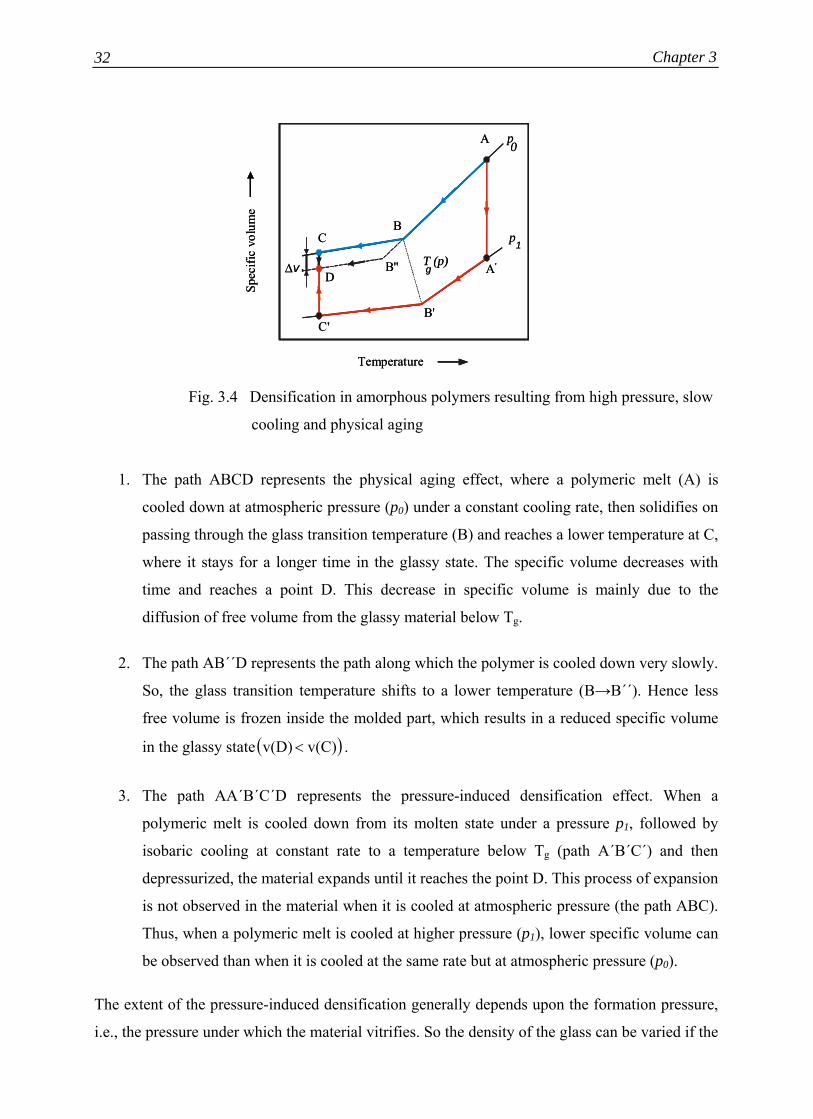
Fig. 3.4 Densification in amorphous polymers resulting from high pressure, slow
cooling and physical aging
1. The path ABCD represents the physical aging effect, where a polymeric melt (A) is
cooled down at atmospheric pressure (p0) under a constant cooling rate, then solidifies on
passing through the glass transition temperature (B) and reaches a lower temperature at C,
where it stays for a longer time in the glassy state. The specific volume decreases with
time and reaches a point D. This decrease in specific volume is mainly due to the
diffusion of free volume from the glassy material below Tg.
2. The path AB´´D represents the path along which the polymer is cooled down very slowly.
So, the glass transition temperature shifts to a lower temperature (B→B´´). Hence less
free volume is frozen inside the molded part, which results in a reduced specific volume
in the glassy state ( ) v(C) v(D) < .
3. The path AA´B´C´D represents the pressure-induced densification effect. When a
polymeric melt is cooled down from its molten state under a pressure p1, followed by
isobaric cooling at constant rate to a temperature below Tg (path A´B´C´) and then
depressurized, the material expands until it reaches the point D. This process of expansion
is not observed in the material when it is cooled at atmospheric pressure (the path ABC).
Thus, when a polymeric melt is cooled at higher pressure (p1), lower specific volume can
be observed than when it is cooled at the same rate but at atmospheric pressure (p0).
The extent of the pressure-induced densification generally depends upon the formation pressure,
i.e., the pressure under which the material vitrifies. So the density of the glass can be varied if the
Temperature
A
A'
B'
B''
C'
∆v
B
T (p)g
C
D
p0
p1
Spec
ific
volu
me
Temperature
A
A'
B'
B''
C'
∆v
B
T (p)g
C
D
p0
p1
Spec
ific
volu
me
State of the Art
33
formation pressure is changed. Price et al [26] noted that the densified glass tends to relax toward
lower density state (higher volume) away from the theoretical equilibrium line, which implies
that densified glass is not necessarily stable. Bree and coworkers [27] claimed that the glasses
that have identical volumes at given temperature and pressure, but have experienced different
thermal histories need not be the same because the thermodynamic state of glass is path
dependent. However they found that these pressure-densified materials do not show any/or
hardly differences in the thermomechanical properties, e.g. torsional creep, impact strength and
yield stress. At the first sight, it seems to be contradictory with the theory of the free volume,
because a much smaller change in density, for example 0.1 % due to physical aging, shifts the
creep curves along the logarithmic time axis usually by several decades [1]. It is also known that
free volume plays a dominant role in determining the viscoelastic behavior of the polymer melts
and glasses. Therefore, the question of whether viscoelastic properties of a glassy polymer are
affected by hydrostatic densification is of great importance for injection molded items. As
investigations in this direction are scarce, therefore very few literatures are available
demonstrating the effect of pressure-induced densification on the relaxation behavior of
polymers. The main effect of hydrostatic pressure on densification of injection moldings is due to
change in void size. The higher the pressure during solidification, the lower is the size of the
voids, but their number is hardly affected. This has been manifested by the water absorbtion
measurements for the amorphous polymers like PC and SAN [3] and illustrated by the Lattice
model. According to this model, the hydrostatic pressure-densified polymers differ from that
formed by slower cooling at atmospheric pressure or physically aged at a constant temperature in
the size of the voids.
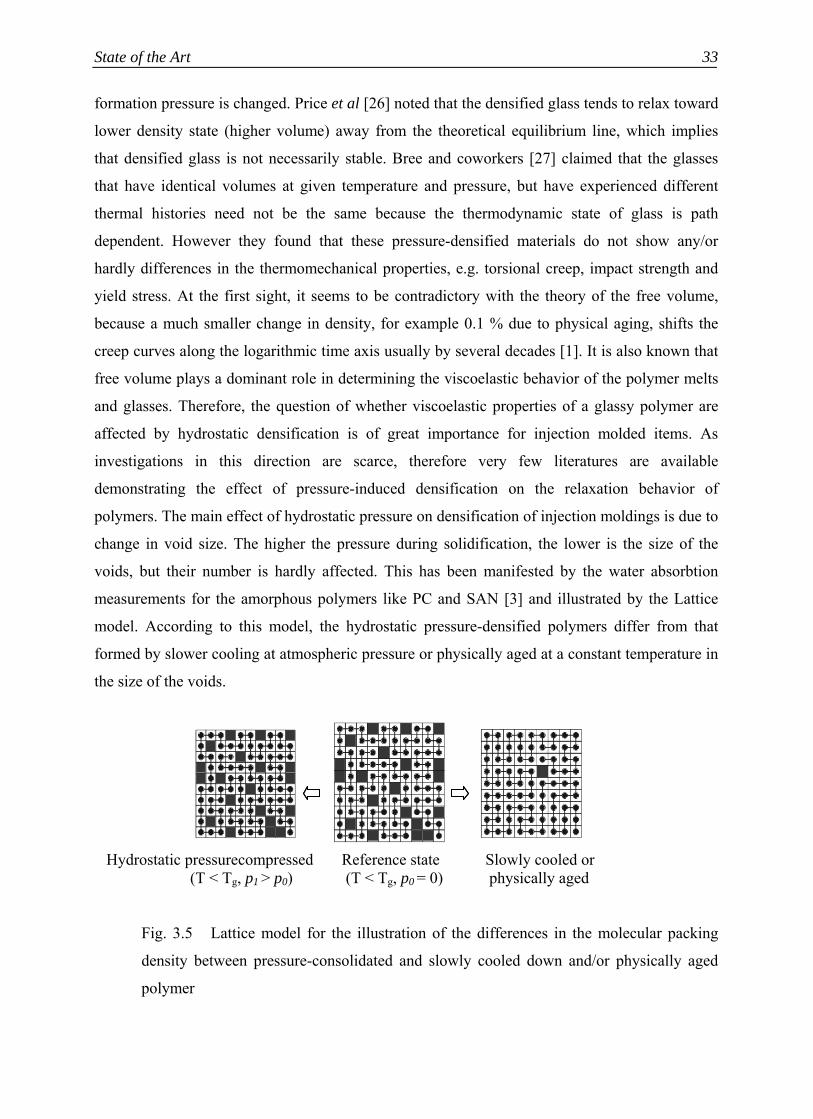
Hydrostatic pressure compressed Reference state Slowly cooled or (T < Tg, p1 > p0) (T < Tg, p0 = 0) physically aged
Fig. 3.5 Lattice model for the illustration of the differences in the molecular packing
density between pressure-consolidated and slowly cooled down and/or physically aged
polymer
Chapter 3 34
In this model, the reference state (cooling at atmospheric pressure) is characterized with a lattice
of 10x10 small squares. The black points in the squares represent a molecule of certain mass
which is coiled inside. The black squares symbolize the frozen-in voids. According to the
Fig.3.5, the reference state can be reached following the path ABC in Fig. 3.4. When the material
is cooled very slowly (following the path AB´´D in Fig. 3.4), the specific volume decreases due
to the reduction in the number voids that are frozen inside the solidified polymer. This is
represented in the lattice model by a lesser number of similar sized black squares. Physical aging
(path ABCD) has in principle the same effect on the molecular packing density as slower
cooling. This decrease in specific volume is generally attributed to the reduction in free volume
fraction that affects the molecular mobility and increases the relaxation time of the solidified
polymer. In the case of the pressure compression (path AA´B´C´D in Fig. 3.4), the solidified
material can possess the same (specific) volume as in the case of physical aging, only the size of
the black squares i.e., voids are reduced due to hydrostatic pressure compression, however the
number of voids remain the same as in reference state. This decrease in the volume is
predominantly due to the decrease in free volume as well as the occupied volume (voc) of the
polymer. Although, the material solidifies under different pressures at different temperatures, but
however Tg(p) remain almost the same and an identical value of f has been observed at Tg. Fig.
3.4 also shows that the polymer expands on releasing the pressure at the glassy state (from C to
D). This increase in volume after releasing the pressure is exclusively due to an incomplete
relaxation of the polymer chains that would not only lead to an increase in the occupied volume,
but also the size of the voids; however the number of voids remains the same. Hydrostatic
pressure-compressed polymers therefore possess almost an unchanged value of the free volume
fraction, f and hence relaxation time. This is according to Ferry [15], equivalent to the same
situation when the free volume fraction is maintained constant by appropriately increasing both
temperature and pressure, then the relaxation time does not change, i.e.,
f
f
fdpdT
dpdT
αβ
τ
=⎟⎟⎠
⎞⎜⎜⎝
⎛=⎟⎟
⎠
⎞⎜⎜⎝
⎛ (3.20)
Therefore the relaxation behavior of the pressure densified polymers is hardly affected by
changing the hydrostatic pressure [27].
The difference in the effect of hydrostatic pressure compression and physical aging or
slow cooling on the molecular packing density of polymers is essential for the correct
interpretation of volume measurements. When investigating the effect of physical aging or
solidifying under different cooling rates, this change in the specific volume (v) can be usually
interpreted by just as large as change in free volume, vf, but if the polymer is solidified under

State of the Art
35
pressure, then this simple correlation is no longer valid. However, unlike the amorphous
polymers, semicrystalline thermoplastics have lower compressibility because of the presence of
crystalline domains and less availability of the free volume. So the change in specific volume due
to hydrostatic pressure compression would also be small when compared to amorphous
thermoplastics.
3.4 Semicrystalline morphology
Most macromolecules can exist in either of two states - amorphous or partially crystalline states,
which are characterized by a degree of conformational order within the chains. Polymers existing
in the partially crystalline state are often referred to as semicrystalline. This is because
semicrystalline polymers usually comprise of amorphous and crystalline regions. The
morphology resulting from crystallization of such polymers has a complex structure where
ordered crystalline regions coexist with regions of disordered chains. The semicrystalline
polymers never crystallize completely because the morphology resulting from the crystallization
process is controlled by kinetics rather than by thermodynamics. In the crystalline phase, the
molecules are aligned in a regular fashion to form a three dimensional intermolecular order. Due
to the presence of a reasonable degree of regularity in the molecular chains, the crystalline state
is thermodynamically more stable than the amorphous state below the equilibrium melting
temperature.
From a theoretical point of view, it is important to note that the above definitions of
semicrystalline polymers assume it as an ideal two-phase system. The interface between the
crystalline and amorphous phases is assumed sharp. This means, the partial properties of the
crystalline and the amorphous phases are those of the ideal crystalline phase and the ideal
amorphous phase. The fringed micelle model was among the first models of semicrystalline
polymers to illustrate the ideas, that crystalline polymers are only partially crystalline and the
size of the individual crystals is smaller than the chains' length. However, the nature of molecular
organization in polymer crystals is misrepresented by this model. After the discovery of the fact
that linear flexible and semiflexible polymers crystallize by the mechanism of chain folding, the
simplistic two-phase fringed micelle model was abandoned, except in few special areas, mostly -
the polymers to which it was applied initially: rubber, cellulose and polymers with very low
crystallinity. After a critical examination on many semicrystalline polymers, the concept of rigid
amorphous fraction has been introduced by many authors [28-34]. With the introduction of the

Chapter 3 36
rigid-amorphous concept, the broadening of the enthalpy curves above the nominal glass
transition temperature of a semicrystalline polymer could be successfully explained.
3.5 Polymer crystallization
The most widespread processes for the manufacture of polymeric products include a step in
which the molten polymer cools down to a solid. During solidification process, semicrystalline
polymers undergo a melt-to-crystal transition with formation of a structure that, in quiescent
melts, is often typified by spherulites. On the microscopic level the spherulites consist of lamellar
crystals, formed by chain folding (Fig. 3.6). The lamellae are separated by regions of amorphous
material, which could consist of free, uncrystallized polymer chains, free ends of chains partially
included in the crystalline lamellae, tight (short) or loose (long) chain folds and tie molecules
which constitute bridges between lamellar crystals (Fig. 3.7). Morphological characteristics and
dimensions of spherulites are often dependent on the conditions under which solidification takes
place. The mechanical properties as well as the transport and optical properties are of course
controlled by the molecular organization attained in the solid state. This leads to the necessity of
a deeper understanding of the crystallization process that optimizes the processes toward
products of superior quality. Many mathematical models have been proposed for describing the
crystallization behavior of semicrystalline polymers based on the isothermal and nonisothermal
crystallization [35-40]. Generally, the crystallinity evolution is described by accounting the
temperature dependent nucleation rate and spherulitic growth rate. The crystallization of
polymers is generally possible over a definite range of temperatures between melting and glass
transition temperature of the polymer and the maximum rate of crystallization is usually observed
at the crystallization temperature. However, the standard tests are limited to the isothermal
conditions or to cooling rates that are sufficiently low when compared to those experienced by
the polymer in actual processing conditions.
State of the Art
37
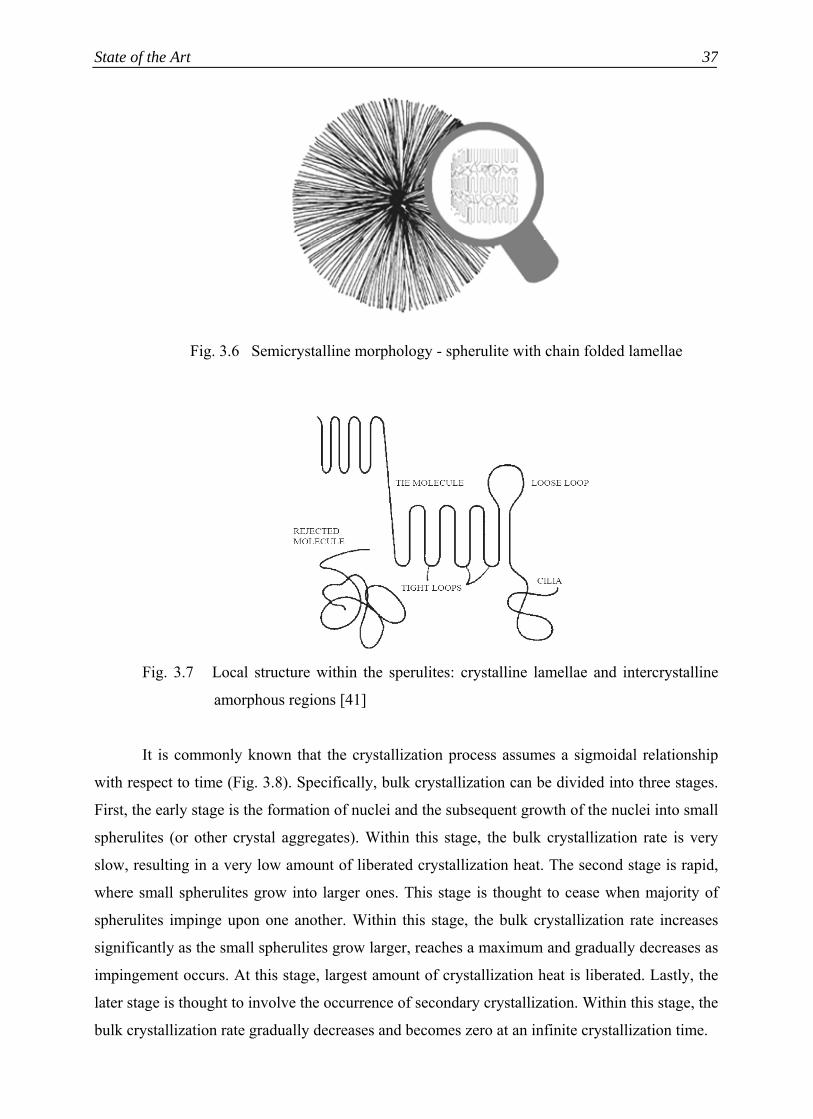
Fig. 3.6 Semicrystalline morphology - spherulite with chain folded lamellae
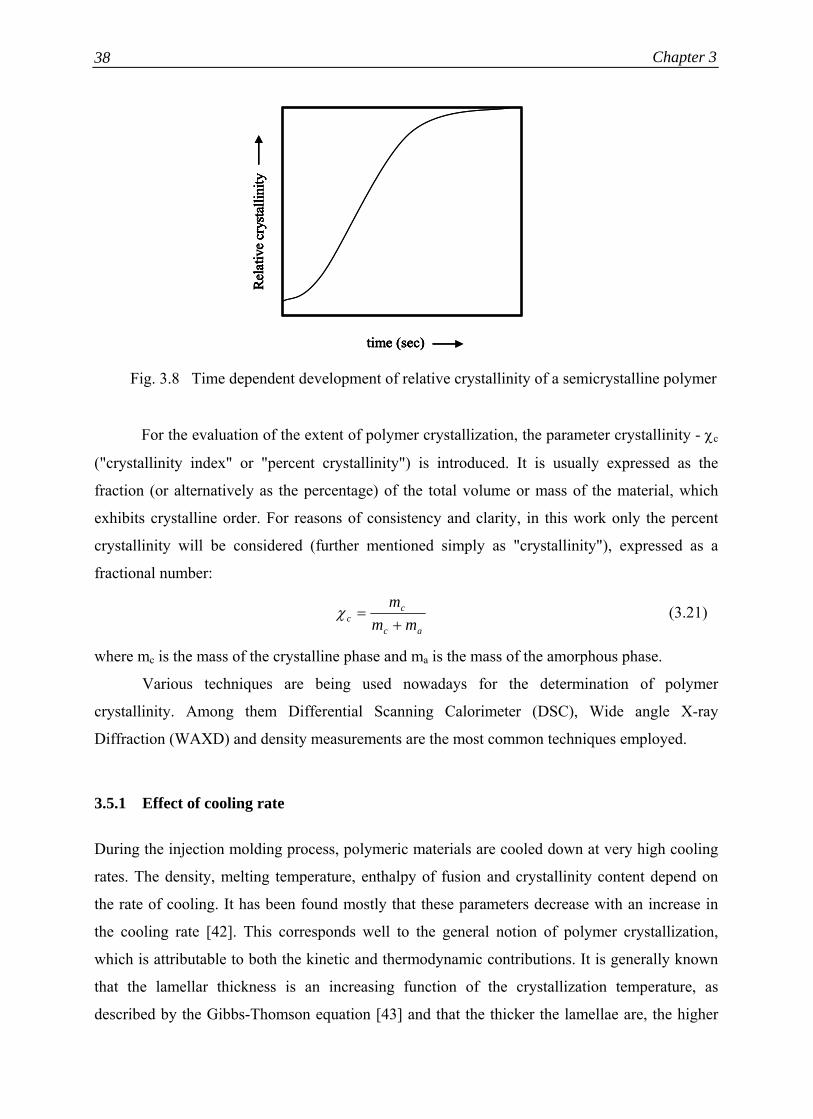
Fig. 3.7 Local structure within the sperulites: crystalline lamellae and intercrystalline
amorphous regions [41]
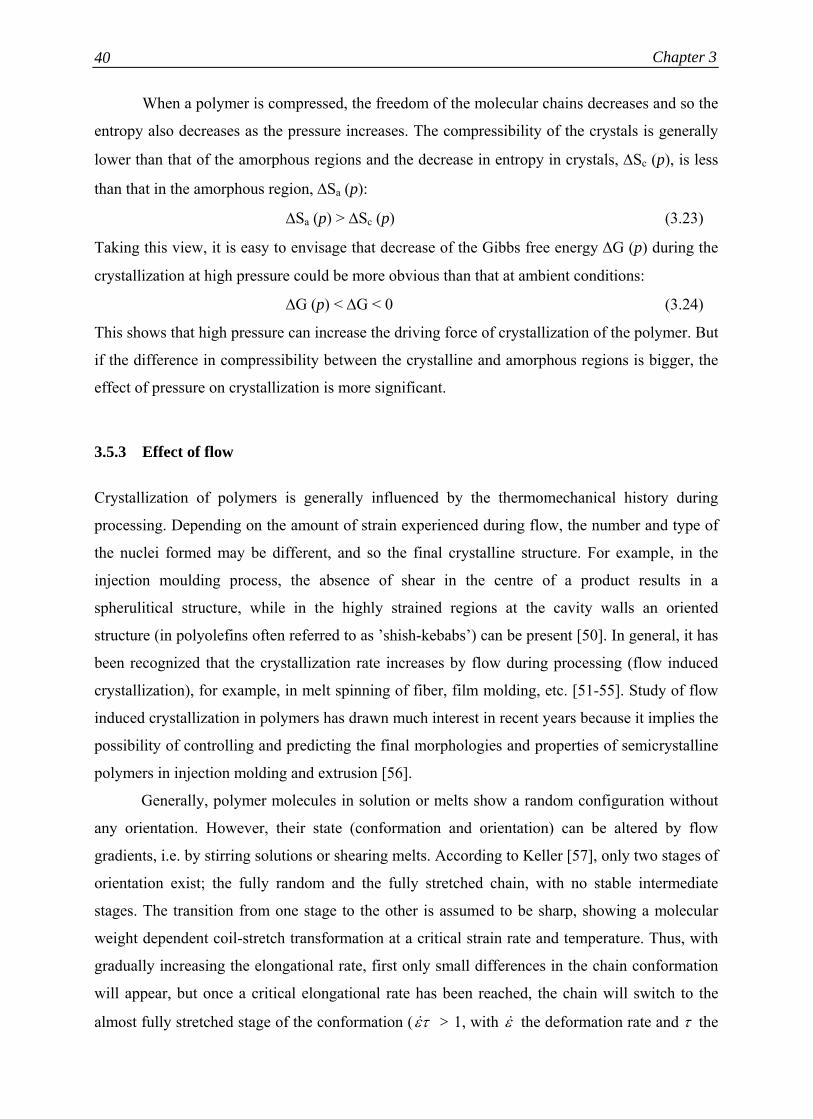
It is commonly known that the crystallization process assumes a sigmoidal relationship
with respect to time (Fig. 3.8). Specifically, bulk crystallization can be divided into three stages.
First, the early stage is the formation of nuclei and the subsequent growth of the nuclei into small
spherulites (or other crystal aggregates). Within this stage, the bulk crystallization rate is very
slow, resulting in a very low amount of liberated crystallization heat. The second stage is rapid,
where small spherulites grow into larger ones. This stage is thought to cease when majority of
spherulites impinge upon one another. Within this stage, the bulk crystallization rate increases
significantly as the small spherulites grow larger, reaches a maximum and gradually decreases as
impingement occurs. At this stage, largest amount of crystallization heat is liberated. Lastly, the
later stage is thought to involve the occurrence of secondary crystallization. Within this stage, the
bulk crystallization rate gradually decreases and becomes zero at an infinite crystallization time.
Chapter 3 38
Fig. 3.8 Time dependent development of relative crystallinity of a semicrystalline polymer
For the evaluation of the extent of polymer crystallization, the parameter crystallinity - χc
("crystallinity index" or "percent crystallinity") is introduced. It is usually expressed as the
fraction (or alternatively as the percentage) of the total volume or mass of the material, which
exhibits crystalline order. For reasons of consistency and clarity, in this work only the percent
crystallinity will be considered (further mentioned simply as "crystallinity"), expressed as a
fractional number:
ac
cc mm
m+
=χ (3.21)
where mc is the mass of the crystalline phase and ma is the mass of the amorphous phase.
Various techniques are being used nowadays for the determination of polymer
crystallinity. Among them Differential Scanning Calorimeter (DSC), Wide angle X-ray
Diffraction (WAXD) and density measurements are the most common techniques employed.
3.5.1 Effect of cooling rate
During the injection molding process, polymeric materials are cooled down at very high cooling
rates. The density, melting temperature, enthalpy of fusion and crystallinity content depend on
the rate of cooling. It has been found mostly that these parameters decrease with an increase in
the cooling rate [42]. This corresponds well to the general notion of polymer crystallization,
which is attributable to both the kinetic and thermodynamic contributions. It is generally known
that the lamellar thickness is an increasing function of the crystallization temperature, as
described by the Gibbs-Thomson equation [43] and that the thicker the lamellae are, the higher
time (sec)
Rel
ativ
e cr
ysta
llini
ty
time (sec)
Rel
ativ
e cr
ysta
llini
ty
time (sec)
Rel
ativ
e cr
ysta
llini
ty
time (sec)
Rel
ativ
e cr
ysta
llini
ty

State of the Art
39
the melting point will be. As the crystallization temperature is a decreasing function of the
cooling rate, the lamellar thickness and melting temperature should certainly be a decreasing
function of the cooling rate. Cooling rate has therefore a pronounced effect on the crystallization
rate of the polymer and the polymer crystallinity. Generally, the higher the cooling rate, the
lower is the amount of the crystallizable materials that will crystallize. This is because slower
cooling will allow the macromolecules to arrange in a more regular pattern than for faster cooled
samples. In addition, as the cooling rate increases, the incorporation of defects, such as loose
loops and dangling chain ends, into the bulk of the crystallizing materials may contribute to the
decrease of density and the enthalpy of fusion. Supahol and Spruiell [42] showed that the melting
temperature and enthalpy of fusion exhibit a power-law relationship with the average cooling
rate. Because the crystallinity content can be calculated from the density or the enthalpy of fusion
data, so it also exhibits a power-law relationship with the cooling rate.
3.5.2 Effect of pressure
Many researchers have shown that pressure can affect the crystallization behavior of polymers
[44-49]. Their results [44-45] showed that some polymers (polyethylene and polyvinylidene
fluoride) have closely-packed hexagonal phase at high pressure, which might induce the
formation of extended chain crystals, whereas reports on polyamide [46-48] did not show
existence of any new loose-packed structure at high pressure, but high pressure is also a
necessary condition for growing extended-chain crystals in polyamide. Liangbin et al [49]
reported an increase in the melting temperature, crystallinity and lamellar thickness of
polyethylene terephthalate formed by quenching under high pressures. A thermodynamic
definition of the melting temperature (Tm) is the temperature at which the free energy of the
crystals and the melt are equal. Above Tm the free energy of the melt is lower, but below Tm the
free energy of the crystals is lower. Thus, on cooling, it is theoretically possible (by
thermodynamic data) for new crystals to form when the temperature first reaches Tm. The
pressure dependence of the melting point is thus determined by thermodynamic analysis of the
first-order transition. The result is
f
mm
HVT
dPdT
∆∆
= (3.22)
∆V is the volume change at the melting point and ∆Hf is the heat of fusion of the pure crystals (or
the enthalpy change at the melting point).
Chapter 3 40
When a polymer is compressed, the freedom of the molecular chains decreases and so the
entropy also decreases as the pressure increases. The compressibility of the crystals is generally
lower than that of the amorphous regions and the decrease in entropy in crystals, ∆Sc (p), is less
than that in the amorphous region, ∆Sa (p):
∆Sa (p) > ∆Sc (p) (3.23)
Taking this view, it is easy to envisage that decrease of the Gibbs free energy ∆G (p) during the
crystallization at high pressure could be more obvious than that at ambient conditions:
∆G (p) < ∆G < 0 (3.24)
This shows that high pressure can increase the driving force of crystallization of the polymer. But
if the difference in compressibility between the crystalline and amorphous regions is bigger, the
effect of pressure on crystallization is more significant.
3.5.3 Effect of flow
Crystallization of polymers is generally influenced by the thermomechanical history during
processing. Depending on the amount of strain experienced during flow, the number and type of
the nuclei formed may be different, and so the final crystalline structure. For example, in the
injection moulding process, the absence of shear in the centre of a product results in a
spherulitical structure, while in the highly strained regions at the cavity walls an oriented
structure (in polyolefins often referred to as ’shish-kebabs’) can be present [50]. In general, it has
been recognized that the crystallization rate increases by flow during processing (flow induced
crystallization), for example, in melt spinning of fiber, film molding, etc. [51-55]. Study of flow
induced crystallization in polymers has drawn much interest in recent years because it implies the
possibility of controlling and predicting the final morphologies and properties of semicrystalline
polymers in injection molding and extrusion [56].
Generally, polymer molecules in solution or melts show a random configuration without
any orientation. However, their state (conformation and orientation) can be altered by flow
gradients, i.e. by stirring solutions or shearing melts. According to Keller [57], only two stages of
orientation exist; the fully random and the fully stretched chain, with no stable intermediate
stages. The transition from one stage to the other is assumed to be sharp, showing a molecular
weight dependent coil-stretch transformation at a critical strain rate and temperature. Thus, with
gradually increasing the elongational rate, first only small differences in the chain conformation
will appear, but once a critical elongational rate has been reached, the chain will switch to the
almost fully stretched stage of the conformation ( τε& > 1, with ε& the deformation rate and τ the

State of the Art
41
relaxation time). Moreover, not only has the critical elongational rate to be reached, it must be
maintained for a certain time as well (ε& t > 1, with t the deformation time). The structures
observed in solutions or melts, all are the result of a combination of both these stages. Lagasse
and Maxwell [58] showed that the shear has a strong accelerating effect on crystallization when
the deformation rate exceeds a critical value. The strain rate is required to be large compared to
the reciprocal of the relaxation time, i.e., the characteristic time corresponding to
disentanglement in the melt is large compared to the characteristic time of deformation. Similar
conclusions were also drawn by Blundell et al [59], who observed that when the stretching rate is
lower than the chain retraction motion, no crystallization occurs during the drawing of
poly(ethylene terephthalate). These experimental results reflect the features of chain relaxation
and, therefore, suggest the relaxation as a key process in the precursor formation for polymer
melt crystallization.
3.6 Physical aging
When a polymeric material is cooled down below its glass transition temperature (Tg), it does not
immediately achieve thermodynamic equilibrium due to kinetic constraints. So at temperatures
below Tg, polymers are in thermodynamic nonequilibrium or metastable state. Their physical
properties such as specific volume, enthalpy and entropy are greater than the equilibrium values.
With time, these properties tend to decrease toward the equilibrium values. Coupled with these
changes, mechanical properties, dielectric properties and microstructure of the samples also vary
[11, 60]. This process is generally called structural relaxation or physical aging by Struik [1] after
being demonstrated many years ago by Kovacs [11] and is mainly attributed to the time-
dependent decrease in free volume below Tg. Unless the temperature is very close to Tg, this
evolution will typically take months or years to complete. Physical aging is thus separated from
curing/degradation phenomenon (chemical aging, damage, etc.) due to thermoreversibility. If a
physically aged material is heated above Tg for a nominal rejuvenation period, the material will
behave the same when subsequently quenched below Tg as following previous quenchings [61].
In the glassy state, the molecular relaxation times become so large that the experimental
time scale during cooling is not sufficient to reach the equilibrium state. Therefore cooling below
the glass transition range leaves a structure which is unable to relax and retain its equilibrium
properties. As the availability of free volume governs the molecular mobility, the structural
relaxation leads to an increase in molecular relaxation times. In the case of the decrease of the

Chapter 3 42
quenched free volume, this change is directly observed in the long-term densification of the
polymer upon annealing at temperatures below Tg.
Many phenomenological models have been proposed in order to describe this relaxation
behavior in polymers and glass-forming liquids. These have been summarized in a review of
physical aging and enthalpy relaxation [62, 63]. Most of them are derived in the framework of
the Tool-Narayanaswamy-Moynihan approach. The structural relaxation, Φ(t), is depicted by a
stretched exponential function [64]
⎥⎥⎦
⎤
⎢⎢⎣
⎡⎟⎠⎞
⎜⎝⎛−=Φ
β
τtt exp)( (3.25)
where τ is the average relaxation time depending on the aging temperature and the structure of
the glass, β (0 < β ≤ 1) is the stretching parameter, which describes the broadness of the
relaxation spectrum of the system. β is retained independent of temperature by invoking the
time-temperature superposition principle.
In the DSC analysis, the extent of enthalpic relaxation toward equilibrium is defined
following the approach proposed by Cowie and Ferguson [65] as
( ) ( )∞∆∆−=Φ HHt t /1 (3.26)
where ∆H∞ is the value of enthalpy relaxation, ∆Ht, at an aging time, te = ∞ and at a given aging
temperature. With increasing aging time, the relaxation enthalpy increases because the polymer
absorbs the heat lost due to the aging process while heating above its Tg.
The change in the viscoelastic behavior, particularly the creep behavior, of physically
aged polymers has been widely investigated by several researchers and extensively by Struik [1].
The authors observed a decreasing tendency of the material to creep with increasing aging time
and the creep curves shifted horizontally along the logarithmic creep time axis as shown in Fig.
3.9. This implies that aging affects the creep properties mainly by changing the relaxation times.
As the creep curves extend over many decades in creep time, so creep cannot be described as a
process with single relaxation time; there must be a wide distribution of the relaxation times
which increases as the aging time is increased.

State of the Art
43
Fig. 3.9 Creep behavior at different aging times (te)
Struik [1] suggested that, for physical aging of polymeric glasses, the creep compliance,
J(t), may be approximated with the following form of the Kohlrausch-Williams-Watts (KWW)
function:
( )⎥⎥⎦
⎤
⎢⎢⎣
⎡⎟⎠⎞
⎜⎝⎛=
β
τtJtJ exp0 (3.27)
where J0 is the creep compliance at t = 0, τ is the characteristic retardation time and β is the
shape parameter. The limitation of this equation is that it is useful for describing only the early
stages of the creep response, when t < τ. Upon physical aging below Tg, τ changes depending on
the aging history. For a given temperature and strain, and assuming that β is independent of
aging time, it is possible to perform time-aging time superposition of the data by reducing the
curves to a reference aging time via a horizontal shift along time axis. In the framework of the
KWW function, the isothermal response at aging time, te, relative to that at some reference aging
time te,ref, can be written in terms of an aging time shift factor ate as:
⎥⎥⎦
⎤
⎢⎢⎣
⎡=
)()(log
,refe
ete t
taττ (3.28)
where τ(te) is the value of τ at an aging time te and τ(te, ref) is the value at the reference aging
time. Knowing the values of ate at different aging times, the horizontal shift rate (µ) can be
determined from the double logarithmic plots of log (ate) vs. log (te) as:
( )
e
te
tdad
loglog
−=µ (3.29)
log (time)
Agingtime < <te1 te 3
te2
Cre
epco
mpl
ianc
e
< <t tt
Cre
epco
mpl
ianc
e
log (time)
Agingtime < <te1 te 3
te2
Cre
epco
mpl
ianc
e
< <t tt
Cre
epco
mpl
ianc
e

Chapter 3 44
Quantitatively, slowing down of the molecular relaxation is described by µ. It decreases with
decreasing aging temperature well below Tg, but approaches a value of 1 at temperatures not too
far away from the glass transition region. Upon further approach to the glass transition region the
value of µ falls down to zero again. It has been normally found that slight shifts in the magnitude
of the creep compliance are often needed to superimpose the data. These vertical shifts represent
a change in the strength of the retardation (creep) process, and, in the context of the KWW
function, can be written as:
( )
( )refe
ete tJ
tJb
,0
0= (3.30)
These have been found to be particularly important above Tg [66]
The description of the effect of physical aging on the response of the glassy polymer, given so
far, is universal for all polymers at temperatures below Tg, whether they are fully amorphous or
partially crystalline, and have been investigated extensively by several authors [67-75]. Hodge
and Berens [67] have applied the glass transition kinetics of Moynihan et al [76], with
nonexponential function and non linear relaxation functions to model the endothermic peaks in
heat capacity resulting from physical aging. Struik [1, 68] studied extensively the effect of
physical aging on the viscoelastic relaxation of the polymer and observed that the relaxation time
increases with the aging time. Lagasse and Curro [69] tried to predict the shift in the creep
response of poly (vinyl acetate) due to physical aging from the volume relaxation measurements
under similar aging conditions. Michele and Vittoria [70] found that besides reduction in free
volume, aging at a temperature slightly lower than Tg decreases the sorption of dichloromethane
at low activity. Ogale and McCullough [71] observed that aging is affected by crystallinity. They
reported that semicrystalline polymers age similarly to the amorphous ones and aging occurs
over a wide range of crystallinity. The development of the crystalline phase could lead to a local
structural change in the amorphous phase and hence, a characteristic change in creep behavior of
the material can also be experienced. Tant and Wilkes [72] reported a linear decrease in the aging
rates with increasing crystallinity for PET. Their data appear to indicate that aging in
semicrystalline polymers is largely a function of the crystalline weight fraction, while other
reports [77] suggest that semicrystalline morphology could play a role in the aging process.
Physical aging in semicrystalline polymers has been found to be able to occur at
temperatures above the Tg, remarkably similar to that in wholly amorphous polymers. To explain
these phenomena, Struik proposed the model of “extended glass transition” [1, 78-81]. According
to this model, crystallites in semicrystalline polymers, disturb the amorphous phase and reduce
the mobility of molecular chain segments. The reduction will reach its maximum in the

State of the Art
45
immediate vicinity of the crystallites; only at large distances from the crystallites will the
mobility of amorphous phase become similar to those of the wholly amorphous samples. The
main consequence of this immobilization is that the glass transition will be extended to higher
temperatures. Above Tg of the wholly amorphous samples, some parts of the amorphous phase
are rubbery, others are glassy and still other parts will just be passing their own glass transition.
Concerning physical aging, the model predicted the following: below the Tg, amorphous phase
would be completely glassy and suffered from the same physical aging effects as the wholly
amorphous samples. Above the Tg, some parts of the amorphous phase of the semicrystalline
polymers were still glassy. So, physical aging would persist at temperatures above the Tg, a
behavior not exhibited by wholly amorphous polymers. In this context it is to be noted that,
although the effect of physical aging is mainly attributed to the decrease in free volume with
time, but literatures have also been found where an increase in the crystallinity has been observed
while aging above Tg of the material. The authors [82] thereby reported a significant increase in
the degree of crystallinity for semicrystalline polymers like syndiotactic polypropylene while
aging at room temperature due to secondary crystallization. This makes the situation complex
while explaining the effect of physical aging or free volume on the change in physical or
mechanical properties of the semicrystalline polymers. For reasons of simplicity, semicrystalline
polymers having Tg higher than the nominal temperature have been chosen in this work.
Physical aging was previously studied mainly by measuring volume relaxation of the
samples via dilatometry [1]. But later on more studies were about enthalpy relaxation via
differential scanning calorimetry (DSC) once the equivalence between the energy absorbed
during the heating run through the glass transition region and the enthalpy lost during the
physical aging was established. This method is convenient, sensitive and highly reproducible
[83]. Some researchers have also tried to investigate the time-dependent change in free volume
due to physical aging by Positron Anihilation Lifetime (PAL) Spectroscopy [84, 85]. In addition
to enthalpy and volume relaxation effects, aging is observed in the change of the linear
viscoelastic response of the glass, both in isothermal dynamic mechanical and isothermal
transient tests. The type of test utilized in this study is the creep response, widely used in the
studies of physical aging by Struik [1, 78-81].
3.7 Long-term deformation behavior of polymers
Apart from the internal factors, external factors such as temperature of the surrounding medium,
magnitude of load and time play a crucial role in determining the deformation behavior of a

Chapter 3 46
thermoplastic part. The long-term mechanical behavior is thus often very important for the
polymer engineers in order to accomplish a safe designing of strength calculated polymeric parts
since the polymeric materials exhibit a time dependent deformation behavior. Due to their
molecular structure, the thermoplastic materials behave viscoelastically under the influence of an
applied load, i.e., they generally exhibit time dependent behavior and do not obey the Hook's
law, valid for linear viscoelastic materials. The stress and strain induced when a load is applied
are a function of time. The stress-strain-time relationship, or constitutive law, can be determined
by loading a polymer specimen with constant stress (creep) or constant strain (stress relaxation).
The stress-strain curves are often used to define several mechanical properties of polymers like
tensile strength, modulus, elongation at break and yield. Among the long-term properties of a
polymer, stress relaxation and creep tests are well-known. The stress relaxation test (discussed in
the section 3.7.2) is difficult to perform and is, therefore, often approximated by data acquired
through the more commonly creep test. The stress relaxation of a polymer is often thought as the
inverse of creep [86].
3.7.1 Creep
Creep is a slow, progressive deformation of a material under constant stress. When a plastic
material is subjected to a constant load, it deforms continuously with time. This time dependent
behavior of materials is often referred to as viscoelasticity. In general, for stress σ, the time-
dependent creep compliance J(t) can be expressed as the ratio of strain to stress at a certain time
(Eqn. 3.13). It depends on several factors, such as, type of plastic, magnitude of load,
temperature and time. In the linear viscoelastic materials, the creep compliance is independent of
stress level. The intercept of the creep curve on the strain axis is ascribed as the instantaneous
strain and can be roughly predicted by its stress-strain curve. An ideal creep curve may exhibit
three regions, primary creep in which the curve is concave down, secondary creep in which
deformation is proportional to time and tertiary creep in which deformation accelerates until
creep rupture occurs. This is shown in the Fig.3.10. Tertiary creep is always a manifestation of
nonlinear viscoelasticity and secondary creep is usually nonlinear as well. The material will
continue to deform slowly with time indefinitely or until rupture or yielding causing failure.
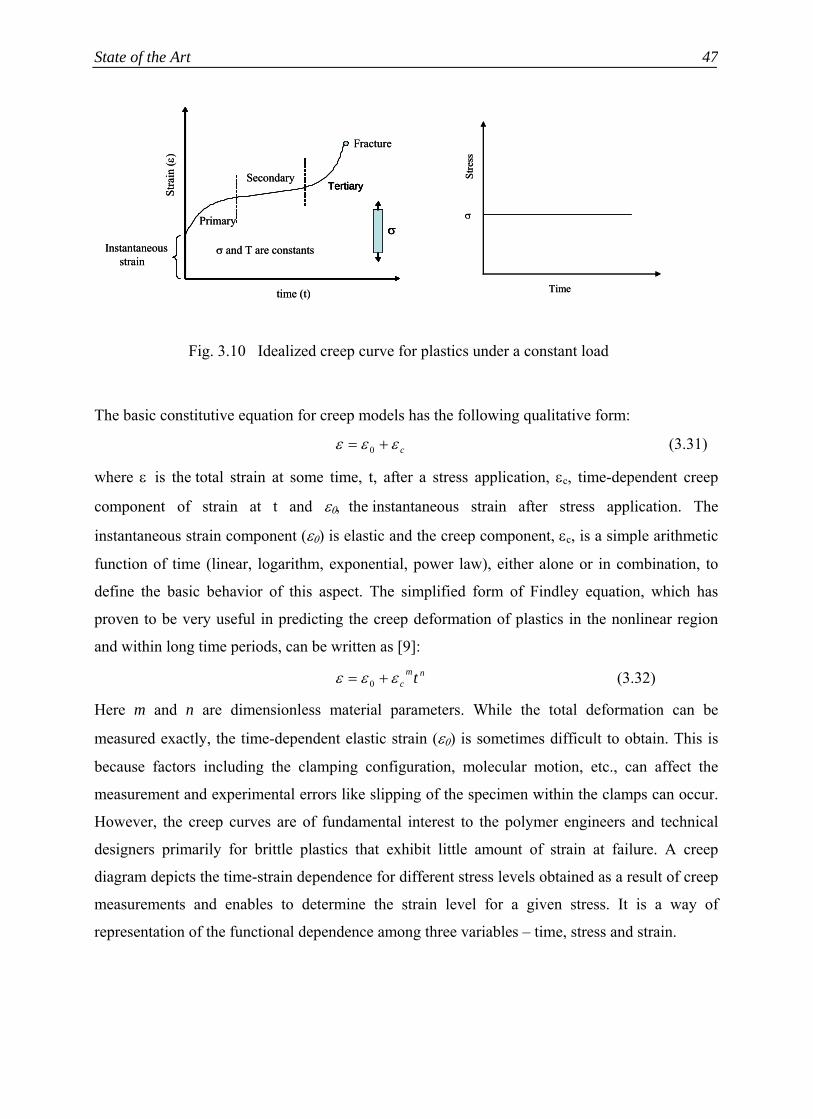
State of the Art
47
Fig. 3.10 Idealized creep curve for plastics under a constant load
The basic constitutive equation for creep models has the following qualitative form:
cεεε += 0 (3.31)
where ε is the total strain at some time, t, after a stress application, εc, time-dependent creep
component of strain at t and ε0, the instantaneous strain after stress application. The
instantaneous strain component (ε0) is elastic and the creep component, εc, is a simple arithmetic
function of time (linear, logarithm, exponential, power law), either alone or in combination, to
define the basic behavior of this aspect. The simplified form of Findley equation, which has
proven to be very useful in predicting the creep deformation of plastics in the nonlinear region
and within long time periods, can be written as [9]:
nmc tεεε += 0 (3.32)
Here m and n are dimensionless material parameters. While the total deformation can be
measured exactly, the time-dependent elastic strain (ε0) is sometimes difficult to obtain. This is
because factors including the clamping configuration, molecular motion, etc., can affect the
measurement and experimental errors like slipping of the specimen within the clamps can occur.
However, the creep curves are of fundamental interest to the polymer engineers and technical
designers primarily for brittle plastics that exhibit little amount of strain at failure. A creep
diagram depicts the time-strain dependence for different stress levels obtained as a result of creep
measurements and enables to determine the strain level for a given stress. It is a way of
representation of the functional dependence among three variables – time, stress and strain.
Primary
SecondaryTertiary
Fracture
time (t)
Stra
in(ε
)
σ and T are constants
σ
Tertiary
Instantaneousstrain
σPrimary
SecondaryTertiary
Fracture
time (t)
Stra
in(ε
)
σ and T are constants
σ
Tertiary
Instantaneousstrain
σ
Stre
ss
σ
Time
Stre
ss
σ
Time

Chapter 3 48
3.7.2 Stress relaxation
Stress relaxation is defined as a gradual decrease in stress with time under a constant deformation
or strain. This behavior of polymer is studied by applying a constant deformation to the specimen
and measuring the stress required to maintain that strain as a function of time. The stress
relaxation modulus is then defined by
( ) 0/)( εσ ttEr = (3.33)
where ε0 is the applied strain and σ(t) is the stress measured. Like creep, stress relaxation is also
dependent on time and temperature.
Stress relaxation test can be used for some practical applications. For example, low stress
relaxation is desired for threaded bottle closures. The stress data obtained from stress relaxation
test can be used to calculate transient modulus for plastics design by simply dividing the stress at
a particular time by the applied strain. However, stress relaxation test is more difficult to perform
than creep test and has limited practical applications.

Chapter 4
Experimental Investigations
4.1 Material
In order to investigate the effect of thermomechanical history during processing on the long-term
deformation behavior of injection molded semicrystalline thermoplastics, Syndiotactic
polystyrene (sPS, natur, obtained from PolyOne, Germany) and Polybutylene terpthalate (PBT,
Ultradur B 4500, natur, obtained from BASF, Germany) were chosen and injection molded by
varying the important process parameters. A general understanding of the influence of processing
conditions on the long-term deformation behavior of the injection molded semicrystalline
thermoplastics is expected to be possible by investigating their effect on these two semicrystalline
polymers. PBT and sPS have a Tg of around 45°C and 100°C respectively. So, both of these
materials remain in the glassy state at room temperature (23 ± 1°C and 50 ± 3% relative
humidity), where all the experimental investigations were carried out. Free volume is generally a
function of temperature above Tg, but below Tg temperature has least influence; it changes mainly
with time (aging time) [1]. Therefore to investigate the effect of aging time, and hence the effect
of free volume on the deformation behavior of the injection molded thermoplastics,
semicrystalline polymers with Tg higher than the room temperature were chosen. An advantage of
this is that we can also neglect the effect of aging or annealing below Tg on the change in the
crystallinity of the material.
4.2 Variation of process parameters
Dumbbell shaped tensile bars (Fig. 4.1) were injection-molded using Arburg Allrounder 320S
(500 - 350) injection molding machine equipped with a mold temperature controller. The
thickness was maintained at 4 mm for each bar. PBT was at first dried in a vacuum chamber at a
temperature of 120°C for 3 hours and then molded by varying the processing conditions as shown
in the Table 4.1; similarly sPS was also injection molded varying the parameters shown in Table
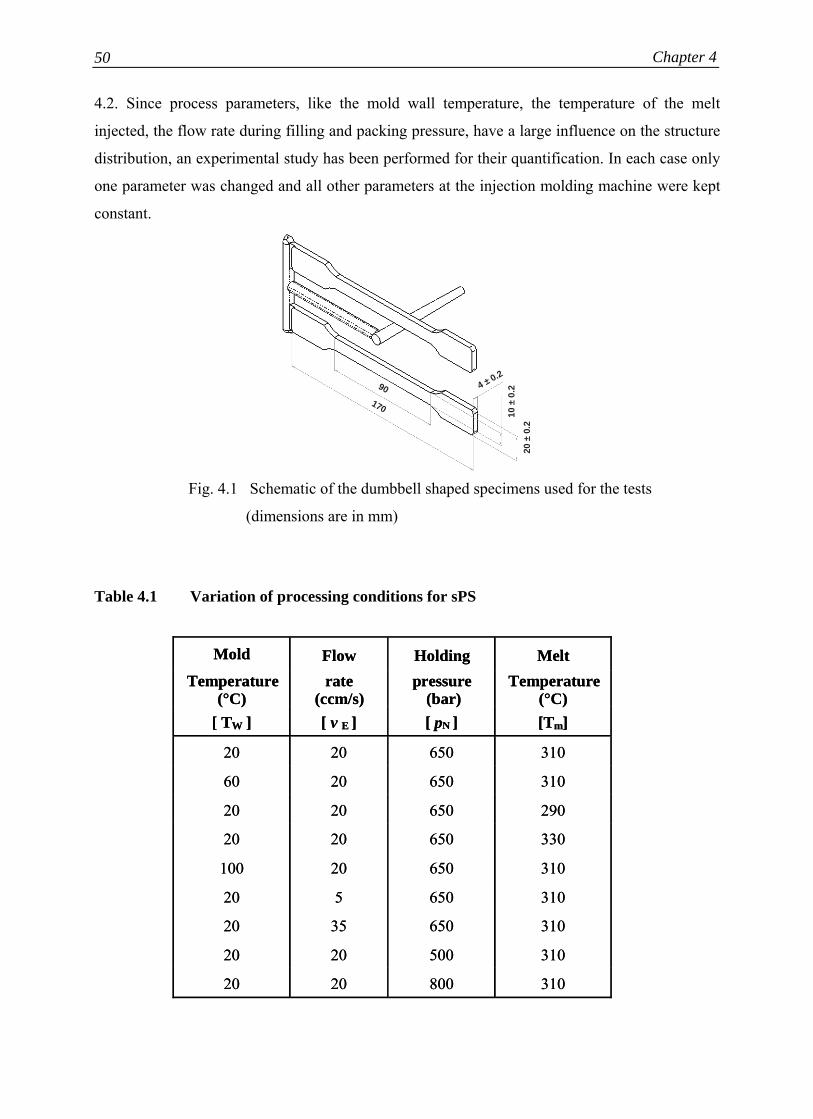
Chapter 4 50
4.2. Since process parameters, like the mold wall temperature, the temperature of the melt
injected, the flow rate during filling and packing pressure, have a large influence on the structure
distribution, an experimental study has been performed for their quantification. In each case only
one parameter was changed and all other parameters at the injection molding machine were kept
constant.
Fig. 4.1 Schematic of the dumbbell shaped specimens used for the tests
(dimensions are in mm)
Table 4.1 Variation of processing conditions for sPS
Mold Flow Holding MeltTemperature
(°C)rate
(ccm/s)pressure
(bar)Temperature
(°C)[ TW ] [ v E ] [ pN ] [Tm]
20 20 650 310
60 20 650 310
20 20 650 290
20 20 650 330
100 20 650 310
20 5 650 310
20 35 650 310
20 20 500 310
20 20 800 310
Mold Flow Holding MeltTemperature
(°C)rate
(ccm/s)pressure
(bar)Temperature
(°C)[ TW ] [ v E ] [ pN ] [Tm]
20 20 650 310
60 20 650 310
20 20 650 290
20 20 650 330
100 20 650 310
20 5 650 310
20 35 650 310
20 20 500 310
20 20 800 310
90170
4 ± 0.2
10 ±
0.2
20 ±
0.2
90170
4 ± 0.2
10 ±
0.2
20 ±
0.2

Experimental Investigations
51
Table 4.2 Variation of processing conditions for PBT
Further, rectangular plates were also manufactured for both the polymers by using Krauss
Maffei KM 90/340/B1 injection molding machine. The injection molding parameters were
chosen in such a way and kept constant that plates of 4 mm thickness can be manufactured. For
sPS, the important molding parameters used were: mold temperature = 20°C, melt temperature =
310°C, screw rotational speed (Drehzahl) = 70 U/min, holding pressure = 50 bar, the injection
flow rate = 35 ccm/s and cooling time = 65 s. For PBT, the mold and melt temperature were 40°C
and 270°C respectively, screw rotational speed was 70 U/min, holding pressure of 50 bar,
injection flow rate was 35 ccm/s and cooling time was kept constant at 40 s. Afterwards dumbbell
shaped test specimens were milled out from these plates in a direction parallel and
perpendicularly to the melt flow (Fig. 4.2). These serve for the investigation of the influence of
the state of orientation on the deformation behavior of injection molded semicrystalline
thermoplastic parts.
Mold Flow Holding MeltTemperature
(°C)rate
(ccm/s)pressur
(bar)Temperature
(°C)[ TW ] [ v E ] [ pN ] [Tm]
14 20 500 245
40 20 500 245
40 20 500 270
40 20 500 295
60 20 500 245
40 10 500 245
40 35 500 245
40 20 300 245
40 20 700 245
Mold Flow Holding MeltTemperature
(°C)rate
(ccm/s)pressure
(bar)Temperature
(°C)[ TW ] [ v E ] [ pN ] [Tm]
14 20 500 245
40 20 500 245
40 20 500 270
40 20 500 295
60 20 500 245
40 10 500 245
40 35 500 245
40 20 300 245
40 20 700 245
Mold Flow Holding MeltTemperature
(°C)rate
(ccm/s) (bar)Temperature
(°C)[ TW ] [ v E ] [ pN ] [Tm]
14 20 500 245
40 20 500 245
40 20 500 270
40 20 500 295
60 20 500 245
40 10 500 245
40 35 500 245
40 20 300 245
40 20 700 245
Mold Flow Holding MeltTemperature
(°C)rate
(ccm/s)pressur
(bar)Temperature
(°C)[ TW ] [ v E ] [ pN ] [Tm]
14 20 500 245
40 20 500 245
40 20 500 270
40 20 500 295
60 20 500 245
40 10 500 245
40 35 500 245
40 20 300 245
40 20 700 245
Mold Flow Holding MeltTemperature
(°C)rate
(ccm/s)pressure
(bar)Temperature
(°C)[ TW ] [ v E ] [ pN ] [Tm]
14 20 500 245
40 20 500 245
40 20 500 270
40 20 500 295
60 20 500 245
40 10 500 245
40 35 500 245
40 20 300 245
40 20 700 245
Mold Flow Holding MeltTemperature
(°C)rate
(ccm/s) (bar)Temperature
(°C)[ TW ] [ v E ] [ pN ] [Tm]
14 20 500 245
40 20 500 245
40 20 500 270
40 20 500 295
60 20 500 245
40 10 500 245
40 35 500 245
40 20 300 245
40 20 700 245

Chapter 4 52
Fig. 4.2 Schematic of the injection molded plate used for the tests (dimensions
are in mm)
It is known that in injection molding process, layered structures (skin and core) are
produced in the final part due to the inhomogeneous cooling that results in temperature gradient
across the thickness. In order to evaluate this layer structure in the thickness direction, the parallel
part of 70 mm in the middle of the tensile bars were sliced off from both the surfaces by milling
at a very low speed and different thickness of the samples ~ 0.5, 1, 2 and 3 mm were obtained as
shown in the Fig. 4.2 below. The normalized thickness (actual thickness of the samples / total
thickness of the sample = 4 mm) of the samples was then calculated depending on the thickness
of the sample after milling.
Fig. 4.2 PBT dumbbell specimens of different thickness obtained after milling
Thickness ~
3 mm
4 mm
2 mm
0. 5 mm
Thickness ~
3 mm
2 mm
1 mm
0. 5 mm
Thickness ~
3 mm
4 mm
2 mm
0. 5 mm
Thickness ~
3 mm
2 mm
1 mm
0. 5 mm

Experimental Investigations
53
4.3 Investigation of the deformation behavior
4.3.1 Creep test
The viscoelastic behavior of a polymeric material can be well identified by its tendency to creep.
In creep, the material is subjected to a constant load, when it deforms continuously with time and
the elongation in length is then recorded over time. The majority of the investigations were
therefore accomplished by creep test, since for the polymers, the long-term deformation
characteristics are very crucial as they can exhibit strong differences due to the differences in the
internal structures. To perform the creep test, clip-on strain sensors, fitted with strain gauges were
used and tested according to DIN EN ISO 899-1 as shown below in Fig. 4.3. Each of the strain
gauges were at first calibrated and then the creep tests were done at room temperature (23 ± 1°C
and 50 ± 3% relative humidity) under a constant load of 25 MPa and 20 MPa for sPS and PBT
respectively. The duration of each creep test was 48 hours and the elongation was recorded using
a computer based program called Spider. At the creep instrument, the number of specimens that
can be tested at a time is limited to eight. For each test, two to three samples were used and the
average value was taken. With the milled samples, only one specimen each of different thickness
(0.5, 1, 2 and 3 mm) was tested for both the semicrystalline polymers processed at lowest and
highest mold temperatures at a given aging time. The accuracy of the creep curves lie in the order
of 0.05%. The injection molded samples were also physically aged at room temperature for
different time intervals and then tested for creep.
Fig. 4.3 Creep instrument fitted with clip-on strain gauges at the middle
50 mm
50 mm
50 mm
50 mm
Chapter 4 54
4.3.2 Short-term tensile tests
With the tensile specimens produced by varying the process parameters, short-term tests like
tensile tests were conducted according to DIN EN ISO 527 in a tensile testing machine obtained
from Zwick. The deformation was measured by Laser scanning technique using a cross-head
speed of 5 mm/min. From these short-term tensile tests the characteristic values of tensile
strength, elastic modulus and elongation at yield and break were determined. At least three test
specimens were examined for each type of processing conditions used for a given polymer and
the average value was noted.
4.4 Structure analysis
4.4.1 Estimation of free volume
4.5.2.1 Specific volume measurement
For a qualitative estimation of the molecular packing density or the frozen-in free volume of the
injection molded parts, density measurements were accomplished according to DIN 53479
(procedure A). The measurements were done at room temperature in a highly sensitive balance
for measuring density provided by the company Sartorius. The liquid used for measuring the
density of the sample was ethanol. The samples were cut from both the ends and a length of 50
mm from the middle was taken for the density measurement. The average value from 4 samples
was taken for each measurement. A smaller free volume or more packing density would show up
a higher density, i.e., smaller specific volume, since specific volume, v = 1 /ρ, where ρ is the
density of the material.
4.5.2.2 Water absorption test
With the injection-molded samples, water absorption test was also done for a qualitative
estimation of the free volume. 50 mm of the samples were cut from the middle of the specimen
and then put into a humidity chamber at a relative humidity of 93 ± 1% at a temperature of 23 ±
1°C. The amount of water absorbed was then determined by measuring the weight of the sample
at different time interval, after noting the weight of the sample before water absorption. The
relative water absorption (W) was then calculated as:
Experimental Investigations
55
0
0
mmm
W−
= (4.1)
where mo and m are weights of the sample before and after water absorption respectively. For
water absorption, three samples of each type were taken and the average value of the water
absorbed was noted down. The maximum standard deviation measured for PBT and sPS lies in
the order of 0.0025% and 0.0005% respectively.
4.4.2 Determination of crystallinity
The crystallinity content of the injection molded samples was determined by using the standard
technique like Differential Scanning Calorimeter (DSC) investigations. DSC of the thin slices cut
out exactly from the middle of the injection molded tensile specimens processed at different mold
temperatures, injection flow rates, holding pressure and melt temperature were done in Netzsch
200 DSC instrument. Calibrations were done using tin as standard and all the scans were
performed from 50°C to 300°C and from 20°C to 250°C for sPS and PBT respectively at a
heating rate of 20 K/min and constantly maintaining a nitrogen atmosphere inside the sample
chamber. The crystallinity content of the injection molded samples was then determined as a
percentage by taking the ratio of the enthalpy of fusion of the polymer to the enthalpy of fusion
for the 100% crystalline polymer. For sPS and PBT, the values of the enthalpy of fusion for 100
% crystalline polymer were taken as 53.2 J/g [87] and 145 J/g [88] respectively. In order to
determine the effect of thermomechanical history on the crystallinity content of the injection
molded specimens, only the first heating scan was taken during thermal analysis.
4.4.3 Shrinkage
In order to characterize the different states of orientation in the injection molded parts, the
maximum shrinkage was measured according to DIN 16770. The tensile specimens were
annealed at a temperature well above the glass transition temperature until all molecular
orientations were relaxed and a maximum shrinkage was attained. From the middle of the test
specimens a length of 50 mm were cut and then put inside a thermostat on a metal sheet covered
with sand and annealed at a temperature, Ta = 100°C (PBT) and 140°C (sPS) for 2 days when the
frozen-in orientations were relaxed. The shrinkage, S, is defined as:
0
0
lll
S−
= (4.2)
where l0 and l are the actual lengths of the specimen before and after annealing.
Chapter 4 56
4.5 Annealing below Tg
All of the test specimens were annealed at a temperature below the Tg of the respective material
in order to accelerate the physical aging effect [89]. Generally, annealing at a temperature 15°C -
20°C below the glass transition temperature for several hours is supposed to accelerate the
process of free volume diffusion from the molded specimens than when they are allowed to age
normally for several days. Hence the material can achieve the equilibrium state quickly. Since
the materials have different Tgs, which is quite obvious, they were annealed at different
temperatures. For sPS the annealing temperature was chosen as 70°C, whereas PBT was annealed
at 30°C. In both the cases, the maximum variation of temperature during annealing was ±1°C
when annealed for for 2 days.

Chapter 5
Crystallinity
The process parameters during injection molding and the internal structures developed in the part
are strongly related. In the section 2.2 (chapter 2), a discussion on how the injection molding
process influences the internal structures and stresses and their impact on the mechanical
behavior of the injection molded parts has been made. Experiments have been performed to
characterize and determine these structural parameters that influence the deformation behavior of
the semicrystalline thermoplastics. But a simple transformation of the knowledge of physical
structure to the deformation behavior is not possible until a distinction between the effects of
these structural parameters is made. As already addressed in section 2.2.4 that the internal
stresses have no remarkable effect on the long-term viscoelastic behavior of the injection molded
items, so discussions are only limited to process-dependent change in the frozen-in molecular
orientation, free volume and crystallinity. In this context, the results on how the
thermomechanical history influences the crystallinity (percentage) and crystalline distribution
along the thickness of the injection molded parts has been presented and discussed in this chapter.
The crystallinity content of the polymer can significantly influence the final part properties;
therefore it is of great importance to process optmization [6].
5.1 Influence of processing conditions
Syndiotactic polystyrene (sPS)
A typical DSC thermogram for sPS is shown in the Fig. 5.1, which clearly indicates the regions
of the glass-rubber transition (around 100°C) and melting for sPS (around 275°C). These regions
are the characteristics of the amorphous and crystalline phases in sPS. Besides, Fig. 5.1 also
shows a recrystallization peak (around 150°C) as the material crystallizes further while heating
(cold crystalllisation) leading to the formation of additional crystallites. Based on this, sPS can be
assumed to have a two-phase structure – amorphous and crystalline phase.
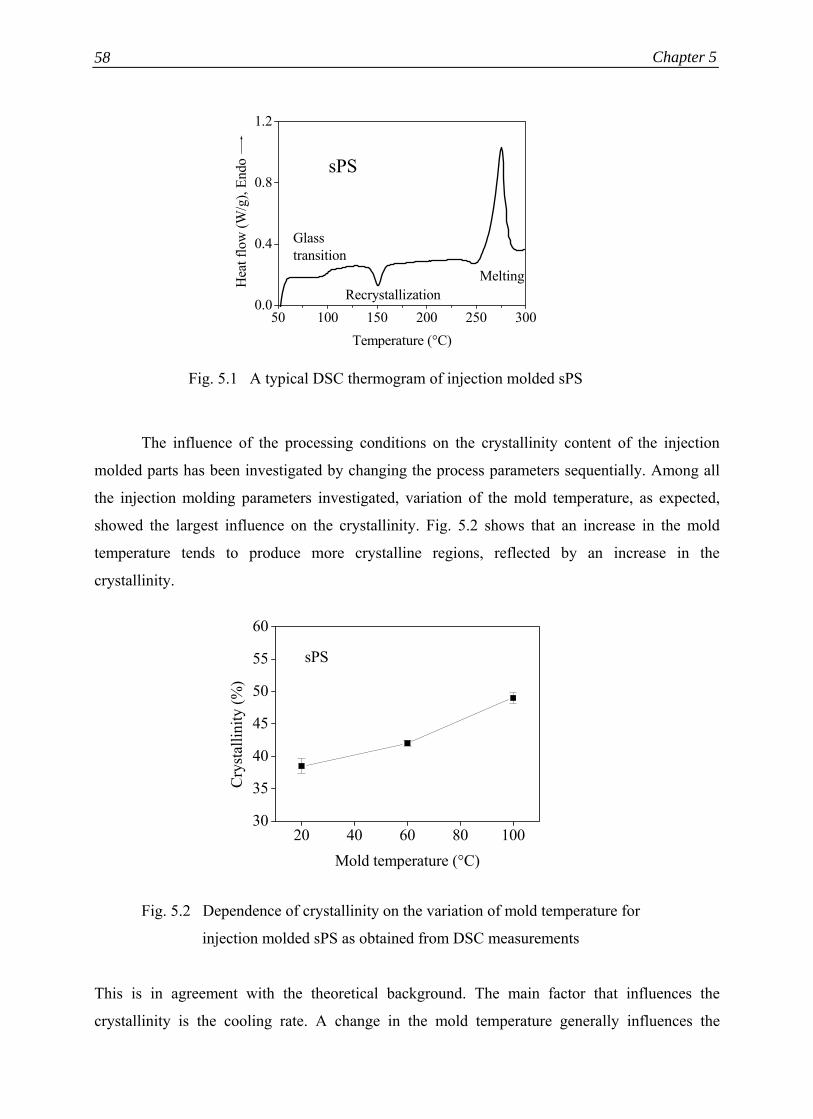
Chapter 5 58
Fig. 5.1 A typical DSC thermogram of injection molded sPS
The influence of the processing conditions on the crystallinity content of the injection
molded parts has been investigated by changing the process parameters sequentially. Among all
the injection molding parameters investigated, variation of the mold temperature, as expected,
showed the largest influence on the crystallinity. Fig. 5.2 shows that an increase in the mold
temperature tends to produce more crystalline regions, reflected by an increase in the
crystallinity.
Fig. 5.2 Dependence of crystallinity on the variation of mold temperature for
injection molded sPS as obtained from DSC measurements
This is in agreement with the theoretical background. The main factor that influences the
crystallinity is the cooling rate. A change in the mold temperature generally influences the
20 40 60 80 10030
35
40
45
50
55
60
sPS
Cry
stal
linity
(%)
Mold temperature (°C)
50 100 150 200 250 3000.0
0.4
0.8
1.2
MeltingRecrystallization
Glasstransition
Hea
t flo
w (W
/g),
Endo
Temperature (°C)
sPS
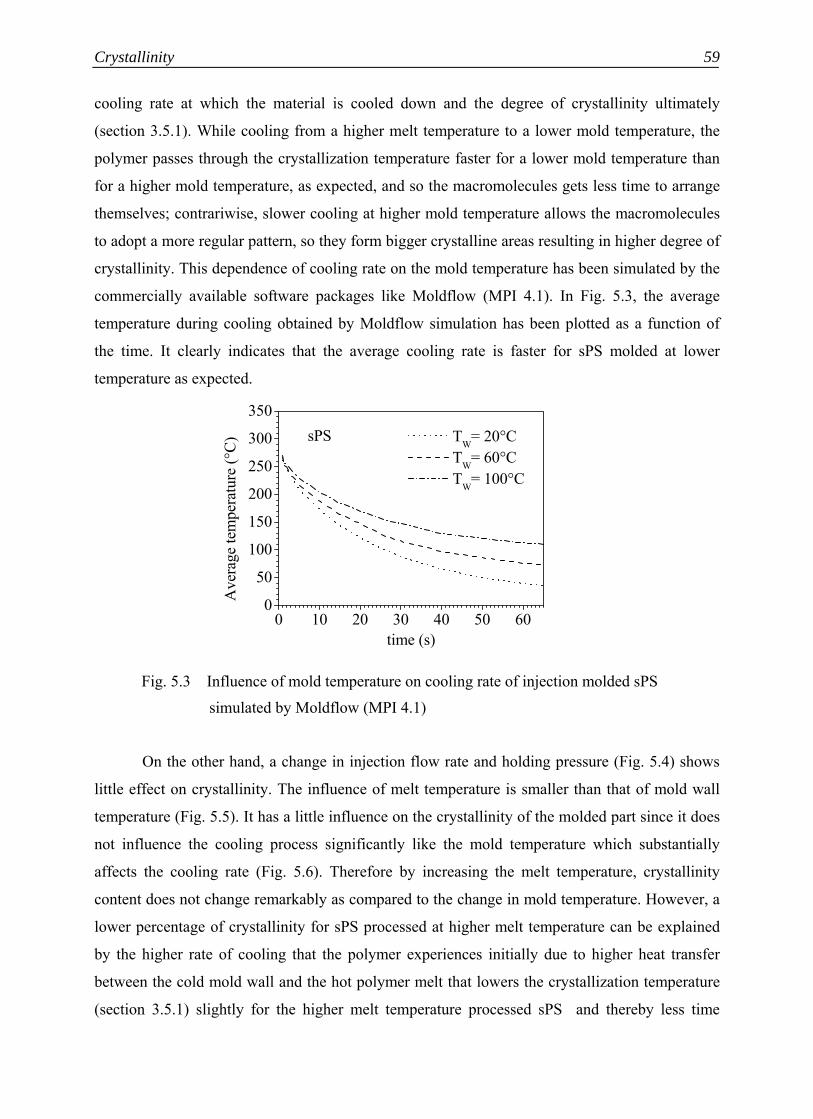
Crystallinity
59
cooling rate at which the material is cooled down and the degree of crystallinity ultimately
(section 3.5.1). While cooling from a higher melt temperature to a lower mold temperature, the
polymer passes through the crystallization temperature faster for a lower mold temperature than
for a higher mold temperature, as expected, and so the macromolecules gets less time to arrange
themselves; contrariwise, slower cooling at higher mold temperature allows the macromolecules
to adopt a more regular pattern, so they form bigger crystalline areas resulting in higher degree of
crystallinity. This dependence of cooling rate on the mold temperature has been simulated by the
commercially available software packages like Moldflow (MPI 4.1). In Fig. 5.3, the average
temperature during cooling obtained by Moldflow simulation has been plotted as a function of
the time. It clearly indicates that the average cooling rate is faster for sPS molded at lower
temperature as expected.
Fig. 5.3 Influence of mold temperature on cooling rate of injection molded sPS
simulated by Moldflow (MPI 4.1)
On the other hand, a change in injection flow rate and holding pressure (Fig. 5.4) shows
little effect on crystallinity. The influence of melt temperature is smaller than that of mold wall
temperature (Fig. 5.5). It has a little influence on the crystallinity of the molded part since it does
not influence the cooling process significantly like the mold temperature which substantially
affects the cooling rate (Fig. 5.6). Therefore by increasing the melt temperature, crystallinity
content does not change remarkably as compared to the change in mold temperature. However, a
lower percentage of crystallinity for sPS processed at higher melt temperature can be explained
by the higher rate of cooling that the polymer experiences initially due to higher heat transfer
between the cold mold wall and the hot polymer melt that lowers the crystallization temperature
(section 3.5.1) slightly for the higher melt temperature processed sPS and thereby less time
0 10 20 30 40 50 600
50
100
150
200
250
300
350sPS
Ave
rage
tem
pera
ture
(°C
)
time (s)
TW= 20°C TW= 60°C TW= 100°C
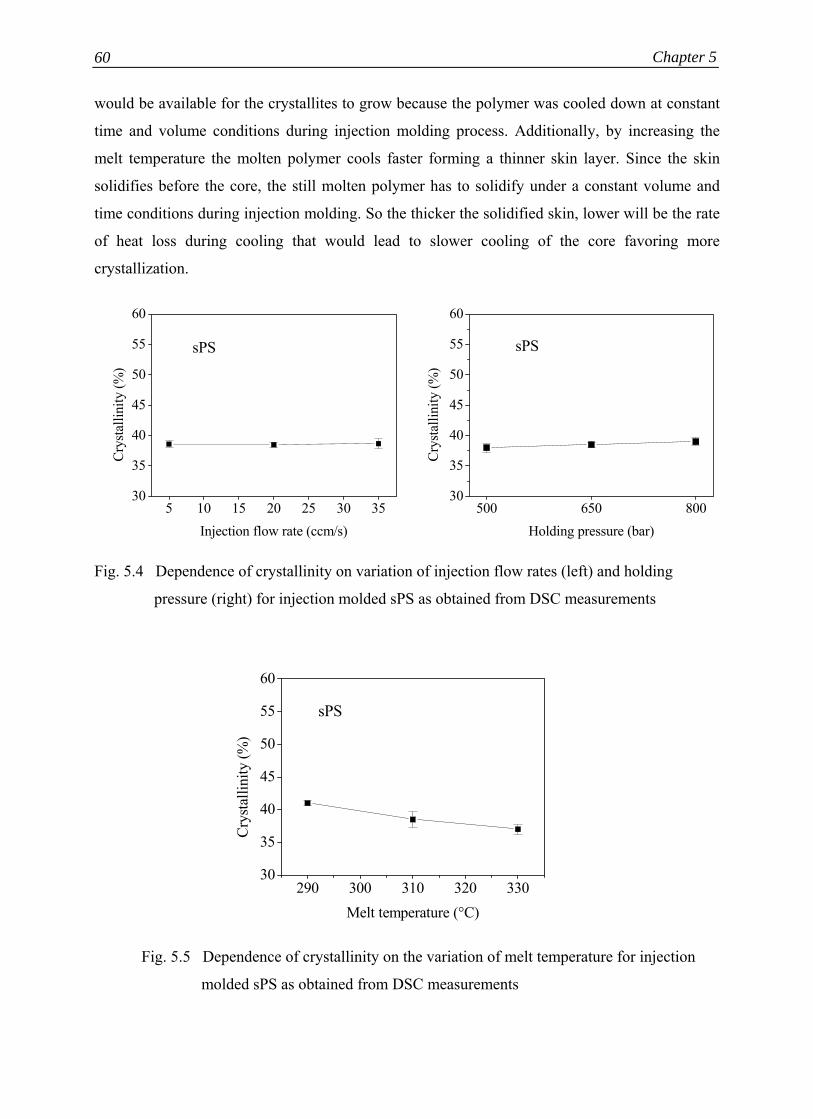
Chapter 5 60
would be available for the crystallites to grow because the polymer was cooled down at constant
time and volume conditions during injection molding process. Additionally, by increasing the
melt temperature the molten polymer cools faster forming a thinner skin layer. Since the skin
solidifies before the core, the still molten polymer has to solidify under a constant volume and
time conditions during injection molding. So the thicker the solidified skin, lower will be the rate
of heat loss during cooling that would lead to slower cooling of the core favoring more
crystallization.
Fig. 5.4 Dependence of crystallinity on variation of injection flow rates (left) and holding
pressure (right) for injection molded sPS as obtained from DSC measurements
Fig. 5.5 Dependence of crystallinity on the variation of melt temperature for injection
molded sPS as obtained from DSC measurements
290 300 310 320 33030
35
40
45
50
55
60
sPS
Crys
talli
nity
(%)
Melt temperature (°C)
5 10 15 20 25 30 3530
35
40
45
50
55
60
Crys
talli
nity
(%)
Injection flow rate (ccm/s)
sPS
500 650 80030
35
40
45
50
55
60
Crys
talli
nity
(%)
Holding pressure (bar)
sPS
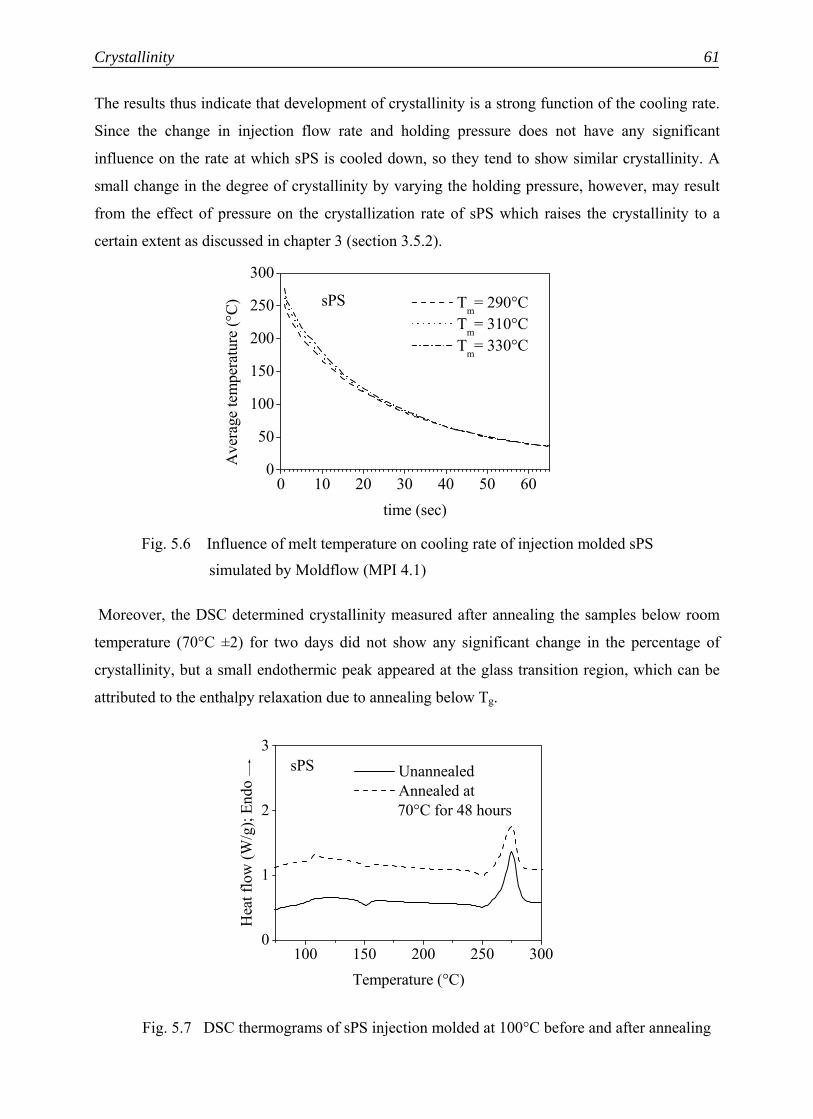
Crystallinity
61
The results thus indicate that development of crystallinity is a strong function of the cooling rate.
Since the change in injection flow rate and holding pressure does not have any significant
influence on the rate at which sPS is cooled down, so they tend to show similar crystallinity. A
small change in the degree of crystallinity by varying the holding pressure, however, may result
from the effect of pressure on the crystallization rate of sPS which raises the crystallinity to a
certain extent as discussed in chapter 3 (section 3.5.2).
Fig. 5.6 Influence of melt temperature on cooling rate of injection molded sPS
simulated by Moldflow (MPI 4.1)
Moreover, the DSC determined crystallinity measured after annealing the samples below room
temperature (70°C ±2) for two days did not show any significant change in the percentage of
crystallinity, but a small endothermic peak appeared at the glass transition region, which can be
attributed to the enthalpy relaxation due to annealing below Tg.
Fig. 5.7 DSC thermograms of sPS injection molded at 100°C before and after annealing
100 150 200 250 3000
1
2
3sPS
Hea
t flo
w (W
/g);
Endo
Temperature (°C)
Unannealed Annealed at
70°C for 48 hours
0 10 20 30 40 50 600
50
100
150
200
250
300
sPS
Ave
rage
tem
pera
ture
(°C)
time (sec)
Tm= 290°C Tm= 310°C Tm= 330°C
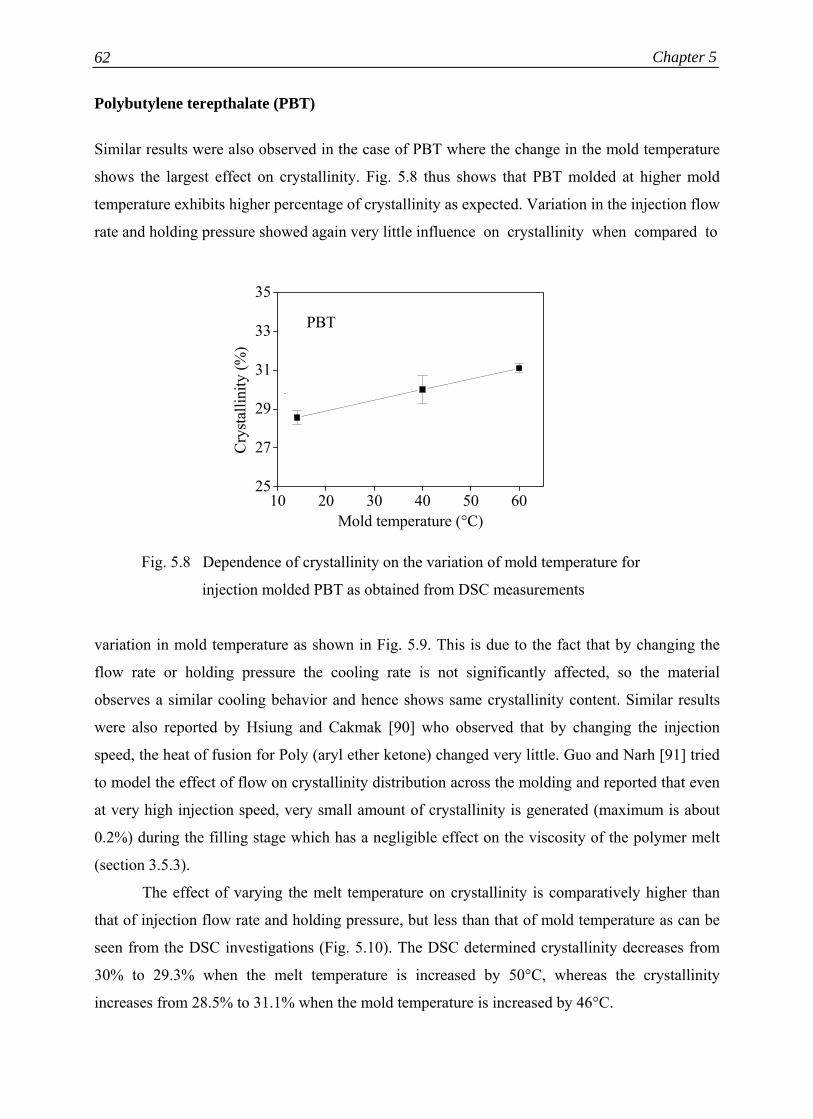
Chapter 5 62
Polybutylene terepthalate (PBT)
Similar results were also observed in the case of PBT where the change in the mold temperature
shows the largest effect on crystallinity. Fig. 5.8 thus shows that PBT molded at higher mold
temperature exhibits higher percentage of crystallinity as expected. Variation in the injection flow
rate and holding pressure showed again very little influence on crystallinity when compared to
Fig. 5.8 Dependence of crystallinity on the variation of mold temperature for
injection molded PBT as obtained from DSC measurements
variation in mold temperature as shown in Fig. 5.9. This is due to the fact that by changing the
flow rate or holding pressure the cooling rate is not significantly affected, so the material
observes a similar cooling behavior and hence shows same crystallinity content. Similar results
were also reported by Hsiung and Cakmak [90] who observed that by changing the injection
speed, the heat of fusion for Poly (aryl ether ketone) changed very little. Guo and Narh [91] tried
to model the effect of flow on crystallinity distribution across the molding and reported that even
at very high injection speed, very small amount of crystallinity is generated (maximum is about
0.2%) during the filling stage which has a negligible effect on the viscosity of the polymer melt
(section 3.5.3).
The effect of varying the melt temperature on crystallinity is comparatively higher than
that of injection flow rate and holding pressure, but less than that of mold temperature as can be
seen from the DSC investigations (Fig. 5.10). The DSC determined crystallinity decreases from
30% to 29.3% when the melt temperature is increased by 50°C, whereas the crystallinity
increases from 28.5% to 31.1% when the mold temperature is increased by 46°C.
10 20 30 40 50 6025
27
29
31
33
35
PBT
Cry
stal
linity
(%)
Mold temperature (°C)
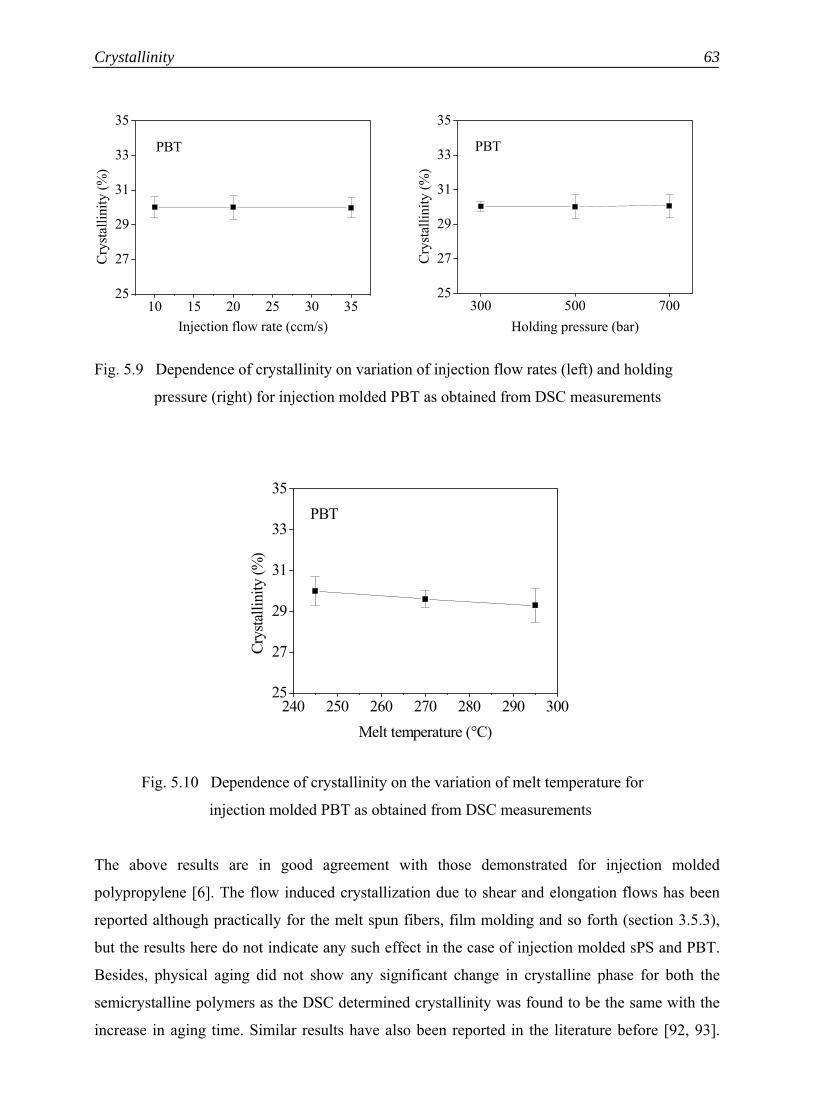
Crystallinity
63
Fig. 5.9 Dependence of crystallinity on variation of injection flow rates (left) and holding
pressure (right) for injection molded PBT as obtained from DSC measurements
Fig. 5.10 Dependence of crystallinity on the variation of melt temperature for
injection molded PBT as obtained from DSC measurements
The above results are in good agreement with those demonstrated for injection molded
polypropylene [6]. The flow induced crystallization due to shear and elongation flows has been
reported although practically for the melt spun fibers, film molding and so forth (section 3.5.3),
but the results here do not indicate any such effect in the case of injection molded sPS and PBT.
Besides, physical aging did not show any significant change in crystalline phase for both the
semicrystalline polymers as the DSC determined crystallinity was found to be the same with the
increase in aging time. Similar results have also been reported in the literature before [92, 93].
10 15 20 25 30 3525
27
29
31
33
35
PBT
Cry
stal
linity
(%)
Injection flow rate (ccm/s)300 500 700
25
27
29
31
33
35
PBT
Cry
stal
linity
(%)
Holding pressure (bar)
240 250 260 270 280 290 30025
27
29
31
33
35PBT
Crys
talli
nity
(%)
Melt temperature (°C)
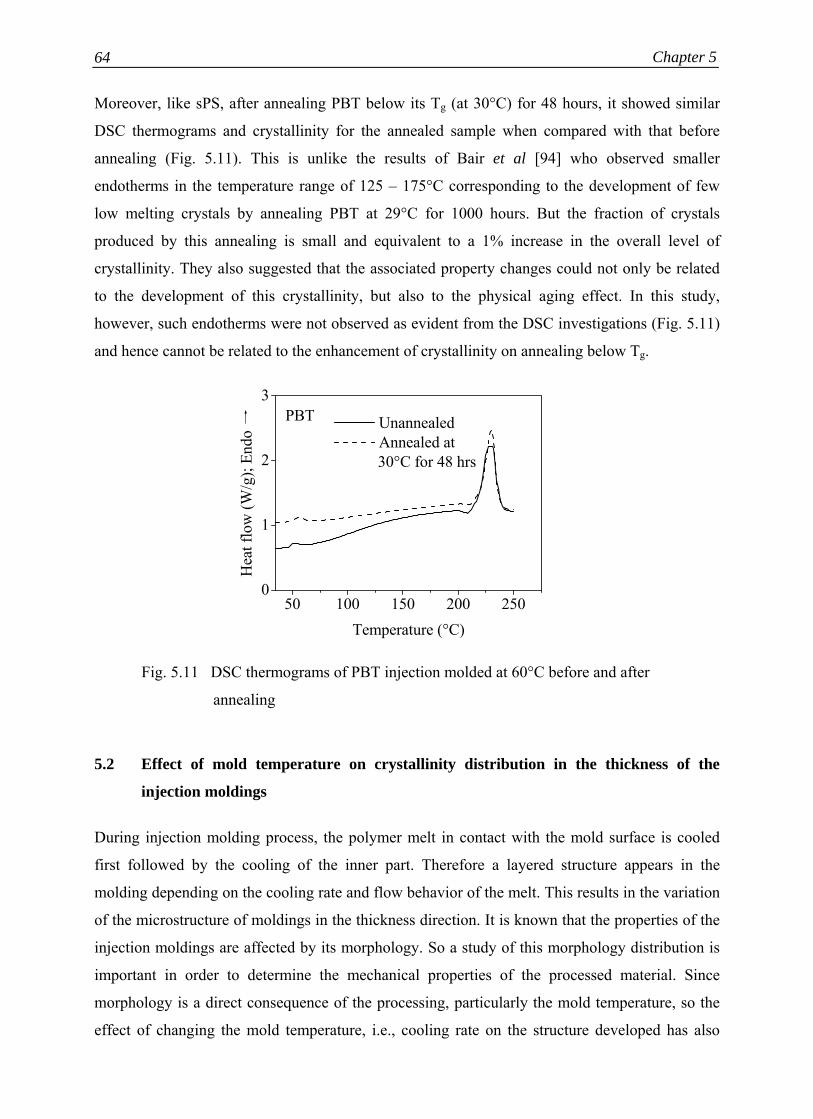
Chapter 5 64
Moreover, like sPS, after annealing PBT below its Tg (at 30°C) for 48 hours, it showed similar
DSC thermograms and crystallinity for the annealed sample when compared with that before
annealing (Fig. 5.11). This is unlike the results of Bair et al [94] who observed smaller
endotherms in the temperature range of 125 – 175°C corresponding to the development of few
low melting crystals by annealing PBT at 29°C for 1000 hours. But the fraction of crystals
produced by this annealing is small and equivalent to a 1% increase in the overall level of
crystallinity. They also suggested that the associated property changes could not only be related
to the development of this crystallinity, but also to the physical aging effect. In this study,
however, such endotherms were not observed as evident from the DSC investigations (Fig. 5.11)
and hence cannot be related to the enhancement of crystallinity on annealing below Tg.
Fig. 5.11 DSC thermograms of PBT injection molded at 60°C before and after
annealing
5.2 Effect of mold temperature on crystallinity distribution in the thickness of the
injection moldings
During injection molding process, the polymer melt in contact with the mold surface is cooled
first followed by the cooling of the inner part. Therefore a layered structure appears in the
molding depending on the cooling rate and flow behavior of the melt. This results in the variation
of the microstructure of moldings in the thickness direction. It is known that the properties of the
injection moldings are affected by its morphology. So a study of this morphology distribution is
important in order to determine the mechanical properties of the processed material. Since
morphology is a direct consequence of the processing, particularly the mold temperature, so the
effect of changing the mold temperature, i.e., cooling rate on the structure developed has also
50 100 150 200 2500
1
2
3PBT Unannealed
Annealed at 30°C for 48 hrs
Hea
t flo
w (W
/g);
Endo
Temperature (°C)
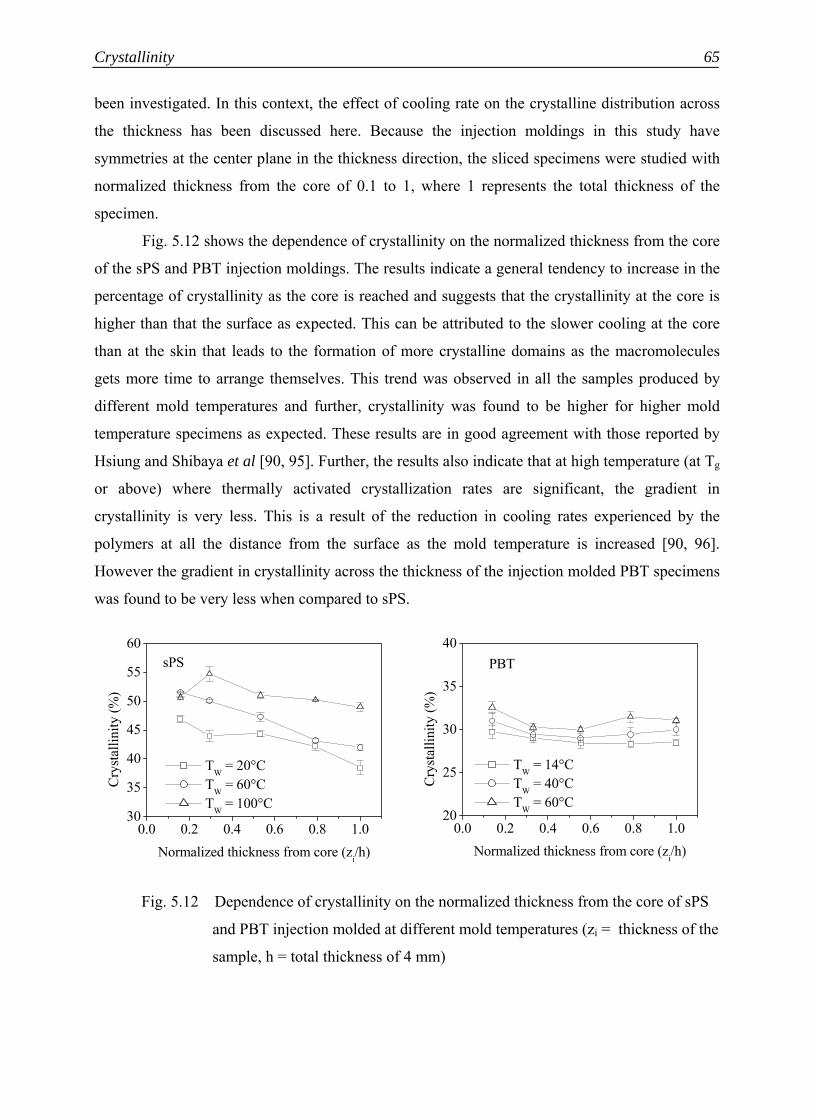
Crystallinity
65
been investigated. In this context, the effect of cooling rate on the crystalline distribution across
the thickness has been discussed here. Because the injection moldings in this study have
symmetries at the center plane in the thickness direction, the sliced specimens were studied with
normalized thickness from the core of 0.1 to 1, where 1 represents the total thickness of the
specimen.
Fig. 5.12 shows the dependence of crystallinity on the normalized thickness from the core
of the sPS and PBT injection moldings. The results indicate a general tendency to increase in the
percentage of crystallinity as the core is reached and suggests that the crystallinity at the core is
higher than that the surface as expected. This can be attributed to the slower cooling at the core
than at the skin that leads to the formation of more crystalline domains as the macromolecules
gets more time to arrange themselves. This trend was observed in all the samples produced by
different mold temperatures and further, crystallinity was found to be higher for higher mold
temperature specimens as expected. These results are in good agreement with those reported by
Hsiung and Shibaya et al [90, 95]. Further, the results also indicate that at high temperature (at Tg
or above) where thermally activated crystallization rates are significant, the gradient in
crystallinity is very less. This is a result of the reduction in cooling rates experienced by the
polymers at all the distance from the surface as the mold temperature is increased [90, 96].
However the gradient in crystallinity across the thickness of the injection molded PBT specimens
was found to be very less when compared to sPS.
Fig. 5.12 Dependence of crystallinity on the normalized thickness from the core of sPS
and PBT injection molded at different mold temperatures (zi = thickness of the
sample, h = total thickness of 4 mm)
0.0 0.2 0.4 0.6 0.8 1.030
35
40
45
50
55
60sPS
Cry
stal
linity
(%)
Normalized thickness from core (zi/h)
TW = 20°C TW = 60°C TW = 100°C
0.0 0.2 0.4 0.6 0.8 1.020
25
30
35
40PBT
Cry
stal
linity
(%)
Normalized thickness from core (zi/h)
TW = 14°C TW = 40°C TW = 60°C


Chapter 6
Free Volume
Polymers contain cavities or holes of atomic and molecular dimensions which arise primarily
because of irregular molecular packing in the amorphous phase. The appearance of holes lowers
the density of the amorphous polymer by about 10% when compared with the crystalline state of
the same material [97]. The holes form a (excess) free volume which affects thermal, mechanical
and relaxation properties of polymers [1].
A change in the injection molding conditions can not only effect the crystalline phase, but
also the free volume or voids generated in the amorphous phase of the semicrystalline
thermoplastics. This can therefore affect the molecular packing density of the finished part. As
the deformation behavior of an injection molded part depends strongly on the molecular packing
density, so it is important to account for the process dependent change in free volume as well as
its distribution in the thickness direction of the specimens. In the following, very simple methods
like specific volume (reciprocal of density) and relative water absorption have been employed for
the characterization of the free volume of semicrystalline polymers, as already addressed before
in chapter 4. However, direct probing of the free volume sites has only recently become available
by positron annihilation lifetime spectroscopy. The determination of average free volume hole
size and hole size distributions (1-10 Å) in polymers by this technique is rapidly developing into
a new and unique method which supplies structural information on the segmental level [98-103].
In recent years also much progress is made in extracting free volume characteristics from
measurements of specific volume as a function of pressure and temperature. This is because there
exists a strong theoretical base relating the specific volume of polymers to the free volume
available [1, 3, 11]. The advantages of this method are that it is comparatively simple and
depending upon the process also very small density variation can be dissolved. As a
disadvantage, the pressure induced densification in the injection moldings cannot be directly
correlated with the specific volume due to the reasons as already addressed in the section 3.3
(chapter 3). For this reason, further characterization of the molecular packing density was
accomplished by measuring the amount of water absorbed by the injection molded specimens.
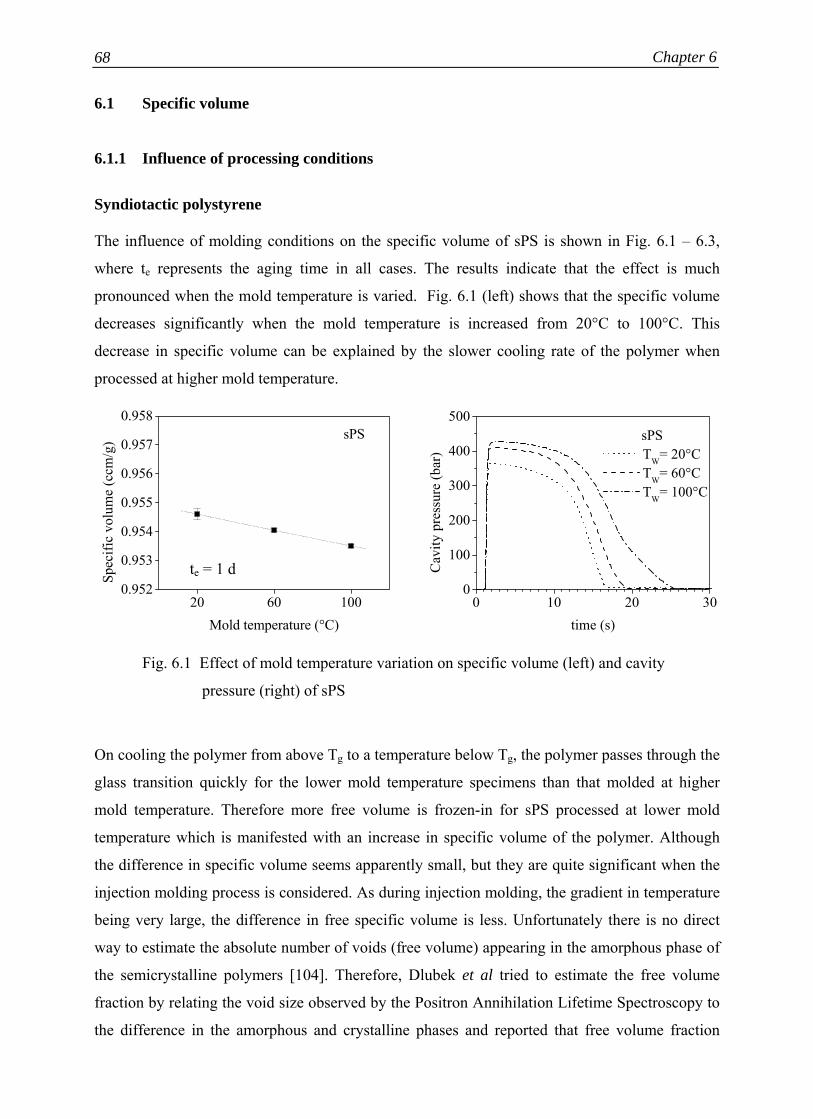
Chapter 6 68
6.1 Specific volume
6.1.1 Influence of processing conditions
Syndiotactic polystyrene The influence of molding conditions on the specific volume of sPS is shown in Fig. 6.1 – 6.3,
where te represents the aging time in all cases. The results indicate that the effect is much
pronounced when the mold temperature is varied. Fig. 6.1 (left) shows that the specific volume
decreases significantly when the mold temperature is increased from 20°C to 100°C. This
decrease in specific volume can be explained by the slower cooling rate of the polymer when
processed at higher mold temperature.
Fig. 6.1 Effect of mold temperature variation on specific volume (left) and cavity
pressure (right) of sPS
On cooling the polymer from above Tg to a temperature below Tg, the polymer passes through the
glass transition quickly for the lower mold temperature specimens than that molded at higher
mold temperature. Therefore more free volume is frozen-in for sPS processed at lower mold
temperature which is manifested with an increase in specific volume of the polymer. Although
the difference in specific volume seems apparently small, but they are quite significant when the
injection molding process is considered. As during injection molding, the gradient in temperature
being very large, the difference in free specific volume is less. Unfortunately there is no direct
way to estimate the absolute number of voids (free volume) appearing in the amorphous phase of
the semicrystalline polymers [104]. Therefore, Dlubek et al tried to estimate the free volume
fraction by relating the void size observed by the Positron Annihilation Lifetime Spectroscopy to
the difference in the amorphous and crystalline phases and reported that free volume fraction
20 60 1000.952
0.953
0.954
0.955
0.956
0.957
0.958sPS
Spec
ific
volu
me
(ccm
/g)
Mold temperature (°C)0 10 20 30
0
100
200
300
400
500sPS
Cav
ity p
ress
ure
(bar
)
time (s)
TW= 20°C TW= 60°C TW= 100°C
te = 1 d
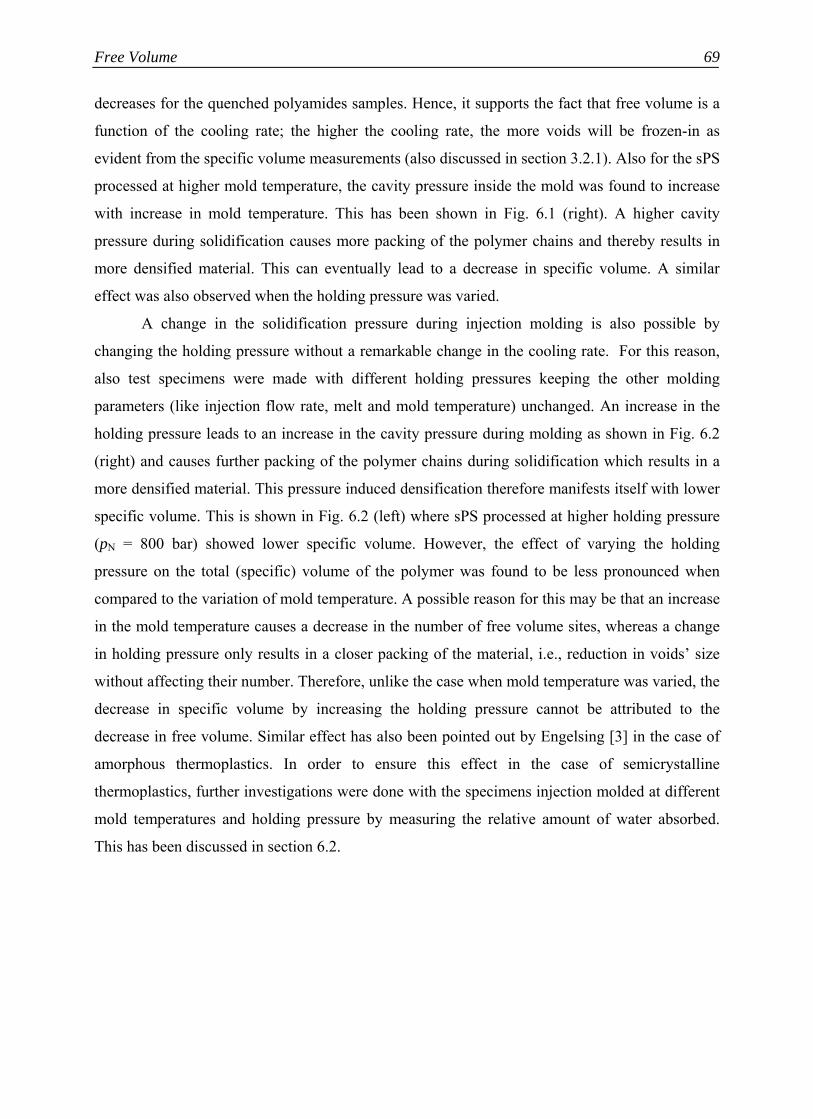
Free Volume
69
decreases for the quenched polyamides samples. Hence, it supports the fact that free volume is a
function of the cooling rate; the higher the cooling rate, the more voids will be frozen-in as
evident from the specific volume measurements (also discussed in section 3.2.1). Also for the sPS
processed at higher mold temperature, the cavity pressure inside the mold was found to increase
with increase in mold temperature. This has been shown in Fig. 6.1 (right). A higher cavity
pressure during solidification causes more packing of the polymer chains and thereby results in
more densified material. This can eventually lead to a decrease in specific volume. A similar
effect was also observed when the holding pressure was varied.
A change in the solidification pressure during injection molding is also possible by
changing the holding pressure without a remarkable change in the cooling rate. For this reason,
also test specimens were made with different holding pressures keeping the other molding
parameters (like injection flow rate, melt and mold temperature) unchanged. An increase in the
holding pressure leads to an increase in the cavity pressure during molding as shown in Fig. 6.2
(right) and causes further packing of the polymer chains during solidification which results in a
more densified material. This pressure induced densification therefore manifests itself with lower
specific volume. This is shown in Fig. 6.2 (left) where sPS processed at higher holding pressure
(pN = 800 bar) showed lower specific volume. However, the effect of varying the holding
pressure on the total (specific) volume of the polymer was found to be less pronounced when
compared to the variation of mold temperature. A possible reason for this may be that an increase
in the mold temperature causes a decrease in the number of free volume sites, whereas a change
in holding pressure only results in a closer packing of the material, i.e., reduction in voids’ size
without affecting their number. Therefore, unlike the case when mold temperature was varied, the
decrease in specific volume by increasing the holding pressure cannot be attributed to the
decrease in free volume. Similar effect has also been pointed out by Engelsing [3] in the case of
amorphous thermoplastics. In order to ensure this effect in the case of semicrystalline
thermoplastics, further investigations were done with the specimens injection molded at different
mold temperatures and holding pressure by measuring the relative amount of water absorbed.
This has been discussed in section 6.2.

Chapter 6 70
Fig. 6.2 Effect of holding pressure variation on specific volume (left) and cavity pressure
(right) of sPS
On the other hand, a change in the injection flow rate or a variation in the melt temperature did
not show any remarkable effect on the specific volume of sPS (Fig. 6.3). This may be explained
by the fact that the material experiences almost the same rate of cooling while passing through
the glass transition temperature as evident from the Moldflow simulation in the case of sPS when
the injection flow rate or melt temperature was varied. This indicates that a variation in injection
flow rate or melt temperature does not influence the free volume content of the polymer
significantly. Although, in comparison to the change in mold temperature, a variation in the melt
temperature showed only a small change in the degree of crystallinity, but, however, the density
measurements showed very little effect. This can be attributed to a very little difference in
densities between the crystalline and amorphous phases of sPS at temperatures below Tg [105].
Fig. 6.3 Effect of injection flow rate (left) and melt temperature (right) variation on
specific volume of sPS (te = 1 d)
0 10 20 300
100
200
300
400
500sPS
Cav
ity p
ress
ure
(bar
)
time (sec)
pN= 500 bar pN= 650 bar pN= 800 bar
500 650 8000.952
0.953
0.954
0.955
0.956
0.957
0.958
sPS
Spec
ific
volu
me
(ccm
/g)
Holding pressure (bar)
290 310 3300.952
0.953
0.954
0.955
0.956
0.957
0.958sPS
Melt temperature (°C)
Spec
ific
volu
me
(ccm
/g)
5 20 350.952
0.953
0.954
0.955
0.956
0.957
0.958sPS
Spec
ific
volu
me
(ccm
/g)
Flow rate (ccm/s)
te = 1 d
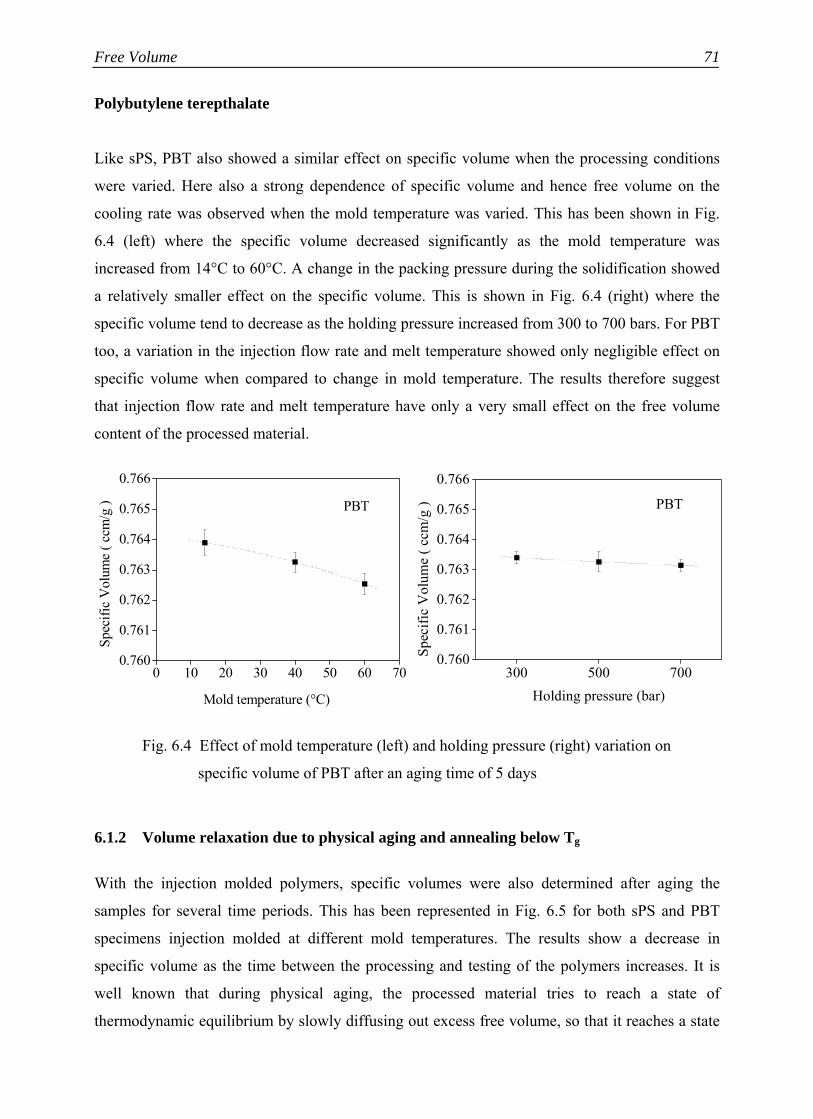
Free Volume
71
Polybutylene terepthalate
Like sPS, PBT also showed a similar effect on specific volume when the processing conditions
were varied. Here also a strong dependence of specific volume and hence free volume on the
cooling rate was observed when the mold temperature was varied. This has been shown in Fig.
6.4 (left) where the specific volume decreased significantly as the mold temperature was
increased from 14°C to 60°C. A change in the packing pressure during the solidification showed
a relatively smaller effect on the specific volume. This is shown in Fig. 6.4 (right) where the
specific volume tend to decrease as the holding pressure increased from 300 to 700 bars. For PBT
too, a variation in the injection flow rate and melt temperature showed only negligible effect on
specific volume when compared to change in mold temperature. The results therefore suggest
that injection flow rate and melt temperature have only a very small effect on the free volume
content of the processed material.
Fig. 6.4 Effect of mold temperature (left) and holding pressure (right) variation on
specific volume of PBT after an aging time of 5 days
6.1.2 Volume relaxation due to physical aging and annealing below Tg
With the injection molded polymers, specific volumes were also determined after aging the
samples for several time periods. This has been represented in Fig. 6.5 for both sPS and PBT
specimens injection molded at different mold temperatures. The results show a decrease in
specific volume as the time between the processing and testing of the polymers increases. It is
well known that during physical aging, the processed material tries to reach a state of
thermodynamic equilibrium by slowly diffusing out excess free volume, so that it reaches a state
300 500 7000.760
0.761
0.762
0.763
0.764
0.765
0.766
PBT
Spec
ific
Vol
ume
( ccm
/g )
Holding pressure (bar)
0 10 20 30 40 50 60 700.760
0.761
0.762
0.763
0.764
0.765
0.766
PBT
Mold temperature (°C)
Spec
ific
Vol
ume
( ccm
/g )

Chapter 6 72
with minimum free volume. This phenomenon has been observed when the processed polymers
were allowed to age for several days at room temperature. Aging below Tg leads to a very slow
reduction in free volume. Therefore the material becomes denser and its specific volume
gradually reduces. This has been observed for both sPS and PBT samples when they were aged at
room temperature (below Tg). However, an initial increase in the specific volume has been
observed in both the cases after an aging time of 1 day which may arise from the slow relaxation
of the compressed polymer chains subjected to high pressure during molding as the polymers
were allowed to age at room temperature under ambient pressure.
Fig. 6.5 Dependence of specific volume on aging time for sPS (left) and PBT (right)
processed at different mold temperatures
At a temperature below Tg, the rate of free volume diffusion is very less and hence the
rate of physical aging [1]. By annealing the polymer below its Tg, it is supposed to accelerate free
volume diffusion [106]. So, it is expected that the specific volume would decrease after annealing
sPS at a temperature of 70°C (±1°C) for 2 days. But, by annealing sPS about 30°C below its Tg,
the specific volume was found to increase in all the cases. This has been represented in Fig. 6.6
for sPS processed at different mold temperatures and holding pressures. Similar results (Fig. 6.7)
were also obtained for PBT specimens when annealed at a temperature of 30°C (∼ 15°C below
Tg). But these results are not surprising and are in agreement with the results obtained by Yourtee
and Cooper [22] who reported that by annealing polystyrene at a temperature 30°C below its
glass transition temperature, the specific volume increased drastically. Similar effects were also
observed by Engelsing [3] for styrene acronitrile copolymer and polycarbonate. This increase in
specific volume is not due to an increase in free volume after annealing but due to the relaxation
of the polymer chains which were compressed under the hydrostatic pressure during processing.
0 5 10 15 20 25 30 350.758
0.760
0.762
0.764
0.766
0.768
0.770
PBT
Spec
ific
Vol
ume
(ccm
/g)
Aging time (days)
TW= 14°C TW= 40°C TW= 60°C
0 10 20 30 400.952
0.954
0.956
0.958
0.960
sPS
Spec
ific
Vol
ume
(ccm
/g)
Aging time (days)
TW= 20°C TW= 60°C TW= 100°C
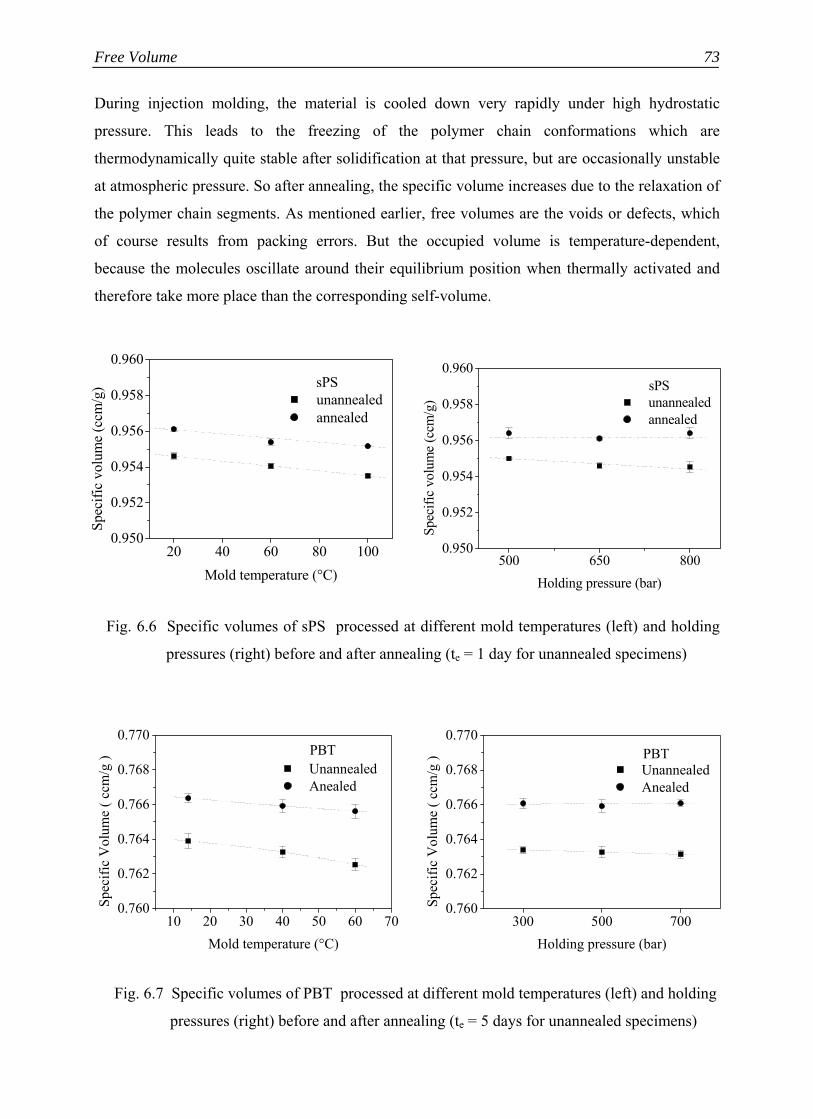
Free Volume
73
During injection molding, the material is cooled down very rapidly under high hydrostatic
pressure. This leads to the freezing of the polymer chain conformations which are
thermodynamically quite stable after solidification at that pressure, but are occasionally unstable
at atmospheric pressure. So after annealing, the specific volume increases due to the relaxation of
the polymer chain segments. As mentioned earlier, free volumes are the voids or defects, which
of course results from packing errors. But the occupied volume is temperature-dependent,
because the molecules oscillate around their equilibrium position when thermally activated and
therefore take more place than the corresponding self-volume.
Fig. 6.6 Specific volumes of sPS processed at different mold temperatures (left) and holding
pressures (right) before and after annealing (te = 1 day for unannealed specimens)
Fig. 6.7 Specific volumes of PBT processed at different mold temperatures (left) and holding
pressures (right) before and after annealing (te = 5 days for unannealed specimens)
500 650 8000.950
0.952
0.954
0.956
0.958
0.960
unannealed annealed
sPS
Spec
ific
volu
me
(ccm
/g)
Holding pressure (bar)
20 40 60 80 1000.950
0.952
0.954
0.956
0.958
0.960sPS
Spec
ific
volu
me
(ccm
/g)
Mold temperature (°C)
unannealed annealed
10 20 30 40 50 60 700.760
0.762
0.764
0.766
0.768
0.770PBT
Unannealed Anealed
Spec
ific
Vol
ume
( ccm
/g )
Mold temperature (°C)300 500 700
0.760
0.762
0.764
0.766
0.768
0.770PBT
Unannealed Anealed
Spec
ific
Vol
ume
( ccm
/g )
Holding pressure (bar)
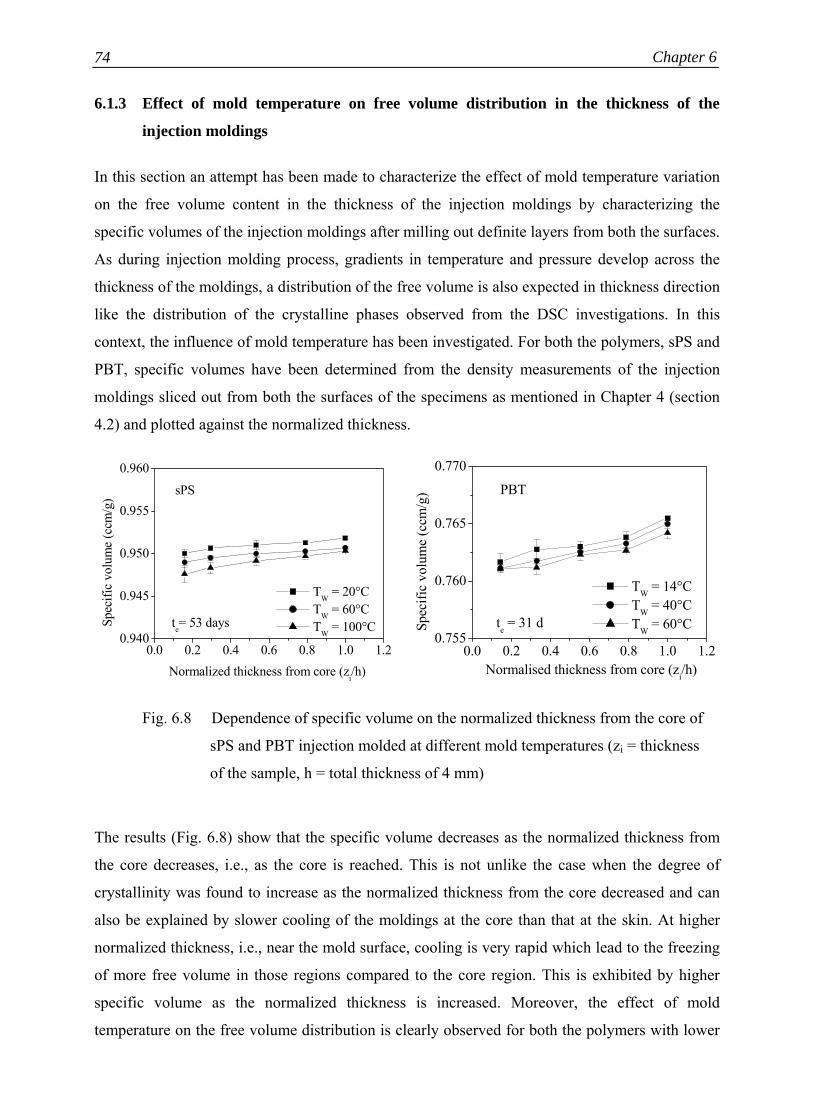
Chapter 6 74
6.1.3 Effect of mold temperature on free volume distribution in the thickness of the
injection moldings
In this section an attempt has been made to characterize the effect of mold temperature variation
on the free volume content in the thickness of the injection moldings by characterizing the
specific volumes of the injection moldings after milling out definite layers from both the surfaces.
As during injection molding process, gradients in temperature and pressure develop across the
thickness of the moldings, a distribution of the free volume is also expected in thickness direction
like the distribution of the crystalline phases observed from the DSC investigations. In this
context, the influence of mold temperature has been investigated. For both the polymers, sPS and
PBT, specific volumes have been determined from the density measurements of the injection
moldings sliced out from both the surfaces of the specimens as mentioned in Chapter 4 (section
4.2) and plotted against the normalized thickness.
Fig. 6.8 Dependence of specific volume on the normalized thickness from the core of
sPS and PBT injection molded at different mold temperatures (zi = thickness
of the sample, h = total thickness of 4 mm)
The results (Fig. 6.8) show that the specific volume decreases as the normalized thickness from
the core decreases, i.e., as the core is reached. This is not unlike the case when the degree of
crystallinity was found to increase as the normalized thickness from the core decreased and can
also be explained by slower cooling of the moldings at the core than that at the skin. At higher
normalized thickness, i.e., near the mold surface, cooling is very rapid which lead to the freezing
of more free volume in those regions compared to the core region. This is exhibited by higher
specific volume as the normalized thickness is increased. Moreover, the effect of mold
temperature on the free volume distribution is clearly observed for both the polymers with lower
0.0 0.2 0.4 0.6 0.8 1.0 1.20.940
0.945
0.950
0.955
0.960
sPS
te= 53 daysSpec
ific
volu
me
(ccm
/g)
Normalized thickness from core (zi/h)
TW = 20°C TW = 60°C TW = 100°C
0.0 0.2 0.4 0.6 0.8 1.0 1.20.755
0.760
0.765
0.770
PBT
te = 31 dSpec
ific
volu
me
(ccm
/g)
Normalised thickness from core (zi/h)
TW = 14°C TW = 40°C TW = 60°C
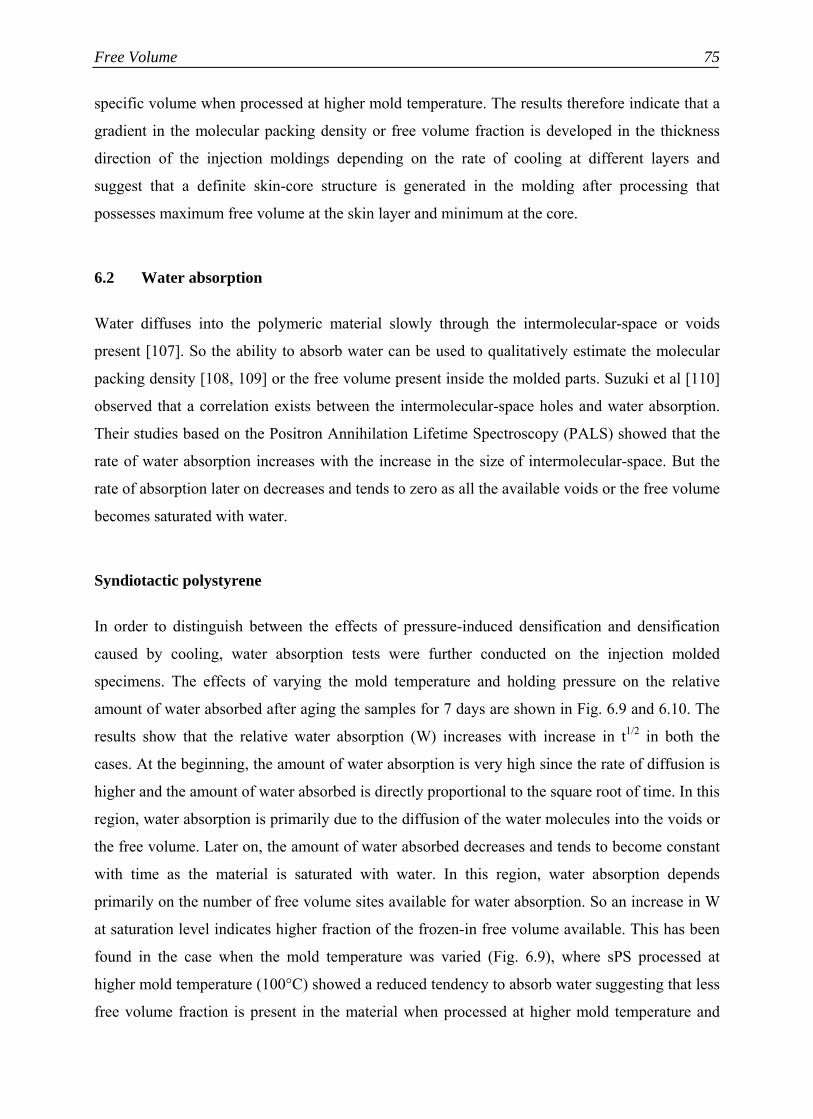
Free Volume
75
specific volume when processed at higher mold temperature. The results therefore indicate that a
gradient in the molecular packing density or free volume fraction is developed in the thickness
direction of the injection moldings depending on the rate of cooling at different layers and
suggest that a definite skin-core structure is generated in the molding after processing that
possesses maximum free volume at the skin layer and minimum at the core.
6.2 Water absorption
Water diffuses into the polymeric material slowly through the intermolecular-space or voids
present [107]. So the ability to absorb water can be used to qualitatively estimate the molecular
packing density [108, 109] or the free volume present inside the molded parts. Suzuki et al [110]
observed that a correlation exists between the intermolecular-space holes and water absorption.
Their studies based on the Positron Annihilation Lifetime Spectroscopy (PALS) showed that the
rate of water absorption increases with the increase in the size of intermolecular-space. But the
rate of absorption later on decreases and tends to zero as all the available voids or the free volume
becomes saturated with water.
Syndiotactic polystyrene
In order to distinguish between the effects of pressure-induced densification and densification
caused by cooling, water absorption tests were further conducted on the injection molded
specimens. The effects of varying the mold temperature and holding pressure on the relative
amount of water absorbed after aging the samples for 7 days are shown in Fig. 6.9 and 6.10. The
results show that the relative water absorption (W) increases with increase in t1/2 in both the
cases. At the beginning, the amount of water absorption is very high since the rate of diffusion is
higher and the amount of water absorbed is directly proportional to the square root of time. In this
region, water absorption is primarily due to the diffusion of the water molecules into the voids or
the free volume. Later on, the amount of water absorbed decreases and tends to become constant
with time as the material is saturated with water. In this region, water absorption depends
primarily on the number of free volume sites available for water absorption. So an increase in W
at saturation level indicates higher fraction of the frozen-in free volume available. This has been
found in the case when the mold temperature was varied (Fig. 6.9), where sPS processed at
higher mold temperature (100°C) showed a reduced tendency to absorb water suggesting that less
free volume fraction is present in the material when processed at higher mold temperature and

Chapter 6 76
thereby supports the fact that the decrease in specific volume at higher mold temperature is
mainly due to the decrease in the frozen-in free volume fraction of the material.
Fig. 6.9 Influence of mold temperature on time-dependent relative water
absorption of sPS after aging for 7 days
But a change in the holding pressure did not show any remarkable difference in the relative water
absorption at higher t1/2. This indicates that a variation in the holding pressure does not produce
any significant difference in the free volume fraction of the solidified material. It is suggested
that an increase in the holding pressure would only result in a more closely packed structure with
the same number of smaller size voids. Therefore the fractional free volume is very little affected
by changing holding pressure. However a negligible increase in the water absorption at higher t1/2
for sPS processed at higher holding pressure (pN = 800 bar) can be accomplished to the effect of
pressure on the glass transition temperature, Tg(p), (section 3.2.2), that affects the cooling rate
and might have frozen in slightly more free volume as the material attains the glass transition at a
temperature slightly higher than that molded at lower holding pressure, although the average
cooling rate determined from the Moldflow simulation did not show up with any significant
effect. This is not unlike the case when a similar behavior in water absorption was observed for
injection molded amorphous thermoplastics [3]. It is therefore possible that for sPS, a similar
deformation behavior might be observed as that of the purely amorphous ones when the effect of
holding pressure is tested far below Tg.
0 1 2 3 4 5 6 7 80.00
0.01
0.02
0.03
0.04sPS
te= 7 d
W (%
)
t1/2 (days)
TW= 20°C TW= 100°C

Free Volume
77
Fig. 6.10 Influence of holding pressure on time-dependent relative water
absorption of sPS after aging for 7 days
On the other hand, no significant difference in relative water absorption was observed by varying
the injection flow rate indicating that it does not practically influence the cooling rate during
solidification of the polymer and also the pressure during solidification and hence the density of
the material is hardly affected. Similar conclusions can be drawn when the melt temperature was
changed.
Polybutylene terepthalate
The water absorption experiments were also conducted for PBT molded at different processing
conditions in order to characterize the fractional free volume content of the injection molded
polymer. Like sPS, PBT also showed differences in relative water absorption when the mold
temperature was varied. This has been shown in Fig. 6.11 where the ability to absorb water was
found to decrease for PBT processed at higher mold temperature of 60°C than when processed at
a lower mold temperature of 14°C. The relative amount of water absorbed for PBT processed at a
mold temperature of 40°C was found to be in between the higher and lower values of W as
expected.
0 1 2 3 4 5 6 7 80.00
0.01
0.02
0.03
0.04
pN= 400 bar pN= 800 bar
sPS
te= 7 d
W (%
)
t1/2 (days)
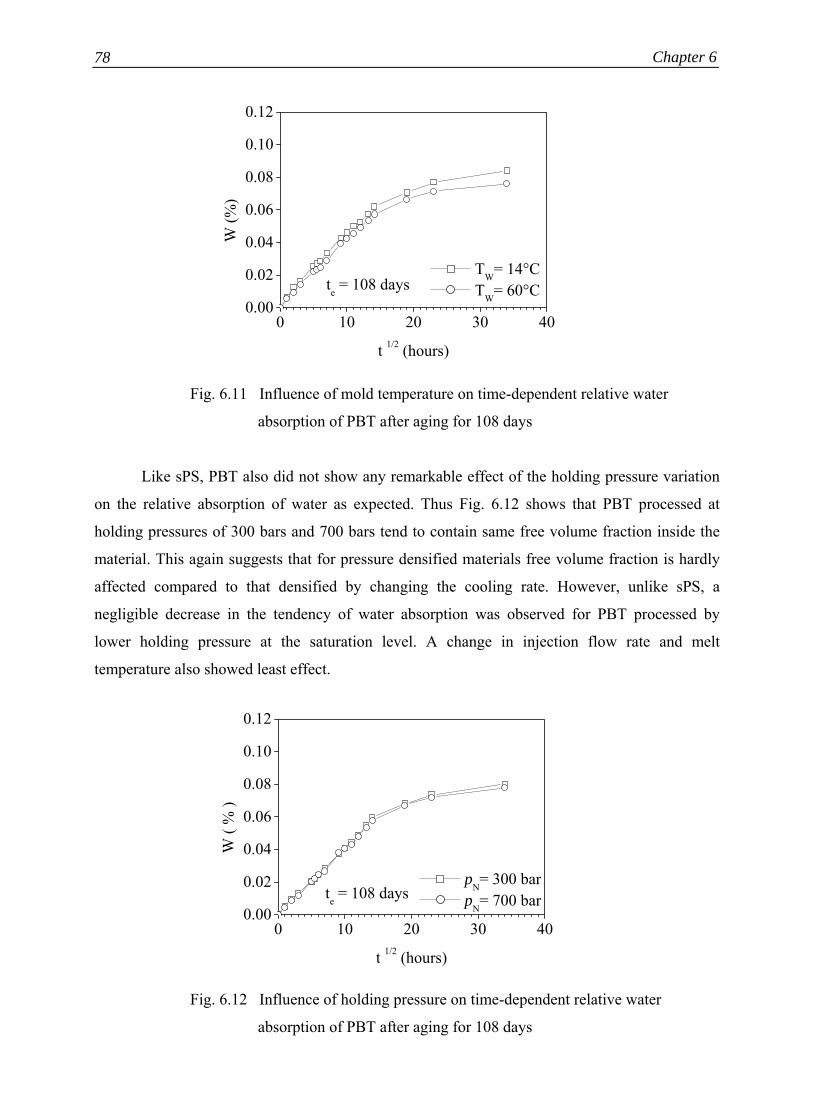
Chapter 6 78
Fig. 6.11 Influence of mold temperature on time-dependent relative water
absorption of PBT after aging for 108 days
Like sPS, PBT also did not show any remarkable effect of the holding pressure variation
on the relative absorption of water as expected. Thus Fig. 6.12 shows that PBT processed at
holding pressures of 300 bars and 700 bars tend to contain same free volume fraction inside the
material. This again suggests that for pressure densified materials free volume fraction is hardly
affected compared to that densified by changing the cooling rate. However, unlike sPS, a
negligible decrease in the tendency of water absorption was observed for PBT processed by
lower holding pressure at the saturation level. A change in injection flow rate and melt
temperature also showed least effect.
Fig. 6.12 Influence of holding pressure on time-dependent relative water
absorption of PBT after aging for 108 days
0 10 20 30 400.00
0.02
0.04
0.06
0.08
0.10
0.12
te = 108 days
W (%
)
t 1/2 (hours)
TW= 14°C TW= 60°C
0 10 20 30 400.00
0.02
0.04
0.06
0.08
0.10
0.12
te = 108 days
W (
% )
t 1/2 (hours)
pN= 300 bar pN= 700 bar
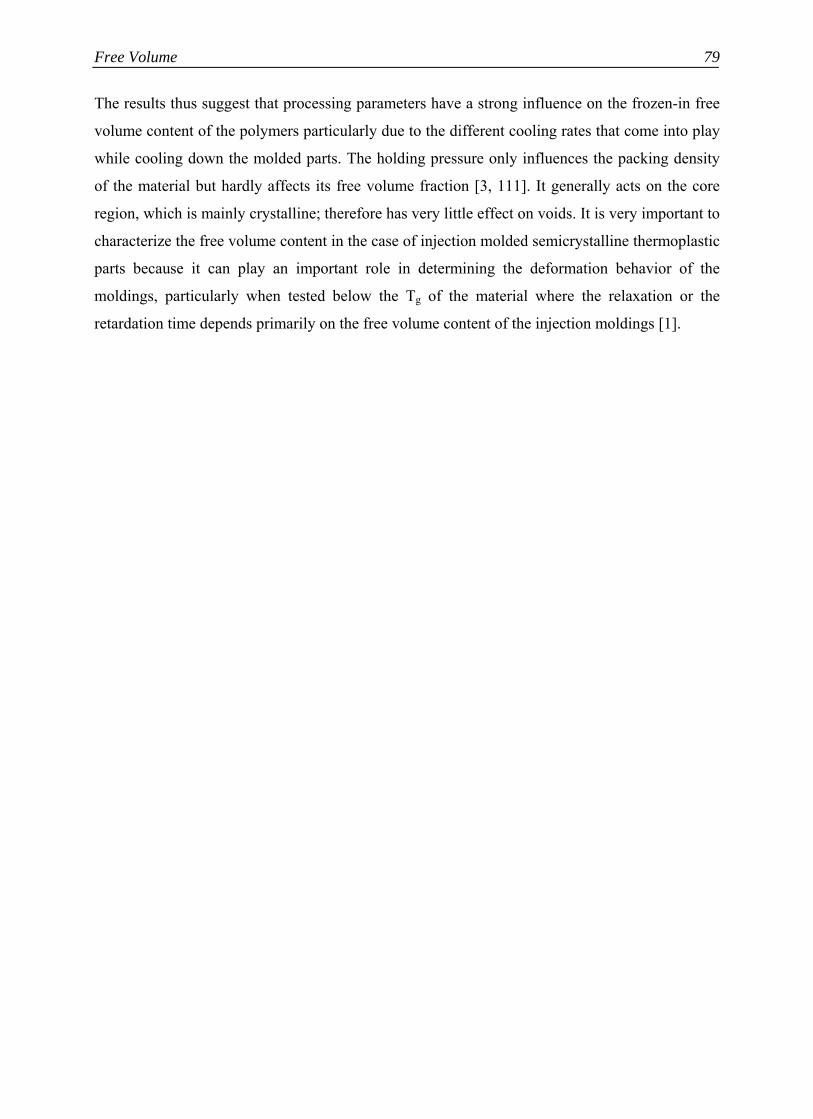
Free Volume
79
The results thus suggest that processing parameters have a strong influence on the frozen-in free
volume content of the polymers particularly due to the different cooling rates that come into play
while cooling down the molded parts. The holding pressure only influences the packing density
of the material but hardly affects its free volume fraction [3, 111]. It generally acts on the core
region, which is mainly crystalline; therefore has very little effect on voids. It is very important to
characterize the free volume content in the case of injection molded semicrystalline thermoplastic
parts because it can play an important role in determining the deformation behavior of the
moldings, particularly when tested below the Tg of the material where the relaxation or the
retardation time depends primarily on the free volume content of the injection moldings [1].


Chapter 7
Molecular Orientation
Processes such as injection molding, where the polymer melt is forced to flow through long and
narrow spaces and cooled down at faster rates, causes molecular orientation to build up in the
molded part, particularly where the shear stresses and cooling rates are higher. Also in the case of
injection molded thermoplastic parts, residual stresses may be built up in the part due to the rapid
and inhomogeneous cooling of the polymer melt. Unbalanced residual stresses or molecular
orientation in particular, can influence the shrinkage behavior of a molded part. As a consequence
of inhibited contraction, residual stresses are accompanied by lower shrinkage values than the
shrinkage in a stress-free piece [6]. But they have only a negligible effect on the long-term
deformation behavior as known from previous studies [89]. So, major investigations on that topic
are escaped in this study. On the other hand, heating the molded part 40-50°C above its glass
transition temperature tends to relax the frozen-in molecular orientations inside the molded part
[3, 112]. Thus the detection and the measurement of the shrinkage is a way to characterize the
molecular orientation. In this chapter, the influence of processing parameters on the frozen-in
molecular orientation and its distribution across the thickness of the part has been discussed.
7.1 Influence of processing conditions
Syndiotactic polystyrene (sPS)
The influence of processing conditions on the frozen-in molecular orientations is shown in the
Fig. 7.1 - 7.4. The results show that molecular orientation is strongly influenced by the change in
mold temperature, injection flow rate and the direction of melt flow. Fig. 7.1 shows that an
increase in the mold temperature decreases the shrinkage in the molded part. This can be
explained by the slower cooling rate of the polymer melt when injected at higher mold
temperature as evident from Fig. 5.3 (Chapter 5). During injection molding, the layer near the
mold surface is cooled fast resulting in a thin layer of frozen-in molecular orientation. So,

Chapter 7 82
lowering the mold temperature, i.e., faster cooling rate, causes quicker freezing of the
orientations at the layers closer to the mold wall since less time is available for the stretched
molecules to relax and hence higher frozen-in orientation. At the core region, the orientation of
the molecules is generally considerably relaxed [112].
Fig. 7.1 Effect of the variation of mold temperature on the shrinkage behavior
of sPS
Fig. 7.2 shows that with the increase in the melt temperature, frozen-in molecular
orientation decreases as detected from the shrinkage measurements. An increase in melt
temperature generally reduces the melt viscosity and hence the amount of shear the polymer
experiences during processing. A higher melt temperature is therefore expected to produce a
thinner layer of frozen-in molecular orientations and hence lower shrinkage.
Fig. 7.2 Effect of melt temperature variation on the shrinkage behavior of sPS
20 40 60 80 1000.0
0.5
1.0
1.5
2.0
2.5
sPSSh
rinka
ge (%
)
Mold temperature (°C)
290 300 310 320 3300.0
0.5
1.0
1.5
2.0
2.5
sPS
Shrin
kage
(%)
Melt temperature (°C)

Molecular Orientation
83
Fig. 7.3 shows that the amount of shrinkage also decreases with increasing injection flow
rate. Although a higher flow rate causes higher shearing near the mold wall and therefore
orientation is expected to be larger, but the oriented layer will be thinner because increasing the
flow rate will also decrease the filling time and consequently the time the polymer melt
experiences the flow stresses [113]. On the other hand, increasing the filling time, i.e., slower
injection flow rate, will increase the thickness of this frozen-layer and hence the molecular
orientation.
Fig. 7.3 Effect of the variation of injection flow rate on the shrinkage
behavior of sPS
Fig. 7.4 shows higher shrinkage for sPS cut out parallel to the flow direction of the injection
molded plates and indicates that higher degree of orientation is frozen in the flow direction
because during the filling phase, polymer chains are more stretched and oriented in the direction
of flow. These orientations are frozen-in at the end of injection molding; hence more shrinkage is
expected in the melt flow direction. A variation in the holding pressure showed no significant
difference in shrinkage because the frozen layer is generally already built up when the unit is
switched to holding pressure phase.
5 10 15 20 25 30 350.0
0.5
1.0
1.5
2.0
2.5sPS
Shrin
kage
(%)
Injection flow rate (ccm/s)
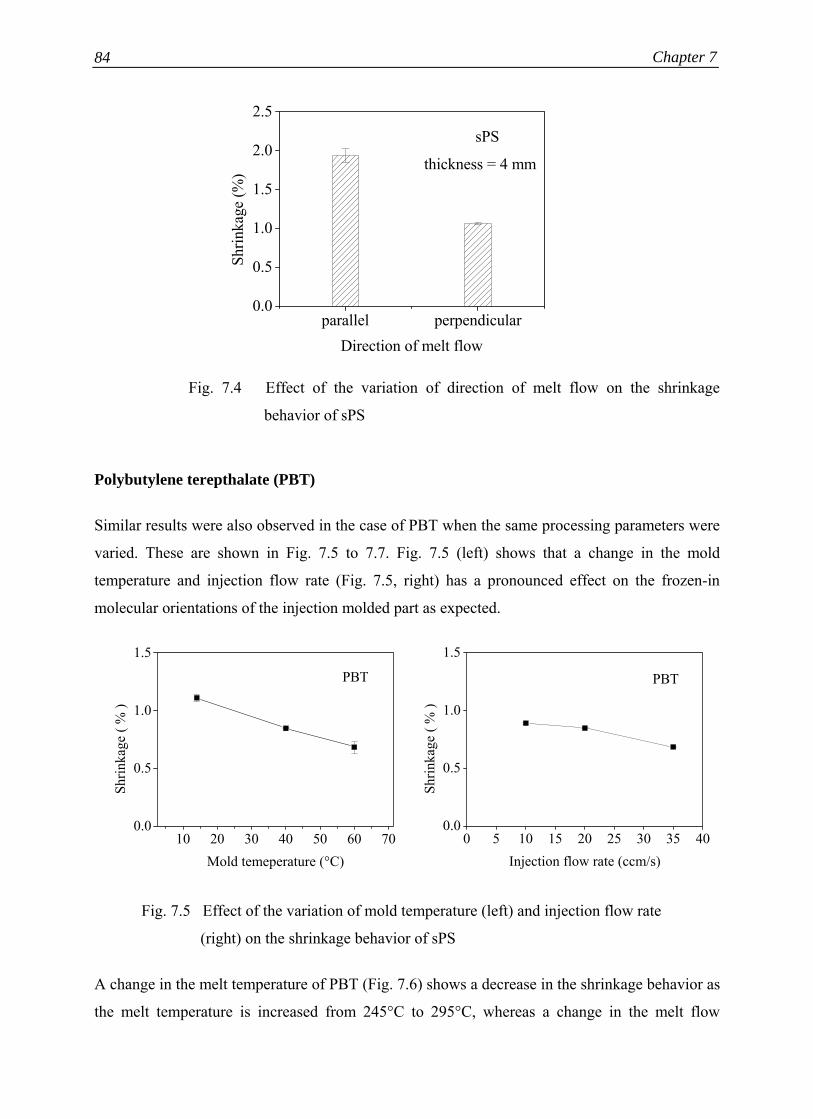
Chapter 7 84
Fig. 7.4 Effect of the variation of direction of melt flow on the shrinkage
behavior of sPS
Polybutylene terepthalate (PBT)
Similar results were also observed in the case of PBT when the same processing parameters were
varied. These are shown in Fig. 7.5 to 7.7. Fig. 7.5 (left) shows that a change in the mold
temperature and injection flow rate (Fig. 7.5, right) has a pronounced effect on the frozen-in
molecular orientations of the injection molded part as expected.
Fig. 7.5 Effect of the variation of mold temperature (left) and injection flow rate
(right) on the shrinkage behavior of sPS
A change in the melt temperature of PBT (Fig. 7.6) shows a decrease in the shrinkage behavior as
the melt temperature is increased from 245°C to 295°C, whereas a change in the melt flow
parallel perpendicular0.0
0.5
1.0
1.5
2.0
2.5sPS
Shrin
kage
(%)
Direction of melt flow
thickness = 4 mm
10 20 30 40 50 60 700.0
0.5
1.0
1.5
PBT
Shrin
kage
( %
)
Mold temeperature (°C)0 5 10 15 20 25 30 35 40
0.0
0.5
1.0
1.5
PBT
Shrin
kage
( %
)
Injection flow rate (ccm/s)
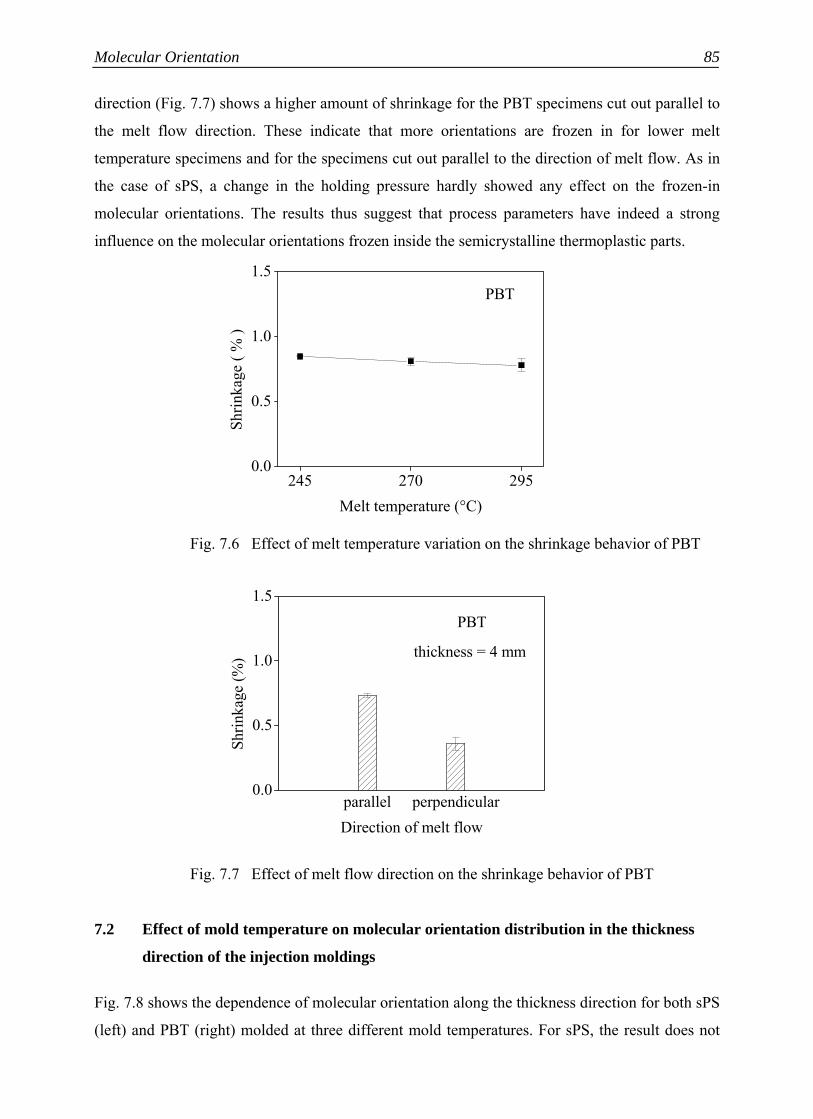
Molecular Orientation
85
direction (Fig. 7.7) shows a higher amount of shrinkage for the PBT specimens cut out parallel to
the melt flow direction. These indicate that more orientations are frozen in for lower melt
temperature specimens and for the specimens cut out parallel to the direction of melt flow. As in
the case of sPS, a change in the holding pressure hardly showed any effect on the frozen-in
molecular orientations. The results thus suggest that process parameters have indeed a strong
influence on the molecular orientations frozen inside the semicrystalline thermoplastic parts.
Fig. 7.6 Effect of melt temperature variation on the shrinkage behavior of PBT
Fig. 7.7 Effect of melt flow direction on the shrinkage behavior of PBT
7.2 Effect of mold temperature on molecular orientation distribution in the thickness
direction of the injection moldings
Fig. 7.8 shows the dependence of molecular orientation along the thickness direction for both sPS
(left) and PBT (right) molded at three different mold temperatures. For sPS, the result does not
parallel perpendicular0.0
0.5
1.0
1.5
PBT
Shrin
kage
(%)
Direction of melt flow
thickness = 4 mm
245 270 2950.0
0.5
1.0
1.5PBT
Shrin
kage
( %
)
Melt temperature (°C)
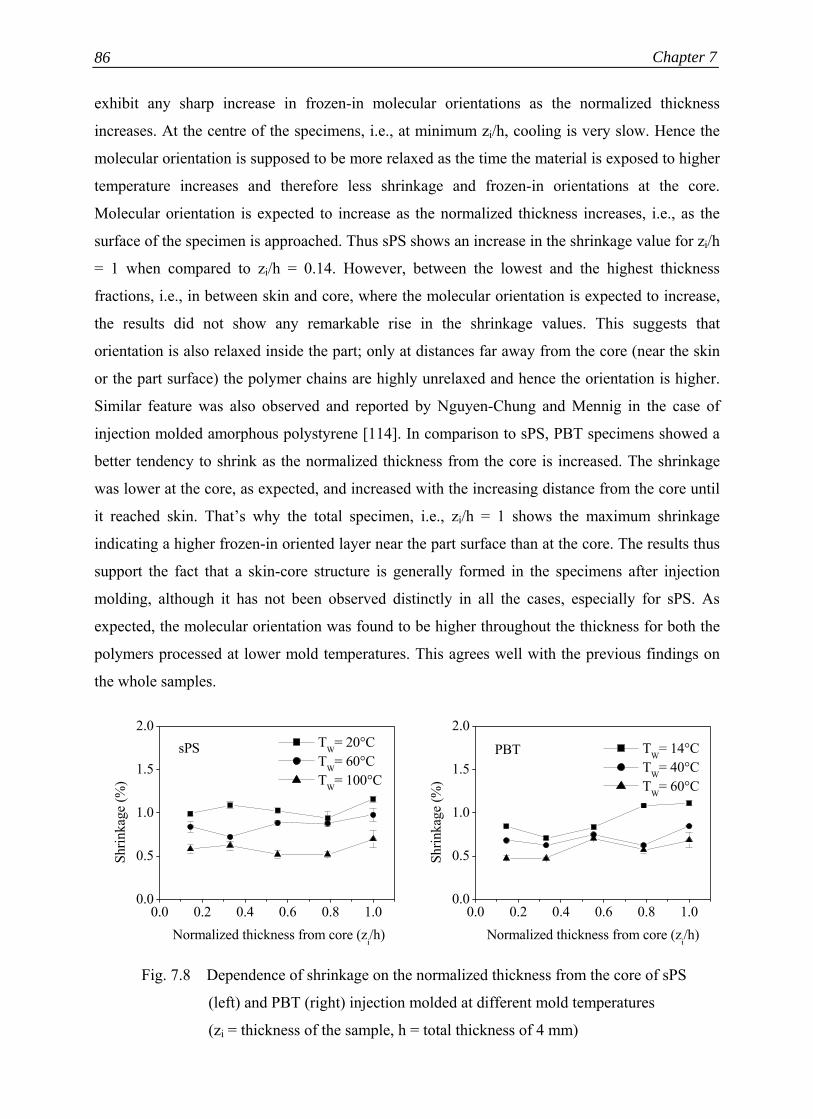
Chapter 7 86
exhibit any sharp increase in frozen-in molecular orientations as the normalized thickness
increases. At the centre of the specimens, i.e., at minimum zi/h, cooling is very slow. Hence the
molecular orientation is supposed to be more relaxed as the time the material is exposed to higher
temperature increases and therefore less shrinkage and frozen-in orientations at the core.
Molecular orientation is expected to increase as the normalized thickness increases, i.e., as the
surface of the specimen is approached. Thus sPS shows an increase in the shrinkage value for zi/h
= 1 when compared to zi/h = 0.14. However, between the lowest and the highest thickness
fractions, i.e., in between skin and core, where the molecular orientation is expected to increase,
the results did not show any remarkable rise in the shrinkage values. This suggests that
orientation is also relaxed inside the part; only at distances far away from the core (near the skin
or the part surface) the polymer chains are highly unrelaxed and hence the orientation is higher.
Similar feature was also observed and reported by Nguyen-Chung and Mennig in the case of
injection molded amorphous polystyrene [114]. In comparison to sPS, PBT specimens showed a
better tendency to shrink as the normalized thickness from the core is increased. The shrinkage
was lower at the core, as expected, and increased with the increasing distance from the core until
it reached skin. That’s why the total specimen, i.e., zi/h = 1 shows the maximum shrinkage
indicating a higher frozen-in oriented layer near the part surface than at the core. The results thus
support the fact that a skin-core structure is generally formed in the specimens after injection
molding, although it has not been observed distinctly in all the cases, especially for sPS. As
expected, the molecular orientation was found to be higher throughout the thickness for both the
polymers processed at lower mold temperatures. This agrees well with the previous findings on
the whole samples.
Fig. 7.8 Dependence of shrinkage on the normalized thickness from the core of sPS
(left) and PBT (right) injection molded at different mold temperatures
(zi = thickness of the sample, h = total thickness of 4 mm)
0.0 0.2 0.4 0.6 0.8 1.00.0
0.5
1.0
1.5
2.0sPS
Shrin
kage
(%)
Normalized thickness from core (zi/h)
TW= 20°C TW= 60°C TW= 100°C
0.0 0.2 0.4 0.6 0.8 1.00.0
0.5
1.0
1.5
2.0
PBT
Shrin
kage
(%)
Normalized thickness from core (zi/h)
TW= 14°C TW= 40°C TW= 60°C
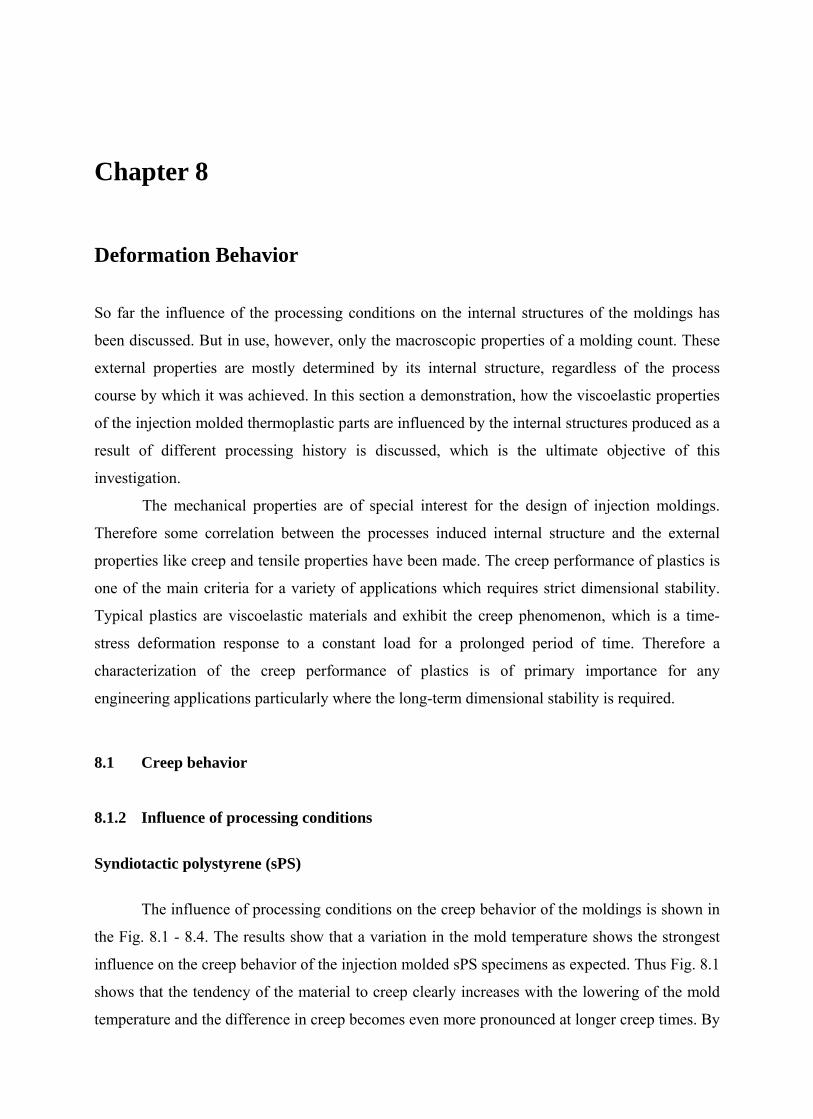
Chapter 8
Deformation Behavior
So far the influence of the processing conditions on the internal structures of the moldings has
been discussed. But in use, however, only the macroscopic properties of a molding count. These
external properties are mostly determined by its internal structure, regardless of the process
course by which it was achieved. In this section a demonstration, how the viscoelastic properties
of the injection molded thermoplastic parts are influenced by the internal structures produced as a
result of different processing history is discussed, which is the ultimate objective of this
investigation.
The mechanical properties are of special interest for the design of injection moldings.
Therefore some correlation between the processes induced internal structure and the external
properties like creep and tensile properties have been made. The creep performance of plastics is
one of the main criteria for a variety of applications which requires strict dimensional stability.
Typical plastics are viscoelastic materials and exhibit the creep phenomenon, which is a time-
stress deformation response to a constant load for a prolonged period of time. Therefore a
characterization of the creep performance of plastics is of primary importance for any
engineering applications particularly where the long-term dimensional stability is required.
8.1 Creep behavior
8.1.2 Influence of processing conditions
Syndiotactic polystyrene (sPS)
The influence of processing conditions on the creep behavior of the moldings is shown in
the Fig. 8.1 - 8.4. The results show that a variation in the mold temperature shows the strongest
influence on the creep behavior of the injection molded sPS specimens as expected. Thus Fig. 8.1
shows that the tendency of the material to creep clearly increases with the lowering of the mold
temperature and the difference in creep becomes even more pronounced at longer creep times. By
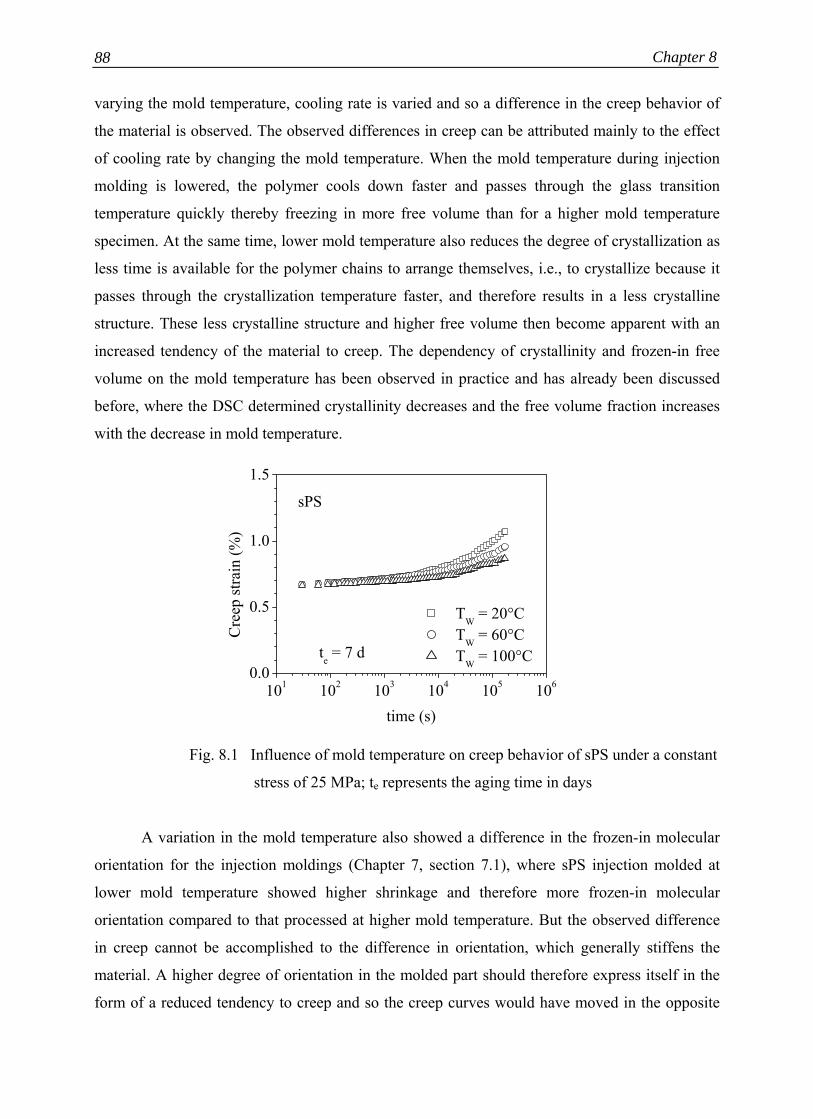
Chapter 8 88
varying the mold temperature, cooling rate is varied and so a difference in the creep behavior of
the material is observed. The observed differences in creep can be attributed mainly to the effect
of cooling rate by changing the mold temperature. When the mold temperature during injection
molding is lowered, the polymer cools down faster and passes through the glass transition
temperature quickly thereby freezing in more free volume than for a higher mold temperature
specimen. At the same time, lower mold temperature also reduces the degree of crystallization as
less time is available for the polymer chains to arrange themselves, i.e., to crystallize because it
passes through the crystallization temperature faster, and therefore results in a less crystalline
structure. These less crystalline structure and higher free volume then become apparent with an
increased tendency of the material to creep. The dependency of crystallinity and frozen-in free
volume on the mold temperature has been observed in practice and has already been discussed
before, where the DSC determined crystallinity decreases and the free volume fraction increases
with the decrease in mold temperature.
Fig. 8.1 Influence of mold temperature on creep behavior of sPS under a constant
stress of 25 MPa; te represents the aging time in days
A variation in the mold temperature also showed a difference in the frozen-in molecular
orientation for the injection moldings (Chapter 7, section 7.1), where sPS injection molded at
lower mold temperature showed higher shrinkage and therefore more frozen-in molecular
orientation compared to that processed at higher mold temperature. But the observed difference
in creep cannot be accomplished to the difference in orientation, which generally stiffens the
material. A higher degree of orientation in the molded part should therefore express itself in the
form of a reduced tendency to creep and so the creep curves would have moved in the opposite
101 102 103 104 105 1060.0
0.5
1.0
1.5
sPS
te = 7 d
Cre
ep st
rain
(%)
time (s)
TW = 20°C TW = 60°C TW = 100°C
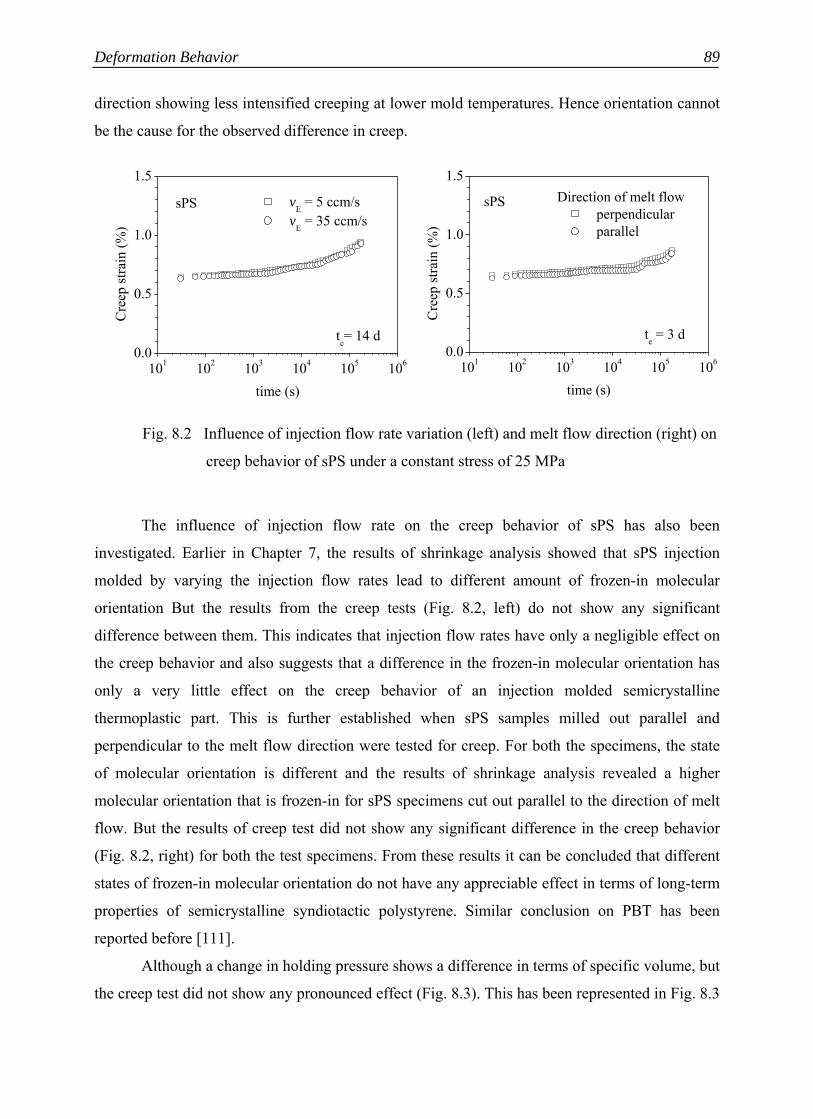
Deformation Behavior
89
direction showing less intensified creeping at lower mold temperatures. Hence orientation cannot
be the cause for the observed difference in creep.
Fig. 8.2 Influence of injection flow rate variation (left) and melt flow direction (right) on
creep behavior of sPS under a constant stress of 25 MPa
The influence of injection flow rate on the creep behavior of sPS has also been
investigated. Earlier in Chapter 7, the results of shrinkage analysis showed that sPS injection
molded by varying the injection flow rates lead to different amount of frozen-in molecular
orientation But the results from the creep tests (Fig. 8.2, left) do not show any significant
difference between them. This indicates that injection flow rates have only a negligible effect on
the creep behavior and also suggests that a difference in the frozen-in molecular orientation has
only a very little effect on the creep behavior of an injection molded semicrystalline
thermoplastic part. This is further established when sPS samples milled out parallel and
perpendicular to the melt flow direction were tested for creep. For both the specimens, the state
of molecular orientation is different and the results of shrinkage analysis revealed a higher
molecular orientation that is frozen-in for sPS specimens cut out parallel to the direction of melt
flow. But the results of creep test did not show any significant difference in the creep behavior
(Fig. 8.2, right) for both the test specimens. From these results it can be concluded that different
states of frozen-in molecular orientation do not have any appreciable effect in terms of long-term
properties of semicrystalline syndiotactic polystyrene. Similar conclusion on PBT has been
reported before [111].
Although a change in holding pressure shows a difference in terms of specific volume, but
the creep test did not show any pronounced effect (Fig. 8.3). This has been represented in Fig. 8.3
101 102 103 104 105 1060.0
0.5
1.0
1.5
te= 14 d
sPS
Cre
ep st
rain
(%)
time (s)
vE = 5 ccm/s vE = 35 ccm/s
101 102 103 104 105 1060.0
0.5
1.0
1.5
te = 3 d
sPS Direction of melt flow perpendicular parallel
Cre
ep st
rain
(%)
time (s)
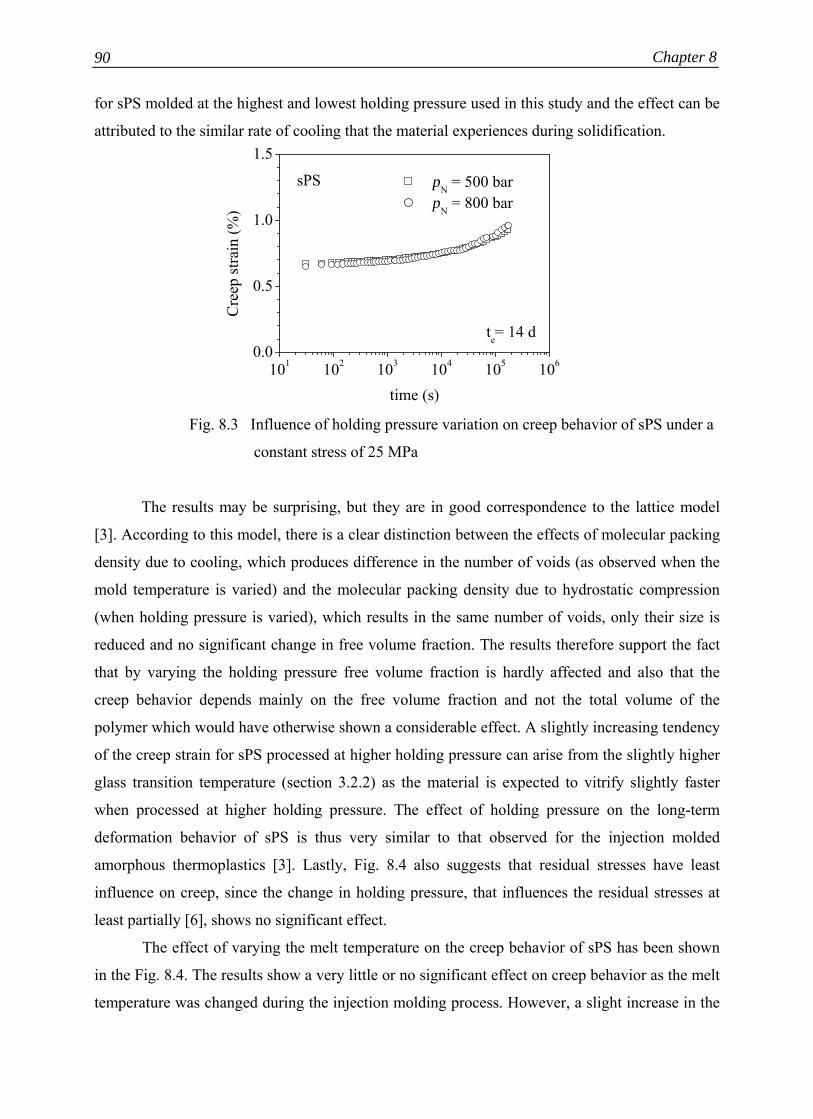
Chapter 8 90
for sPS molded at the highest and lowest holding pressure used in this study and the effect can be
attributed to the similar rate of cooling that the material experiences during solidification.
Fig. 8.3 Influence of holding pressure variation on creep behavior of sPS under a
constant stress of 25 MPa
The results may be surprising, but they are in good correspondence to the lattice model
[3]. According to this model, there is a clear distinction between the effects of molecular packing
density due to cooling, which produces difference in the number of voids (as observed when the
mold temperature is varied) and the molecular packing density due to hydrostatic compression
(when holding pressure is varied), which results in the same number of voids, only their size is
reduced and no significant change in free volume fraction. The results therefore support the fact
that by varying the holding pressure free volume fraction is hardly affected and also that the
creep behavior depends mainly on the free volume fraction and not the total volume of the
polymer which would have otherwise shown a considerable effect. A slightly increasing tendency
of the creep strain for sPS processed at higher holding pressure can arise from the slightly higher
glass transition temperature (section 3.2.2) as the material is expected to vitrify slightly faster
when processed at higher holding pressure. The effect of holding pressure on the long-term
deformation behavior of sPS is thus very similar to that observed for the injection molded
amorphous thermoplastics [3]. Lastly, Fig. 8.4 also suggests that residual stresses have least
influence on creep, since the change in holding pressure, that influences the residual stresses at
least partially [6], shows no significant effect.
The effect of varying the melt temperature on the creep behavior of sPS has been shown
in the Fig. 8.4. The results show a very little or no significant effect on creep behavior as the melt
temperature was changed during the injection molding process. However, a slight increase in the
101 102 103 104 105 1060.0
0.5
1.0
1.5
te= 14 d
sPS
Cre
ep st
rain
(%)
time (s)
pN = 500 bar pN = 800 bar
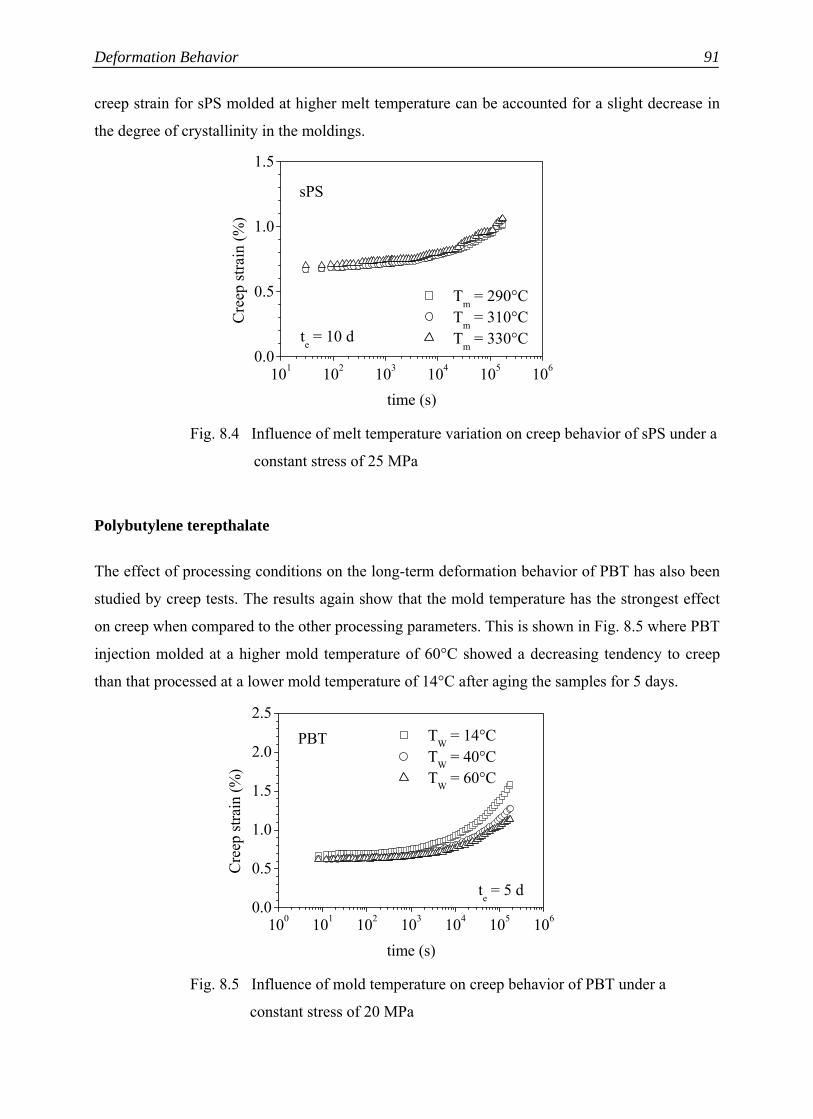
Deformation Behavior
91
creep strain for sPS molded at higher melt temperature can be accounted for a slight decrease in
the degree of crystallinity in the moldings.
Fig. 8.4 Influence of melt temperature variation on creep behavior of sPS under a
constant stress of 25 MPa
Polybutylene terepthalate
The effect of processing conditions on the long-term deformation behavior of PBT has also been
studied by creep tests. The results again show that the mold temperature has the strongest effect
on creep when compared to the other processing parameters. This is shown in Fig. 8.5 where PBT
injection molded at a higher mold temperature of 60°C showed a decreasing tendency to creep
than that processed at a lower mold temperature of 14°C after aging the samples for 5 days.
Fig. 8.5 Influence of mold temperature on creep behavior of PBT under a
constant stress of 20 MPa
100 101 102 103 104 105 1060.0
0.5
1.0
1.5
2.0
2.5
te = 5 d
PBT
Cre
ep st
rain
(%)
time (s)
TW
= 14°C TW = 40°C TW = 60°C
101 102 103 104 105 1060.0
0.5
1.0
1.5
Cre
ep st
rain
(%)
sPS
te = 10 d
time (s)
Tm = 290°C Tm = 310°C Tm = 330°C
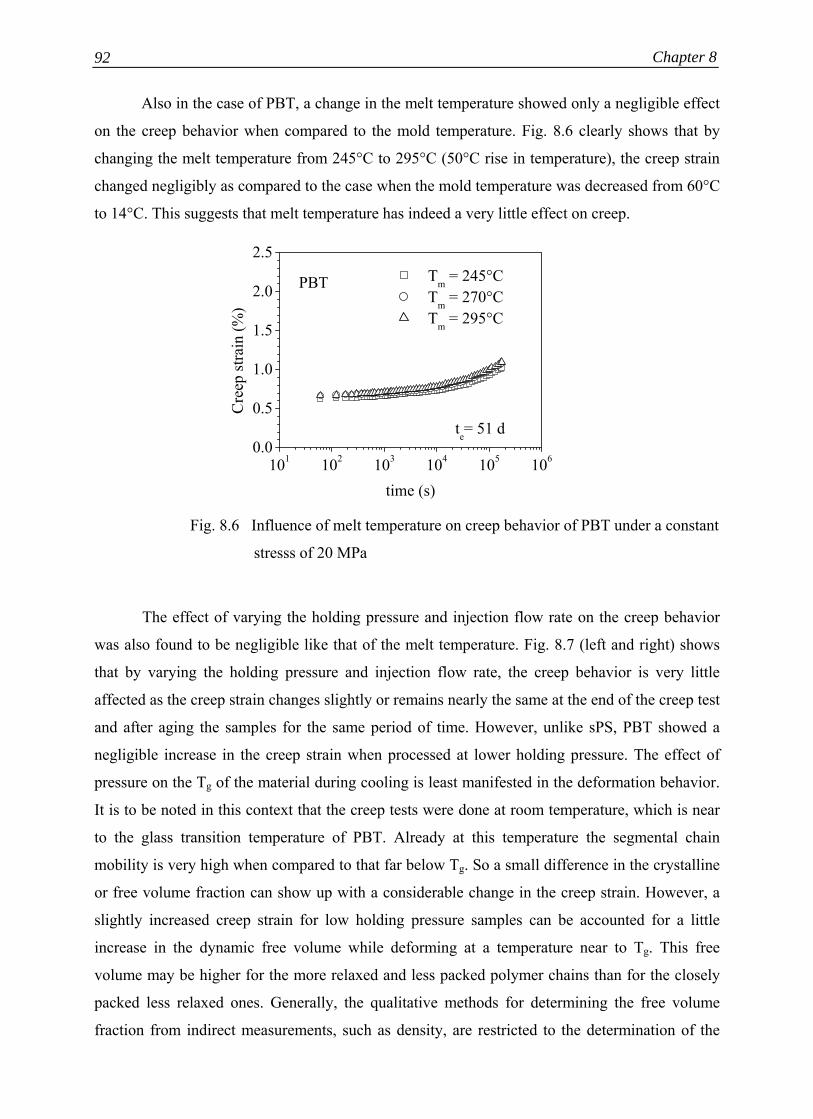
Chapter 8 92
Also in the case of PBT, a change in the melt temperature showed only a negligible effect
on the creep behavior when compared to the mold temperature. Fig. 8.6 clearly shows that by
changing the melt temperature from 245°C to 295°C (50°C rise in temperature), the creep strain
changed negligibly as compared to the case when the mold temperature was decreased from 60°C
to 14°C. This suggests that melt temperature has indeed a very little effect on creep.
Fig. 8.6 Influence of melt temperature on creep behavior of PBT under a constant
stresss of 20 MPa
The effect of varying the holding pressure and injection flow rate on the creep behavior
was also found to be negligible like that of the melt temperature. Fig. 8.7 (left and right) shows
that by varying the holding pressure and injection flow rate, the creep behavior is very little
affected as the creep strain changes slightly or remains nearly the same at the end of the creep test
and after aging the samples for the same period of time. However, unlike sPS, PBT showed a
negligible increase in the creep strain when processed at lower holding pressure. The effect of
pressure on the Tg of the material during cooling is least manifested in the deformation behavior.
It is to be noted in this context that the creep tests were done at room temperature, which is near
to the glass transition temperature of PBT. Already at this temperature the segmental chain
mobility is very high when compared to that far below Tg. So a small difference in the crystalline
or free volume fraction can show up with a considerable change in the creep strain. However, a
slightly increased creep strain for low holding pressure samples can be accounted for a little
increase in the dynamic free volume while deforming at a temperature near to Tg. This free
volume may be higher for the more relaxed and less packed polymer chains than for the closely
packed less relaxed ones. Generally, the qualitative methods for determining the free volume
fraction from indirect measurements, such as density, are restricted to the determination of the
101 102 103 104 105 1060.0
0.5
1.0
1.5
2.0
2.5
PBT
te= 51 d
Cre
ep st
rain
(%)
time (s)
Tm = 245°C Tm = 270°C Tm = 295°C

Deformation Behavior
93
static free volume or the interstitial unoccupied spaces that results from imperfect chain packing.
Besides, a dynamic or fluctuating free volume, is also present which can be evident from small-
angle x-ray scattering (SAXS) and xenon nuclear magnetic resonance (NMR) measurements
[115].
Fig. 8.7 Influence of holding pressure (left) and injection flow rate (right) on creep
behavior of PBT under a constant stress of 20 MPa
The results here thus imply that the deformation behavior of the injection molded
semicrystalline thermoplastics is very complicated when compared to the purely amorphous ones
as in the former a very complex semicrystalline morphology is produced after processing that can
make the deformation behavior of the moldings more complicated than predicted. Moreover,
from the obtained results, it is very difficult to conclude whether the degree of crystallinity or the
free volume fraction plays a major role in influencing the deformation behavior of the
semicrystalline thermoplastics because both of them can influence the segmental mobility of the
polymer and therefore, the creep behavior. A higher fraction of the crystalline phase or a lower
free volume fraction tends to increase the relaxation time and hence a lower creep strain.
8.1.2 Effect of physical aging
Generally, the deformation behavior of a semicrystalline polymer is quite complicated because of
its complex structure, where crystalline as well as amorphous phase can influence the viscoelastic
behavior. Unlike the crystalline phase, the amorphous phase contains excess frozen-in free
volume which tends to diffuse out of the material with time until a thermodynamically
equilibrium state is attained. This effect is called physical aging and is manifested by the change
100 101 102 103 104 105 1060.0
0.5
1.0
1.5
2.0
2.5
te = 5 d
Cre
ep st
rain
( %
) PBT
time (s)
pN = 300 bar p
N = 700 bar
100 101 102 103 104 105 1060.0
0.5
1.0
1.5
2.0
2.5
te = 1 d
PBT
Cre
ep st
rain
(%)
time (s)
VE = 10 ccm/s V
E = 35 ccm/s

Chapter 8 94
in material properties like strength, stiffness, creep, etc and hence investigated in the case of sPS
in the following section by studying the creep behavior.
Fig. 8.8 thus represents the creep behavior of the injection molded sPS specimens
processed at a mold temperature of 100°C when allowed to age for 7, 33 and 46 days. The results
show that creep strain decreases as the material is aged for a longer time. Similar effects have
been exclusively observed and reported by Struik [3] and many other researchers before [3, 61,
89, 116-118] and have been attributed mainly to the time dependent free volume reduction of the
material in order to attain the thermodynamically equilibrium state. Generally, according to
Struik [3], the basic property that changes during aging is the segmental mobility, which depends
upon the free volume. Again, the relaxation or the retardation time of a glassy polymer is directly
related to the mobility. Since the mobility decreases due to aging, the retardation time increases
and the creep strain decreases. Below Tg, the retardation times become so large that an increase in
the aging time significantly affects the creep behavior of the material.
Fig. 8.8 Dependence of creep behavior on aging time for sPS molded at 100°C
(applied stress = 25 MPa)
Fig. 8.8 also shows that the creep strain decreased significantly when sPS specimens
produced at a mold temperature of 100°C were annealed for 48 hours at 70°C (annealing below
Tg). Similar results were also observed for sPS processed at lower mold temperatures. Since by
annealing at a temperature below Tg for several hours, the material is supposed to reach its
equilibrium state faster by diffusing out excess free volume, so the creep curves obtained after
annealing show the most reduced tendency to creep. It also indicates that the increase in specific
volume observed (in Chapter 6) after annealing below Tg can reasonably be accounted for an
increase in the occupied volume and not the free volume.
101 102 103 104 105 1060,0
0,5
1,0
1,5sPS
Cre
ep st
rain
(%)
time (s)
te = 7 d te = 33 d te = 46 d annealed

Deformation Behavior
95
Similar behavior was also observed in the case of all the PBT specimens where the creep
strain was found to decrease as the aging time was increased from 5 to 90 days. This has been
represented in Fig. 8.9 for PBT molded at 40°C. As the aging time increases, the creep curves
tend to become flatter and after annealing below the Tg of PBT (at 30°C for 48 hours), the
molded specimens showed a reduced tendency to creep. This supports the fact that by annealing
the processed material below Tg, the physical aging effect is accelerated.
Fig. 8.9 Dependence of creep behavior on aging time for PBT molded at 40°C
(applied stress = 20 MPa)
8.1.3 Deformation behavior of the injection moldings in the thickness direction
It is well known that during injection molding process, a layered structure develops along the
thickness of the molding, so it is expected that the deformation behavior will also be influenced
depending on the internal structures developed in these layers. This has been investigated in the
case of both the thermoplastics processed by varying the mold temperature.
Fig. 8.10 shows the creep behavior along the thickness direction of sPS specimens molded
at 20°C and 100°C respectively after milling out from both the surfaces. The results indicate that
the creep strain decreases as the normalized thickness from the core decreases, i.e., creep strain is
minimum near the core of the molded part and maximum at distances away from it. This has been
expected because during injection molding a layered structure is developed inside the molded
part which results in morphological distribution between the skin and core, referred to as skin-
core morphology. The crystalline fraction is higher at core when compared to that near the skin
(as shown in Chapter 5), whereas the free volume fraction is higher near the skin than at the core
100 101 102 103 104 105 1060.0
0.5
1.0
1.5
2.0
2.5
PBT
Cre
ep st
rain
(%)
time (s)
te= 5d te= 45d te= 90d annealed

Chapter 8 96
(Chapter 6). So the creep strain is expected to be lower at the core, i.e., at the normalized
thickness of 0.15 than at distance away from it.
Fig. 8.10 Dependence of creep strain on the normalized thickness from the core
of injection molded sPS after an aging time of 58 days (stress = 25 MPa)
Moreover, the results also indicate that the creep strain decreases in the thickness
direction as the mold temperature during injection molding is increased from 20°C to 100°C.
This suggests that during injection molding, cooling rate is indeed an important parameter that
governs the creep behavior of the moldings.
Fig. 8.11 Dependence of creep strain on the normalized thickness from the core of
injection molded PBT after an aging time of 30 days (stress = 20 MPa)
0.0 0.2 0.4 0.6 0.8 1.00.0
0.5
1.0
1.5
2.0
PBT
te = 30 d
Cre
ep st
rain
(%)
Normalized thickness from core (zi/h)
TW = 14°C TW = 60°C
0.0 0.2 0.4 0.6 0.8 1.00.0
0.2
0.4
0.6
0.8
1.0
te = 58 d
sPS
Cre
ep st
rain
(%)
Normalized thickness from core (zi/h)
TW = 20°C TW = 100°C
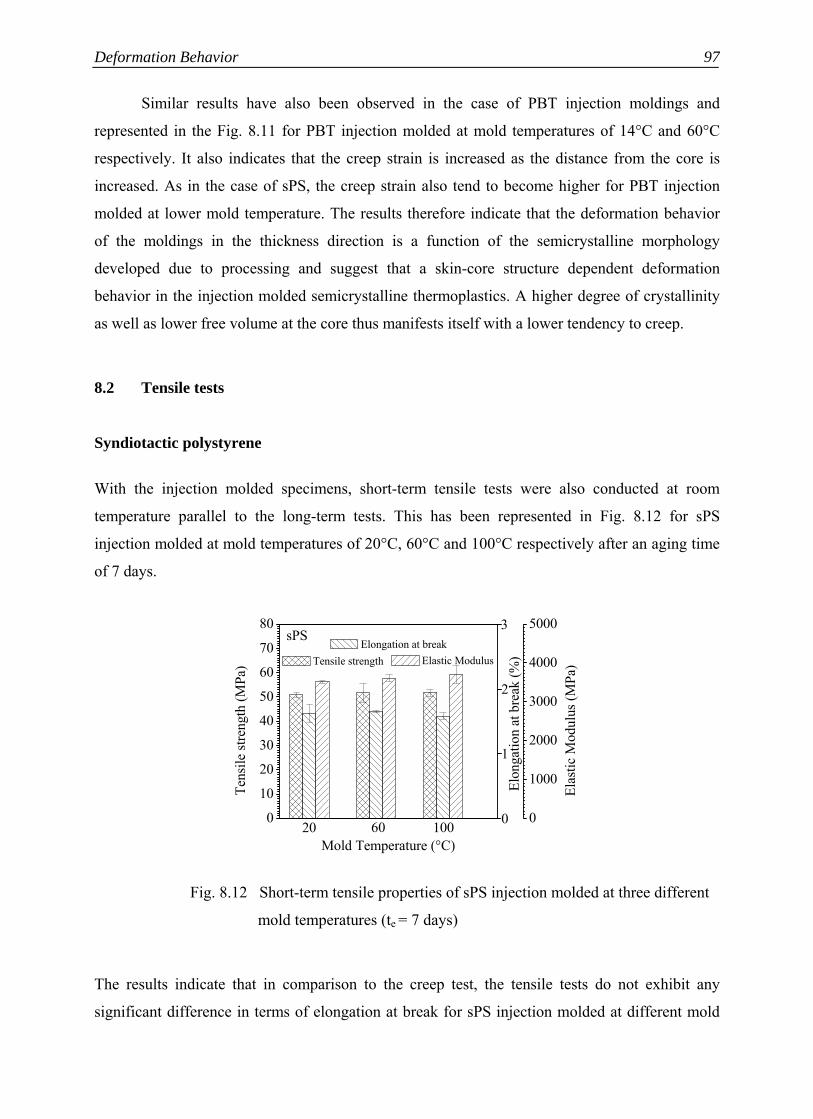
Deformation Behavior
97
Similar results have also been observed in the case of PBT injection moldings and
represented in the Fig. 8.11 for PBT injection molded at mold temperatures of 14°C and 60°C
respectively. It also indicates that the creep strain is increased as the distance from the core is
increased. As in the case of sPS, the creep strain also tend to become higher for PBT injection
molded at lower mold temperature. The results therefore indicate that the deformation behavior
of the moldings in the thickness direction is a function of the semicrystalline morphology
developed due to processing and suggest that a skin-core structure dependent deformation
behavior in the injection molded semicrystalline thermoplastics. A higher degree of crystallinity
as well as lower free volume at the core thus manifests itself with a lower tendency to creep.
8.2 Tensile tests
Syndiotactic polystyrene
With the injection molded specimens, short-term tensile tests were also conducted at room
temperature parallel to the long-term tests. This has been represented in Fig. 8.12 for sPS
injection molded at mold temperatures of 20°C, 60°C and 100°C respectively after an aging time
of 7 days.
Fig. 8.12 Short-term tensile properties of sPS injection molded at three different
mold temperatures (te = 7 days)
The results indicate that in comparison to the creep test, the tensile tests do not exhibit any
significant difference in terms of elongation at break for sPS injection molded at different mold
0
1
2
23 40 57 74 91 108 125
0
10
20
30
40
50
60
70
80sPS
1006020
Tens
ile st
reng
th (M
Pa)
Mold Temperature (°C)
Tensile strength
3
Elon
gatio
n at
bre
ak (%
)
Elongation at break
0
1000
2000
3000
4000
5000
Elas
tic M
odul
us (M
Pa) Elastic Modulus

Chapter 8 98
temperatures. The tensile strength and elastic modulus also changed very little. For sPS, the
tensile strength increased by approximately 2 % and the elastic modulus by approximately 4 %
when the mold temperature was changed from 20°C to 100°C (400 %). The results clearly show
that although the tensile tests do not exhibit any significant differences in terms of short-term
mechanical properties of the material produced at different mold temperatures, but when
considering the long-term properties, they show a significant effect.
Generally orientation effects have a strong influence on the mechanical behavior of the
processed part. With the increasing degree of molecular orientation elastic modulus is supposed
to be higher. Also elastic modulus is generally higher in the direction parallel to orientation and
lower perpendicular to it. Unlike creep compliance, the elastic modulus in short-term tensile tests
is determined from the linear viscoelastic region of the sress-strain curve, where the strain is very
small. So it is expected that higher molecular orientation at lower injection flow rate would show
up with an increase in modulus. However the results of tensile tests (Fig. 8.13) do not show any
significant effect on the elastic modulus of sPS processed at different injection flow rates. Only, a
slight increase in the tensile strength and elongation at break was observed for specimens
produced at lower injection flow.
Fig. 8.13 Short-term tensile properties of sPS injection molded at three different
injection flow rates (te = 7 days)
0
1
2
23 40 57 74 91 108 125
0
10
20
30
40
50
60
70
80sPS
35205
Tens
ile st
reng
th (
MPa
)
Injection flow rate (ccm/s)
Tensile strength
3
Elon
gatio
n at
bre
ak (
% )
Elongation at break
0
1000
2000
3000
4000
5000El
astic
Mod
ulus
( M
Pa ) Elastic Modulus

Deformation Behavior
99
Also the change in the melt flow direction did not show any significant effect on the
elastic modulus, but however, the tensile strength and the elongation at break decreased slightly
in the direction parallel to the melt flow. This is shown in Fig. 8.14 below.
Fig. 8.14 Effect of melt flow direction on the short-term tensile properties
of sPS (te = 7 days)
Similarly, a change in the melt temperature and holding pressure showed no significant
effect on the mechanical properties of the material. The results therefore suggest that the
process-induced deformation behavior of the injection moldings can be better studied by
monitoring the effects on the long-term properties rather than by the short-term effects.
Polybutylene terepthalate
The effect of mold temperature on the tensile properties of PBT was also found to be similar to
that of sPS. This has been shown in Fig. 8.15, where the tensile properties were plotted as
functions of the mold temperatures after an aging time of 1 day. Unlike sPS, the stress-strain
diagram of the PBT specimens exhibited a ductile behavior as the material showed yielding after
which the stress remains fairly constant until it failed. Also in the case of PBT, the elongation at
yield and elastic modulus hardly changed (maximum ~ 2 %) when the mold temperature was
increased from 14°C to 60°C, whereas the tensile strength increased little with the mold
temperature. Like sPS, PBT also showed hardly any difference in terms of the short-term tensile
properties as the other processing parameters were varied.
0
1
40 57 74 91 108 125
0
10
20
30
40
50
60sPS
parallelperpendicular
Tens
ile st
reng
th (
MPa
)
Melt flow direction
Tensile strength
3
Elon
gatio
n at
bre
ak (
% )
Elongation at break
0
1000
2000
3000
4000
5000
Elas
tic M
odul
us (
MPa
) Elastic Modulus

Chapter 8 100
Fig. 8.15 Short-term tensile properties of PBT injection molded at three different
mold temperatures (te = 1 day)
Although the injection molded samples did not exhibit any sharp differences between the
materials produced by different processing conditions, but they showed the effect of physical
aging as the aging time was increased. This is shown in Fig. 8.16 in the case of PBT injection
molded at different mold temperatures where the elastic modulus and the elongation at yield are
plotted as functions of aging time. It shows that the elongation at yield tends to decrease and the
elastic modulus tends to increase as the aging time increases from 1 to 28 days. This indicates
that as the material is aged for a longer time, it becomes stiffer and brittle leading to higher elastic
modulus and lower elongation. Similar effects were also observed for sPS injection moldings and
also reported by many other researchers before [92, 119, 120] who accomplished this effect to the
time-dependent decrease in free volume as aging progresses. This also supports the fact that the
mechanical properties are not only material dependent but also depends on the time between the
processing and testing of the molded part.
0
1
2
3
4
5
23 40 57 74 91 108 125
0
10
20
30
40
50
60
70PBT
604014
Tens
ile st
reng
th (
MPa
)
Mold Temperature ( °C )
Tensile strength
Elon
gatio
n at
yie
ld (
% )
Elongation at yield
0
1000
2000
3000
4000
Elastic Modulus ( M
Pa )
Elastic Modulus
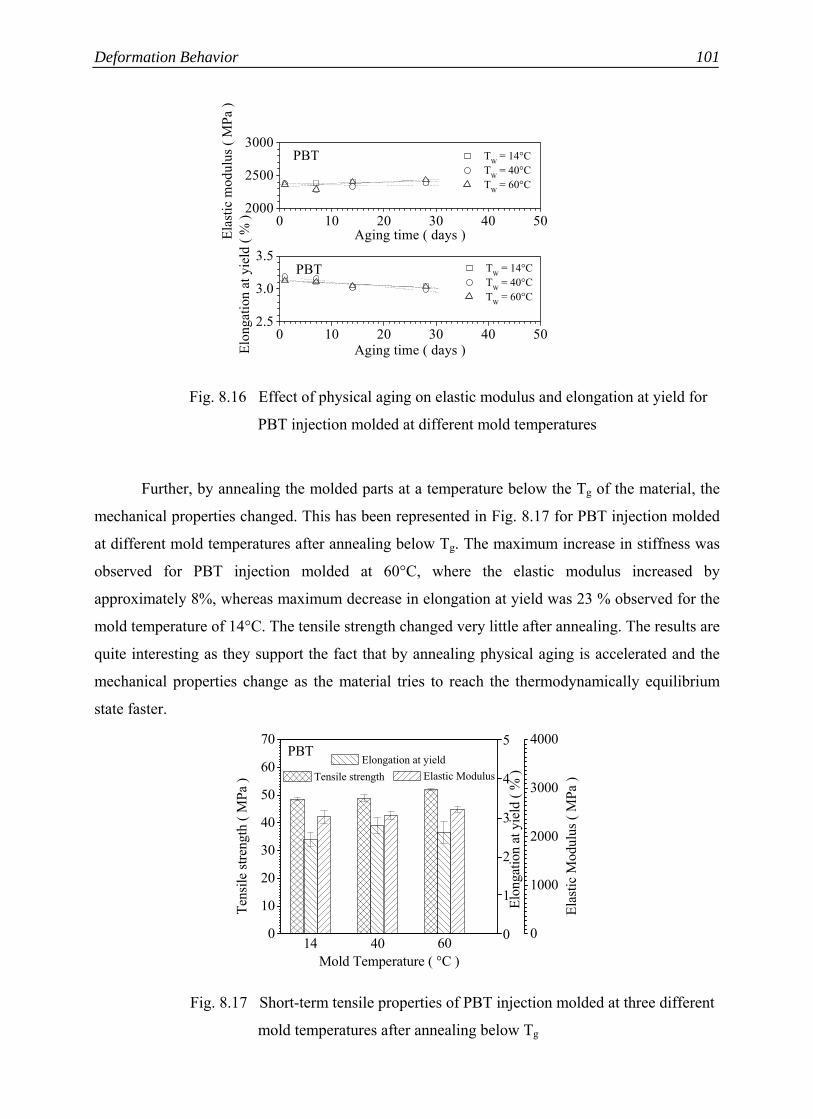
Deformation Behavior
101
Fig. 8.16 Effect of physical aging on elastic modulus and elongation at yield for
PBT injection molded at different mold temperatures
Further, by annealing the molded parts at a temperature below the Tg of the material, the
mechanical properties changed. This has been represented in Fig. 8.17 for PBT injection molded
at different mold temperatures after annealing below Tg. The maximum increase in stiffness was
observed for PBT injection molded at 60°C, where the elastic modulus increased by
approximately 8%, whereas maximum decrease in elongation at yield was 23 % observed for the
mold temperature of 14°C. The tensile strength changed very little after annealing. The results are
quite interesting as they support the fact that by annealing physical aging is accelerated and the
mechanical properties change as the material tries to reach the thermodynamically equilibrium
state faster.
Fig. 8.17 Short-term tensile properties of PBT injection molded at three different
mold temperatures after annealing below Tg
0 10 20 30 40 502.5
3.0
3.5
0 10 20 30 40 502000
2500
3000
PBT
Elon
gatio
n at
yie
ld (
% )
Aging time ( days )
TW = 14°C TW = 40°C TW = 60°C
PBT
Elas
tic m
odul
us (
MPa
)Aging time ( days )
TW = 14°C TW = 40°C TW = 60°C
0
1
2
3
4
5
23 40 57 74 91 108 125
0
10
20
30
40
50
60
70PBT
604014
Tens
ile st
reng
th (
MPa
)
Mold Temperature ( °C )
Tensile strength
Elon
gatio
n at
yie
ld (
% )
Elongation at yield
0
1000
2000
3000
4000
Elas
tic M
odul
us (
MPa
) Elastic Modulus
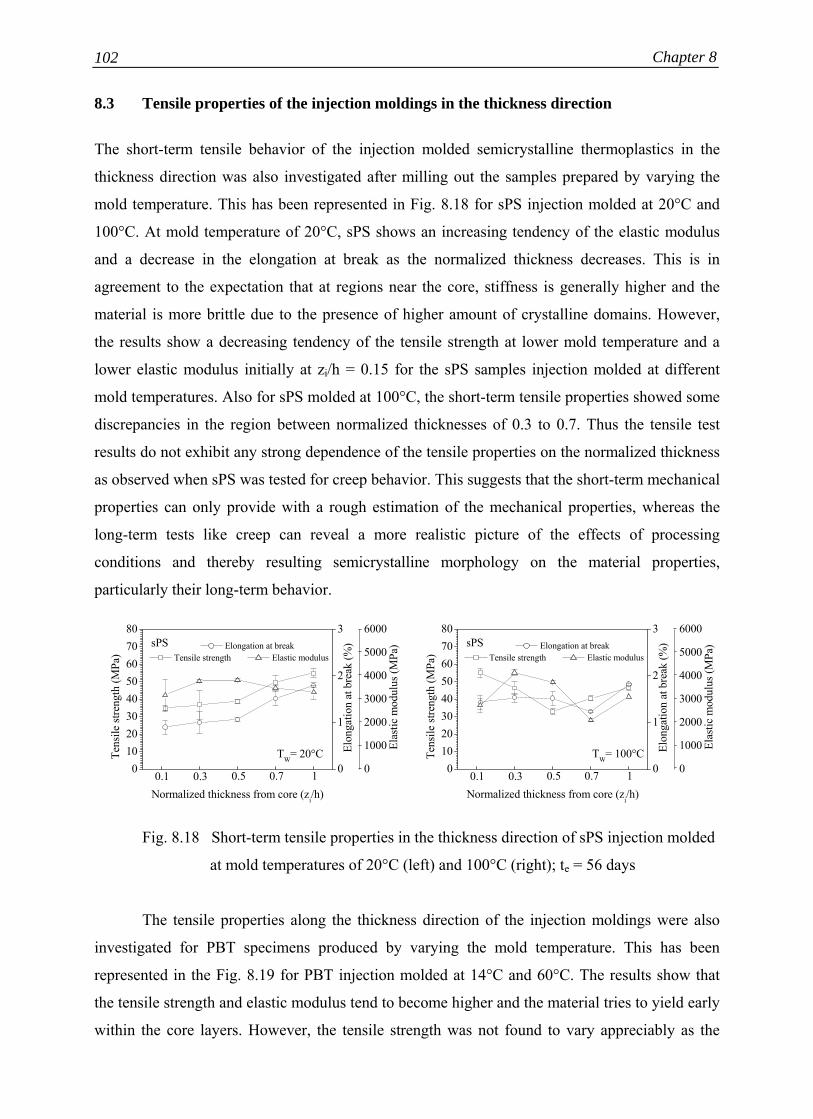
Chapter 8 102
8.3 Tensile properties of the injection moldings in the thickness direction
The short-term tensile behavior of the injection molded semicrystalline thermoplastics in the
thickness direction was also investigated after milling out the samples prepared by varying the
mold temperature. This has been represented in Fig. 8.18 for sPS injection molded at 20°C and
100°C. At mold temperature of 20°C, sPS shows an increasing tendency of the elastic modulus
and a decrease in the elongation at break as the normalized thickness decreases. This is in
agreement to the expectation that at regions near the core, stiffness is generally higher and the
material is more brittle due to the presence of higher amount of crystalline domains. However,
the results show a decreasing tendency of the tensile strength at lower mold temperature and a
lower elastic modulus initially at zi/h = 0.15 for the sPS samples injection molded at different
mold temperatures. Also for sPS molded at 100°C, the short-term tensile properties showed some
discrepancies in the region between normalized thicknesses of 0.3 to 0.7. Thus the tensile test
results do not exhibit any strong dependence of the tensile properties on the normalized thickness
as observed when sPS was tested for creep behavior. This suggests that the short-term mechanical
properties can only provide with a rough estimation of the mechanical properties, whereas the
long-term tests like creep can reveal a more realistic picture of the effects of processing
conditions and thereby resulting semicrystalline morphology on the material properties,
particularly their long-term behavior.
Fig. 8.18 Short-term tensile properties in the thickness direction of sPS injection molded
at mold temperatures of 20°C (left) and 100°C (right); te = 56 days
The tensile properties along the thickness direction of the injection moldings were also
investigated for PBT specimens produced by varying the mold temperature. This has been
represented in the Fig. 8.19 for PBT injection molded at 14°C and 60°C. The results show that
the tensile strength and elastic modulus tend to become higher and the material tries to yield early
within the core layers. However, the tensile strength was not found to vary appreciably as the
01020304050607080
TW= 20°C
10.70.50.30.1
Tens
ile st
reng
th (M
Pa)
Normalized thickness from core (zi/h)
Tensile strength
0
1
2
3
sPS
Elon
gatio
n at
bre
ak (%
) Elongation at break
0
1000
2000
3000
4000
5000
6000
Ela
stic
mod
ulus
(MPa
)
Elastic modulus
01020304050607080
TW= 100°C
10.70.50.30.1
Tens
ile st
reng
th (M
Pa)
Normalized thickness from core (zi/h)
Tensile strength
0
1
2
3
sPS
Elon
gatio
n at
bre
ak (%
) Elongation at break
0
1000
2000
3000
4000
5000
6000
Ela
stic
mod
ulus
(MPa
)
Elastic modulus

Deformation Behavior
103
normalized thickness increased except when the whole PBT test specimen (zi/h = 1) was
considered. The results suggest that due to rapid and inhomogeneous cooling during injection
molding, a layered structure is formed inside the molding forming a skin core morphology that
exhibits itself in the deformation behavior. This layered structure depends on the rate at which the
material is cooled down during injection molding; the faster the cooling rate, the more is the
tendency to form a skin-core structure [95]. This has been exhibited in the cases when the
samples were processed at lower mold temperature. However for PBT, the thermal diffusivity is
quite high and the polymer exhibit high crystallization rate, hence a skin-core structure even at
shorter molding cycles can be formed.
Fig. 8.19 Short-term tensile properties in the thickness direction of PBT injection
molded at mold temperatures of 14°C (left) and 60°C (right); te = 52 days
01020304050607080
TW= 14°C
10.70.50.30.1
Tens
ile st
reng
th (M
Pa)
Normalized thickness from core (zi/h)
Tensile strength
0
1
2
3
4
5
El
onga
tion
at y
ield
(%)
Elongation at yield
0
1000
2000
3000
4000
5000PBT
Ela
stic
mod
ulus
(MPa
) Elastic modulus
01020304050607080
TW= 60°C
10.70.50.30.1
Tens
ile st
reng
th (M
Pa)
Normalized thickness from core (zi/h)
Tensile strength
0
1
2
3
4
5
El
onga
tion
at y
ield
(%)
Elongation at yield
0
1000
2000
3000
4000
5000PBT
Ela
stic
mod
ulus
(MPa
)
Elastic modulus


Summary
The processing-structure-property response of injection molded semicrystalline
thermoplastics had been investigated. The effect of the complex thermorheological history during
processing was studied on two semicrystalline thermoplastics, viz. sPS and PBT. The influence
of the important processing parameters like mold temperature, injection flow rate, holding
pressure and melt temperature on the internal structures developed inside the moldings and
consequently their effect on the long-term deformation behavior was investigated by creep tests
at a temperature below their Tg. The results showed that mold temperature has a significant effect
on the creep behavior of both the injection molded semicrystalline thermoplastics. Molding at
higher mold temperature leads to slower cooling rate that induced less free volume fraction and
more crystallinity frozen inside the moldings and ultimately reduces the segmental mobility
(increase in the relaxation or retardation time) of the solidified material. This was manifested in
the creep behavior with a decreasing tendency to creep. The qualitative estimation of the free
volume fraction also supported this fact as the specific volume and amount of water absorbed
were found to be less for the specimens processed at higher mold temperature. The DSC
determined crystallinity also increased due to slower cooling at higher mold temperature. On the
other hand a change in the injection flow rate as well as a change in the melt flow direction
showed no remarkable effect on creep. This leads to the suggestion that the frozen-in molecular
orientations have only negligible effect on the long-term properties of the moldings. The
processed materials showed similar degree of crystallinity and specific volume when molded at
different injection flow rates indicating that the identical creep behavior is mainly due to the
similar crystalline and free volume fraction in the moldings. When the holding pressure was
changed, the semicrystalline polymers showed differences in the specific volume. This was
attributed to the effect of packing pressure on the densification of the moldings and hardly
affected the free volume fraction. By performing the water absorption tests, it was affirmed that
the change in holding pressure has only a negligible effect on the free volume fraction. The
degree of crystallinity changed very little when the holding pressure was increased due to the
effect of pressure on the crystallization while cooling to the mold temperature and the creep
behavior was found to be hardly affected. This suggested that holding pressure during injection
molding has a very small effect on the creep behavior of semicrystalline thermoplastics. It was
Chapter 9 106
also found that melt temperature during injection molding has a very small effect on creep too as
the cooling rate is little affected on changing the melt temperature when compared to the change
in the mold temperature. From the obtained results it was reasonable to conclude that the mold
temperature during injection molding is the most important parameter (among those studied)
because it has pronounced effect on the cooling rate which ultimately affects the structural
parameters of the finished part. These finally govern the creep behavior. The results showed that
the long-term deformation behavior of the injection moldings could be successfully explained by
the free volume and the crystalline fractions developed inside the finished part as a result of
processing. Moreover, the theory of free volume could be successfully applied while explaining
the creep behavior of the semicrystalline polymers. The effect of physical aging was also
manifested in the molded parts as the creep tests showed a reduced tendency to creep as the aging
time was increased. The effect of aging was also manifested by the time-dependent volume
reduction and by the increasing tendency of the material to stiffen. Annealing below Tg showed
an accelerated physical aging effect as the material tried to reach the thermodynamically
equilibrium state faster by diffusing out excess free volume, but in contrary the specific volume
measurements showed an increasing effect after annealing. This opposite effect however did not
violate the theory of free volume and could be explained by the relaxation of the polymer chain
conformations which were compressed under the hydrostatic pressure during injection molding.
After annealing, the increase in the specific volume of the polymer was related to an increase in
the occupied volume and not due to the increase in free volume.
An effort was also made to study the gradient in the physical structures produced inside
the part, in the thickness direction, as a result of injection molding. So the injection molded
specimens produced by varying the mold temperatures were sliced off by different layers from
both the surfaces in order to produce samples of varying thickness from the core to the surface
and to investigate the structural gradient along the thickness direction. The results showed a
general tendency of free volume and molecular orientation to decrease as the core is reached,
whereas the crystallinity tends to increase with decreasing normalized thickness. These results
could be explained by the effect of cooling rate that produces a definite skin-core structure inside
the moldings and therefore a gradient in the physical structures in the thickness direction.
However, for PBT, crystallinity decreased very little with the increase in normalized thickness.
As expected, the creep strain was also found to increase as the normalized thickness from the
core increased.
In addition to the creep tests, tensile tests were also performed with the injection molded
samples, but the results did not show any significant effect in terms of the short-term mechanical
Summary
107
properties like tensile strength, elastic modulus, elongation at break or yield, even though a
significant difference in the creep strain due to changes in the processing conditions was
observed. This indicated that even when the short-term mechanical properties do not show any
effect of the processing conditions in terms of its short-term mechanical behavior, but while
considering its long-term properties it can show a significant effect. This leads to the suggestion
that short-term properties could be used for the rough estimates at the best.
Although the deformation behavior of the injection moldings could be successfully
explained by the presence of free volume and crystalline fraction in the moldings, it was difficult
to distinguish between the effects of these structural parameters on the viscoelastic properties of
the injection moldings because of the complex semicrystalline structure, where both the
crystalline as well as amorphous phase (free volume) can affect the segmental chain mobility of
the semicrystalline polymer simultaneously; this ultimately governs the deformation behavior.
Therefore, the deformation behavior of the injection molded semicrystalline thermoplastics is
quite complicated compared to what one would have expected/observed in the case of purely
amorphous ones, where the deformation behavior depends on only one parameter, i.e., the free
volume.

References 1. Struik, L. C. E.: Physical Ageing in Amorphous Polymers and other materials, Elsevier,
Amsterdam, 1978
2. DePorter, J. K., Baird, D. G., Wilkes, G. L.: The Effects of Thermal History on the
Properties of Semicrystalline Thermoplastic Composites: A Review of Experimental and
Numerical Investigations, Journal of Macromolecular Science, Part C: Reviews in
Macromolecular Chemistry and Physics, C33 (1993) 1-79 3. Engelsing, K.: Einfluß des freien Volumens auf das verarbeitungsabhängige
Deformationsverhalten spritzgegossener amorpher Thermoplaste, Ph.D Thesis,
Technische Universität Chemnitz, Germany, 2000
4. Crawford, R. J.: Plastics Engineering, 2nd Edition, Pergamon Press, Oxford, 1987
5. Struik, L.C.E.: Effects of Orientation and Cooling stresses in Injection Moldings, Polymer
Engineering and Science, 18 (1978) 799-811
6. Pötsch, G., Michaeli, W.: Injection Molding: An Introduction, Hanser, Munich, 1995
7. Wübken, G.: Einfluss der Verarbeitungsbedingungen auf die innere Struktur
thermoplastischer Spritzgußteile unter besonderer Berücksichtigung der
Abkühlverhältnisse, PhD Thesis, RWTH Aachen, Germany, 1974
8. Retting, W., Laun, H. M.: Kunststoff-Physik, Hanser, München, 1991
9. Ehrenstein, G. W.: Polymer-Werkstoffe: Struktur-Eigenschaften-Anwendung, 2nd
Edition, Hanser, München, 1999
10. Kovacs, A. J.: Transition vitreuse dans les polymèrs amorphes. Etude phénoménolique,
Fortschritte der Hochpolymeren-Forschung, 3 (1963) 394-507

References 110
11. Struik, L. C. E.: Physical Ageing : Influence on the Deformation Behavior of Amorphous
Polymers, In: Brostow, W., Corneliussen, R. D. (Eds.): Failure of Plastics, Hanser,
München, 1986, 209-234
12. Turnbull, D., Cohen, M. H.: Free-Volume Model of the Amorphous Phase: Glass
Transition, Journal of Chemical Physics, 34 (1961) 120-125
13. Doolittle, A. K., Doolittle, D. B.: Studies in Newtonian flow. Further verification of the
free-space viscosity equation, Journal of Applied Physics, 28 (1957) 901-905
14. Cohen, M. H., Turnbull, D.: Molecular transport in Liquids and Glasses, Journal of
Chemical Physics, 31 (1959) 1164-1169
15. Ferry, J. D.: Viscoelastic Properties of Polymers, 3rd Edition., Wiley and Sons, New
York, 1980
16. Williams, M. L., Landel, R. F., Ferry, J. D.: The Temperature Dependency of Relaxation
time Mechanisms in Amorphous Polymers and other Glass Forming Liquids, Journal of
American Chemical Society, 77 (1955) 3701-3707
17. Goldstein, M.: Some Thermodynamic Aspects of the Glass Transition: Free volume,
Entropy and Enthalpy Theories, Journal of Chemical Physics, 39 (1963) 3369-3374
18. Schweizer, K. S.: Microscopic Theory of the Dynamics of Polymeric Liquids: General
Formulation of a Mode-mode-coupling Approach, Journal of Chemical Physics, 91
(1989) 5802-5821
19. Schwarzl, F. R.: Polymermechanik: Struktur und mechanisches Verhalten von Polymeren,
Springer, Berlin, 1990
20. McKinney, J. E., Goldstein, M.: PVT Relationships for Liquid and Glassy Poly(vinyl
acetate), Journal of Research of the National Bureau of Standards – A. Physics and
Chemistry, 78A (1974) 331-353
21. Weitz, A., Wunderlich, B.: Thermal Analysis and Dilatometry of Glasses Formed Under
Elevated Pressure, Journal of Polymer Science Part B: Polymer Physics, 12 (1974) 2473-
2491
References
111
22. Yourtee, J. B., Cooper, S. L.: Properties of Densified Amorphous Polystyrene, Journal of
Applied Polymer Science, 18 (1974) 897-912
23. Price, C.: Effect of Pressure on the Formation of Poly(methyl methacrylate) Glasses,
Polymer, 16 (1975) 585-589
24. McKinney, J. E., Simha, R.: Thermodynamics of the Densification Process for Polymer
Glasses, Journal of Research of the National Bureau of Standards - A. Physics and
Chemistry, 81A (1977) 283-297
25. Greener, J.: Pressure-Induced Densification in Injection Molding, Polymer Engineering
and Science, 26 (1986) 534-542
26. Price, C., Williams, R. C., Ayerst, R. C.: In Amorphous Materials, Douglas, R.W. and
Ellis, B., (Eds.), Wiley Interscience, London , 1972
27. Bree, H. W., Heijboer, J., Struik, L. C. E., Tak, A. G. M.: The Effect of Densification on
the Mechanical Properties of Amorphous Glassy Polymers, Journal of Polymer Science
Part B: Polymer Physics, 12 (1974) 1857-1864
28. Cheng, S. Z. D., Wu, Z. Q., Wunderlich, B.: Glass Transition and Melting Behavior of
Poly(thio-1,4-phenylene), Macromolecules, 20 (1987) 2802-2810
29. Huo, P..P., Cebe, P.: Effects of Thermal History on the Rigid Amorphous Phase in
Poly(phenylene sulfide), Colloid and Polymer Science, 270 (1992) 840-852
30. Wu, S. S., Kalika, D. S., Lamonte, R. R., Makhija, S.: Crystallization, Melting, and
Relaxation of Modified poly(phenylene sulfide). I. Calorimetric Studies, Journal of
Macromolecular Science, Part B: Physics, B35 (1996) 157-178
31. Krishnaswamy, R. K., Geibel, J. F., Lewis, B. J.: Influence of Semicrystalline
Morphology on the Physical Aging Characteristics of Poly(phenylene sulfide),
Macromolecules, 36 (2003) 2907-2914
32. Cheng, S. Z. D., Cao, M. Y., Wunderlich, B.: Glass Transition and Melting Behavior of
Poly(oxy-1,4-phenyleneoxy-1,4-phenylenecarbonyl-1,4-phenylene), Macromolecules, 19
(1986) 1868-1876
References 112
33. Huo, P., Cebe, P.: Temperature-Dependent Relaxation of the Crystal-Amorphous
Interphase in Poly(ether ether ketone), Macromolecules, 25 (1992) 902-909
34. Kalika, D. S., Krishnaswamy, R. K.: Influence of Crystallinity on the Dielectric
Relaxation Behavior of Poly(ether ether ketone), Macromolecules, 26 (1993) 4252-4261
35. Mandelkern, L.: Crystallization of Polymers, McGraw-Hill, New York, 1964
36. Ziabicki, A.: Crystallization of Polymers in Variable External Conditions, Colloid and
Polymer Science, 274 (1996) 209-217
37. Nakamura, K., Watanabe, T., Katayama, K., Amano, T.: Some Aspects of Non isothermal
Crystallization of Polymers. I. Relation between Crystallization temperature,
Crystallinity, and Cooling conditions, Journal of Applied Polymer Science, 16 (1972)
1077-1091
38. Nakamura, K., Katayama, T., Amano, T.: Some Aspects of Nonisothermal Crystallization
of Polymers. II. Consideration of the Isokinetic Condition, Journal of Applied Polymer
Science, 17 (1973) 1031-1041
39. Eder, G., Janeschitz-Kriegl, H.: Crystallization, In Meijer, H. E. H., (Ed.), Processing of
Polymers, chapter 5, Volume 18, Cahn, R. W., Haasen, P., Kramer, E. J. (Eds.):
Materials Science and Technology, VCH Verlagsgesellschaft GmbH, Weinheim, 1997,
296-344
40. Ozawa, T.: Kinetics of Non-isothermal Crystallization, Polymer, 12 (1971) 150-158
41. Velikov; V. H.: Time-dependent Properties of Semicrystalline Poly(arylene ether ketone)
(PEEK) above and below the Glass Transition, PhD Thesis, Virginia Polytechnic Institute
and State University, U.S.A., 1996
42. Supaphol, P., Spruiell, J. E.: Non-isothermal Bulk Crystallization of High-Density
Polyethylene via a Modified Depolarized Light Microscopy Technique: Further Analysis,
Journal of Applied Polymer Science, 86 (2002) 1009-1022
43. Hoffman, J. D., Davies, G. T., Lauritzen, J. I.: The Rate of Crystallization of Linear
Polymers with Chain Folding, In: Hannay, N. B. (Ed.): Treatise on Solid State Chemistry,
Plenum Press, New York, Volume 3, 1976, 497-614
References
113
44. Hikosaka, M.: Unified Theory of Nucleation of Folded-chain Crystals and Extended-
chain Crystals of Linear-chain Polymers, Polymer, 28 (1987) 1257-1264
45. Hikosaka, M.: Unified Theory of Nucleation of Folded-chain Crystals (FCCs) and
Extended-chain Crystals (ECCs) of Linear-chain Polymers: 2. Origin of FCC and ECC,
Polymer, 31 (1990) 458-468
46. Gogolewski, S., Pennings, A. J.: Crystallization of Copolyamides under Elevated
Pressure, Polymer, 22 (1981) 792-798
47. Gogolewski, S., Pennings, A. J.: Crystallization of Polyamides under Elevated Pressure:
3. The Morphology and Structure of Pressure-crystallized Nylon-6 (polycapramide),
Polymer, 18 (1977) 647-653
48. Gogolewski, S., Pennings, A. J.: Crystallization of Polyamides under Elevated Pressure:
4. Annealing of Nylon-6 (polycapramide) under Pressure, Polymer, 18 (1977) 654-659
49. Liangbin, L., Shiming, H., Rui, H.: Effect of Pressure on the Crystallization Behavior of
Polyethylene terephthalate, Journal of Physics: Condensed Matter, 14 (2002) 11195-
11198
50. Zuidema, H.: Flow Induced Crystallization of Polymers - Application to Injection
Moulding, PhD Thesis, Technische Universiteit Eindhoven, The Netherlands, 2000
51. Lee, O., Kamal, M. R.: Experimental Study of Post-shear Crystallization of
Polypropylene Melts, Polymer Engineering and Science, 39 (1999) 236-248
52. Gupta, R. K., Auyeung, K. F.: Crystallization Kinetics of Oriented Polymers, Polymer
Engineering and Science, 29 (1989) 1147-1156
53. Suzuki, A., Kohno, T.: Improvement in Mechanical Properties of Poly(p-phenylene
sulfide) Fibers by High-Tension Multiannealing Method, Journal of Applied Polymer
Science, 75 (1999) 1569-1576
54. Nagatake, W., Takahashi, T., Masubuchi, Y., Takimoto, J. I., Koyama, K.: Development
of Shear Flow Thermal Rheometer for Direct Measurement of Crystallization Fraction of
Polymer Melts under Shear Deformation, Polymer, 41 (2000) 523-531
References 114
55. Sakellarides, S. L., McHugh, A. J.: Oriented Structure Formation during Polymer Film
Extrusion, Polymer Engineering and Science, 25 (1985) 1179-1187
56. Huo, H., Meng, Y., Li, H., Jiang, S., An, L.: Influence of Shear on Polypropylene
Crystallization Kinetics, The European Physical Journal E - Soft Matter, 15 (2004) 167-
175
57. Keller, A., Kolnaar, J. W. H.: Flow-induced Orientation and Structure Formation. In
Meijer, H. E. H. (Ed), Processing of Polymers, chapter 4, volume 18, Cahn, R. W.,
Haasen, P., Kramer, E. J. (Eds.): Materials Science and Technology, VCH
Verlagsgesellschaft GmbH, Weinheim,, 1997, 189–268
58. Lagasse, R. R., Maxwell, B.: An Experimental Study of the Kinetics of Polymer
Crystallization during Shear Flow, Polymer Engineering and Science, 16 (1976) 189-199
59. Blundell, D. J., Mahendrasingam, A., Martin, C., Fuller, W., MacKerron, D. H., Harvie,
J. L., Oldman, R. J., Riekel, C.: Orientation Prior to Crystallisation during Drawing of
Poly(ethylene terephthalate), Polymer , 41 (2000) 7793-7802
60. Orreindy, S.; Rincón G. A.; Physical Aging of Bisphenol A Polycarbonate, Journal of
Applied Polymer Science, 74 (1999) 1646-1648
61. Bradshaw, R. D., Brinson, L. C.: Physical Aging in Polymers and Polymer Composites:
An Analysis and Method for Time-aging Time Superposition, Polymer Engineering and
Science, 37 (1997) 31-44
62. Hutchinson, J. M.: Physical Aging of Polymers, Progress in Polymer Science, 20 (1995)
703-760
63. Hodge, I.M.: Enthalpy Relaxation and Recovery in Amorphous Materials, Journal of
Non-Crystalline Solids, 169 (1994) 211-266
64. Phillips, J. C.: Stretched Exponential Relaxation in Molecular and Electronic Glasses,
Reports on Progress in Physics, 59 (1996) 1133-1207
65. Cowie, J. M. G., Ferguson, R.: The Ageing of Poly(vinyl methyl ether) as Determined
from Enthalpy Relaxation Measurements, Polymer Communications, 27 (1986) 258-260
References
115
66. Beckmann, J., McKenna, G. B., Landes, B. G., Bank, D. H., Bubeck, R. A.: Physical
Aging Kinetics of Syndiotactic Polystyrene as Determined From Creep Behavior,
Polymer Engineering and Science, 37 (1997) 1459-1468
67. Hodge, I. M., Berens, A. R.: Effects of Annealing and Prior History on Enthalpy
Relaxation in Glassy Polymers. 2. Mathematical Modeling, Macromolecules, 15 (1982)
762-770
68. Struik, L. C. E.: Physical Aging in Plastics and other Glassy Materials, Polymer
Engineering and Science, 17 (1977) 165-173
69. Lagasse, R. R., Curro, J. G.: Predicting the Shift in Viscoelastic Response Caused by
Physical Aging of Glassy Polymers, Macromolecules, 15 (1982) 1559-1561
70. Michele, A., Vittoria, V.: Transport Properties of Dichloromethane in Glassy Polymers: 5.
Poly(aryl ether ether ketone), Polymer , 34 (1993) 1898-1903
71. Ogale, A. A., McCullough, R.L.: Physical Aging Characteristics of Polyether Ether
Ketone, Composite Science and Technology, 30 (1987) 137-148
72. Tant, M. R., Wilkes, G. L.: Physical Aging Studies of Semicrstalline Poly(ethylene
terepthalate), Journal of Applied Polymer Science, 26 (1981) 2813-2825
73. Soloukhin, V. A., Brokken-Zijp, J. C. M., van Asselen, O. L. J., de With, G.: Physical
Aging of Polycarbonate: Elastic Modulus, Hardness, Creep, Endothermic Peak, Molecular
Weight Distribution, and Infrared Data, Macromolecules, 36 (2003) 7585-7597
74. Lee, A., McKenna, G. B.: Effect of Crosslink Density on Physical Ageing of Epoxy
Networks, Polymer, 29 (1988) 1812-1817
75. Zhao, J., Wang, J., Li, C., Fan, Q.: Study of the Amorphous Phase in Semicrystalline
Poly(ethylene terephthalate) via Physical Aging, Macromolecules, 35 (2002) 3097-3103
76. Moynihan, C. T., Macedo, P. B., Montrose, C. J., Gupta, P. K., deBolt, M. A., Dill, J. F.,
Drake, P. W., Esteal, A. J., Elterman, P. B., Moeller, R. P., Sasabe, J., Wilder, J. A.:
Thermodynamic and Transport Properties of Liquids near the Glass Transition
Temperature. Structural Relaxation in Vitreous Materials, Annals of New York Academy
of Sciences, 279 (1976) 15-35
References 116
77. Spinu, I., McKenna, G. B.: Physical Aging of Thin Films of Nylon and PET, Plastic Film
and Sheeting, 13 (1994) 311-326
78. Struik, L. C. E.: The Mechanical Behavior and Physical Ageing of Semicrystalline
Polymers: 1, Polymer, 28 (1987) 1521-1533
79. Struik, L. C. E.: The Mechanical Behavior and Physical Ageing of Semicrystalline
Polymers: 2, Polymer, 28 (1987) 1534-1542
80. Struik, L. C. E.: The Mechanical Behavior and Physical Ageing of Semicrystalline
Polymers: 3. Prediction of long term creep from short time tests, Polymer, 30 (1989) 799-
814
81. Struik, L. C. E.: The Mechanical Behavior and Physical Ageing of Semicrystalline
Polymers: 4, Polymer, 30 (1989) 815-830
82. Guadagno, L., Fontanella, C., Vittoria, V., Longo, P.: Physical Aging of Syndiotactic
Polypropylene, Journal of Polymer Science Part B: Polymer Physics, 37 (1999) 173-180
83. Hodge, I. M.: Effects of Annealing and Prior History on Enthalpy Relaxation in Glassy
Polymers. 6. Adam-Gibbs Formulation of Nonlinearity, Macromolecules, 20 (1987) 2897-
2908
84. Cangialosi, D., Wübbenhorst, M., Groenewold, J., Mendes, E., Schut, H., Veen, A.van,
Picken, S. J.: Physical Aging of Polycarbonate far below the Glass Transition
Temperature: Evidence for the Diffusion Mechanism, Physical Review B, 70 (2004)
224213-224224
85. Cangialosi, D., Schut, H., van Veen, A., Picken, S. J.: Positron Annihilation Lifetime
Spectroscopy for Measuring Free Volume during Physical Aging of Polycarbonate,
Macromolecules, 36 (2003) 142-147
86. Osswald, T. A., Menges, G.: Materials Science of Polymers for Engineers, Hanser,
Munich, 1996
87. Shan, C. L. P., Baker ,W. E., Cunningham, M. F., Baird, M. C.: Conversion Studies in a
Novel Reaction Injection Molding Process for Syndiotactic Polystyrene, Journal of
Applied Polymer Science, 70 (1998) 2679-2693
References
117
88. Moneke, M.: Die Kristallisation von verstärkten Thermoplasten während der schnellen
Abkühlung und unter Druck, Ph.D Thesis, Technische Universität Darmstadt, Germany,
2001
89. Engelsing, K., Mennig, G.: Influence of the Injection Molding Process on the Free
Volume and Its Effect on the Creep Behavior of Styrene-Acronitrile Copolymer,
Mechanics of Time-Dependent Materials, 5 (2001) 27-38
90. Hsiung, C. M., Cakmak, M.: Effect of Injection-Molding Conitions on the Crystallinity,
Orientation Gradients, and Mechanical Properties of Poly(aryl ether ketone). II. Large
Dumbbell Parts, Journal of Applied Polymer Science, 47 (1993) 149-165
91. Guo, J., Narh, K. A.: On the Prediction of Crystallinity Distribution in Injection Molded
Semi-Crystalline Thermoplastics, Journal of Reinforced Plastics and Composites, 21
(2002) 497-506
92. Gezovich, D. M., Geil, P. H.: Deformation and Aging of Quenched Polypropylene,
Polymer Engineering and Science, 8 (1968) 210-215
93. Kapur, S., Rogers, C. E.: Aging of Quenched Polypropylene, Journal of Polymer Science
A-2, 10 (1972) 2107-2124
94. Bair, H. E., Bebbington, G. H., Kell, P. G.: The Effect of Annealing below the Glass
Temperature on the Physical Properties of Semicrystalline Poly(butylene terepthalate),
Journal of Polymer Science Part B: Polymer Physics, 14 (1976) 2113-2117
95. Shibaya, M., Ishihara, H., Yamashita, K., Yoshihara, N., Nonomura, C.: Effect of Mold
Temperature on Structure and Property of PBT Injection Moldings in the Thickness
Direction, International Polymer Processing, XIX (2004) 303-307
96. Hsiung, C. M., Cakmak, M.: Effect of Injection-Molding Conitions on the Crystallinity,
Orientation Gradients, and Mechanical Properties of Poly(aryl ether ketone) (PAEK)
Parts. I. Characterization by Microbeam X-ray Diffraction Technique, Journal of Applied
Polymer Science, 47 (1993) 125-147

References 118
97. Dlubek, G., Saarinen, K., Fretwell, H. M.: The Temperature Dependence of the Local
Free Volume in Polyethylene and Polytetrafluoroethylene: A Positron Lifetime Study,
Journal of Polymer Science Part B: Polymer Physics, 36 (1998) 1513-1528
98. Yampolskii, Y. P., Korikov, A. P., Shantarovich, V. P., Nagai, K., Freeman, B. D.,
Masuda, T., Teraguchi, M., Kwak, G.: Gas Permeability and Free Volume of Highly
Branched Substituted Acetylene Polymers, Macromolecules, 34 (2001) 1788-1796
99. Li, Y., Zhang, R., Chen, H., Zhang, J., Suzuki, R., Ohdaira, T., Feldstein, M. M., Jean, Y.
C.: Depth Profile of Free Volume in a Mixture and Copolymers of Poly(N-vinyl-
pyrrolidone) and Poly(ethylene glycol) Studied by Positron Annihilation Spectroscopy,
Biomacromolecules, 4 (2003) 1856-1864
100. Dong, H., Jacob, K. I.: Effect of Molecular Orientation on Polymer Free Volume
Distribution: An Atomistic Approach, Macromolecules, 36 (2003) 8881-8885
101. Shantarovich, V. P., Suzuki, T., He, C., Davankov, V. A., Pastukhov, A. V., Tsyurupa,
M. P., Kondo, K., Ito, Y.: Positron Annihilation Study of Hyper-Cross-Linked
Polystyrene Networks, Macromolecules, 35 (2002) 9723-9729
102. Hofmann, D., Heuchel, M., Yampolskii, Y., Khotimskii, V., Shantarovich, V.: Free
Volume Distributions in Ultrahigh and Lower Free Volume Polymers: Comparison
between Molecular Modeling and Positron Lifetime Studies, Macromolecules, 35 (2002)
2129-2140
103. Cerrada, M. L., Perez, E., Perena, J. M., Benavente, R., Misheva, M., Grigorov, T.:
Positron Annihilation in Metallocene Ethylene/1-Hexene Copolymers Related to Their
Structure and Mechanical Properties, Macromolecules, 38 (2005) 8430-8439
104. Dlubek, G., Stolp, M., Nagel, Ch., Fretwell, H. M., Alam, M. A., Radusch, H-J.: Effect of
Crystallization and Water uptake on the Free-volume Size in Polyamides 6 and 66,
Journal of Physics: Condensed Matter, 10 (1998) 10443-10450
105. News Briefs: Industrial Collaboration Results in Award, Journal of Research of the
National Institute of Standards and Technology, 101 (1996) 614-615
References
119
106. Curro, J. G., Lagasse, R. R., Simha, R.: Diffusion Model for Volume Recovery in
Glasses, Macromolecules, 15 (1982) 1621-1626
107. Gupta, V.B., Drzal, L. T., Rich, M. J.: The Physical Basis of Moisture Transport in a
Cured Epoxy Resin System, Journal of Applied Polymer Science, 30 (1985) 4467-4493
108. Kong, E. S. W., Adamson, M. J.: Physical Aging and the Effect on Moisture Sorption of
Amine-Cured Epoxies, Polymer Communications, 24 (1983) 171-173
109. Kong, E. S. W., Adamson, M. J., Mueller, L.: Moisture Diffusion and Solid-State NMR
Investigations on the Physical Aging Process in Network Epoxy Glasses, Composites
Technology Review, 6 (1984) 170-173
110. Suzuki, T., Oki, Y., Numajiri, M., Miura, T., Kondo, K., Shiomi, Y., Ito, Y.: Free-
Volume Characteristics and Water Absorption of Novolac Epoxy Resins Investigated by
Positron Annihilation, Polymer, 37 (1996) 3025-3030
111. Banik, K., Mennig, G.: Process-induced Long-term Deformation Behavior of
Semicrystalline PBT, Polymer Engineering and Science (in print)
112. Takeshima, M., Funakoshi, N.: Molecular Orientation Distribution in Injection-molded
Polycarbonate Discs, Journal of Applied Polymer Science, 32 (1985) 3457-3468
113. Schrauwen, B. A. G.: Deformation and Failure of Semi-crystalline Polymer Systems:
Influence of Micro and Molecular Structure, Ph.D Thesis, Technische Universitaet
Eindhoven, The Netherlands (2003)
114. Nguyen-Chung, T., Mennig, G.: Mechanismen der Molekülorientierungen in
spritzgegossenen Kunststoff-Bauteilen, Proceedings of Technomer 2005, 19. Fachtagung
über Verarbeitung und Anwendung der Polymeren, Technische Universität Chemnitz,
2005, 155
115. Hill, A. J., Zipper, M. D., Tant, M. R., Stack, G. M., Jordan, T. C., Shultz, A. R.: A Free
Volume Approach to the Mechanical Behavior of Miscible Polycarbonate Blends,
Journal of Physics: Condensed Matter 8 (1996) 3811-3827

References 120
116. Banik, K., Mennig, G.: Influence of the Injection Molding Process on the Creep Behavior
of Semicrystalline PBT during Aging below its Glass Transition Temperature, Mechanics
of Time-Dependent Materials (in print)
117. Spinu, I., McKenna, G. B.: Physical Aging of Nylon 66, Polymer Engineering and
Science, 34 (1994) 1808-1814
118. Echeverria, I., Su, P., Simon, S.L., Plazek, D. J.: Physical Aging of Polyetherimide:
Creep and DSC Measurements, Journal of Polymer Science Part B: Polymer Physics, 33
(1995) 2457-2468
119. Aref-Azar, A., Biddlestone, F., Hay, J. N., Haward, R. N.: The Effect of Physical Ageing
on the Properties of Poly(ethylene terepthalate), Polymer, 24 (1983) 1245-1251
120. Mukherjee, S., Jabarin, S. A.: Aging Characteristics of Oriented Poly(ethylene
terepthalate), Polymer Engineering and Science, 35 (1995) 1145-1154

Curriculum Vitae
Name: Kaushik Banik
Date of birth: 7 May 1974
Place of birth: Hooghly, India
Marital status: Married
Nationality: Indian
Education 01.81 - 05.91: Secondary Education at Sri Aurobindo Vidya
Mandir, West Bengal, India
07.91 - 07.93: Higher Secondary Education at Telinipara
Bhadreswar High School, West Bengal, India
08.94 - 09.97: Bachelor of Science (Chemistry) at the University of
Calcutta, India
07.98 - 05.00: Master of Science (Chemistry) at Banaras Hindu
University, Varanasi, India
07.00 – 02.02: Master of Technology in Materials Science and
Engineering (specialization in Polymer Engineering)
at Indian Institute of Technology Kharagpur, India
Doctoral Studies Since 10.02: Scientific coworker at the Institute of Mechanical
and Plastics Engineering under Chemnitz University
of Technology, Germany
Kaushik Banik
Chemnitz, January 2006