Embed Size (px)
Citation preview
International Journal of Lean Thinking Volume 2, Issue 1 (June 2011)
Lean Thinkingjournal homepage: www.thinkinglean.com/ijlt
Process Cycle Efficiency Improvement Through Lean: A Case Study
D. Rajenthirakumar* Department of Mechanical Engineering, PSG College of Technology, Coimbatore, 641 004, India E-mail Adres: [email protected]
P.V. Mohanram Department of Mechanical Engineering, PSG College of Technology, Coimbatore, 641 004, India
S.G. Harikarthik Department of Mechanical Engineering, PSG College of Technology, Coimbatore, 641 004, India
A B S T R A C T K E Y W O R D S
A R T I C L E I N F O
Lean Manufacturing, Value stream mapping, Cycle time, Takt time, Cycle efficiency.
Received 23 February 2011 Received in revised form 11 March 2011 Accepted 13 March 2011 Available online 23 March 2011
Lean manufacturing is an applied methodology of
scientific, objective techniques that cause work tasks in a
process to be performed with a minimum of non-value
adding activities resulting in greatly reduced wait time,
queue time, move time, administrative time, and other
delays. This work addresses the implementation of lean
principles in a construction equipment company. The
prime objective is to evolve and test several strategies to
eliminate waste on the shop floor. This paper describes an
application of value stream mapping (VSM).
Consequently, the present and future states of value
stream maps are constructed to improve the production
process by identifying waste and its sources. A noticeable
reduction in cycle time and increase in cycle efficiency is
confirmed. The production flow was optimized thus
minimizing several non-value added activities/times such
as bottlenecking time, waiting time, material handling
time, etc. This case study can be useful in developing a
more generic approach to design lean environment.
________________________________ * Corresponding Author
1. Introduction
Lean manufacturing is based on the Toyota Production System developed by Toyota which
focuses on eliminating waste, reducing inventory, improving throughput, and encouraging
employees to bring attention to problems and suggest improvements to fix them (Womack et al.
1991). Lean manufacturing has increasingly been applied by leading manufacturing companies
throughout the world. A core concept of lean manufacturing is pull production in which the flow
on the factory floor is driven by demand from downstream pulling production upstream. Some of
the changes required by lean manufacturing can be disruptive if not implemented correctly and
some aspects of it are not appropriate for all companies (Hobbs, 2004). A lean manufacturing
facility is capable of producing product in only the sum of its value added work content time.
Features of a typical lean manufacturing model include: one unit at a time production, non-value
added time eliminated, production in the work content time only, and relocation of required
resources to the point of usage.
In the present day of manufacturing, assembly line can be formed easily for any industry
whether it is a small-scale or a large-scale industry. When the takt times are calculated for every part
manufactured in the industry through different part movements, then the problem of locating
machines on the shop floor occurs when it is a job type production unit; this problem is the main
reason for reconfiguration of machines and layout design for every demand. To eliminate these
problems, a proper method is required to achieve a rhythm in manufacturing lean assembly line by
identifying value adding, non-value adding, and necessary non-value adding activities through an
optimum feasible takt time.
This paper presents a case study of a large-scale construction equipment manufacturing
industry facing the problems as discussed above. This work addresses the implementation of lean
manufacturing on the construction equipment assembly, with a focus on the activities of paint shop
which should have a proper rhythm of assembly line, minimizing wastages like bottleneck time,
waiting time, material handling time, etc. The prime objective is to develop different strategies to
eliminate waste. The lean tool value stream mapping (VSM) applied as a method to lead the
activities.
D. RAJENTHIRAKUMAR, P. V. MOHANRAM,S. G. HARIKARTHIK /International Journal of Lean Thinking Volume 2, Issue 1 (June 2011)
47
2. Literature Review
Currently, assembly lines are still fundamental to get the smoothing of production system
(Miltenburg, 2001), and they are studied under several operative perspectives seeking its flexibility
(El-Maraghy, 2005; Calvo et al. 2007). Both concepts are subjects of pull systems. In assembly lines,
pull and lean systems are concepts frequently connected, although they pursue different objectives;
pull system toward the reduction of work-in-process (WIP) and lean system toward minimizing the
buffer variability (Hopp and Spearman, 2004). Moreover, with respect to the election of production
control system in a pull system, the alternatives considered are focused on kanban (Monden, 1998)
and constant work in process (CONWIP) (Spearman et al. 1990), both of them focused toward the
reduction of WIP.
Although many tools exist, from its origin, VSM has demonstrated its efficacy (Womack and
Jones 1996; Sullivan et al. 2002; Abdulmalek and Rajgopal 2007; Serrano et al. 2008; Sahoo et al.
2008). Following the benchmarking perspective, as well the use of a contrasted tool, facilitates the
interchange of improvements. It is a tool that provides communication solutions for practitioners to
obtain maximum efficiency and definitions of theoretical development points to become a reference
among redesign techniques (Serrano et al. 2008). A detailed description of VSM can be seen in
Rother and Shook (1999). Thus, as improvement tool simplifies the measurement of times without
added value, so the calculation of indexes of lean metrics is easier and it is possible to enhance the
operative actions with strategic results.
This paper unifies several gaps and it shows how value stream transformation actions can
achieve high levels of performance in a short time and in a real industry, inside a context of an
assembly line with a small space and that it requires flexibility.
3. Problem Definition
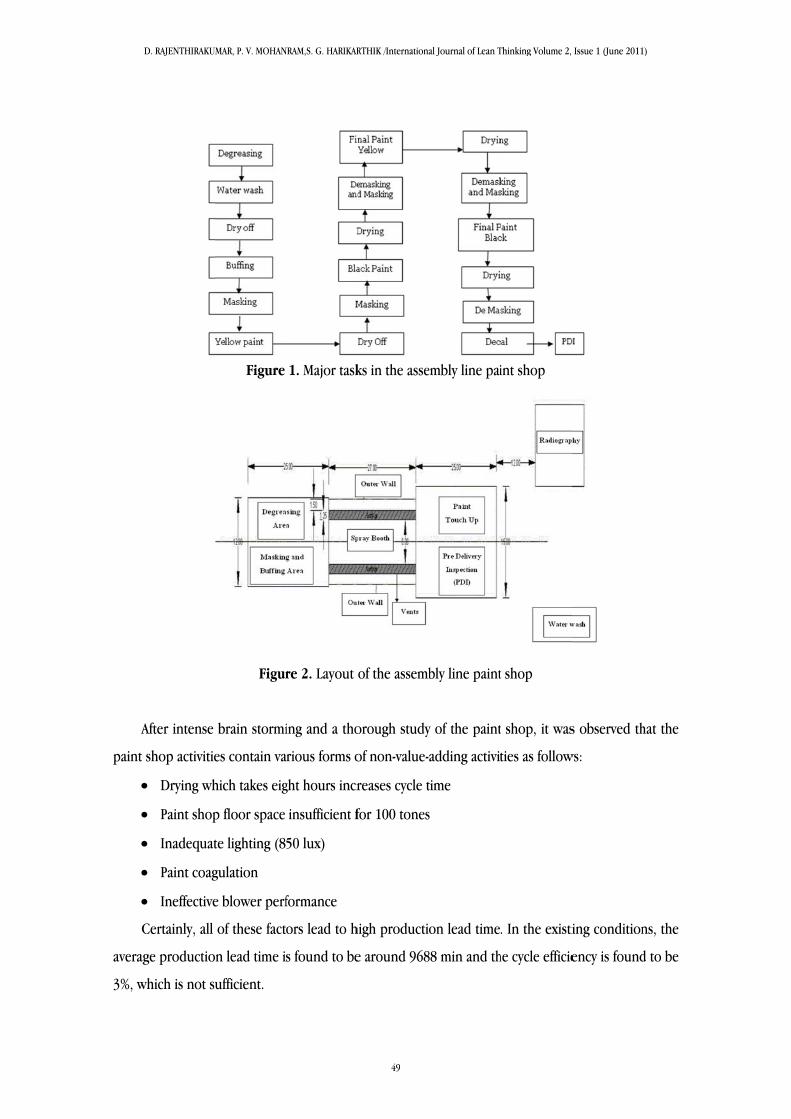
This work deals with the end to end perspective of reducing waste at an assembly line paint
shop of a construction equipment manufacturing company. The major tasks involved in the paint
shop are sketched in Figure 1 and the layout is given in Figure 2.
D. RAJENTHIRAKUMAR, P. V. MOHANRAM,S. G. HARIKARTHIK /International Journal of Lean Thinking Volume 2, Issue 1 (June 2011)
48
A
paint
C
averag
3%, w
After intense
shop activitie
Drying wh
Paint shop
Inadequat
Paint coag
Ineffective
Certainly, all
ge productio
which is not s
Figure
Figur
brain stormi
es contain va
hich takes eig
p floor space
te lighting (8
gulation
e blower perf
of these fact
on lead time i
ufficient.
1. Major task
re 2. Layout
ing and a tho
arious forms o
ght hours incr
insufficient f
50 lux)
formance
ors lead to h
s found to be
ks in the asse
of the assemb
orough study
of non-value-
reases cycle t
for 100 tones
high producti
e around 968
embly line pai
bly line paint
y of the paint
adding activit
time
s
on lead time
88 min and th
int shop
t shop
t shop, it was
ties as follow
. In the existi
he cycle efficie
s observed th
ws:
ing condition
ency is found
hat the
ns, the
d to be
D. RAJENTHIRAKUMAR, P. V. MOHANRAM,S. G. HARIKARTHIK /International Journal of Lean Thinking Volume 2, Issue 1 (June 2011)
49
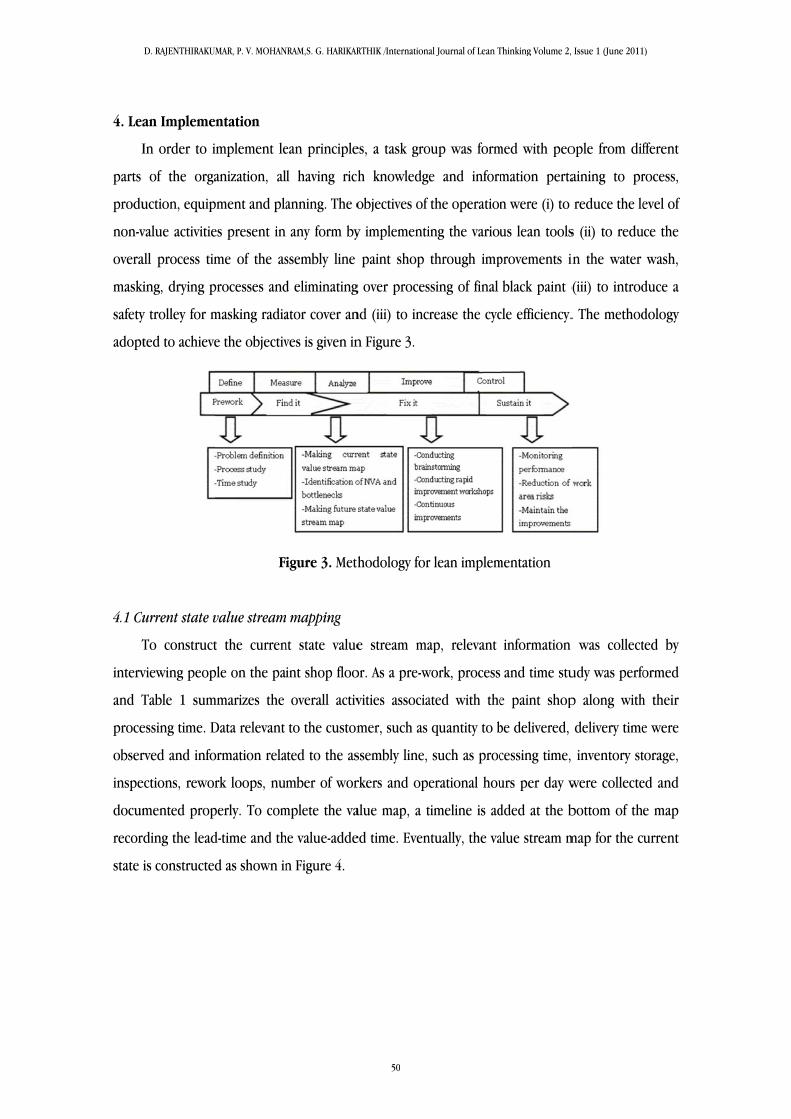
4. Lea
I
parts
produ
non-v
overa
maski
safety
adopt
4.1 Cu
T
interv
and T
proce
obser
inspe
docum
recor
state
an Impleme
In order to i
of the orga
uction, equip
value activitie
all process tim
ing, drying p
y trolley for m
ted to achieve
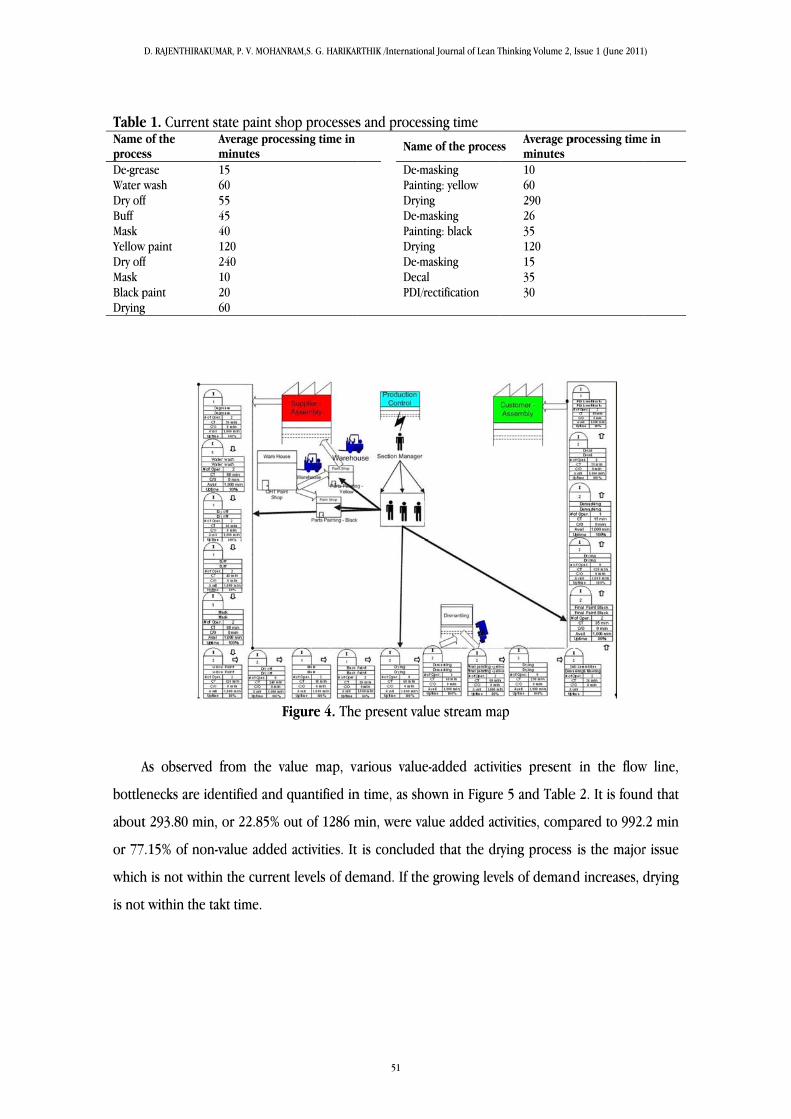
urrent state v
To construct
viewing peop
Table 1 sum
essing time. D
rved and info
ections, rewo
mented prop
rding the lead
is constructe
entation
implement le
anization, al
pment and pla
es present in
me of the as
processes and
masking radia
e the objectiv
Fi
value stream
t the curren
ple on the pa
mmarizes the
Data relevant
ormation rela
rk loops, nu
perly. To com
d-time and th
d as shown in
ean principle
l having rich
anning. The o
any form by
ssembly line
d eliminating
ator cover an
ves is given in
igure 3. Meth
m mapping
nt state value
int shop floo
overall activ
to the custom
ated to the as
mber of wor
mplete the va
he value-adde
n Figure 4.
es, a task gro
h knowledge
objectives of
y implementi
paint shop
g over proces
nd (iii) to inc
n Figure 3.
hodology for
e stream ma
or. As a pre-w
vities associa
mer, such as
ssembly line,
rkers and ope
alue map, a t
ed time. Even
oup was form
e and inform
the operation
ing the variou
through imp
ssing of final
rease the cyc
r lean implem
ap, relevant
work, process
ated with the
quantity to b
such as proc
erational hou
timeline is ad
ntually, the va
med with peo
mation perta
n were (i) to
us lean tools
provements i
black paint (
cle efficiency.
mentation
information
and time stu
e paint shop
be delivered,
cessing time,
urs per day w
dded at the b
alue stream m
ople from dif
aining to pr
reduce the le
s (ii) to redu
in the water
(iii) to introd
. The method
was collect
udy was perfo
p along with
delivery time
inventory st
were collecte
bottom of the
map for the cu
fferent
rocess,
evel of
ce the
wash,
duce a
dology
ted by
ormed
h their
e were
torage,
ed and
e map
urrent
D. RAJENTHIRAKUMAR, P. V. MOHANRAM,S. G. HARIKARTHIK /International Journal of Lean Thinking Volume 2, Issue 1 (June 2011)
50
TableName procesDe-greWater Dry offBuff Mask YellowDry offMask Black pDrying
A
bottle
about
or 77
which
is not
e 1. Current s of the ss ease wash ff
w paint ff paint g
As observed
enecks are id
t 293.80 min
7.15% of non
h is not withi
t within the ta
state paint shAverage proceminutes 15 60 55 45 40 120 240 10 20 60
F
from the va
entified and
, or 22.85% o
-value added
in the curren
akt time.
hop processesessing time in
Figure 4. The
alue map, va
quantified in
out of 1286 m
d activities. It
t levels of de
s and process
Name
De-mPaintiDryinDe-mPaintiDryinDe-mDecalPDI/re
e present valu
arious value-
n time, as sho
min, were val
is concluded
emand. If the
sing time
e of the proces
asking ing: yellow
ng asking ing: black
ng asking l ectification
ue stream ma
-added activi
own in Figure
lue added ac
d that the dr
growing leve
ss Average pminutes 10 60 290 26 35 120 15 35 30
ap
ities present
e 5 and Table
tivities, comp
rying process
els of deman
processing time
t in the flow
e 2. It is foun
pared to 992.
s is the major
nd increases, d
e in
w line,
nd that
.2 min
r issue
drying
D. RAJENTHIRAKUMAR, P. V. MOHANRAM,S. G. HARIKARTHIK /International Journal of Lean Thinking Volume 2, Issue 1 (June 2011)
51
TableName De-greWater Dry offBuff Mask YellowDry offMask Black pDryingDe-maPaintinDryingDe-maPaintinDryingDe-maDecal PDI/re
4.2 Ta
T
calcul
to be
exclu
one u
e 2. Current s of the process
ease wash ff
w paint ff paint g asking ng: yellow g asking ng: black g asking ctification
act time
Tact time can
late tact time
e 3.2 units of
ding break ti
unit of produ
F
state VA/NVA s %VA
60% 60% 0% 60% 30% 70% 0% 30% 70% 0% 60% 70% 0% 30% 70% 0% 50% 60% 0%
n be defined
e in the conte
f component
ime. This resu
ct must come
Figure 5. The
time analysisVA time (min9.00 36.00 0.00 27.00 12.00 84.00 0.00 3.00 14.00 0.00 6.00 42.00 0.00 7.80 24.50 0.00 7.50 21.00 0.00
as the time r
ext of present
ts under stud
ults in a tact
e out during
e present stat
s n) NVA time
6.00 24.00 55.00 18.00 28.00 36.00 240.00 7.00 6.00 60.00 4.00 18.00 290.00 18.20 10.50 120.00 7.50 14.00 30.00
required prod
t problem, th
dy. The comp
time of nearl
every 312.5 m
te VA/NVA tim
e (min) Ave15 60 55 45 40 12024010 20 60 10 60 29026 35 12015 35 30
ducing one u
he average de
pany runs fo
ly 312.5 min.
min interval.
me
erage processin 0 0 0 0
unit of daily s
emand per tw
or two shifts,
. Therefore, i
ing time in min
salable quanti
wo shifts was
500 min pe
it is conclude
nutes
ity. To
found
er shift
ed that
D. RAJENTHIRAKUMAR, P. V. MOHANRAM,S. G. HARIKARTHIK /International Journal of Lean Thinking Volume 2, Issue 1 (June 2011)
52
4.3 Total cycle time and cycle efficiency
Reducing the lead time in any production system is a continuous improvement process. While
addressing the problem, the production lead time for the existing conditions was first calculated.
The various components associated with lead time are identified separately and different practical
strategies are adopted for improvement. In general, the various components associated with the
lead time of any production process are (i) Waiting time before process (ii) Setup time (iii) Process
time (iv) Waiting time after process (v) Transfer time. Considering all the elements involved, a total
cycle time of 9687.50 minutes was calculated.
Also, the total cycle efficiency involved in the process is found to be approximately 3.2%. In
order to reduce the total cycle time and increase the cycle efficiency, various strategies such as
problem identification, data documentation, motion and time study, improvements made,
operation sheet review, and continuous monitoring are adopted.
Initiatives taken to increase the cycle efficiency are:
Standard work sheet is prepared
Warm water is utilized to facilitate quicker drying process
Permanent mask using rubber material designed to facilitate better functioning
Stringent monitoring is done and improvement opportunities are addressed in time
Wherever possible, inefficient operations are eliminated; for example, oven drying process is
developed
To handle higher capacity, construction equipment layout modification was done
To improve operator safety, safety trolley was designed for masking process
4.4 Reducing time for masking process
To Reduce the masking time, permanent mask using rubber material was designed which in
turn reduces the cost of masking. The improvements are shown in Figure 6.
D. RAJENTHIRAKUMAR, P. V. MOHANRAM,S. G. HARIKARTHIK /International Journal of Lean Thinking Volume 2, Issue 1 (June 2011)
53
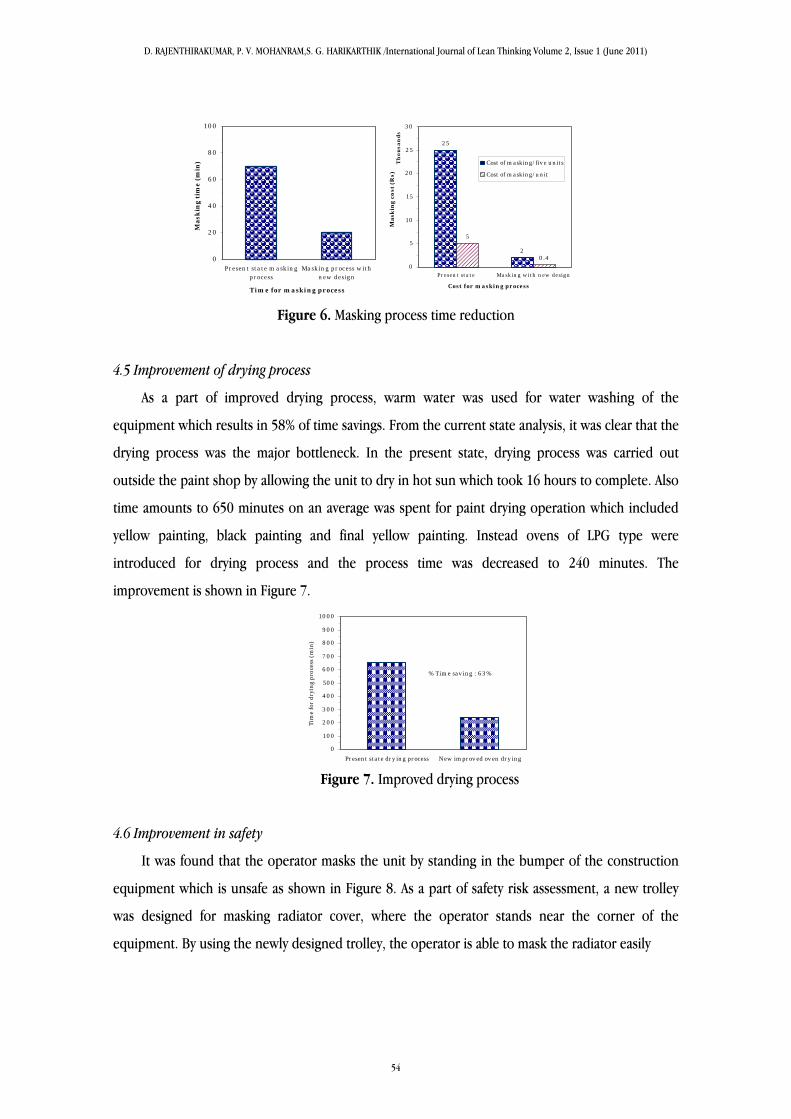
Figure 6. Masking process time reduction
4.5 Improvement of drying process
As a part of improved drying process, warm water was used for water washing of the
equipment which results in 58% of time savings. From the current state analysis, it was clear that the
drying process was the major bottleneck. In the present state, drying process was carried out
outside the paint shop by allowing the unit to dry in hot sun which took 16 hours to complete. Also
time amounts to 650 minutes on an average was spent for paint drying operation which included
yellow painting, black painting and final yellow painting. Instead ovens of LPG type were
introduced for drying process and the process time was decreased to 240 minutes. The
improvement is shown in Figure 7.
Figure 7. Improved drying process
4.6 Improvement in safety
It was found that the operator masks the unit by standing in the bumper of the construction
equipment which is unsafe as shown in Figure 8. As a part of safety risk assessment, a new trolley
was designed for masking radiator cover, where the operator stands near the corner of the
equipment. By using the newly designed trolley, the operator is able to mask the radiator easily
0
20
40
60
80
1 00
Pr esen t sta te m a skin gpr ocess
Ma skin g pr ocess w ithn ew desig n
Time for masking process
Ma
skin
g t
ime
(m
in)
25
2
5
0.40
5
1 0
1 5
20
25
30
Pr esen t sta te Ma skin g w ith n ew design
Th
ou
san
ds
Cost for masking process
Ma
skin
g c
ost
(R
s)
Cost of masking/fiv e units
Cost of masking/unit
% Time sav ing : 63%
0
1 00
200
3 00
400
500
600
7 00
800
900
1 000
Present state dry ing process New improv ed ov en dry ing
Tim
e fo
r d
ryin
g p
roce
ss (
min
)
D. RAJENTHIRAKUMAR, P. V. MOHANRAM,S. G. HARIKARTHIK /International Journal of Lean Thinking Volume 2, Issue 1 (June 2011)
54
w
the la
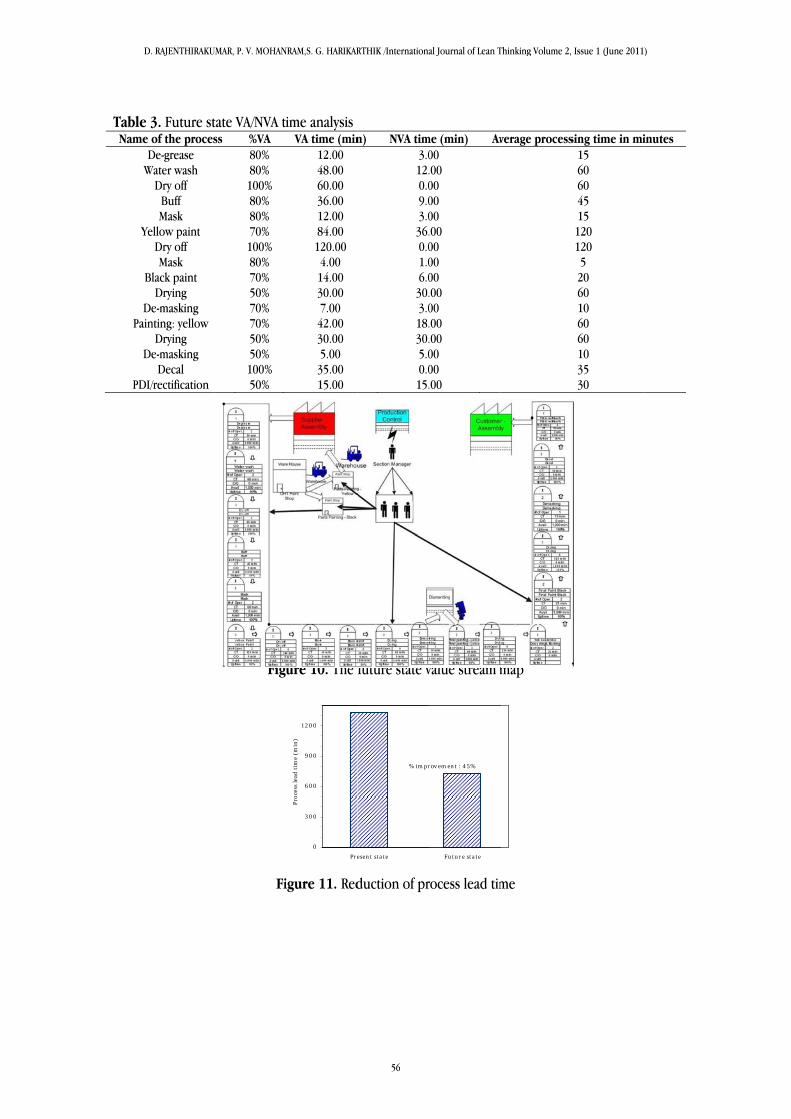
4.7 Fu
F
a con
also o
Table
or 76
added
value-
imple
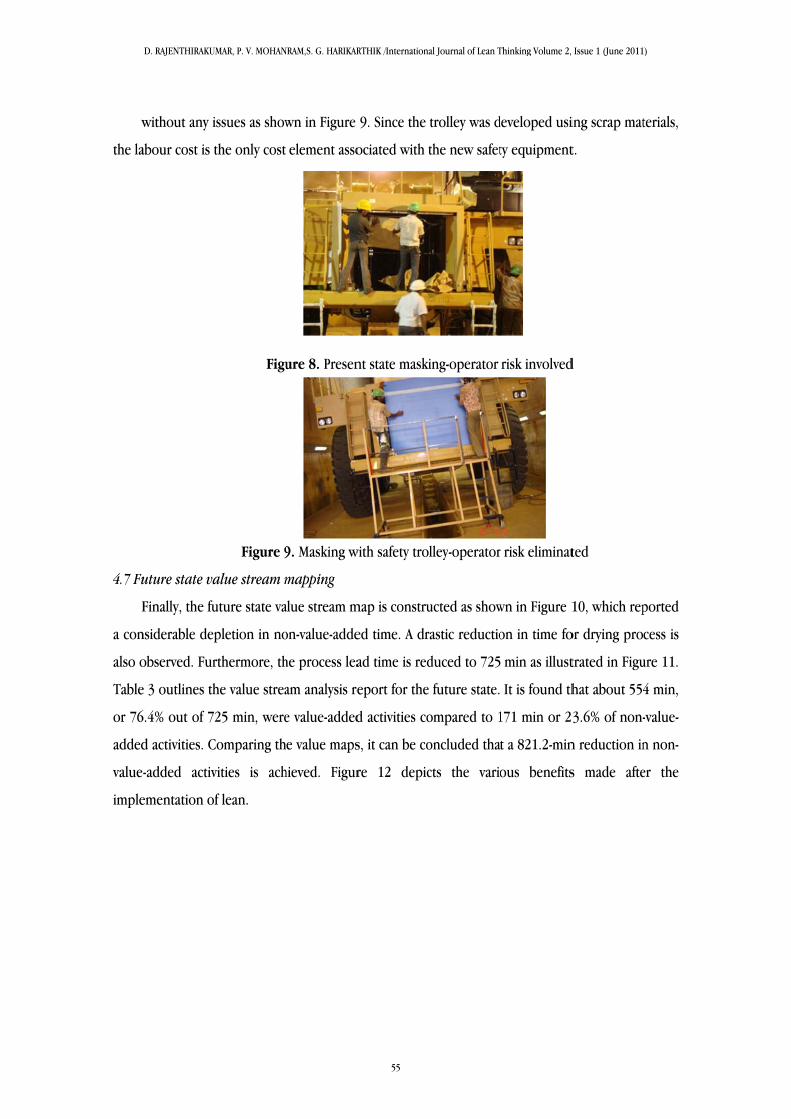
without any i
abour cost is t
uture state va
Finally, the fu
nsiderable dep
observed. Fur
e 3 outlines th
6.4% out of 7
d activities. C
-added activ
ementation o
issues as show
the only cost
Figu
Figure 9
alue stream m
uture state va
pletion in no
rthermore, th
he value strea
25 min, were
Comparing th
vities is ach
f lean.
wn in Figure
element asso
ure 8. Presen
9. Masking w
mapping
alue stream m
on-value-adde
he process lea
am analysis re
e value-added
e value maps
hieved. Figur
9. Since the
ociated with t
nt state maski
with safety tro
map is constru
ed time. A dr
ad time is red
eport for the
d activities co
s, it can be co
re 12 depic
trolley was d
the new safet
ing-operator
lley-operator
ucted as show
rastic reductio
duced to 725
future state.
ompared to 1
oncluded tha
cts the vario
developed usi
ty equipment
risk involved
r risk eliminat
wn in Figure 1
on in time fo
min as illust
It is found th
171 min or 2
t a 821.2-min
ous benefits
ing scrap mat
t.
d
ted
10, which rep
or drying pro
trated in Figu
hat about 554
3.6% of non-
n reduction in
s made afte
terials,
ported
cess is
ure 11.
4 min,
-value-
n non-
er the
D. RAJENTHIRAKUMAR, P. V. MOHANRAM,S. G. HARIKARTHIK /International Journal of Lean Thinking Volume 2, Issue 1 (June 2011)
55
TableName
Y
Pa
PD
e 3. Future ste of the procesDe-grease
Water wash Dry off
Buff Mask
Yellow paint Dry off Mask
Black paint Drying
De-masking ainting: yellow
Drying De-masking
Decal DI/rectification
tate VA/NVA tss %VA
80% 80% 100% 80% 80% 70% 100% 80% 70% 50% 70%
70% 50% 50% 100%
50%
Fig
Fi
ime analysis VA time (min
12.00 48.00 60.00 36.00 12.00 84.00
120.00 4.00 14.00 30.00 7.00 42.00 30.00 5.00 35.00 15.00
ure 10. The f
igure 11. Red
0
3 00
600
900
1 200
Pre
Pro
cess
lead
tim
e (m
in)
n) NVA tim
3.012.0.09.03.036.0.01.06.030.3.018.30.5.00.015.
future state v
duction of pr
% impr
esent state
me (min) Av00 .00 00 00 00 .00 00 00 00 .00 00 .00 .00 00 00 .00
value stream m
rocess lead tim
rov em ent : 45%
Future state
verage process
map
me
sing time in mi15 60 60 45 15 120 120 5 20 60 10 60 60 10 35 30
inutes
D. RAJENTHIRAKUMAR, P. V. MOHANRAM,S. G. HARIKARTHIK /International Journal of Lean Thinking Volume 2, Issue 1 (June 2011)
56

Figure 12. Improvement after lean approach
5. Conclusion
This present work provides a case study of the improvement of a construction equipment
company non value added activities by means of lean tools. It focuses the revamp of operations by
eliminating non value-added time and improving cycle efficiency through VSM. It can be concluded
that VSM is an effective tool for identifying the processing wastes.
References
Abdulmalek F.A. and Rajgopal J. Analyzing the benefits of lean manufacturing and value stream
mapping via simulation: a process sector case study, Int J Prod Econ, 2007, 107 (1): 223–
236.
Calvo R. Domingo R. and Sebastián M.A. Operational flexibility quantification in a make-to-order
assembly system. Int Journal of Flex Manuf Syst, 2007, 19 (3): 247–263.
El-Maraghy H.A. Flexible and reconfigurable manufacturing systems paradigms. Int J Flex Manuf
Syst, 2005, 17 (4): 261–276.
Hobbs D.P. Lean manufacturing implementation: a complete execution manual for any size
manufacturer. J. Ross Publishing, Boca Raton, 2004.
Hopp W.J. and Spearman M.L. To pull or not to pull: what is the question?, Manuf Serv Oper
Manag, 2004, 6 (2): 133–148.
Miltenburg J. One-piece flow manufacturing on U-shaped production lines: a tutorial, IIE Trans,
2001, 33 (4): 303–321.
Monden Y. Toyota production system: an integrated approach to just-in-time, 3rd edn. Engineering
and Management Press, Norcross, GA, 1998.
Rother M. and Shook J. Learning to see: value stream mapping to add value and eliminate MUDA,
The Lean Enterprise Institute, Brookline, MA, 1999.
29.03 29.03
88.56
153.13
0
20
40
60
80
1 00
1 20
1 40
1 60
1 80
200
% WIP reduction % Total cy cle timereduction
% im prov em ent inv alue added tim e
Cy cle efficiencyim prov ement (%)
D. RAJENTHIRAKUMAR, P. V. MOHANRAM,S. G. HARIKARTHIK /International Journal of Lean Thinking Volume 2, Issue 1 (June 2011)
57
Sahoo A.K. Singh N.K. Shankar R. and Tiwari M.K. Lean philosophy: implementation in a forging
company, Int J Adv Manuf Technol, 2008, 36 (5–6): 451–462.
Serrano I., Ochoa C., and de Castro R. Evaluation of value stream mapping in manufacturing system
redesign, Int J Prod Res, 2008, 46 (16): 4409–4430.
Spearman M.L. Woodruff D.L. and Hopp W.J. CONWIP: a pull alternative to kanban, Int J Prod Res,
1990, 28 (5): 879–894.
Sullivan W.G. McDonald T.N. and Van Aken E.M. Equipment emplacement decisions and lean
manufacturing, Robot Comput- Integr Manuf, 2002, 18 (3): 255–265.
Womack J.P., Jones D.T. and Roos D. The machine that changed the world. HarperCollins
Publishers, New York, 1991.
Womack J.P. and Jones D.T. Lean thinking: banish waste and create wealth in your corporation.
Simon & Schuster, New York, 1996.
D. RAJENTHIRAKUMAR, P. V. MOHANRAM,S. G. HARIKARTHIK /International Journal of Lean Thinking Volume 2, Issue 1 (June 2011)
58