Embed Size (px)
Citation preview
Proceedings of the International Conference on Industrial Engineering and Operations Management
Toronto, Canada, October 23-25, 2019
© IEOM Society International
Design of New Plant Layout Using Lean Tools by
Eliminating Wastes in Material Flow Process
Sriram Srinivasan
Department of Industrial Engineering
University of Windsor
Windsor, ON- N9B3P4, Canada
Harita Zikre Department of Mechanical Engineering
University of Windsor
Windsor, ON- N9B3P4, Canada
Abstract The Service Mold company examined in this study is leading aerospace parts manufacturing industry located in
Windsor, Ontario. The company demanded a new plant layout for the better material movement to improve the actual
productivity by eradicating all the wastes in the process with the help of lean tools. In this paper, the authors analyzed
old layout which was in random shape and identified non-value added material movements. Authors prepared a new
layout based on the present scenario from random layout to U shape layout by utilizing cellular manufacturing to
minimize the travel distance of both employees and material. Tools like 5W1H, Value Stream Mapping (VSM), Cause
and Effect Diagram and 5Why are used to find the root cause of the current obstacles. And Kaizen tool was used with
Pareto chart to identify the primary reason for the problem. The future layout is expected to have better productivity
in the company.
Keywords Manufacturing industry, Productivity and Layout design
1. IntroductionThe authors made Gemba walk in one of the aerospace manufacturing companies named Service Mold + Aerospace
for Improvement, which is located in Windsor, ON. The company mainly works on pull based system whose supplier
and customer is Sonaka, Montreal. The manufacturing units consist of automatic and manual cutting, two 5-Axes
Computer Numerical Control (CNC) machines as well as manual and laser inspection process.
This paper is focused on eliminating waste by removing excess movement of man and materials. The major objective
here is to improve the quality rate and implement a continuous production between processes using Lean methodology
and its associated tools.
2. Literature review2.1 Lean manufacturing
Industry’s main motive is giving a product/service with the full satisfaction to clients by reducing the wastes, improve
the productivity, to train the people and create a quality-oriented mindset. Lean Manufacturing tools and techniques
are widely used in the most of the companies and exported all over the world. So, final execution means of high-
quality products is carried out by the senior management team in order to sustain in competitive world. [1]
In modern era, manufacturing process is due to two main factors. One of the main factors is a high competition with
an economic growth while Second is the old manufacturing style are not meeting the society criteria in terms of
requirements and service execution. Many firms are reconstructing to lean manufacturing processes with some goals
in hand. In order to maintain the sustainability in society, manufacturers are producing good quality products with low
654
Proceedings of the International Conference on Industrial Engineering and Operations Management
Toronto, Canada, October 23-25, 2019
© IEOM Society International
capital cost and ultimate numbers of employee. Albeit, combination of quality, cost and time gives better result but
sometimes skill employees are playing vital role for success path.
Lean manufacturing is all about removing waste from process by means of transportation, inventory, motion,
weighting, over processes, over production and defects. Eliminating waste is reducing non-value-added activities
which are not valued by customers in financial way. In continuation to receive this information, firstly, the company
has to specify the value-added activities’ information to the customer. The company should analyze the project details
and should give detailed overview about value added and non-value-added activities to the customer. Secondly,
industries must find the way to reduce nonvalue added activities. In present scenario, lean tools such as Supplier Input
Process Output Customer (SIPOC) and value stream mapping (VSM) are generally utilized to identify the further
process steps. Lastly, companies must eradicate all the non-value-added steps and streamline every other step which
is going to add value to the product as well as to the end customer. To prevent financial crises, corporation must
examine the results that are being produced and start the evaluation process again.
2.2 Industrial Waste In any business, the greatest opposition of improvement and productivity is waste. In lean manufacturing, waste is
something which is not going to add value to the product or to the customer. At the end external customer is not willing
to pay for this activity. There are eight types of waste in lean manufacturing. Seven of the eight wastes are linked to
the production process, while the eighth waste is related to top management’s ability to use their personnel. [2]
2.2.1 Transportation:
Usually moving material costs money and excessive unwanted moves result in waste. That is why transportation is
subdivided as a manufacturing waste category. Because there is no value in moving material around the shop floor.
Moreover, greater amount of resources and time are consumed while no value is being sent to the customer.
2.2.2 Inventory:
It is the valuable product or material waiting in the shop-floor to be getting sold or being sent to the next process area.
Huge amount of cost would be associated to maintain this inventory which is going the affect the revenue/profit.
2.2.3 Motion: Moving the human body more than is necessary is also considered as waste. And excessive movement of people or
equipment that does not add value. Inefficient shop floor layout and improper equipment could contribute this waste.
2.2.4 Waiting:
When product/people waits, no value is being added but the cost associated with this continues to grow. Waiting
generally kills the material and information flow. It also generates excess inventory.
2.2.5 Over Processing: Doing more to the product than the customer requires. If the customer’s requirements are not clear, more work will
be put in place in the product, even though customer did not order this. Repairing and remanufacturing are examples
of this.
2.2.6 Over Production: Producing more than the customer needs is considered as the main form of waste. Japanese industrial engineer
described this as the root of all manufacturing evils. Because over production causes other types of waste.
2.2.7 Defects: One of the most easily recognizable wastes in lean manufacturing is the production of defects. Mistakes or producing
defective products mean repeat a process. Rework or fix things required that are not done right the first time.
2.2.8 Non-utilized talent: This waste occurs when top management fails to recognize the talent of the employees. If the management does not
engage with the employees and allow employees to do the changing process for the better, it is considered as waste.
655
Proceedings of the International Conference on Industrial Engineering and Operations Management
Toronto, Canada, October 23-25, 2019
© IEOM Society International
2.3 Value stream mapping The value stream mapping is a very important lean manufacturing tool which is used to collect and analyze data
visually which helps to describe the process flow of the industry. The VSM includes all activities from the customer
demand to transform a product from raw material into the finished product. The VSM is drawn for every process
involved in the material and information flow. Thus, by creating a process flow we can identify the value-added and
non-value-added activities involved in the process. The VSM consists of current and future state mapping. The current
state is used to describe how the process is being done and by identifying the problem. The further improvements are
mapped in the future state. The future state is created to show the implementation of the process by eliminating or
reducing non-value-added activities
2.4 Cellular manufacturing
It is a process of manufacturing which helps material to move as quickly as possible and to make a wide variety of
similar products requiring similar operations. Cellular manufacturing consists of a series of product-focused work-
cells-which house all operations to manufacture those products requiring similar operations. While a traditional
manufacturing environment is organized functionally with similar machines in one area (for example, all molding
machines in Molding Dept.), cellular manufacturing operates like a series of plants-within-a-plant, each starting with
raw materials and ending with finished product, with all operations being performed in the cell. Machines in
manufacturing cells are located within close proximity to minimize product transportation (a form of manufacturing
waste) and to maintain continuous flow with zero inventory between operations (inventory holding cost will be cut
down). The manufacturing cell is operated by a team of empowered, multi-skilled operators who have complete
responsibility for quality and delivery performance within the cell.
Cells reduce the distance a part or product has to move. This reduces material handling costs, allows quicker feedback
on potential quality problems, reduces work-in-process inventories, permits easer scheduling and reduces throughput
time. Cell teams better understand the whole process of making parts/assemblies. Cell members feel the responsibility
to a small group. [3]
Because a small change in the position of a machine in a factory affects the flow of materials. There are various types
of cell layout designs available. We have designed the optimum layout considering different objectives in mind. The
main goal is to increase the productivity and reduce the walking distance of workers and provide a smooth material
flow. [4]
3. Methodology
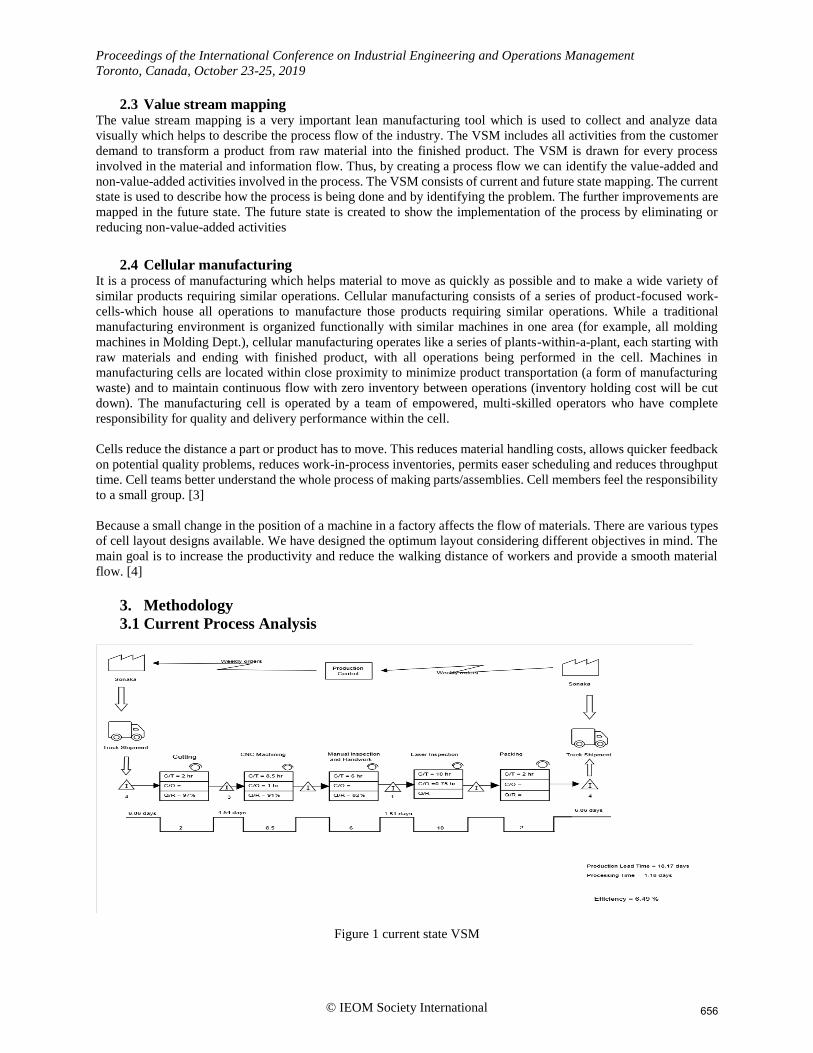
3.1 Current Process Analysis
Figure 1 current state VSM
656
Proceedings of the International Conference on Industrial Engineering and Operations Management
Toronto, Canada, October 23-25, 2019
© IEOM Society International
Value stream mapping is a tool to identify the information, material and time flow inside the organization. First, the
customer, Sonaka (At the top right corner) has ordered some parts to the production control. Based on that, raw
material order has been sent back to the supplier electronically and it is being shipped at the right time. There are five
processes in the current state where raw materials can be converted to finished goods. Cycle time and changeover time
of the individual processes have been mentioned in the data boxes available. At-last the finished goods have been sent
to the customer. Production lead time is 18.17 days and processing time is 1.18 days.
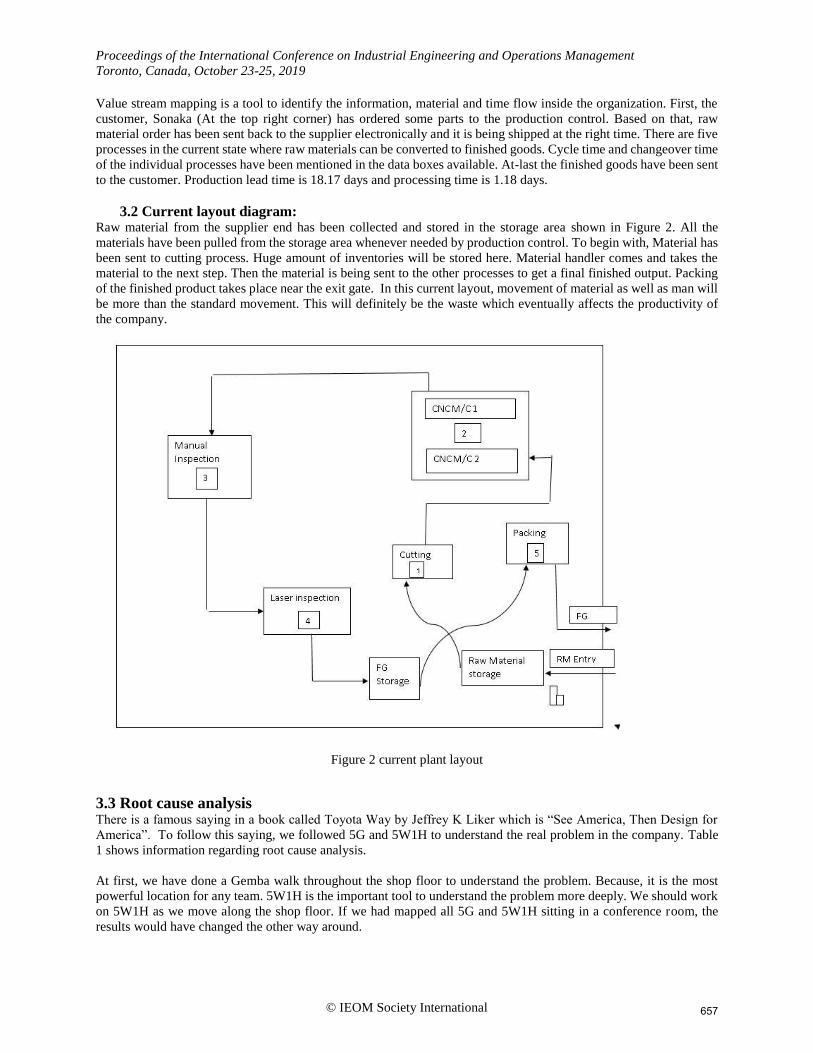
3.2 Current layout diagram: Raw material from the supplier end has been collected and stored in the storage area shown in Figure 2. All the
materials have been pulled from the storage area whenever needed by production control. To begin with, Material has
been sent to cutting process. Huge amount of inventories will be stored here. Material handler comes and takes the
material to the next step. Then the material is being sent to the other processes to get a final finished output. Packing
of the finished product takes place near the exit gate. In this current layout, movement of material as well as man will
be more than the standard movement. This will definitely be the waste which eventually affects the productivity of
the company.
Figure 2 current plant layout
3.3 Root cause analysis There is a famous saying in a book called Toyota Way by Jeffrey K Liker which is “See America, Then Design for
America”. To follow this saying, we followed 5G and 5W1H to understand the real problem in the company. Table
1 shows information regarding root cause analysis.
At first, we have done a Gemba walk throughout the shop floor to understand the problem. Because, it is the most
powerful location for any team. 5W1H is the important tool to understand the problem more deeply. We should work
on 5W1H as we move along the shop floor. If we had mapped all 5G and 5W1H sitting in a conference room, the
results would have changed the other way around.
657
Proceedings of the International Conference on Industrial Engineering and Operations Management
Toronto, Canada, October 23-25, 2019
© IEOM Society International
Table 1 5W1H diagram
What is the problem? Excessive movement of material and man
When is it occurring? All the time during production
Where is it occurring? CNC to Inspection; Packing to Dispatch
Who is doing it? Material Handler
Which pattern does it have? Twice in a day. (30 minutes/each)
How is it being done? Changing the layout
Understanding the problem is the first step in solving it. We identified the problem as we move along the shop floor
(Excessive Movement of Materials and Man). It is more qualified and structured approach to understand the problem
in each and every aspect (I.e. Who, When and Where). As we have noticed, every step in 5W1H strategy points to a
different question and the answer to each question is the trigger for the next one.
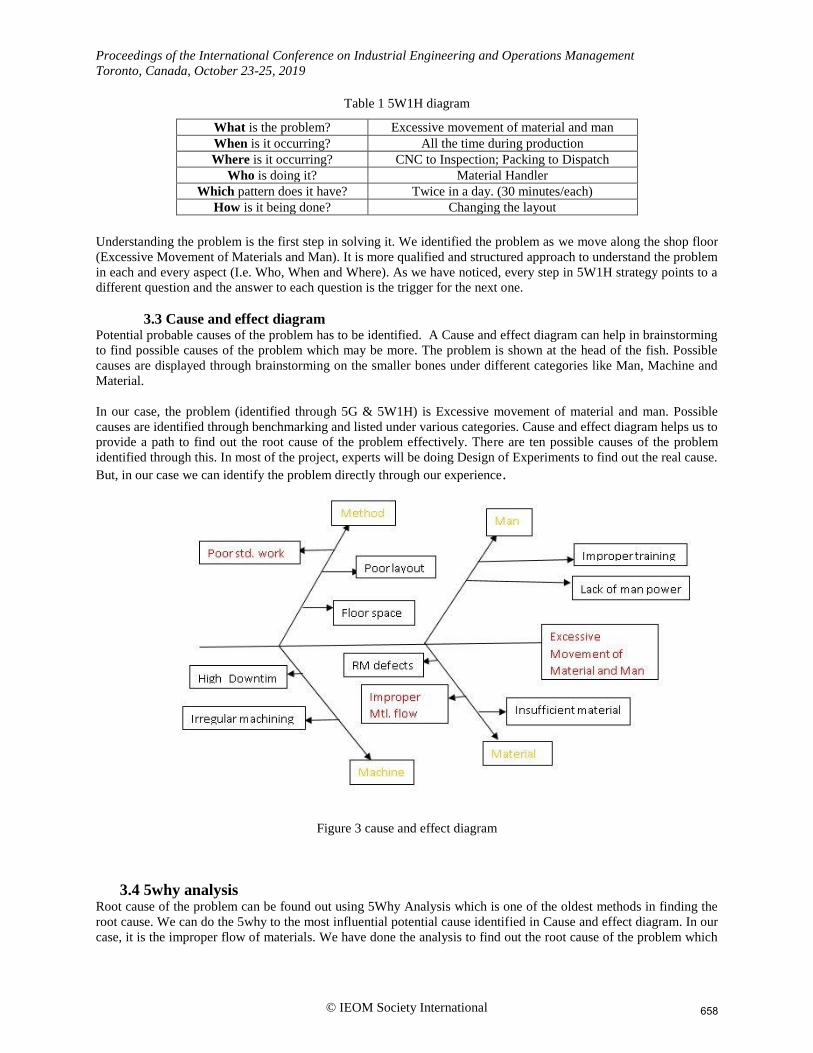
3.3 Cause and effect diagram Potential probable causes of the problem has to be identified. A Cause and effect diagram can help in brainstorming
to find possible causes of the problem which may be more. The problem is shown at the head of the fish. Possible
causes are displayed through brainstorming on the smaller bones under different categories like Man, Machine and
Material.
In our case, the problem (identified through 5G & 5W1H) is Excessive movement of material and man. Possible
causes are identified through benchmarking and listed under various categories. Cause and effect diagram helps us to
provide a path to find out the root cause of the problem effectively. There are ten possible causes of the problem
identified through this. In most of the project, experts will be doing Design of Experiments to find out the real cause.
But, in our case we can identify the problem directly through our experience.
Figure 3 cause and effect diagram
3.4 5why analysis Root cause of the problem can be found out using 5Why Analysis which is one of the oldest methods in finding the
root cause. We can do the 5why to the most influential potential cause identified in Cause and effect diagram. In our
case, it is the improper flow of materials. We have done the analysis to find out the root cause of the problem which
658
Proceedings of the International Conference on Industrial Engineering and Operations Management
Toronto, Canada, October 23-25, 2019
© IEOM Society International
is the poor layout. So, by repeatedly asking the question “Why”, we can peel away the symptoms which can lead to
the root cause of the problem. So here, excessive movement of material and worker within the shop floor is due to the
poor layout/arrangement of machines.
Figure 4 5why analysis
4. Result and discussion
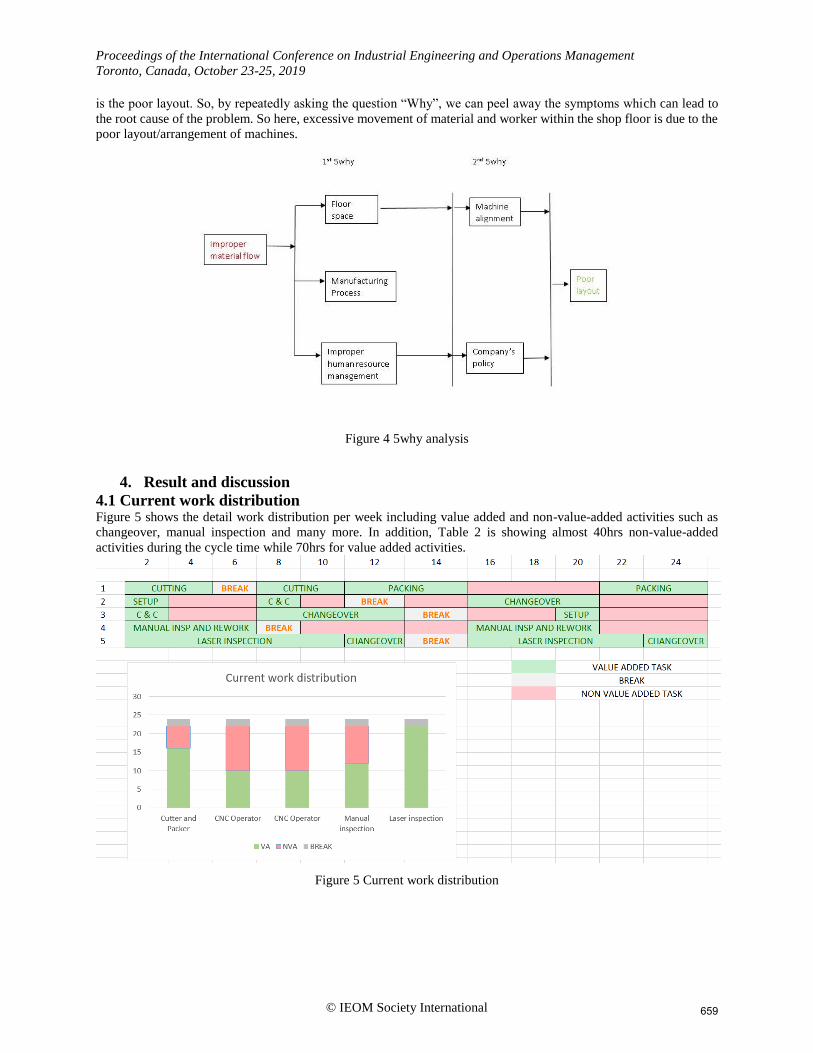
4.1 Current work distribution Figure 5 shows the detail work distribution per week including value added and non-value-added activities such as
changeover, manual inspection and many more. In addition, Table 2 is showing almost 40hrs non-value-added
activities during the cycle time while 70hrs for value added activities.
Figure 5 Current work distribution
659
Proceedings of the International Conference on Industrial Engineering and Operations Management
Toronto, Canada, October 23-25, 2019
© IEOM Society International
Table 2 current work distribution
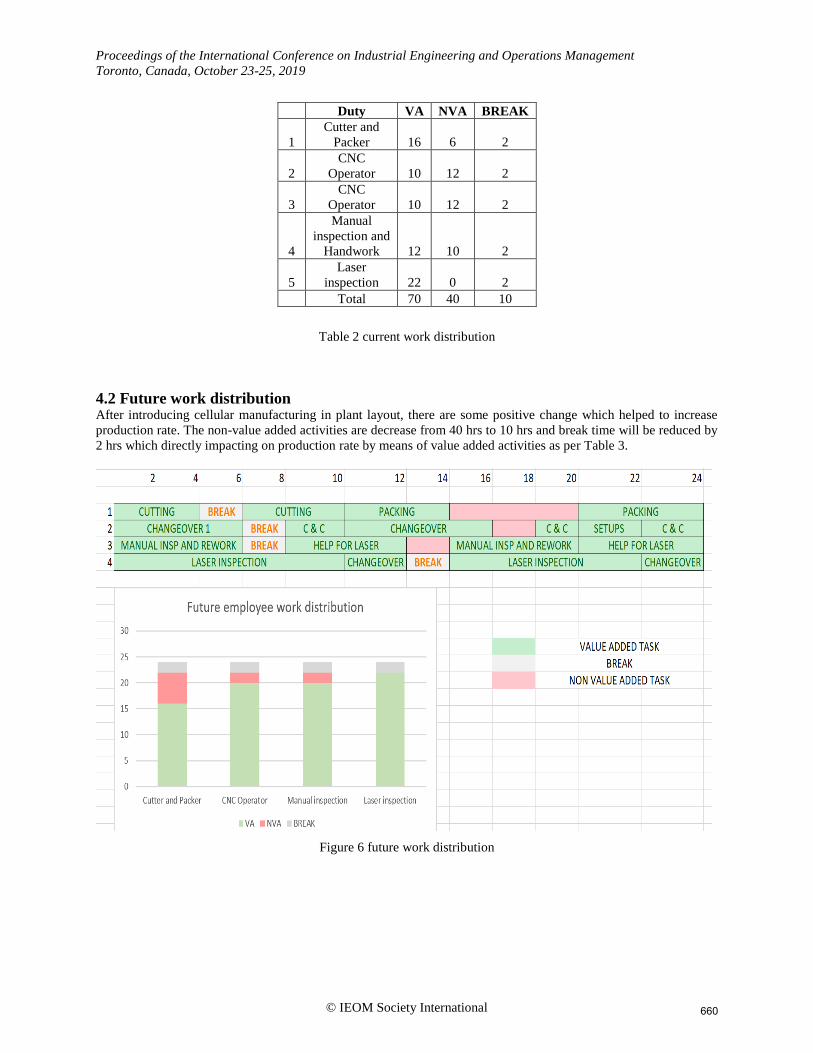
4.2 Future work distribution After introducing cellular manufacturing in plant layout, there are some positive change which helped to increase
production rate. The non-value added activities are decrease from 40 hrs to 10 hrs and break time will be reduced by
2 hrs which directly impacting on production rate by means of value added activities as per Table 3.
Figure 6 future work distribution
Duty VA NVA BREAK
1
Cutter and
Packer 16 6 2
2
CNC
Operator 10 12 2
3
CNC
Operator 10 12 2
4
Manual
inspection and
Handwork 12 10 2
5
Laser
inspection 22 0 2
Total 70 40 10
660
Proceedings of the International Conference on Industrial Engineering and Operations Management
Toronto, Canada, October 23-25, 2019
© IEOM Society International
Table 3 future work distribution
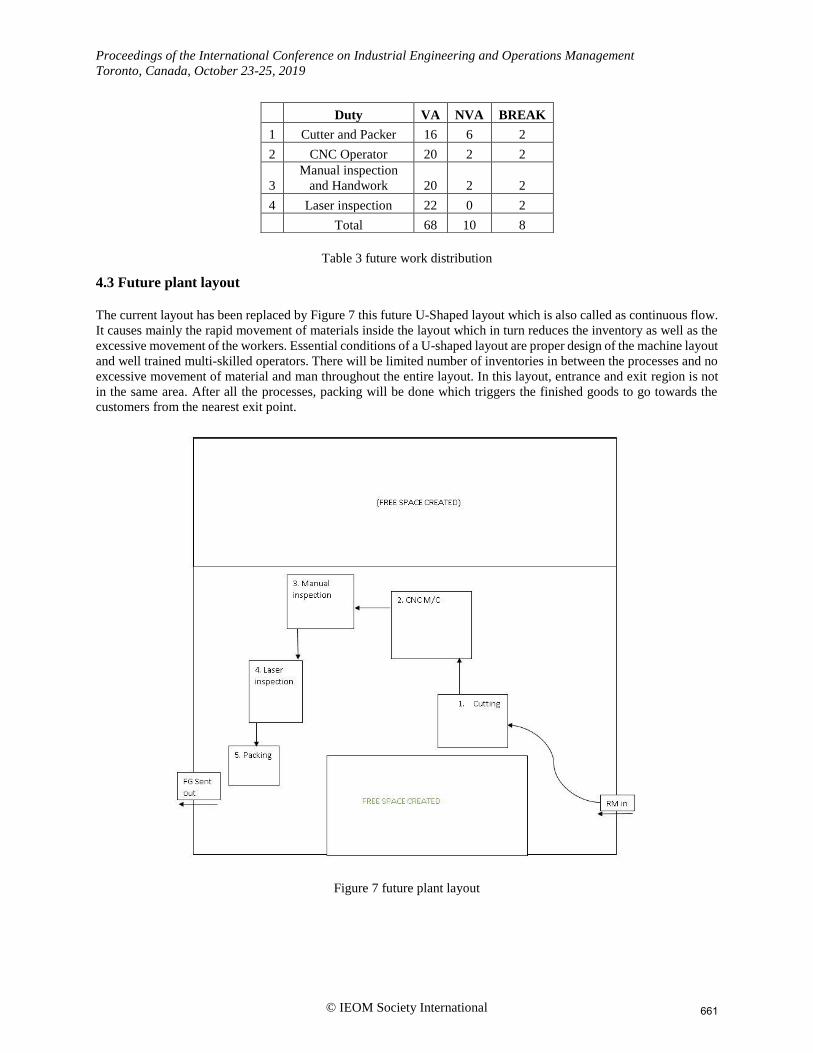
4.3 Future plant layout
The current layout has been replaced by Figure 7 this future U-Shaped layout which is also called as continuous flow.
It causes mainly the rapid movement of materials inside the layout which in turn reduces the inventory as well as the
excessive movement of the workers. Essential conditions of a U-shaped layout are proper design of the machine layout
and well trained multi-skilled operators. There will be limited number of inventories in between the processes and no
excessive movement of material and man throughout the entire layout. In this layout, entrance and exit region is not
in the same area. After all the processes, packing will be done which triggers the finished goods to go towards the
customers from the nearest exit point.
Figure 7 future plant layout
Duty VA NVA BREAK
1 Cutter and Packer 16 6 2
2 CNC Operator 20 2 2
3
Manual inspection
and Handwork 20 2 2
4 Laser inspection 22 0 2
Total 68 10 8
661
Proceedings of the International Conference on Industrial Engineering and Operations Management
Toronto, Canada, October 23-25, 2019
© IEOM Society International
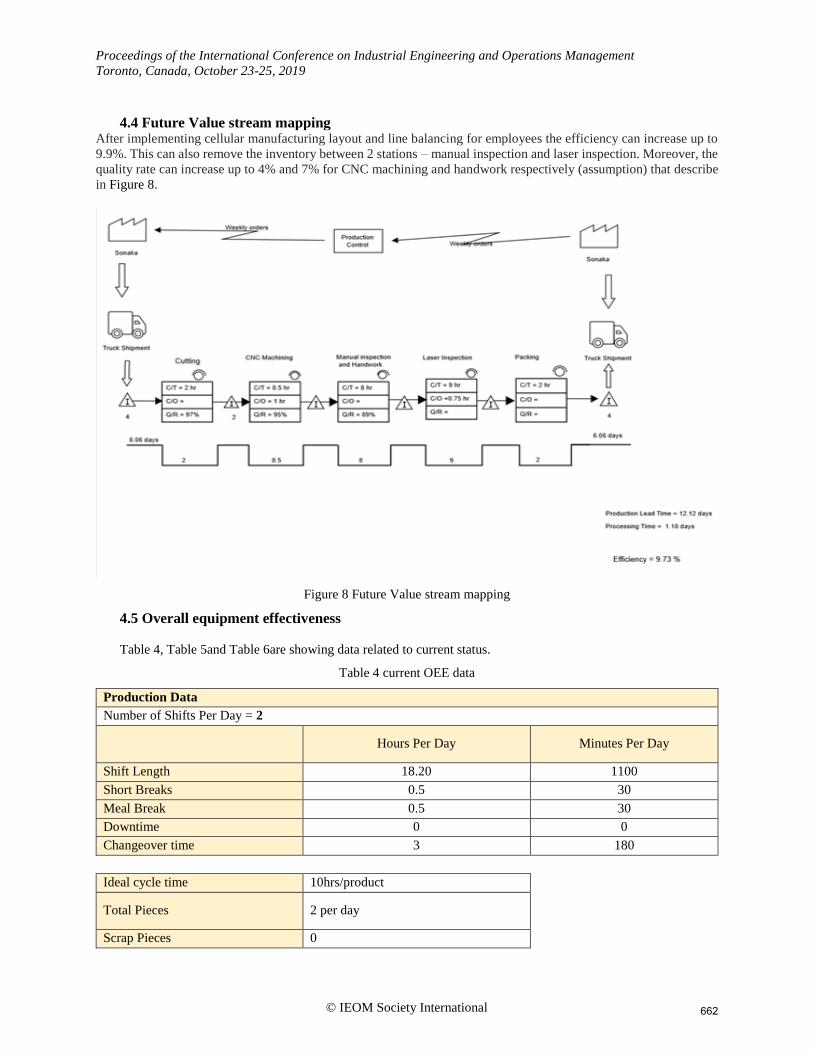
4.4 Future Value stream mapping
After implementing cellular manufacturing layout and line balancing for employees the efficiency can increase up to
9.9%. This can also remove the inventory between 2 stations – manual inspection and laser inspection. Moreover, the
quality rate can increase up to 4% and 7% for CNC machining and handwork respectively (assumption) that describe
in Figure 8.
Figure 8 Future Value stream mapping
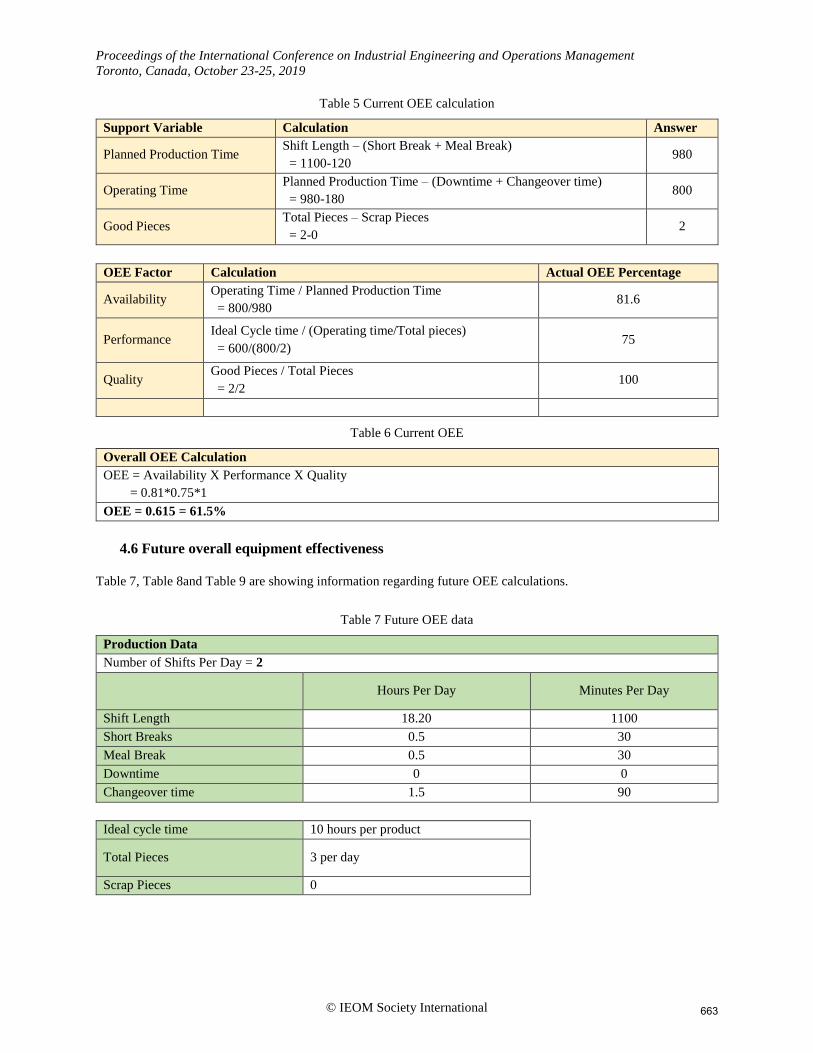
4.5 Overall equipment effectiveness
Table 4, Table 5and Table 6are showing data related to current status.
Table 4 current OEE data
Production Data
Number of Shifts Per Day = 2
Hours Per Day Minutes Per Day
Shift Length 18.20 1100
Short Breaks 0.5 30
Meal Break 0.5 30
Downtime 0 0
Changeover time 3 180
Ideal cycle time 10hrs/product
Total Pieces 2 per day
Scrap Pieces 0
662
Proceedings of the International Conference on Industrial Engineering and Operations Management
Toronto, Canada, October 23-25, 2019
© IEOM Society International
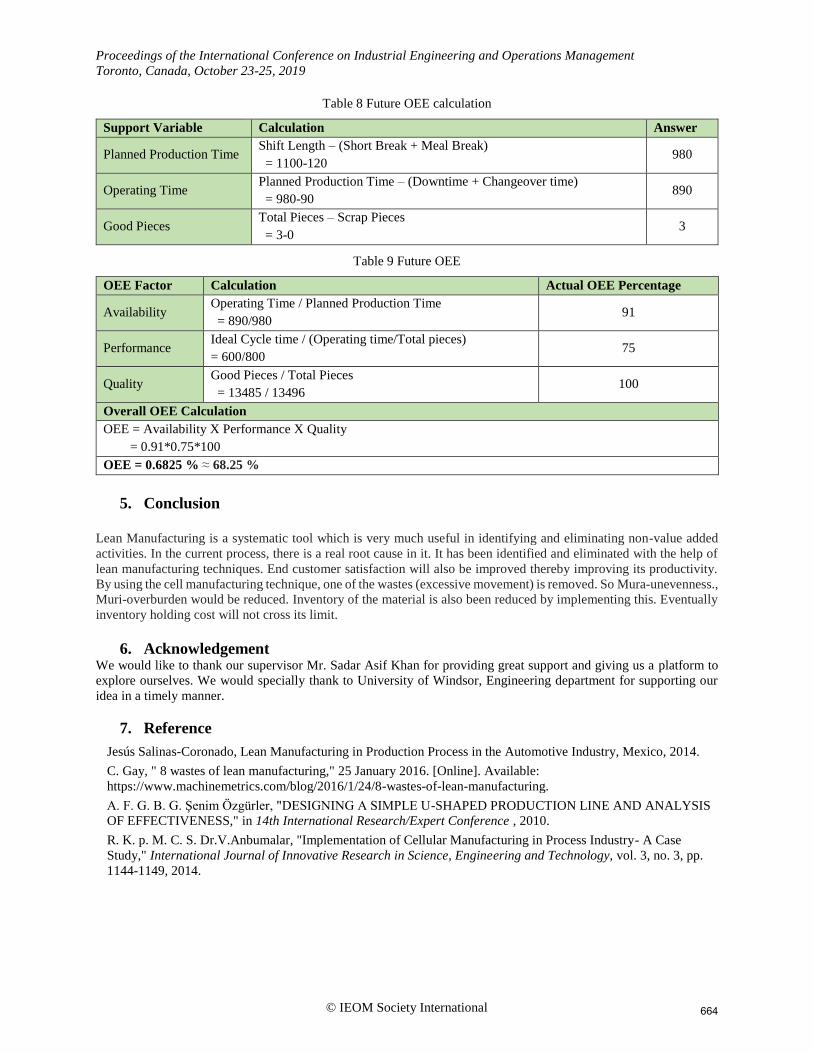
Table 5 Current OEE calculation
Support Variable Calculation Answer
Planned Production Time Shift Length – (Short Break + Meal Break)
= 1100-120 980
Operating Time Planned Production Time – (Downtime + Changeover time)
= 980-180 800
Good Pieces Total Pieces – Scrap Pieces
= 2-0 2
OEE Factor Calculation Actual OEE Percentage
Availability Operating Time / Planned Production Time
= 800/980 81.6
Performance Ideal Cycle time / (Operating time/Total pieces)
= 600/(800/2) 75
Quality Good Pieces / Total Pieces
= 2/2 100
Table 6 Current OEE
Overall OEE Calculation
OEE = Availability X Performance X Quality
= 0.81*0.75*1
OEE = 0.615 = 61.5%
4.6 Future overall equipment effectiveness
Table 7, Table 8and Table 9 are showing information regarding future OEE calculations.
Table 7 Future OEE data
Production Data
Number of Shifts Per Day = 2
Hours Per Day Minutes Per Day
Shift Length 18.20 1100
Short Breaks 0.5 30
Meal Break 0.5 30
Downtime 0 0
Changeover time 1.5 90
Ideal cycle time 10 hours per product
Total Pieces 3 per day
Scrap Pieces 0
663
Proceedings of the International Conference on Industrial Engineering and Operations Management
Toronto, Canada, October 23-25, 2019
© IEOM Society International
Table 8 Future OEE calculation
Support Variable Calculation Answer
Planned Production Time Shift Length – (Short Break + Meal Break)
= 1100-120 980
Operating Time Planned Production Time – (Downtime + Changeover time)
= 980-90 890
Good Pieces Total Pieces – Scrap Pieces
= 3-0 3
Table 9 Future OEE
OEE Factor Calculation Actual OEE Percentage
Availability Operating Time / Planned Production Time
= 890/980 91
Performance Ideal Cycle time / (Operating time/Total pieces)
= 600/800 75
Quality Good Pieces / Total Pieces
= 13485 / 13496 100
Overall OEE Calculation
OEE = Availability X Performance X Quality
= 0.91*0.75*100
OEE = 0.6825 % ≈ 68.25 %
5. Conclusion
Lean Manufacturing is a systematic tool which is very much useful in identifying and eliminating non-value added
activities. In the current process, there is a real root cause in it. It has been identified and eliminated with the help of
lean manufacturing techniques. End customer satisfaction will also be improved thereby improving its productivity.
By using the cell manufacturing technique, one of the wastes (excessive movement) is removed. So Mura-unevenness.,
Muri-overburden would be reduced. Inventory of the material is also been reduced by implementing this. Eventually
inventory holding cost will not cross its limit.
6. Acknowledgement We would like to thank our supervisor Mr. Sadar Asif Khan for providing great support and giving us a platform to
explore ourselves. We would specially thank to University of Windsor, Engineering department for supporting our
idea in a timely manner.
7. Reference
Jesús Salinas-Coronado, Lean Manufacturing in Production Process in the Automotive Industry, Mexico, 2014.
C. Gay, " 8 wastes of lean manufacturing," 25 January 2016. [Online]. Available:
https://www.machinemetrics.com/blog/2016/1/24/8-wastes-of-lean-manufacturing.
A. F. G. B. G. Şenim Özgürler, "DESIGNING A SIMPLE U-SHAPED PRODUCTION LINE AND ANALYSIS
OF EFFECTIVENESS," in 14th International Research/Expert Conference , 2010.
R. K. p. M. C. S. Dr.V.Anbumalar, "Implementation of Cellular Manufacturing in Process Industry- A Case
Study," International Journal of Innovative Research in Science, Engineering and Technology, vol. 3, no. 3, pp.
1144-1149, 2014.
664
Proceedings of the International Conference on Industrial Engineering and Operations Management
Toronto, Canada, October 23-25, 2019
© IEOM Society International
Biographies
Sriram Srinivasan is an Industrial Engineering Graduate student at University of Windsor. He earned his Bachelors
of Engineering Degree in Mechanical Engineering from Velammal College of Engineering and Technology, India.
He has got two patents in his core field. One patent is for his project “Arduous Therapist” which provides passive
exercise to the hands, fingers and wrists of stroke patients. Designing the work and design calculations for these
mechanisms won him the promising innovator of the year award which was presented at ‘i3’ national fair in the year
2016. He also fabricated and patented a real time machine titled “Semi-Automatic Flower Knotting Device” with
Arduino and Mechanical Core Mechanisms. Programming the Arduino and assembling the device led him to secure
the Gandhian Young Technological Innovation (GYTI) Award at Rashtrapati Bhavan, New Delhi. His research
interests include manufacturing, optimization, reliability, scheduling, manufacturing, and lean. He worked as a Junior
Operational Engineer at Thissan Industries, Chennai, where he taken care of machine utilization and downtime. He
performed the sampling quality checks of incoming and outgoing materials. He supported his operational manager
with the development of risk assessments, Failure Mode Effect Analysis (FMEA) and Quality procedures.
Harita Zikre is a graduate student in a mechanical department at University of Windsor. She specialized her study
not only in Finite element analysis, multi-body dynamics but also in lean manufacturing and material science too. She
completed her bachelors of technology from Navrachana University in mechanical field with particularized in
tribology, vibration engineering, composite manufacturing, machine design and manufacturing technologies. She had
fabrication experience in TATA MOTORS, BANCO Industries and also in BOMBARDIER TRANSPORTATION
with continuous improvement department. She published experimental research related to material science specifically
in composite at one of the well-known journals. The paper briefly explained the comparison of homemade and natural
fiber with respect to mechanical strength. She designed non-conventional wind turbine during her bachelor studies
project. Later on, she proposed manufacturing assembly line for the turbine production in one of the companies by
using lean tools for instance Value stream mapping (VSM), 5S and Kizen.
665