Embed Size (px)
Citation preview

Prevention of Perioperative Surgical Infections
Michael A. West, MD, PhD, FACSDepartment of Surgery
University California San FranciscoSan Francisco, CA, USA
Michael A. West, MD, PhD, FACSDepartment of Surgery
University California San FranciscoSan Francisco, CA, USA

Surgical Site Infections (SSI)2-5% of operated patients will develop SSI
40 million operations annually in the U.S.
⇒ 800,000 – 2,000,000 SSI’s annually in U.S.!!SSI increases LOS in hospital
average 7.5 days
Excess cost per SSI:*$5,739-51,191 (adjusted to 2009 USD)US national costs: $250 million – $1.7 billion/year
*Jarvis, Infect Control HospEpidemiol. 1996;17.

Opportunity to Prevent Surgical Infections
An estimated 40-60% of SSIs are preventable
Overuse, underuse, improper timing, and misuse of antibiotics occurs in 25-50% of operations
Risk Factors for Risk Factors for InfectionInfection

Wound ClassificationI. Clean: uninfected, no inflammation, no mucosal
surface transected: Mastectomy, Thyroidectomy
II. Clean/Contaminated: mucosal-lined lumen entered in controlled conditions. Cholecystectomy, Colectomy, Whipple, Laryngectomy, Urologic procedures.
III. Contaminated: Open accidental wounds, break in sterile conditions, spillage, stomas. Appendicitis, Diverticulitis, Small bowel GSW.
IV. Dirty/ Infected*: Infection, perforation, devitalized tissue. Abscess, Peritonitis, Enteric fistulas, Remove infected implant.
<2%
5-15%
15-30%
> 30%
Risk of SSI
Nichols RL - Amer J Surg 1996; 172: 68-74
* Dirty wounds ≈
infection - antibiotics indicated as therapy
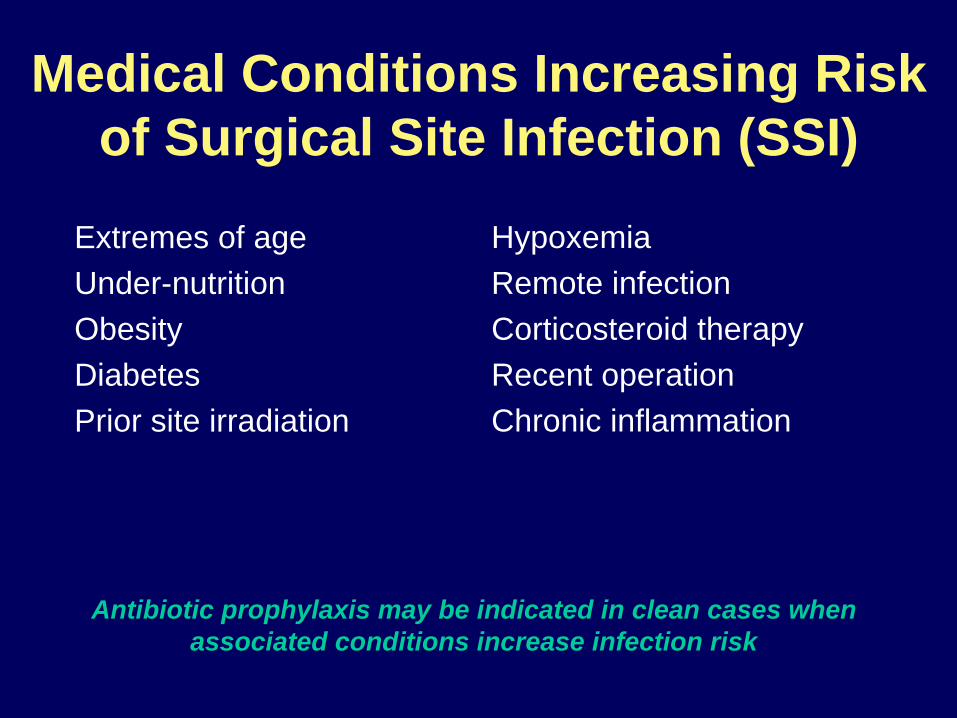
Medical Conditions Increasing Risk of Surgical Site Infection (SSI)
Extremes of ageUnder-nutritionObesityDiabetesPrior site irradiation
HypoxemiaRemote infectionCorticosteroid therapyRecent operationChronic inflammation
Antibiotic prophylaxis may be indicated in clean cases when associated conditions increase infection risk

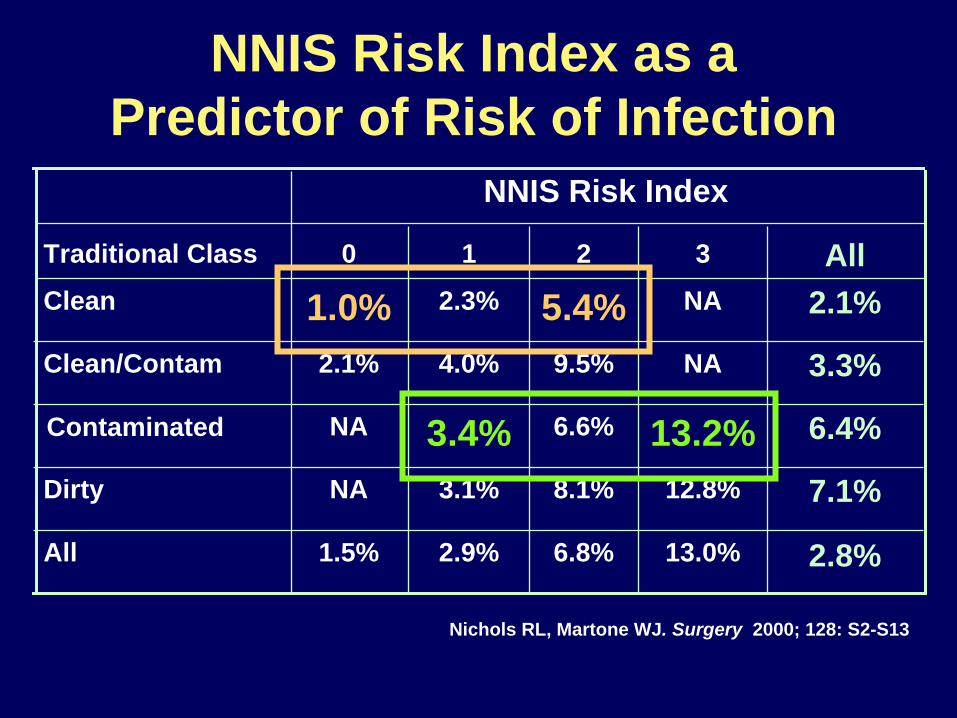
NNIS Risk Index as a Predictor of Risk of Infection
2.8%13.0%6.8%2.9%1.5%All
7.1%12.8%8.1%3.1%NADirty
6.4%13.2%6.6%3.4%NAContaminated
3.3%NA9.5%4.0%2.1%Clean/Contam
2.1%NA5.4%2.3%1.0%CleanAll3210Traditional Class
NNIS Risk Index
Nichols RL, Martone WJ. Surgery 2000; 128: S2-S13
13.2%
5.4%
6.4%
NNIS Risk Index as a Predictor of Risk of Infection
2.8%13.0%6.8%2.9%1.5%All
7.1%12.8%8.1%3.1%NADirty
6.6%3.4%NAContaminated
3.3%NA9.5%4.0%2.1%Clean/Contam
2.1%NA2.3%1.0%CleanAll3210Traditional Class
NNIS Risk Index
Nichols RL, Martone WJ. Surgery 2000; 128: S2-S13

Preventing Preventing InfectionInfection

New(er) Developments in SSIAttention to problemNew surgical techniques.Better systems for administration of
prophylactic antibioticsDuration of antibioticsRecognition of environmental factors that
aggravate SSITechnical factors in wound management

Mechanisms to Prevent SSIMinimize (or eliminate) bacteria in wound at
time of surgery. - skin decontamination - excellent surgical technique - peri-operative prophylactic antibiotics
Maximize delivery (and effectiveness) of host defenses. - pre-op nutritional state. - adequate oxygentation. - excellent perfusion of wound.

Influence of Shaving on SSINo Hair
Group Removal Depilatory Shaved
Number 155 153 246
Infection rate 0.6% 0.6% 5.6%
Seropian. Am J Surg 1971; 121: 251
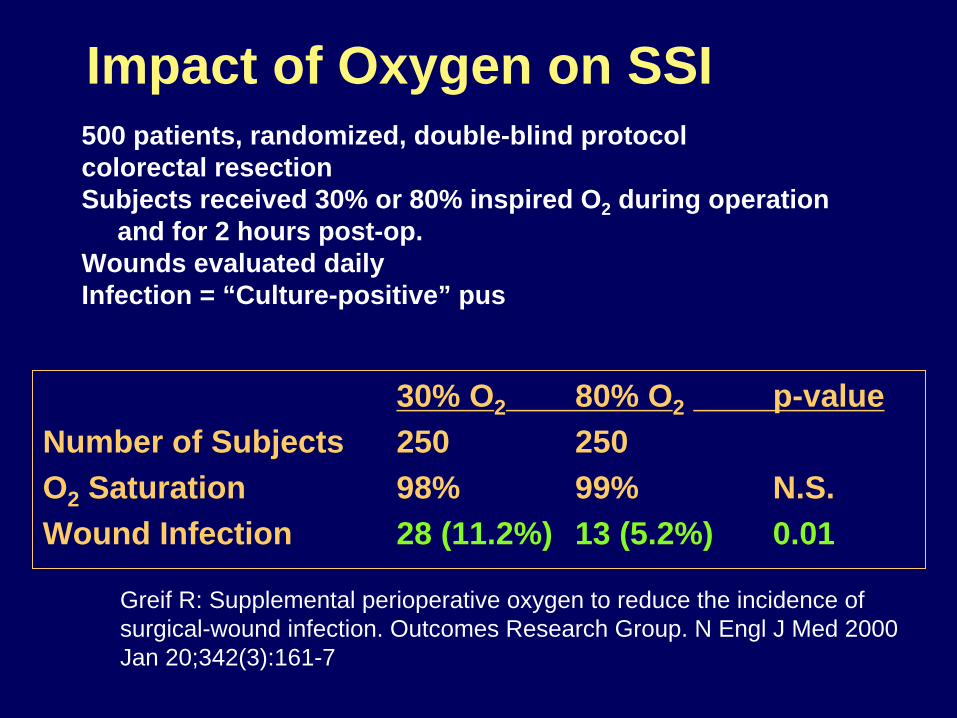
Greif R: Supplemental perioperative oxygen to reduce the incidence of surgical-wound infection. Outcomes Research Group. N Engl J Med 2000 Jan 20;342(3):161-7
500 patients, randomized, double-blind protocolcolorectal resectionSubjects received 30% or 80% inspired O2 during operation
and for 2 hours post-op.Wounds evaluated dailyInfection = “Culture-positive” pus
Impact of Oxygen on SSI
30% O2 80% O2 p-valueNumber of Subjects 250 250 O2 Saturation 98% 99% N.S.Wound Infection 28 (11.2%) 13 (5.2%) 0.01

Hypothermia MechanismsImpaired wound perfusion (thermoregulatory vasospasm) Decreased oxygen levels in wound
-impaired collagen synthesis Impaired immune function Decreased delivery of PMNs

Perioperative Normothermia
SSI: 6% normothermia vs. 19% hypothermia
Kurz et al, N Engl J Med 1996
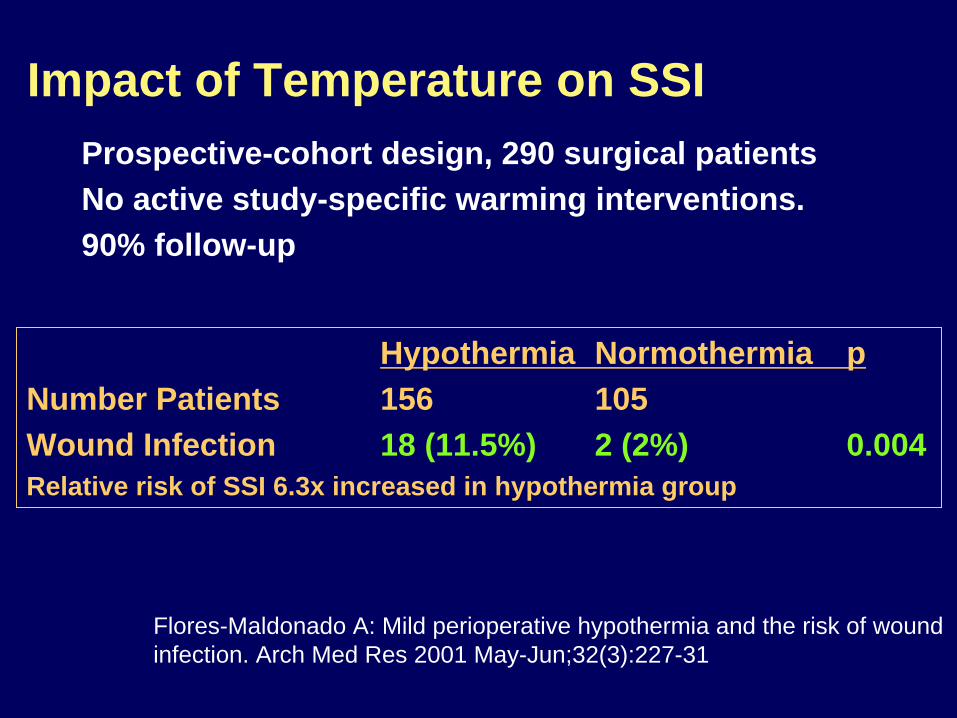
Flores-Maldonado A: Mild perioperative hypothermia and the risk of wound infection. Arch Med Res 2001 May-Jun;32(3):227-31
Prospective-cohort design, 290 surgical patientsNo active study-specific warming interventions.90% follow-up
Impact of Temperature on SSI
Hypothermia Normothermia pNumber Patients 156 105Wound Infection 18 (11.5%) 2 (2%) 0.004Relative risk of SSI 6.3x increased in hypothermia group
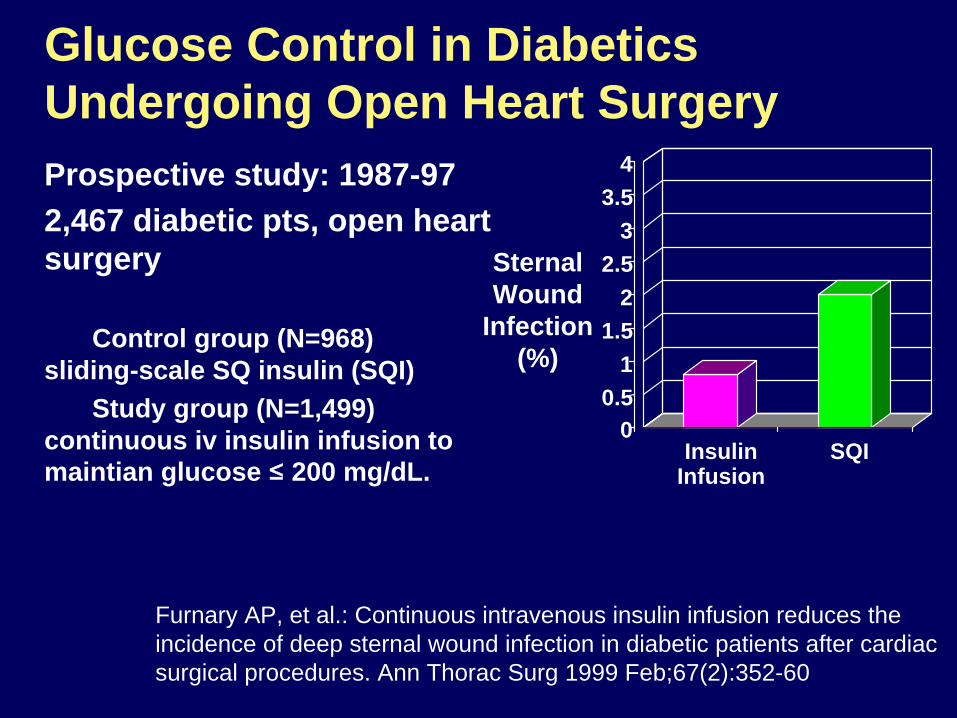
Prospective study: 1987-97 2,467 diabetic pts, open heart surgery
Control group (N=968) sliding-scale SQ insulin (SQI)
Study group (N=1,499) continuous iv insulin infusion to maintian glucose ≤
200 mg/dL. 0
0.51
1.52
2.53
3.54
SQIInsulinInfusion
Sternal Wound
Infection (%)
Furnary AP, et al.: Continuous intravenous insulin infusion reduces the incidence of deep sternal wound infection in diabetic patients after cardiac surgical procedures. Ann Thorac Surg 1999 Feb;67(2):352-60
Glucose Control in Diabetics Undergoing Open Heart Surgery
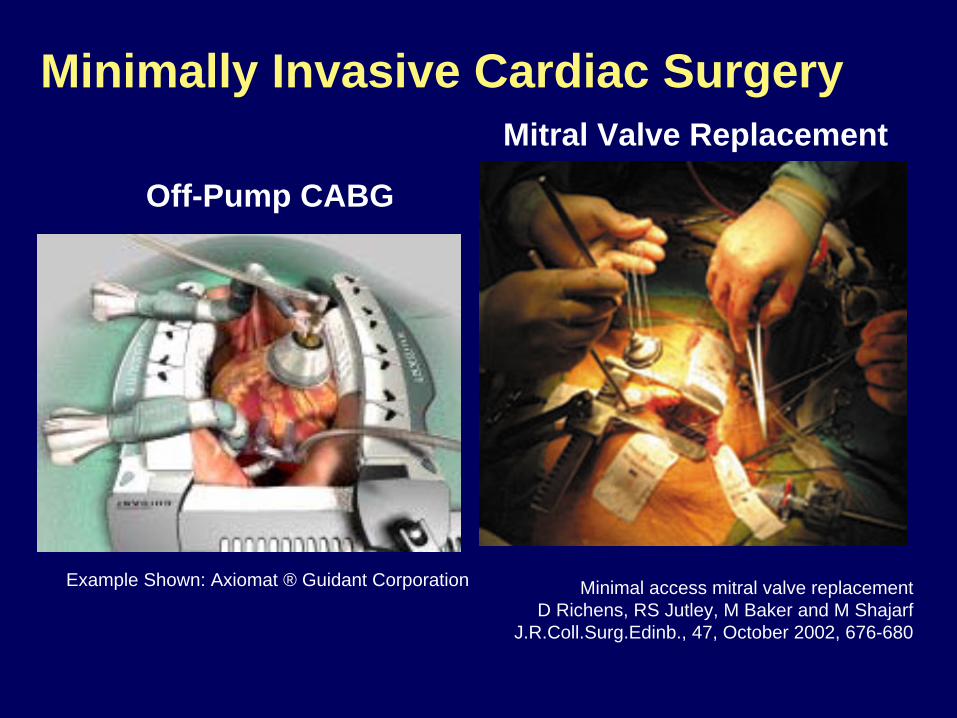
Example Shown: Axiomat ® Guidant Corporation
Minimally Invasive Cardiac Surgery
Minimal access mitral valve replacement D Richens, RS Jutley, M Baker and M Shajarf
J.R.Coll.Surg.Edinb., 47, October 2002, 676-680
Off-Pump CABG
Mitral Valve Replacement

Example Shown: Vasoview 5® Guidant Corporation
Minimally Invasive Surgery Technique for Saphenous Vein Harvest

Crouch JD : Open versus endoscopic saphenous vein harvesting: wound complications and veinquality. Ann Thorac Surg 1999 Oct;68(4):1513-6
568 patients, Non-randomized.Risk factors for wound complication
Open harvesting (p< or =0.001) Diabetes (p< or =0.001) Obesity (p< or =0.02)
Histologic evaluation no difference between the groups
Minimally Invasive Vein Harvest
Open Endoscopic p-valueNumber Patients 388 180Wound Complications 14.2% 5% 0.001
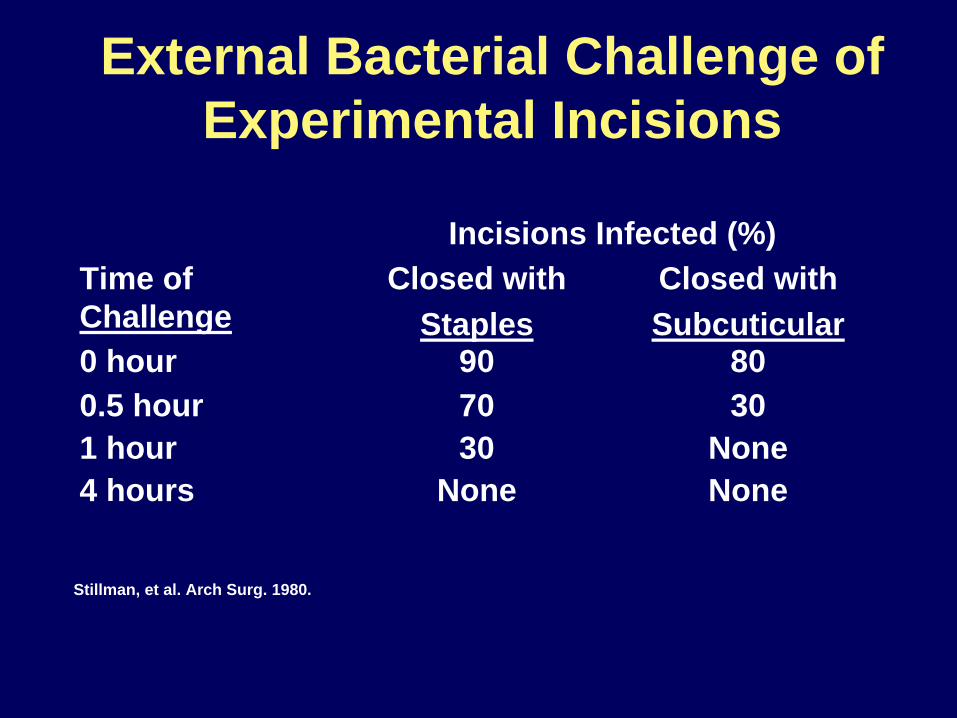
External Bacterial Challenge of Experimental Incisions
NoneNone4 hoursNone301 hour
30700.5 hour80900 hour
Closed withSubcuticular
Closed withStaples
Time of Challenge
Incisions Infected (%)
Stillman, et al. Arch Surg. 1980.

Dellinger EP: Ch 7, Surgical Infections, in, Mulholland et al: Greenfield’s Surgery: Scientific Principles and Practice, 4e. Lippincott, Williams & Wilkins, 2005.
Impact of Prophylactic Antibiotics on SSI Rates

Relation Between Antibiotic Timing and Surgical Wound Rate
0%
1%
2%
3%
4%
5%
6%
>2 2 1 1 2 3 4 5 6 7 8 9 10 >10
Infe
ctio
n R
ate
(%)
Hours before
Incision Hours after incision
Classen DC, et al. NEJM 1992;326:281-285
Operation
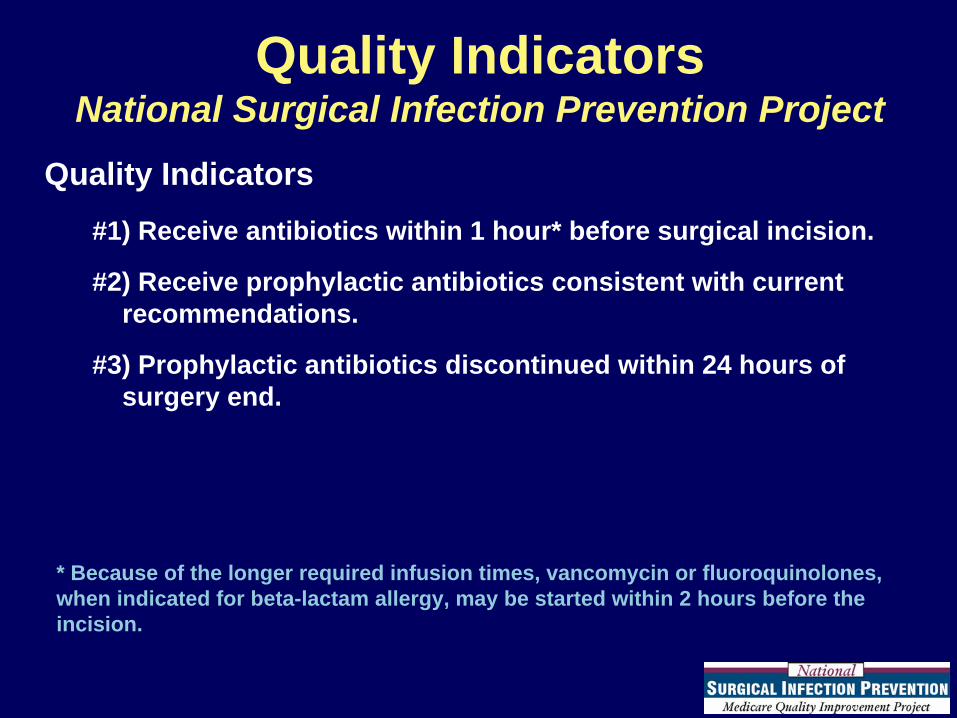
Quality Indicators National Surgical Infection Prevention Project
Quality Indicators#1) Receive antibiotics within 1 hour* before surgical incision.
#2) Receive prophylactic antibiotics consistent with current recommendations.
#3) Prophylactic antibiotics discontinued within 24 hours of surgery end.
* Because of the longer required infusion times, vancomycin or fluoroquinolones, when indicated for beta-lactam allergy, may be started within 2 hours before the incision.
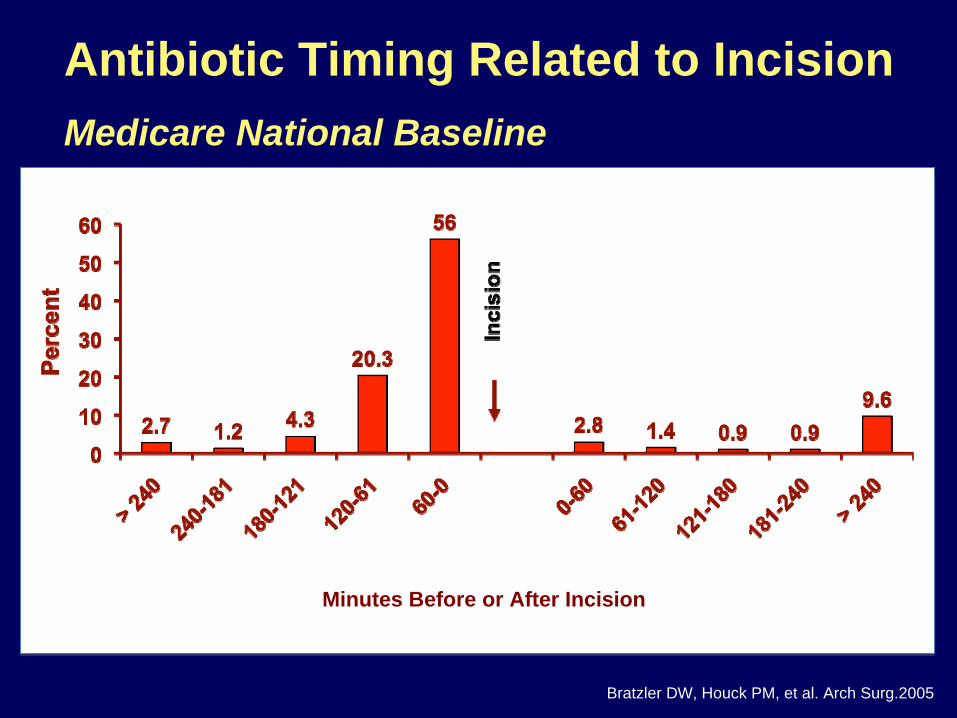
Minutes Before or After Incision
Antibiotic Timing Related to IncisionMedicare National Baseline
Bratzler DW, Houck PM, et al. Arch Surg.2005

26.2
10
22.6
6.2 6.32.2 2.7
9.314.5
40.7
50.7
73.379.5
85.8 88 90.7
0
20
40
60
80
100
12 or le
ss
>12-2
4
>24-3
6
>36-4
8
>48-6
0
>60-7
2
>72-8
4
>84-9
6
> 96
Hours After Surgery End Time
Perc
ent
0
20
40
60
80
100
Cum
ulat
ive
Perc
ent
Discontinuation of Antibiotics
Patients were excluded from the denominator of this performance measure if there was any documentation of an infection during surgery or in the first 48 hours after surgery.
Bratzler DW, Houck PM, et al. Arch Surg.2005

* Based on medical record abstraction from the charts of patients discharged in the 2nd quarter of 2004. Benchmark rates were calculated for all hospitals in the US based on discharges during April 2003-March 2004 using the Achievable Benchmarks of CareTM methodology (http://main.uab.edu/show.asp?durki=14527).
Surgical Infection Prevention National Baseline Performance
64.3
91
47.6
91.999.1
85.7
0
20
40
60
80
100
Antibiotics w/in 1 hour Correct Antibiotic Antibiotic DC’d in 24 hr
Perc
ent
National Ave.* National Benchmark

Prevention of Surgical Site Infection (SSI)
Importance of Systems

ORRegistration
PreOpHolding
Outpatient ClinicSurgeon Office
Operating Room
Post AnesthesiaRecovery (PAR)
AmbulatorySurgery Room
InpatientHospitaliztion
0630 0730 0900 1030 1400-1 to 30Days
+7-30Days
Outpatient ClinicSurgeon Office

Factors the Surgeon “Controls”What operation is done.
- conduct of operation.When the surgery takes place.
- elective vs. emergent. - adequacy of rescucitation. - monitoring employed.
Antibiotic administration. - choice of agent. - timing of administration. - intra-operative re-dosing.
Blood transfusion.

Project overview available at: www.medqic.org/scip
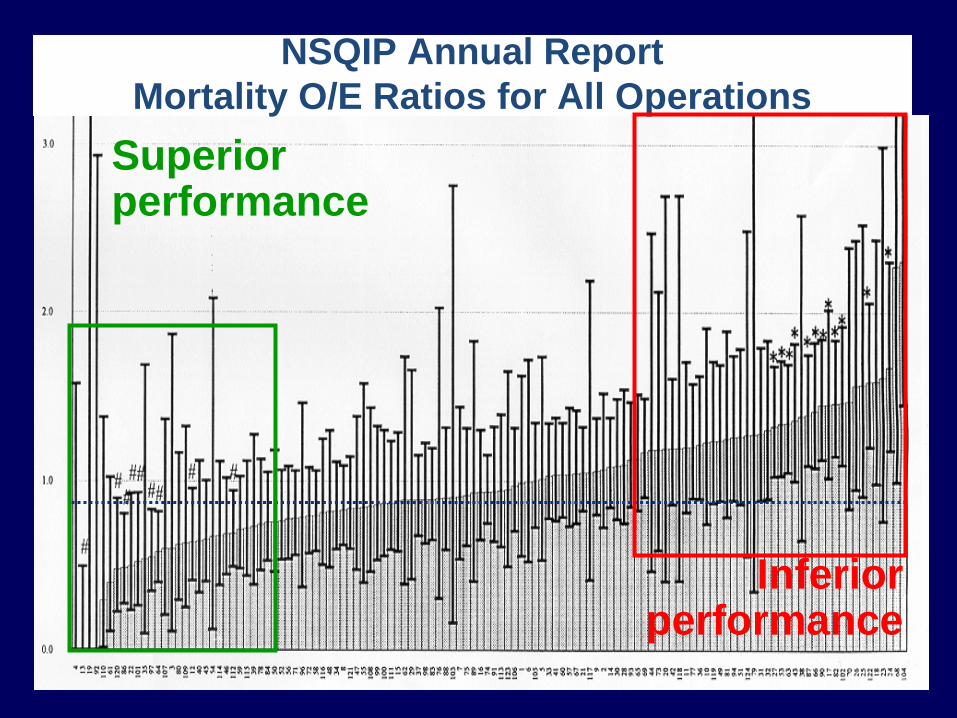
Inferior performance
Superior performance
NSQIP Annual ReportMortality O/E Ratios for All Operations

Surgical Care Improvement Project (SCIP)
Preventable Complication ModulesSurgical infection preventionCardiovascular complication preventionVenous thromboembolism preventionRespiratory complication prevention

Surgical Care Improvement Project: Why?
Medicare could prevent* up to:13,027 perioperative deaths271,055 surgical complications
* Major surgical cases
There are substantial opportunities toimprove outcomes from surgery!
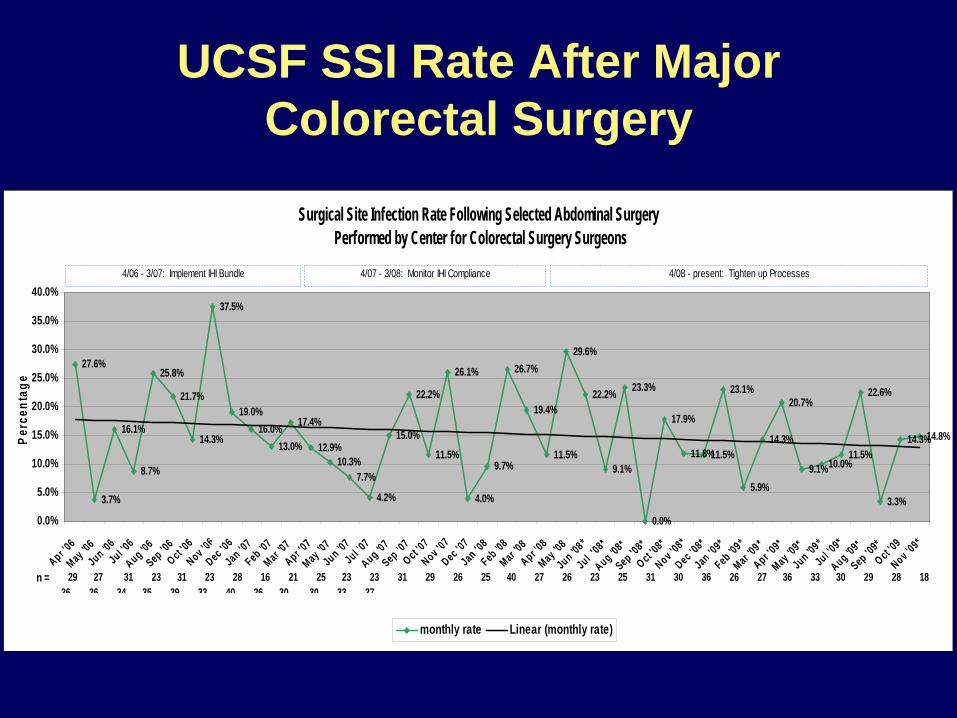
UCSF SSI Rate After Major Colorectal Surgery
Surgical Site Infection Rate Following Selected Abdominal Surgery Performed by Center for Colorectal Surgery Surgeons
27.6%
3.7%
16.1%
8.7%
25.8%
21.7%
14.3%
37.5%
19.0%16.0%
13.0%
17.4%
12.9%10.3%
7.7%
4.2%
15.0%
22.2%
11.5%
26.1%
4.0%
9.7%
26.7%
19.4%
11.5%
29.6%
22.2%
9.1%
23.3%
0.0%
17.9%
11.8%11.5%
23.1%
5.9%
14.3%
20.7%
9.1%10.0%11.5%
22.6%
3.3%
14.3%14.8%
0.0%
5.0%
10.0%
15.0%
20.0%
25.0%
30.0%
35.0%
40.0%
Apr '06
May '06Jun '06Jul '0
6Aug '06Sep '06Oct '0
6Nov '06Dec '06Jan '07Feb '07Mar '0
7Apr '0
7May '07Jun '07Jul '0
7Aug '07Sep '07Oct '0
7Nov '07Dec '07Jan '08Feb '08Mar '0
8Apr '0
8May '08Jun '08 *Jul '0
8*Aug '08*Sep '08*Oct '0
8*Nov '08*Dec '08*Jan '09*Feb '09 *Mar '0
9 *Apr '0
9*May '09*Jun '09 *
Jul '09*
Aug '09*Sep '09*
Oct '09
Nov '09*Pe
rcen
tage
monthly rate Linear (monthly rate)
4/06 - 3/07: Implement IHI Bundle 4/07 - 3/08: Monitor IHI Compliance
29 27 31 23 31 23 28 16 21 25 23 23 31 29 26 25 40 27 26 23 25 31 30 36 26 27 36 33 30 29 28 18 26 26 34 35 29 33 40 26 30 30 33 27
n =
4/08 - present: Tighten up Processes
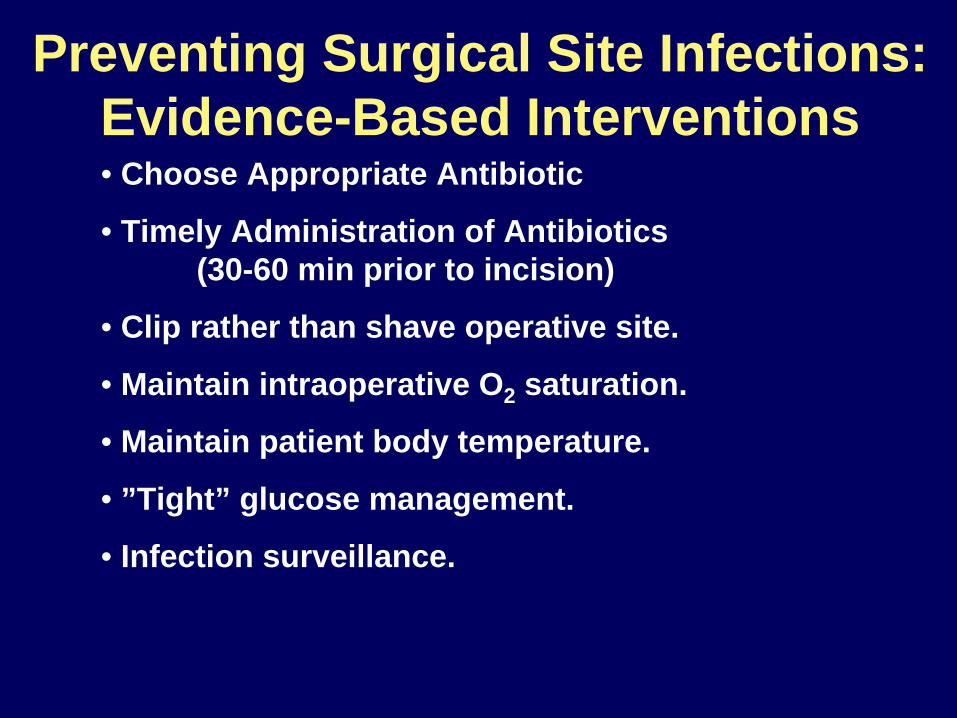
Preventing Surgical Site Infections: Evidence-Based Interventions • Choose Appropriate Antibiotic
• Timely Administration of Antibiotics (30-60 min prior to incision)
• Clip rather than shave operative site.
• Maintain intraoperative O2 saturation.
• Maintain patient body temperature.
• ”Tight” glucose management.
• Infection surveillance.

The EndThe End