Embed Size (px)
Citation preview
Preparing the Annual Report: for the Fiscal Year
Spring
Conducted by Nick Chapman [email protected]
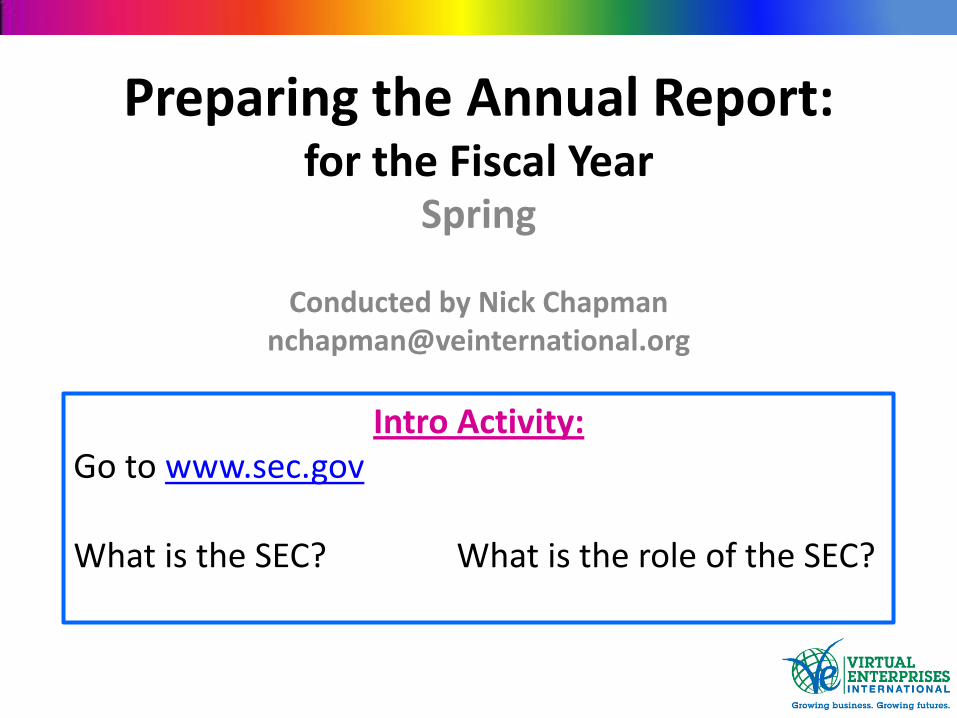
Intro Activity: Go to www.sec.gov What is the SEC? What is the role of the SEC?

Documents we will be referencing:
1. Annual Report – Guidelines & Rubric
2. Annual Reports from real world companies
3. Firm Financial Data Form
4. VE Financial Statement Templates
– Income Statement
– Balance Sheet
– Cash Budget
www.veinternational.org/resources Reference Files

What is the SEC? • History
– Created after the stock market crash of 1929 – Congress passed the Securities Act of 1933
• This law, together with the Securities Exchange Act of 1934, created the Securities and Exchange Commission
– To restore investor confidence in capital markets by providing investors and the markets with more reliable information and clear rules of honest dealing
– Sarbanes-Oxley Act of 2002, implemented some of the most far reaching reforms of American business practices since the time of Franklin Delano Roosevelt
• Role of the SEC – The mission of the U.S. Securities and Exchange Commission is to protect investors, maintain
fair, orderly, and efficient markets, and facilitate capital formation. – Companies publicly offering securities for investment dollars must tell the public the truth
about their businesses, the securities they are selling, and the risks involved in investing. – People who sell and trade securities – brokers, dealers, and exchanges – must treat investors
fairly and honestly, putting investors' interests first.
• The 10K report – Mandated annual report made available to all holders of the firm’s securities (i.e. stockholders). – A comprehensive overview of the company's business and financial condition and includes
audited financial statements.

Goals of Sarbanes-Oxley Act of 2002 • A reaction to huge corporate finance scandals
– i.e. the bankruptcies of Enron, WorldCom, and Tyco
• Raised financial standards in three main areas: – Corporate governance, securities analysis, and the
performance of audit work
• To ensure that company directors and officers are aware of and accountable for the financial condition of the company – The CEO and CFO must certify in writing that the
company's financials comply with the law and accurately represent the company's condition.
• The board of directors of most public companies must have an audit committee – In NYC, the Board of Directors (i.e. VE Central) uses and
overseas the VE firm ASAP as auditors

What is an Annual Report? • A report to shareholders
• A summary of firm operations
• Presentation of Financial Statements
• Based on the Fiscal Year (In VE: May 1st to April 30th)
Basic contents of the Annual Report: •Letter to Shareholders •Financial Highlights •Management Discussion (summary of operations) •Financial Statements •Corporate Message
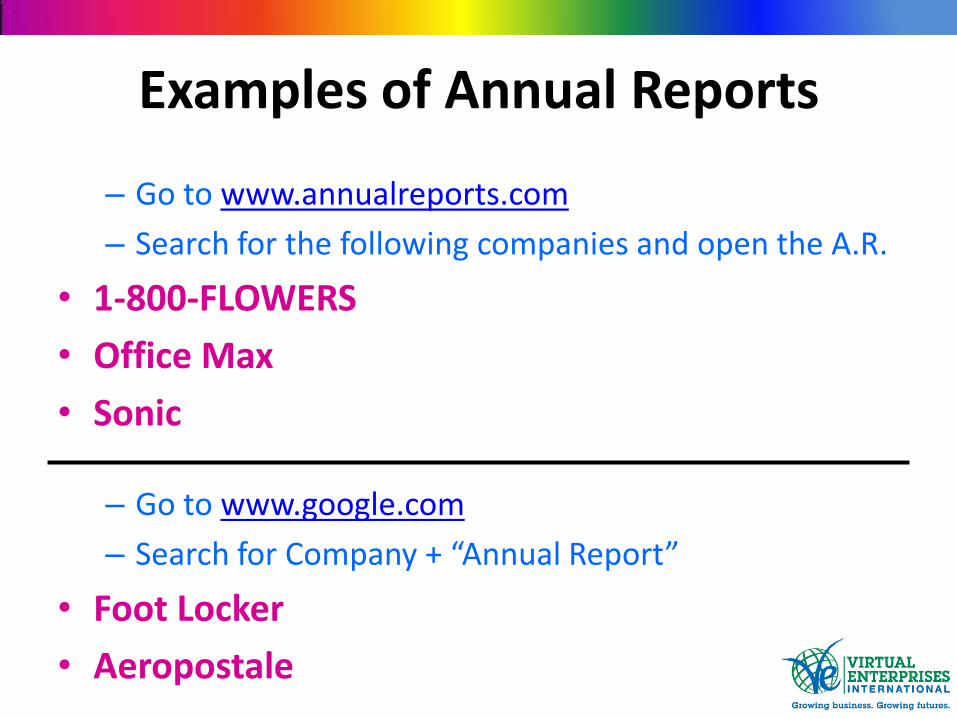
Examples of Annual Reports
– Go to www.annualreports.com
– Search for the following companies and open the A.R.
• 1-800-FLOWERS
• Office Max
• Sonic
– Go to www.google.com
– Search for Company + “Annual Report”
• Foot Locker
• Aeropostale

Examples of Annual Reports
• What is their story?
• What is their corporate message?
• What were the highlights of the fiscal year?
• What areas do they identify for development?

Annual Report Requirements for VE Firms
• Review document:
– Annual Report – Guidelines & Rubric
1. Introductory Components
2. Letter to Stockholders
3. Board of Directors and Management
4. Corporate Message
5. Financial Highlights
6. Financial Statements and Footnotes
7. Management Discussion and Analysis
8. Supporting Documentation
Developing your firm’s Annual Report
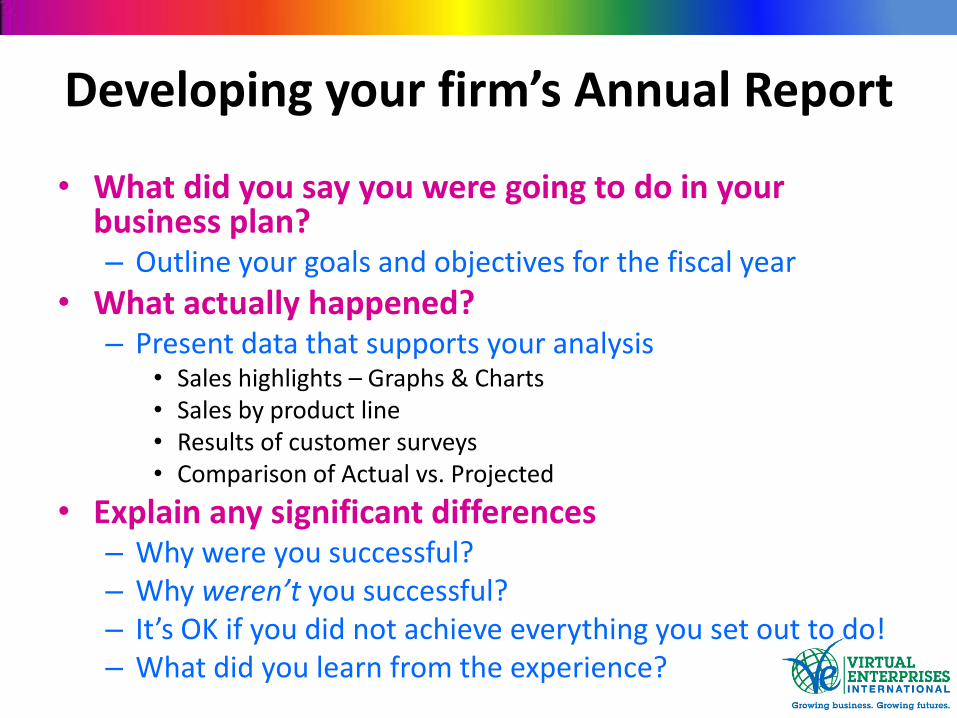
• What did you say you were going to do in your business plan? – Outline your goals and objectives for the fiscal year
• What actually happened? – Present data that supports your analysis
• Sales highlights – Graphs & Charts • Sales by product line • Results of customer surveys • Comparison of Actual vs. Projected
• Explain any significant differences – Why were you successful? – Why weren’t you successful? – It’s OK if you did not achieve everything you set out to do! – What did you learn from the experience?

Year End Reporting Requirements
• Firm Financial Data Form:
– Income Statement, AKA “Statement of Earnings”
– Balance Sheet, AKA “ Statement of Financial Position”
– Cash Budget, AKA “Statement of Cash Flows”
• Corporate Tax Return, Form 1120
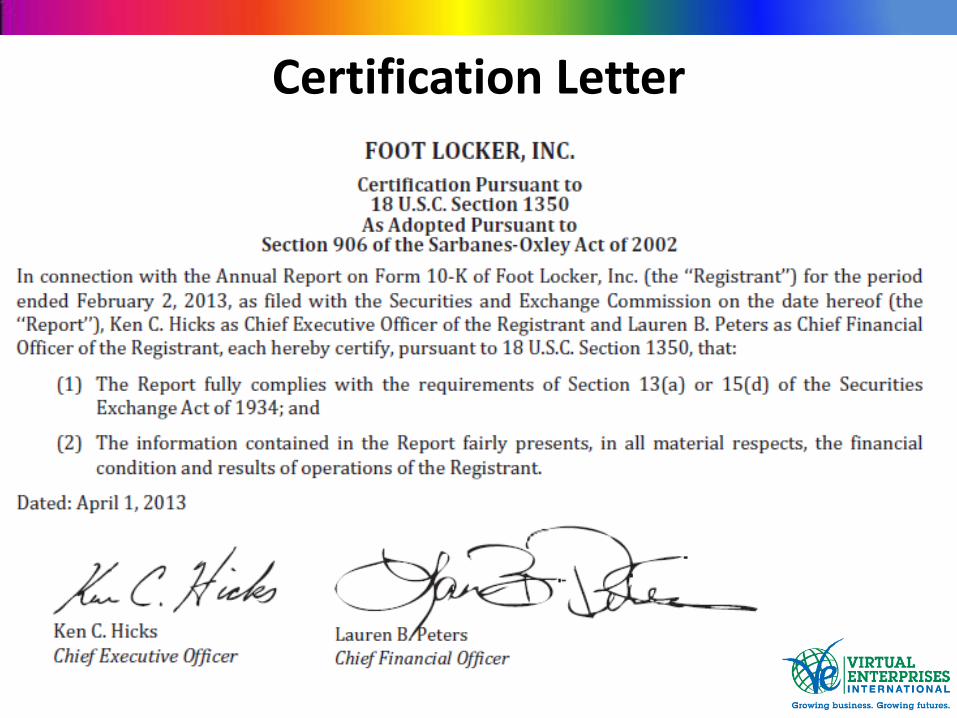
Certification Letter

Firm Financial Data Form
• Income Statement, AKA “Statement of Earnings” Revenue – Expenses = Profit (or loss)
• Balance Sheet, AKA “ Statement of Financial Position” A snapshot of your finances (think Instagram!)
Assets: Cash in the bank, office equipment, accounts receivable
Liabilities: What you owe to others (loans, bills, payroll, etc)
Shareholder’s Equity: The amount of investment and retained earnings
• Cash Budget, AKA “Statement of Cash Flows” Cash Receipts and Cash Payments
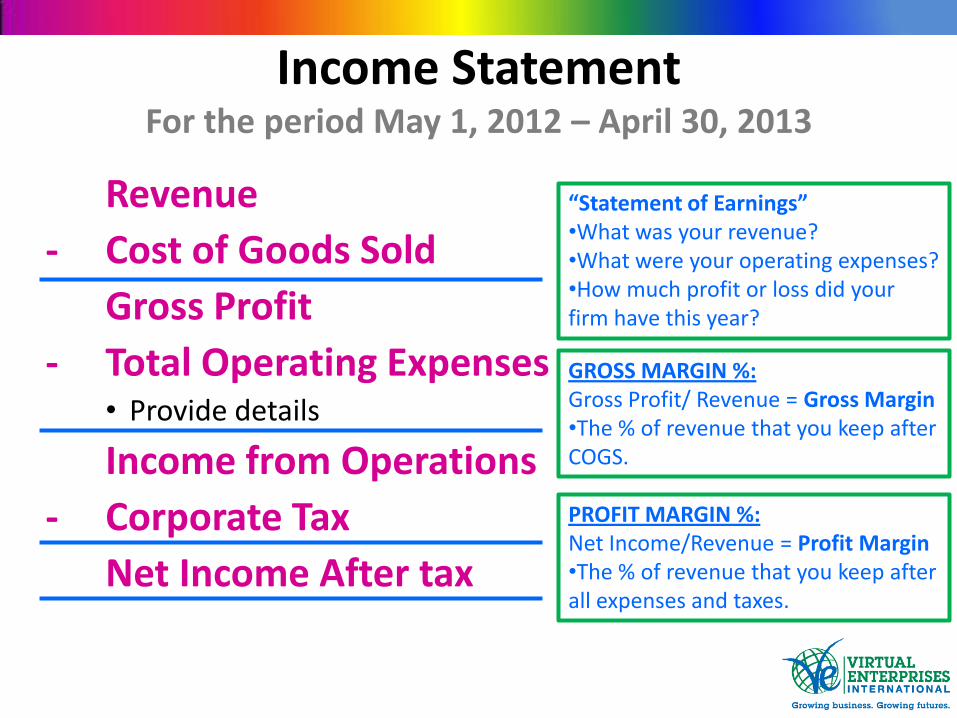
Income Statement For the period May 1, 2012 – April 30, 2013
Revenue
- Cost of Goods Sold
Gross Profit
- Total Operating Expenses • Provide details
Income from Operations
- Corporate Tax
Net Income After tax
“Statement of Earnings” •What was your revenue? •What were your operating expenses? •How much profit or loss did your firm have this year?
GROSS MARGIN %: Gross Profit/ Revenue = Gross Margin •The % of revenue that you keep after COGS.
PROFIT MARGIN %: Net Income/Revenue = Profit Margin •The % of revenue that you keep after all expenses and taxes.

Income Statement Company A Company B
Revenue $300,000 $300,000
COGS $150,000 $200,000
Gross Profit $150,000 $100,000
Gross Margin % 50% 33%
Operating Expenses $120,000 $40,000
Net Income $30,000 $60,000
Net Profit Margin % 10% 20%

Balance Sheet: Assets = Liabilities + Equity
What you owe other people
“Statement of Financial Position” •How much money do you have? •What do you owe other people? •What is the value of your company? •Think of it like taking a picture of your company’s current financial situation.

Source: http://world.time.com/timelapse/
Las Vegas in 1984
Las Vegas in 2012
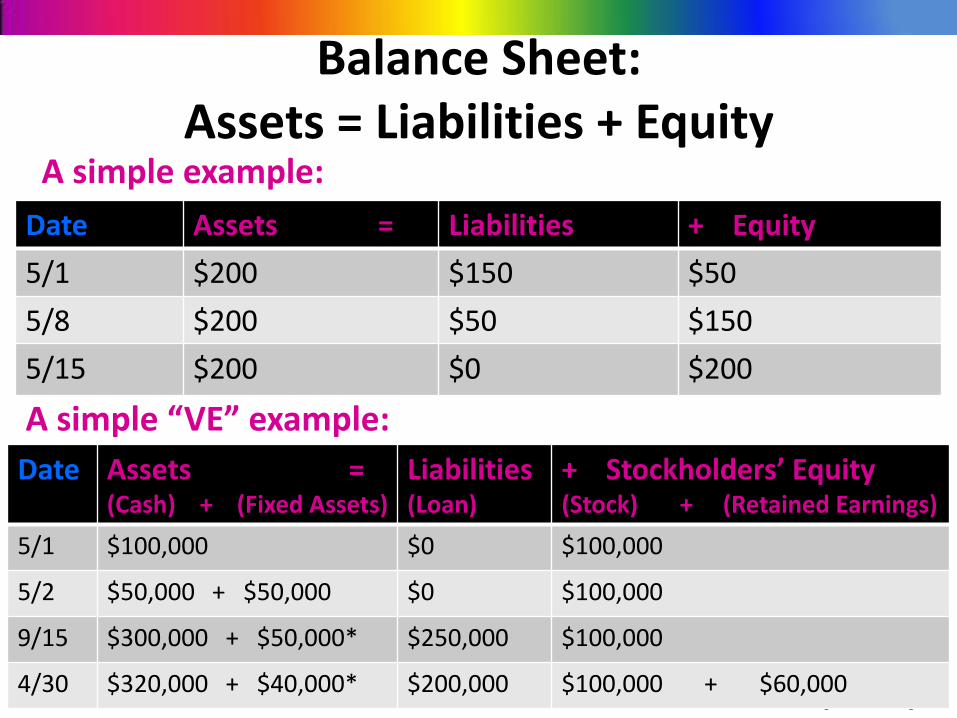
Balance Sheet: Assets = Liabilities + Equity
Date Assets = Liabilities + Equity
5/1 $200 $150 $50
5/8 $200 $50 $150
5/15 $200 $0 $200
A simple example:
A simple “VE” example:
Date Assets = (Cash) + (Fixed Assets)
Liabilities (Loan)
+ Stockholders’ Equity (Stock) + (Retained Earnings)
5/1 $100,000 $0 $100,000
5/2 $50,000 + $50,000 $0 $100,000
9/15 $300,000 + $50,000* $250,000 $100,000
4/30 $320,000 + $40,000* $200,000 $100,000 + $60,000

Balance Sheet: Assets = Liabilities + Equity
As of 4/30/13
Assets Current Assets
• Cash in the Bank
• Account Receivable
• Inventory & Supplies
Fixed Assets • Computers/Office Equipment/Furniture
• Less: Accumulated Depreciation
Current Assets + Fixed Assets = TOTAL ASSETS

Balance Sheet (cont.) Assets = Liabilities + Equity
As of 4/30/13
Liabilities Current Liabilities (anything due within the next 12 mos.)
• Accts Payable: Salaries, Payroll Tax, Sales Tax, Corporate Tax
• Loan payments due over the next 12 months
Non Current Liabilities • Loan Payable (from 5/1/14 through the end of loan repayment)
Stockholders’ Equity Common Stock
Additional Investment (paid-in capital)
Retained Earnings – Amount of net income retained by the firm over its existence

Cash Budget For the period May 1, 2012 – April 30, 2013
Opening Cash Balance
+ Cash Receipts • Provide details
- Cash Payments • Provide details
Ending Cash Balance
“Statement of Cash Flows” •When & where did your cash come from? •When & to whom did you pay cash? •What was your opening and ending balance?

Ratio Analysis
• Current Ratio = Current Assets / Current Liabilities
• Quick Ratio = (Current Assets – Inventories) / Current Liabilities
• Debt to Asset Ratio = Total Liabilities / Total Assets
• Gross Profit Margin = Gross Profit / Revenue
• Net Profit Margin = Net Profit / Revenue

To Recap:
1. What did you say you were going to do in your business plan?
2. What actually happened?
3. Explain any significant differences
– Why were you successful?
– Why weren’t you successful?
– What did you learn from the experience?
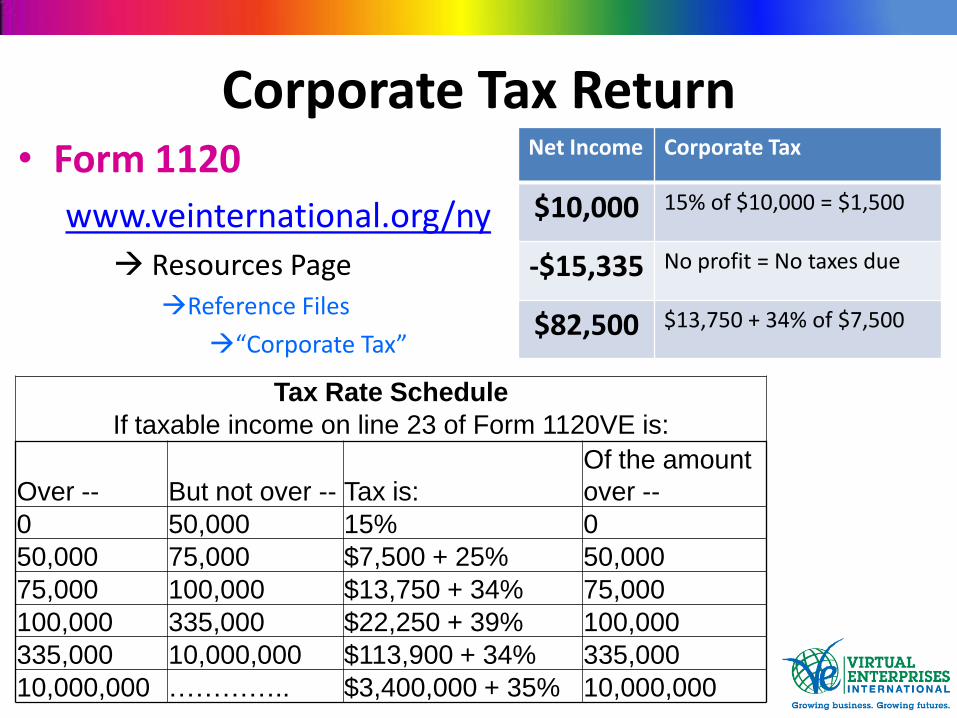
Corporate Tax Return • Form 1120
www.veinternational.org/ny
Resources Page Reference Files
“Corporate Tax”
Tax Rate Schedule
If taxable income on line 23 of Form 1120VE is:
Over -- But not over -- Tax is:
Of the amount
over --
0 50,000 15% 0
50,000 75,000 $7,500 + 25% 50,000
75,000 100,000 $13,750 + 34% 75,000
100,000 335,000 $22,250 + 39% 100,000
335,000 10,000,000 $113,900 + 34% 335,000
10,000,000 ………….. $3,400,000 + 35% 10,000,000
Net Income Corporate Tax
$10,000 15% of $10,000 = $1,500
-$15,335 No profit = No taxes due
$82,500 $13,750 + 34% of $7,500

941 Withholding Tax Form
• Form 941
www.veinternational.org/ny
Resources Page Reference Files
Sales Tax Form
• Sales tax reporting form
www.veinternational.org/ny
Resources Page Reference Files

Deadlines: Firm Financial Data Form submission – Friday, May 17, 2013
– Income Statement • https://docs.google.com/a/veinternational.org/spreadsheet/viewform
?formkey=dFBtTXBaQlpvLTBZdW5zTGQ1WWpPcFE6MA#gid=0
– Balance Sheet • https://docs.google.com/a/veinternational.org/spreadsheet/viewform
?formkey=dExxazdzc2p3UnFuUVhzMmpDSGJ0TWc6MA#gid=0
– Cash Budget • https://docs.google.com/a/veinternational.org/spreadsheet/viewform
?formkey=dDVZSHFOaU5DSEJIbEdKWjdKRmN0R0E6MA#gid=0
• Annual Report (in PDF format) – Tuesday, June 4 2013
• Corporate Tax Form 1120 – Tuesday, June 4, 2013